

Form 10-Q SANDRIDGE ENERGY INC For: Mar 31
 Tweet
Tweet Share
ShareUNITED STATES
SECURITIES AND EXCHANGE COMMISSION
Washington, D.C. 20549
Form | ||
(Mark One)
| QUARTERLY REPORT PURSUANT TO SECTION 13 OR 15(d) OF THE SECURITIES EXCHANGE ACT OF 1934 | |||||
For the quarterly period ended March 31, 2022
OR
TRANSITION REPORT PURSUANT TO SECTION 13 OR 15(d) OF THE SECURITIES EXCHANGE ACT OF 1934 | |||||
For the transition period from to
Commission File Number: 001-33784
| (Exact name of registrant as specified in its charter) | ||||||||
(State or other jurisdiction of incorporation or organization) | (I.R.S. Employer Identification No.) | |||||||
(Address of principal executive offices) | (Zip Code) | |||||||
Registrant’s telephone number, including area code: (405 ) 429-5500
Former name, former address and former fiscal year, if changed since last report: Not applicable
Securities registered pursuant to Section 12(b) of the Act:
| Title of each class | Trading Symbol | Name of each exchange on which registered | ||||||||||||
Indicate by check mark whether the registrant (1) has filed all reports required to be filed by Section 13 or 15 (d) of the Securities Exchange Act of 1934 during the preceding 12 months (or for such shorter period that the registrant was required to file such reports), and (2) has been subject to such filing requirements for the past 90 days. Yes þ No o
Indicate by check mark whether the registrant has submitted electronically every Interactive Data File required to be submitted pursuant to Rule 405 of Regulation S-T during the preceding 12 months (or for such shorter period that the registrant was required to submit such files). Yes ☑ No ☐
Indicate by check mark whether the registrant is a large accelerated filer, an accelerated filer, a non-accelerated filer, a smaller reporting company, or an emerging growth company. See the definitions of “large accelerated filer,” “accelerated filer,” “smaller reporting company,” and “emerging growth company” in Rule 12b-2 of the Exchange Act.
| Large accelerated filer | ☐ | ☑ | ||||||||||||
| Non-accelerated filer | ☐ | Smaller reporting company | ||||||||||||
| Emerging growth company | ||||||||||||||
If an emerging growth company, indicate by check mark if the registrant has elected not to use the extended transition period for complying with any new or revised financial accounting standards provided pursuant to Section 13(a) of the Exchange Act. o
Indicate by check mark whether the registrant is a shell company (as defined in Rule 12b-2 of the Exchange Act). Yes ☐ No þ
Indicate by check mark whether the registrant has filed all documents and reports required to be filed by Sections 12, 13, or 15(d) of the Securities Exchange Act of 1934 subsequent to the distribution of securities under a plan confirmed by a court. Yes ☑ No o
The number of shares outstanding of the registrant’s common stock, par value $0.001 per share, as of the close of business on April 29, 2022, was 36,726,056 .
References in this report to the “Company,” “SandRidge,” “we,” “our,” and “us” mean SandRidge Energy, Inc., including its consolidated subsidiaries and its proportionately consolidated share of SandRidge Mississippian Trust I and SandRidge Mississippian Trust II, (collectively, the “Royalty Trusts”).
DISCLOSURES REGARDING FORWARD-LOOKING STATEMENTS
This Quarterly Report on Form 10-Q (“Quarterly Report”) of the Company includes “forward-looking statements” as defined by the SEC. These forward-looking statements may include projections and estimates concerning our capital expenditures, liquidity, capital resources and debt profile, the timing and success of specific projects, the impact of the COVID-19 pandemic, the potential impact of international negotiations on the supply and demand of oil and gas, outcomes and effects of litigation, claims and disputes, elements of our business strategy, compliance with governmental regulation of the oil and natural gas industry, including environmental regulations, acquisitions and divestitures and the potential effects on our financial condition and other statements concerning our operations, financial performance and financial condition.
Forward-looking statements are generally accompanied by words such as “estimate,” “assume,” “target,” “project,” “predict,” “believe,” “expect,” “anticipate,” “potential,” “could,” “may,” “foresee,” “plan,” “goal,” “should,” “intend” or other words that convey the uncertainty of future events or outcomes. These forward-looking statements are based on certain assumptions and analyses based on our experience and perception of historical trends, current conditions and expected future developments as well as other factors we believe are appropriate under the circumstances. Such statements are not guarantees of future performance and actual results or developments may differ materially from those projected. The Company disclaims any obligation to update or revise these forward-looking statements unless required by law, and it cautions readers not to rely on them unduly. While we consider these expectations and assumptions to be reasonable, they are inherently subject to significant business, economic, competitive, regulatory and other risks, contingencies and uncertainties relating to, among other matters, the risks and uncertainties discussed in “Risk Factors” in Item 1A of the Company’s Annual Report on Form 10-K for the fiscal year ended December 31, 2021 (the “2021 Form 10-K”) and in Item 1A of this Quarterly Report.
SANDRIDGE ENERGY, INC. AND SUBSIDIARIES
FORM 10-Q
Quarter Ended March 31, 2022
INDEX
ITEM 1. | ||||||||
ITEM 2. | ||||||||
ITEM 3. | ||||||||
ITEM 4. | ||||||||
ITEM 1. | ||||||||
ITEM 1A. | ||||||||
ITEM 2. | ||||||||
ITEM 3. | ||||||||
| ITEM 4. | ||||||||
| ITEM 5. | ||||||||
ITEM 6. | ||||||||
PART I. Financial Information
ITEM 1. Financial Statements
SANDRIDGE ENERGY, INC. AND SUBSIDIARIES
CONDENSED CONSOLIDATED BALANCE SHEETS (Unaudited)
(In thousands)
| March 31, 2022 | December 31, 2021 | ||||||||||
ASSETS | |||||||||||
| Current assets | |||||||||||
| Cash and cash equivalents | $ | $ | |||||||||
| Restricted cash - other | |||||||||||
| Accounts receivable, net | |||||||||||
| Prepaid expenses | |||||||||||
| Other current assets | |||||||||||
| Total current assets | |||||||||||
| Oil and natural gas properties, using full cost method of accounting | |||||||||||
| Proved | |||||||||||
| Unproved | |||||||||||
| Less: accumulated depreciation, depletion and impairment | ( | ( | |||||||||
| Other property, plant and equipment, net | |||||||||||
| Other assets | |||||||||||
| Total assets | $ | $ | |||||||||
| LIABILITIES AND STOCKHOLDERS’ EQUITY | |||||||||||
| Current liabilities | |||||||||||
| Accounts payable and accrued expenses | $ | $ | |||||||||
| Derivative contracts | |||||||||||
| Asset retirement obligation | |||||||||||
| Other current liabilities | |||||||||||
| Total current liabilities | |||||||||||
| Asset retirement obligation | |||||||||||
| Other long-term obligations | |||||||||||
| Total liabilities | |||||||||||
Commitments and contingencies (Note 7) | |||||||||||
| Stockholders’ Equity | |||||||||||
Common stock, $ | |||||||||||
| Warrants | |||||||||||
| Additional paid-in capital | |||||||||||
| Accumulated deficit | ( | ( | |||||||||
| Total stockholders’ equity | |||||||||||
| Total liabilities and stockholders’ equity | $ | $ | |||||||||
The accompanying notes are an integral part of these condensed consolidated financial statements.
4
SANDRIDGE ENERGY, INC. AND SUBSIDIARIES
CONDENSED CONSOLIDATED INCOME STATEMENTS (Unaudited)
(In thousands, except per share data)
| Three Months Ended March 31, | |||||||||||
| 2022 | 2021 | ||||||||||
| Revenues | |||||||||||
| Oil, natural gas and NGL | $ | $ | |||||||||
| Total revenues | |||||||||||
| Expenses | |||||||||||
| Lease operating expenses | |||||||||||
| Production, ad valorem, and other taxes | |||||||||||
| Depreciation and depletion — oil and natural gas | |||||||||||
| Depreciation and amortization — other | |||||||||||
| General and administrative | |||||||||||
| Restructuring expenses | |||||||||||
| Employee termination benefits | |||||||||||
| (Gain) loss on derivative contracts | |||||||||||
| (Gain) loss on sale of assets | ( | ||||||||||
| Other operating (income) expense, net | ( | ( | |||||||||
| Total expenses | ( | ||||||||||
| Income from operations | |||||||||||
| Other income (expense) | |||||||||||
| Interest expense, net | ( | ( | |||||||||
| Other income (expense), net | |||||||||||
| Total other income (expense) | ( | ( | |||||||||
| Income before income taxes | |||||||||||
| Income tax expense (benefit) | |||||||||||
| Net income | $ | $ | |||||||||
| Net income per share | |||||||||||
| Basic | $ | $ | |||||||||
| Diluted | $ | $ | |||||||||
| Weighted average number of common shares outstanding | |||||||||||
| Basic | |||||||||||
| Diluted | |||||||||||
The accompanying notes are an integral part of these condensed consolidated financial statements.
5
SANDRIDGE ENERGY, INC. AND SUBSIDIARIES
CONDENSED CONSOLIDATED STATEMENT OF CHANGES IN STOCKHOLDERS’ EQUITY (Unaudited)
(In thousands)
Common Stock | Warrants | Additional Paid-In Capital | Accumulated Deficit | Total | ||||||||||||||||||||||||||||||||||||||||
Shares | Amount | Shares | Amount | |||||||||||||||||||||||||||||||||||||||||
| Three Months Ended March 31, 2022 | ||||||||||||||||||||||||||||||||||||||||||||
Balance at December 31, 2021 | $ | $ | $ | $ | ( | $ | ||||||||||||||||||||||||||||||||||||||
| Issuance of stock awards, net of cancellations | — | — | — | — | — | — | ||||||||||||||||||||||||||||||||||||||
| Stock-based compensation | — | — | — | — | — | |||||||||||||||||||||||||||||||||||||||
| Cash paid for tax obligations on vested stock awards | — | — | — | — | ( | — | ( | |||||||||||||||||||||||||||||||||||||
Net income | — | — | — | — | — | |||||||||||||||||||||||||||||||||||||||
| Balance at March 31, 2022 | $ | $ | $ | $ | ( | $ | ||||||||||||||||||||||||||||||||||||||
| Three Months Ended March 31, 2021 | ||||||||||||||||||||||||||||||||||||||||||||
| Balance at December 31, 2020 | $ | $ | $ | $ | ( | $ | ||||||||||||||||||||||||||||||||||||||
| Issuance of stock awards, net of cancellations | — | — | — | — | — | — | ||||||||||||||||||||||||||||||||||||||
| Stock-based compensation | — | — | — | — | — | |||||||||||||||||||||||||||||||||||||||
| Issuance of common stock for general unsecured claims | — | — | — | — | — | — | ||||||||||||||||||||||||||||||||||||||
| Issuance of warrants for general unsecured claims | — | — | — | — | — | — | ||||||||||||||||||||||||||||||||||||||
| Cash paid for tax obligations on vested stock awards | — | — | — | — | ( | — | ( | |||||||||||||||||||||||||||||||||||||
Net Income | — | — | — | — | — | |||||||||||||||||||||||||||||||||||||||
| Balance at March 31, 2021 | $ | $ | $ | $ | ( | $ | ||||||||||||||||||||||||||||||||||||||
The accompanying notes are an integral part of these condensed consolidated financial statements.
6
SANDRIDGE ENERGY, INC. AND SUBSIDIARIES
CONDENSED CONSOLIDATED STATEMENTS OF CASH FLOWS (Unaudited)
(In thousands)
| Three Months Ended March 31, | |||||||||||
| 2022 | 2021 | ||||||||||
| CASH FLOWS FROM OPERATING ACTIVITIES | |||||||||||
| Net income | $ | $ | |||||||||
| Adjustments to reconcile net income to net cash provided by operating activities | |||||||||||
| Provision for doubtful accounts | |||||||||||
| Depreciation, depletion, and amortization | |||||||||||
| Debt issuance costs amortization | |||||||||||
| (Gain) loss on derivative contracts | |||||||||||
| Cash (paid) received on settlement of derivative contracts | ( | ||||||||||
| (Gain) loss on sale of assets | ( | ||||||||||
| Stock-based compensation | |||||||||||
| Other | |||||||||||
| Changes in operating assets and liabilities | ( | ( | |||||||||
| Net cash provided by (used in) operating activities | |||||||||||
| CASH FLOWS FROM INVESTING ACTIVITIES | |||||||||||
| Capital expenditures for property, plant and equipment | ( | ( | |||||||||
| Purchase of other property and equipment | ( | ( | |||||||||
| Proceeds from sale of assets | |||||||||||
| Net cash provided by (used in) investing activities | ( | ||||||||||
| CASH FLOWS FROM FINANCING ACTIVITIES | |||||||||||
| Reduction of financing lease liability | ( | ( | |||||||||
| Debt issuance costs | ( | ||||||||||
| Proceeds from exercise of stock options | |||||||||||
| Cash paid for tax obligations on vested stock awards | ( | ( | |||||||||
| Net cash provided by (used in) financing activities | ( | ( | |||||||||
| NET INCREASE (DECREASE) IN CASH, CASH EQUIVALENTS and RESTRICTED CASH | |||||||||||
| CASH, CASH EQUIVALENTS and RESTRICTED CASH, beginning of year | |||||||||||
| CASH, CASH EQUIVALENTS and RESTRICTED CASH, end of period | $ | $ | |||||||||
| Supplemental Disclosure of Cash Flow Information | |||||||||||
| Cash paid for interest, net of amounts capitalized | $ | ( | $ | ( | |||||||
| Supplemental Disclosure of Noncash Investing and Financing Activities | |||||||||||
| Purchase of Plant Property and Equipment in accounts payable | $ | $ | |||||||||
| Right-of-use assets obtained in exchange for financing lease obligations | $ | $ | |||||||||
The accompanying notes are an integral part of these condensed consolidated financial statements.
7
SANDRIDGE ENERGY, INC. AND SUBSIDIARIES
NOTES TO CONDENSED CONSOLIDATED FINANCIAL STATEMENTS
(Unaudited)
1. Basis of Presentation
Use of Estimates. The preparation of the unaudited condensed consolidated financial statements in conformity with GAAP requires management to make estimates and assumptions that affect the reported amounts of assets and liabilities and disclosure of contingent assets and liabilities at the date of the financial statements and the reported amounts of revenues and expenses during the reporting period.
The more significant areas requiring the use of assumptions, judgments and estimates include: oil, natural gas and natural gas liquids (“NGL”) reserves; impairment tests of long-lived assets; the carrying value of unproved oil and natural gas properties; depreciation, depletion and amortization; asset retirement obligations; determinations of significant alterations to the full cost pool and related estimates of fair value used to allocate the full cost pool net book value to divested properties, as necessary; valuation allowances for deferred tax assets; income taxes; valuation of derivative instruments; contingencies; and accrued revenue and related receivables. Although management believes the estimates used in the areas noted above are reasonable, actual results could differ significantly from those estimates.
8
SANDRIDGE ENERGY, INC. AND SUBSIDIARIES
NOTES TO CONDENSED CONSOLIDATED FINANCIAL STATEMENTS - CONTINUED
(Unaudited)
2. Fair Value Measurements
The Company measures and reports certain assets and liabilities on a fair value basis and has classified and disclosed its fair value measurements using the levels of the fair value hierarchy noted below. The carrying values of cash, restricted cash, accounts receivable, prepaid expenses, certain other current and non-current assets, accounts payable and accrued expenses, and other current liabilities and other long-term obligations included in the unaudited condensed consolidated balance sheets approximated fair value at March 31, 2022 and December 31, 2021.
| Level 1 | Unadjusted quoted prices in active markets that are accessible at the measurement date for identical, unrestricted assets or liabilities. | ||||
| Level 2 | Quoted prices in markets that are not active, or inputs which are observable, either directly or indirectly, for substantially the full term of the asset or liability. | ||||
| Level 3 | Measurement based on prices or valuation models that require inputs that are both significant to the fair value measurement and less observable from objective sources (i.e., supported by little or no market activity). | ||||
Assets and liabilities that are measured at fair value are classified based on the lowest level of input that is significant to the fair value measurement. The Company’s assessment of the significance of a particular input to the fair value measurement requires judgment, which may affect the valuation of the fair value of assets and liabilities and their placement within the fair value hierarchy levels. The determination of the fair values, stated below, considers the market for the Company’s financial assets and liabilities, the associated credit risk and other factors. The Company considers active markets as those in which transactions for the assets or liabilities occur in sufficient frequency and volume to provide pricing information on an ongoing basis. The Company had liabilities classified in Level 2 of the hierarchy as of December 31, 2021 and none as of March 31, 2022 as described below.
Level 2 Fair Value Measurements
Commodity Derivative Contracts. As applicable, the fair values of the Company’s oil and natural gas fixed price swaps are based upon inputs that are either readily available in the public market, such as oil and natural gas futures prices, volatility factors and discount rates, or can be corroborated from active markets. Fair value is determined through the use of a discounted cash flow model or option pricing model using the applicable inputs discussed above. The Company applies a weighted average credit default risk rating factor for its counterparties or gives effect to its credit default risk rating, as applicable, in determining the fair value of these derivative contracts. Credit default risk ratings are based on current published credit default swap rates.
Fair Value - Recurring Measurement Basis
There were no open commodity derivative contracts as of March 31, 2022. The following table summarize the Company’s assets measured at fair value on a recurring basis by the fair value hierarchy (in thousands):
December 31, 2021
Fair Value Measurements | Netting (1) | Assets/Liabilities at Fair Value | |||||||||||||||||||||||||||
Level 1 | Level 2 | Level 3 | |||||||||||||||||||||||||||
| Liabilities | |||||||||||||||||||||||||||||
| Commodity derivative contracts | $ | $ | $ | $ | $ | ||||||||||||||||||||||||
Total | $ | $ | $ | $ | $ | ||||||||||||||||||||||||
____________________
(1) Represents the effect of netting assets and liabilities for counterparties with which the right of offset exists.
Transfers. The Company did not have any transfers between Level 1, Level 2 or Level 3 fair value measurements during the three-month periods ended March 31, 2022 and 2021.
9
SANDRIDGE ENERGY, INC. AND SUBSIDIARIES
NOTES TO CONDENSED CONSOLIDATED FINANCIAL STATEMENTS - CONTINUED
(Unaudited)
3. Derivatives
Commodity Derivatives
The Company is exposed to commodity price risk, which impacts the predictability of its cash flows from the sale of oil and natural gas. On occasion, the Company has attempted to manage this risk on a portion of its forecasted oil or natural gas production sales through the use of commodity derivative contracts. There were no open commodity derivative contracts as of March 31, 2022.
Historically, the Company has not designated any of its derivative contracts as hedges for accounting purposes. All derivative contracts have been recorded at fair value with changes in derivative contract fair values recognized as a gain or loss on derivative contracts in the condensed consolidated statements of operations. Commodity derivative contracts were settled on a monthly basis, and the commodity derivative contract valuations were adjusted to the mark-to-market valuation on a quarterly basis.
The following table summarizes derivative activity for the three-month periods ended March 31, 2022, and 2021 (in thousands):
| Three Months Ended March 31, | |||||||||||
| 2022 | 2021 | ||||||||||
| (Gain) loss on commodity derivative contracts | $ | $ | |||||||||
| Cash (paid) received on settlements | $ | ( | $ | ||||||||
Master Netting Agreements and the Right of Offset. As applicable, the Company historically had master netting agreements with all of its commodity derivative counterparties and has presented its derivative assets and liabilities with the same counterparty on a net basis in the unaudited condensed consolidated balance sheets. As a result of the netting provisions, the Company's maximum amount of loss under commodity derivative transactions due to credit risk is limited to the net amounts due from its counterparties. There were no open commodity derivatives contracts as of March 31, 2022. As of December 31, 2021, the Company’s open commodity derivative contracts were held with one counterparty.
There were no open derivative positions as of March 31, 2022. The following table summarizes (i) the Company's commodity derivative contracts on a gross basis, (ii) the effects of netting assets and liabilities for which the right of offset exists based on master netting arrangements and (iii) for the Company’s net derivative liability positions as of December 31, 2021 were (in thousands):
Gross Amounts | Gross Amounts Offset | Amounts Net of Offset | Financial Collateral | Net Amount | ||||||||||||||||||||||||||||
| Liabilities | ||||||||||||||||||||||||||||||||
Derivative contracts - current | $ | $ | $ | $ | $ | |||||||||||||||||||||||||||
Total | $ | $ | $ | $ | $ | |||||||||||||||||||||||||||
Because we did not designate any of our derivative contracts as hedges for accounting purposes, changes in the fair value of our derivative contracts were recognized as gains and losses in current period earnings. As a result, and as applicable, our current period earnings could have been significantly affected by changes in the fair value of our commodity derivative contracts. Changes in fair value were principally measured based on a comparison of future prices to the contract price at the end of the period.
10
SANDRIDGE ENERGY, INC. AND SUBSIDIARIES
NOTES TO CONDENSED CONSOLIDATED FINANCIAL STATEMENTS - CONTINUED
(Unaudited)
Fair Value of Derivatives
The following table presents the fair value of the Company’s derivative contracts on a net basis with the same counterparty (in thousands):
| Type of Contract | Balance Sheet Classification | December 31, 2021 | ||||||||||||
| Derivative liabilities | ||||||||||||||
| Natural Gas and NGL price swaps | Current liabilities - Derivative Contracts | $ | ||||||||||||
| Total net derivative contracts | $ | |||||||||||||
4. Property, Plant and Equipment
| March 31, 2022 | December 31, 2021 | ||||||||||
Oil and natural gas properties | |||||||||||
Proved | $ | $ | |||||||||
Unproved | |||||||||||
Total oil and natural gas properties | |||||||||||
| Less: accumulated depreciation, depletion and impairment | ( | ( | |||||||||
| Net oil and natural gas properties | |||||||||||
| Land | |||||||||||
| Electrical infrastructure | |||||||||||
| Other non-oil and natural gas equipment | |||||||||||
| Buildings and structures | |||||||||||
| Financing leases | |||||||||||
| Total | |||||||||||
| Less: accumulated depreciation and amortization | ( | ( | |||||||||
Other property, plant and equipment, net | |||||||||||
Total property, plant and equipment, net | $ | $ | |||||||||
5. Acquisitions and Divestitures
11
SANDRIDGE ENERGY, INC. AND SUBSIDIARIES
NOTES TO CONDENSED CONSOLIDATED FINANCIAL STATEMENTS - CONTINUED
(Unaudited)
6. Accounts Payable and Accrued Expenses
| March 31, 2022 | December 31, 2021 | ||||||||||
| Accounts payable and other accrued expenses | $ | $ | |||||||||
| Production payable | |||||||||||
| Payroll and benefits | |||||||||||
| Taxes payable | |||||||||||
| Drilling advances | |||||||||||
| Total accounts payable and accrued expenses | $ | $ | |||||||||
7. Commitments and Contingencies
Legal Proceedings. The Company is subject to various legal proceedings and claims arising in the ordinary course of its business. The Company has provided accruals where necessary for contingent liabilities, based on ASC 450, Contingencies, when it has determined that a liability is probable and reasonably estimable. The Company continuously assesses the potential liability related to the Company's pending litigation and revises its estimates when additional information becomes available. Additionally, the Company currently expenses all legal costs as they are incurred.
As previously disclosed in the Company's 2021 Form 10-K, there are certain ongoing Cases (as that term is defined in the Company's 2021 Form 10-K).
In each of the Cases, lead plaintiffs seek to recover unspecified damages, interest, costs and expenses incurred in the litigation on behalf of themselves and class members. Although the claims against the Company in each Case have been discharged pursuant to the Plan, the Company remains a nominal defendant because of a technical connection with the Cases, and is necessary for the court to decide all issues and make a proper judgement. The Company may also be contractually obligated to indemnify two former officers who are defendants and the SandRidge Mississippian Trust I against losses, claims, damages, liabilities and expenses, including reasonable costs of investigation and attorney’s fees and expenses, which it is required to advance, arising out of the Cases, although the Company disputes any such obligations. Such indemnification is not covered by insurance with respect to the Trust. As of October 2020, we have exhausted all remaining insurance coverage for the costs of indemnification and expect no further reimbursements.
In light of the status of the Cases, and the facts, circumstances and legal theories relating thereto, the Company is not able to determine the likelihood of an outcome in either case or provide an estimate of any reasonably possible loss or range of possible loss related thereto. Accordingly, the Company has not established or accrued any liabilities relating to the Cases and believes that the plaintiffs' claims are without merit. However, considering the exhaustion of insurance coverage available to the Company, such losses, if incurred, could be material. The Company intends to continue to vigorously defend against the Cases in its capacity as a nominal defendant.
12
SANDRIDGE ENERGY, INC. AND SUBSIDIARIES
NOTES TO CONDENSED CONSOLIDATED FINANCIAL STATEMENTS - CONTINUED
(Unaudited)
8. Income Taxes
For each interim reporting period, the Company estimates the effective tax rate expected for the full fiscal year and uses that estimated rate in providing for income taxes on a current year-to-date basis.
Deferred income taxes are provided to reflect the future tax consequences of temporary differences between the tax basis of assets and liabilities and their reported amounts in the financial statements. The Company’s deferred tax assets have been reduced by a valuation allowance due to a determination that it is more likely than not that some or all of the deferred assets will not be realized based on the weight of all available evidence. The Company continues to closely monitor and weigh all available evidence, including both positive and negative, in making its determination whether to maintain a valuation allowance. As a result of the significant weight placed on the Company's cumulative negative earnings position, the Company continued to maintain a full valuation allowance against its net deferred tax asset at March 31, 2022 and December 31, 2021. As a result, the Company had no federal or state income tax expense or benefit for the three-month periods ended March 31, 2022 and 2021.
Internal Revenue Code (“IRC”) Section 382 addresses company ownership changes and specifically limits the utilization of certain deductions and other tax attributes on an annual basis following an ownership change. As a result of the Chapter 11 reorganization and related transactions, the Company experienced an ownership change within the meaning of IRC Section 382 during 2016 that subjected certain of the Company’s tax attributes, including net operating losses ("NOLs"), to an IRC Section 382 limitation. This limitation has not resulted in cash taxes for any period subsequent to the ownership change. Since the 2016 ownership change, the Company has generated additional NOLs and other tax attributes that are not currently subject to an IRC Section 382 limitation. The Company's ability to use NOLs and other tax attributes to reduce taxable income and income taxes could be materially impacted by a future IRC 382 ownership change. Future transactions involving the Company's stock, including those outside of the Company's control, could cause an IRC 382 ownership change resulting in a limitation on tax attributes currently not limited and a more restrictive limitation on tax attributes currently subject to the previous IRC 382 limitation.
As of March 31, 2022, the Company had approximately $1.6 billion of federal NOL carryforwards, net of NOLs expected to expire unused due to the 2016 IRC Section 382 limitation. Of the $1.6 billion of federal NOL carryforwards, $0.8 billion expire during the years 2027 through 2037, while $0.8 billion do not have an expiration date. Additionally, the Company had federal tax credits in excess of $33.5 million which begin expiring in 2029.
The Company did not have unrecognized tax benefits at March 31, 2022 and December 31, 2021.
The Company’s only taxing jurisdiction is the United States (federal and state). The Company’s tax years 2017 to present remain open for federal examination. Additionally, tax years 2005 through 2016 remain subject to examination for the purpose of determining the amount of federal NOL and other carryforwards. The number of years open for state tax audits varies, depending on the state, but are generally from to five years .
9. Equity
Common Stock, Performance Share Units, and Stock Options. At March 31, 2022, the Company had approximately 250.0 million shares of common stock authorized, 36.7 0.001 per share, issued and outstanding. Further, at March 31, 2022, the Company had approximately 0.1 million shares of unvested restricted stock awards, 0.4 million shares of unvested restricted stock units, 0.3 million stock options outstanding, and an immaterial number of unvested performance share units.
Warrants. The Company has issued approximately 4.9 million Series A warrants and 2.1 million Series B warrants that are exercisable until October 4, 2022 for one 41.34 and $42.03 per share, respectively, subject to adjustments pursuant to the terms of the warrants, to certain holders of general unsecured claims as defined in the 2016 bankruptcy reorganization plan. The warrants contain customary anti-dilution adjustments in the event of any stock split, reverse stock split, reclassification, stock dividend or other distributions.
Share Repurchase Program. In August 2021, the Company's Board of Directors (the “Board”) approved the initiation of a share repurchase program (the "Program") authorizing the Company to purchase up to an aggregate of $25.0 million of the Company’s common stock. The Program is in accordance with Rule 10b-18 of the Exchange Act. Subject to applicable rules
13
SANDRIDGE ENERGY, INC. AND SUBSIDIARIES
NOTES TO CONDENSED CONSOLIDATED FINANCIAL STATEMENTS - CONTINUED
(Unaudited)
10. Revenues
The following table disaggregates the Company’s revenue by source for the three-month periods ended March 31, 2022 and 2021:
| Three Months Ended March 31, | |||||||||||
| 2022 | 2021 | ||||||||||
| (In thousands) | |||||||||||
| Oil | $ | $ | |||||||||
| NGL | |||||||||||
| Natural gas | |||||||||||
| Other | |||||||||||
Total revenues (1) | $ | $ | |||||||||
(1)March 31, 2021 includes 36 days of production for NPB, which was sold on February 5, 2021.
Revenues Receivable. The Company records an asset in accounts receivable, net on its consolidated balance sheet for revenues receivable from contracts with customers at the end of each period. Pricing for revenues receivable is estimated using current month crude oil, natural gas and NGL prices, net of deductions. Revenues receivable are typically collected the month after the Company delivers the related production to its purchaser. As of March 31, 2022, and December 31, 2021, the Company had revenues receivable of $23.8 million and $18.8 million, respectively, and did no
14
SANDRIDGE ENERGY, INC. AND SUBSIDIARIES
NOTES TO CONDENSED CONSOLIDATED FINANCIAL STATEMENTS - CONTINUED
(Unaudited)
11. Earnings per Share
The following table summarizes the calculation of weighted average common shares outstanding used in the computation of diluted earnings (loss) per share:
Earnings | Weighted Average Shares | Earnings Per Share | |||||||||||||||
| (In thousands, except per share amounts) | |||||||||||||||||
| Three Months Ended March 31, 2022 | |||||||||||||||||
Basic earnings per share | $ | $ | |||||||||||||||
| Effect of dilutive securities | |||||||||||||||||
| Restricted stock units | |||||||||||||||||
| Restricted stock awards | |||||||||||||||||
| Performance share units (1) | |||||||||||||||||
| Stock options | |||||||||||||||||
| Warrants | |||||||||||||||||
Diluted earnings per share (2) | $ | $ | |||||||||||||||
| Three Months Ended March 31, 2021 | |||||||||||||||||
| Basic earnings per share | $ | (3) | $ | ||||||||||||||
| Effect of dilutive securities | |||||||||||||||||
| Restricted stock units | |||||||||||||||||
| Restricted stock awards | |||||||||||||||||
| Performance share units (1) | |||||||||||||||||
| Stock options | |||||||||||||||||
| Warrants | |||||||||||||||||
Diluted earnings per share (2) | $ | $ | |||||||||||||||
____________________
(1)The performance share unit awards are contingently issuable and are considered in the calculation of diluted earnings per share. The Company assesses the number of awards that would be issuable, if any, under the terms of the agreement if the end of the reporting period were the end of the contingency period.
(2)The incremental shares of potentially dilutive restricted stock units, restricted stock awards and stock options were included for the three-month periods ended March 31, 2022 and 2021 as their effect was dilutive under the treasury stock method.
(3)Includes 0.2 million of performance share units that are no longer contingently issuable.
15
ITEM 2. Management’s Discussion and Analysis of Financial Condition and Results of Operations
Introduction
The following discussion and analysis is intended to help the reader understand our business, financial condition, results of operations, liquidity and capital resources. This discussion and analysis should be read in conjunction with the accompanying unaudited condensed consolidated financial statements and the accompanying notes included in this Quarterly Report, as well as our audited consolidated financial statements and the accompanying notes included in the 2021 Form 10-K. Our discussion and analysis includes the following subjects:
•Overview;
•Consolidated Results of Operations;
•Liquidity and Capital Resources; and
•Critical Accounting Policies and Estimates.
The financial information with respect to the three-month periods ended March 31, 2022, and 2021, discussed below, is unaudited. In the opinion of management, this information contains all adjustments, which consist only of normal recurring adjustments unless otherwise disclosed, necessary to state fairly the accompanying unaudited condensed consolidated financial statements. The results of operations for the interim periods are not necessarily indicative of the results of operations for the full fiscal year.
Overview
We are an independent oil and natural gas company with a principal focus on acquisition, development and production activities in the U.S. Mid-Continent region (“Mid-Con”). Prior to February 5, 2021, we held assets in the North Park Basin ("NPB" or “North Park") of Colorado, which have been sold in their entirety.
The chart below shows production by product for the three-month periods ended March 31, 2022 and 2021:
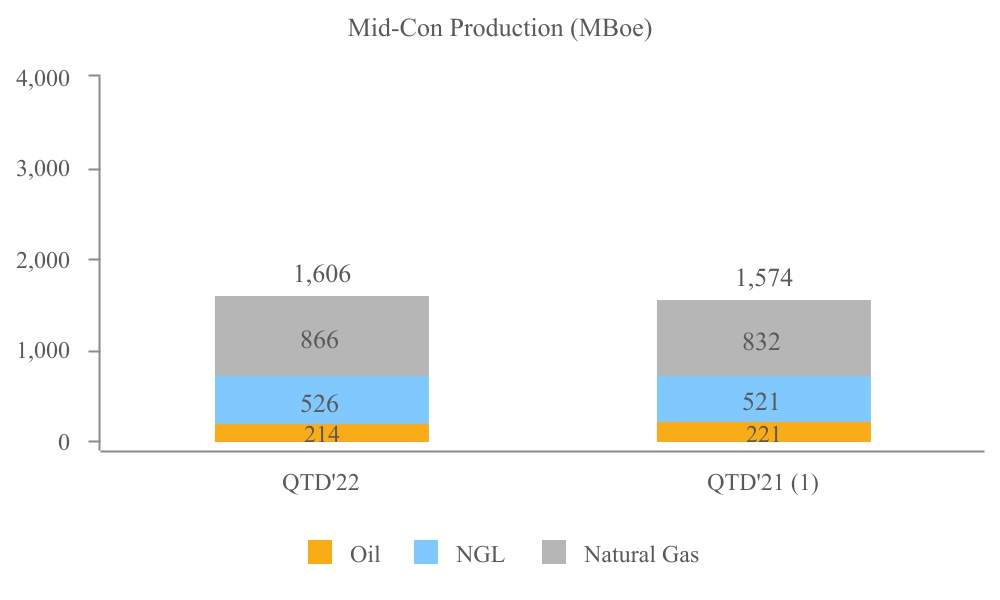
(1)Excludes 67 MBoe of oil production from North Park Basin, which was sold on February 5, 2021.
Total production for the three-month period ended March 31, 2022 was comprised of approximately 13.3% oil, 53.9% natural gas and 32.8% NGLs compared to 17.6% oil, 50.7% natural gas and 31.7% NGLs in 2021.
16
Outlook
We will continue to focus on growing the cash value and generation capability of our asset base in a safe, responsible and efficient manner, while exercising prudent capital allocations to projects we believe provide high rates of returns in the current commodity price environment. These projects include a continuation of our well reactivation program, artificial lift conversions to more efficient and cost effective systems, as well as focused drilling in high-graded areas, which will aide in partially offsetting the natural decline of our producing asset's. Stabilization of forward looking commodity prices, results, costs and other factors will shape our development decisions in 2022 and beyond. We will also remain open, patient and maintain optionality for opportunistic, value-accretive acquisitions and business combinations.
Demand for natural gas has increased in the United States with inventory levels falling below the five-year average, coupled with only modest increases in production. This has resulted in upward pressure on natural gas pricing. The rising consumption of crude oil, oil supply disruptions due to geopolitical events, and the risk of supply outages amid low global inventory levels have caused oil prices to rise. An increase in current and future oil supply is needed to meet forecasted demand in order to ease pressure on oil pricing. Our planned capital expenditure activity in 2022 is expected to add incremental production for 2022 to help offset our base production declines.
Consolidated Results of Operations
Our consolidated revenues and cash flow are generated from the production and sale of oil, natural gas and NGLs. Our revenues, profitability and future growth depend substantially on prevailing prices received for our production, the quantity of oil, natural gas and NGLs we produce, and our ability to find and economically develop and produce our reserves. Prices for oil, natural gas and NGLs fluctuate widely and are difficult to predict. To provide information on the general trend in pricing, the average New York Mercantile Exchange "NYMEX" prices for oil and natural gas are shown in the table below:
| Three month periods ended | ||||||||||||||||||||||||||
| March 31, 2022 | December 31, 2021 | September 30, 2021 | June 30, 2021 | |||||||||||||||||||||||
| NYMEX Oil (per Bbl) | $ | 95.02 | $ | 77.34 | $ | 70.59 | $ | 66.18 | ||||||||||||||||||
| NYMEX Natural gas (per MMBtu) | $ | 4.67 | $ | 4.76 | $ | 4.32 | $ | 2.98 | ||||||||||||||||||
In order to reduce our exposure to price fluctuations, from time to time we may enter into commodity derivative contracts for a portion of our anticipated future oil, natural gas and NGL production as discussed in “Item 3. Quantitative and Qualitative Disclosures About Market Risk.” As of March 31, 2022, we had no open commodity derivative contracts. However, we had commodity derivative activity during the quarter ended March 31, 2022. See “Note 3 - Derivatives” to the accompanying unaudited condensed consolidated financial statements included in this Quarterly Report for additional information regarding our commodity derivatives.
Revenues
Consolidated revenues for the three-month periods ended March 31, 2022, and 2021 are presented in the table below (in thousands):
| Three Months Ended March 31, | |||||||||||
| 2022 | 2021 | ||||||||||
| Oil | $ | 19,781 | $ | 15,548 | |||||||
| NGL | 17,742 | 8,856 | |||||||||
| Natural gas | 19,964 | 9,219 | |||||||||
| Total revenues (1) | $ | 57,487 | $ | 33,623 | |||||||
(1)Mid-Continent represented $30.4 million, or 90.6% of total consolidated revenues for the three-months ended March 31, 2021. NPB represented $3.2 million, or 9.4% of total consolidated revenues for the three-months ended March 31, 2021.
17
Oil, Natural Gas and NGL Production and Pricing
Our production and pricing information for the three-month periods ended March 31, 2022, and 2021 is shown in the table below:
| Three Months Ended March 31, | |||||||||||
| 2022 | 2021 | ||||||||||
| Production data | |||||||||||
| Oil (MBbls) | 214 | 288 | |||||||||
| NGL (MBbls) | 526 | 521 | |||||||||
| Natural gas (MMcf) | 5,195 | 4,993 | |||||||||
| Total volumes (MBoe) | 1,606 | 1,641 | |||||||||
| Average daily total volumes (MBoe/d) | 17.8 | 18.2 | |||||||||
| Average prices—as reported (1) | |||||||||||
| Oil (per Bbl) | $ | 92.35 | $ | 53.99 | |||||||
| NGL (per Bbl) | $ | 33.73 | $ | 17.00 | |||||||
| Natural gas (per Mcf) | $ | 3.84 | $ | 1.85 | |||||||
| Total (per Boe) | $ | 35.80 | $ | 20.49 | |||||||
| Average prices—including impact of derivative contract settlements | |||||||||||
| Oil (per Bbl) | $ | 92.35 | $ | 53.99 | |||||||
| NGL (per Bbl) | $ | 33.14 | $ | 17.00 | |||||||
| Natural gas (per Mcf) | $ | 3.69 | $ | 1.85 | |||||||
| Total (per Boe) | $ | 35.12 | $ | 20.49 | |||||||
__________________
(1)Prices represent actual average sales prices for the periods presented and do not include effects of derivative settlement. The average NYMEX prices for the three month period ended March 31, 2022 were $95.02 for Oil and $4.67 for Natural Gas. The average NYMEX prices for the three month period ended March 31, 2021 were $58.09 for Oil and $2.72 for Natural Gas.
The table below presents production by area of operation for the three-month periods ended March 31, 2022, and 2021:
| Three Months Ended March 31, | |||||||||||||||||||||||
| 2022 | 2021 | ||||||||||||||||||||||
| Production (MBoe) | % of Total | Production (MBoe) | % of Total | ||||||||||||||||||||
| Mid-Continent | 1,606 | 100.0 | % | 1,574 | 95.9 | % | |||||||||||||||||
| North Park Basin | — | — | % | 67 | 4.1 | % | |||||||||||||||||
| Total | 1,606 | 100.0 | % | 1,641 | 100.0 | % | |||||||||||||||||
Variances in oil, natural gas and NGL revenues attributable to changes in the average prices received for our production and total production volumes sold for the three-month periods ended March 31, 2022, and 2021 are shown in the table below (in thousands):
| Three Months Ended March 31, 2022 | ||||||||
| 2021 oil, natural gas and NGL revenues | $ | 33,623 | ||||||
| Change due to production volumes (1) | (1,253) | |||||||
| Change due to average prices | 25,117 | |||||||
| 2022 oil, natural gas and NGL revenues | $ | 57,487 | ||||||
(1)The decrease in production volumes is attributable to 67 MBoe from NPB, sold on February 5, 2021, partially offset by an increase in Mid-Con production volumes for the three months ended March 31, 2022.
18
Revenues from oil, natural gas and NGL sales increased $23.9 million or 71.0% for the three-months ended March 31, 2022 as compared to the three-months ended March 31, 2021. Revenue increased primarily due to favorable realized commodity prices offset by a slight decrease in production primarily as a result of the sale of NPB, with natural production declines in the Mid-Con reduced by our well reactivation program. The average prices for oil, natural gas and NGL’s increased primarily as a result of decreased supply of global commodities. See "Item 1A—Risk Factors" included in our 2021 Form 10-K for additional discussion of the potential impact these events may have on our future revenues.
Operating Expenses
Operating expenses for the three-month periods ended March 31, 2022, and 2021 consisted of the following (in thousands):
| Three Months Ended March 31, | |||||||||||
| 2022 | 2021 | ||||||||||
| Lease operating expenses | $ | 10,862 | $ | 7,954 | |||||||
| Production, ad valorem, and other taxes | 4,110 | 2,176 | |||||||||
| Depreciation and depletion—oil and natural gas | 2,401 | 2,505 | |||||||||
| Depreciation and amortization—other | 1,575 | 1,494 | |||||||||
| Total operating expenses | $ | 18,948 | $ | 14,129 | |||||||
| Lease operating expenses ($/Boe) | $ | 6.76 | $ | 4.85 | |||||||
| Production, ad valorem, and other taxes ($/Boe) | $ | 2.56 | $ | 1.33 | |||||||
| Depreciation and depletion—oil and natural gas ($/Boe) | $ | 1.50 | $ | 1.53 | |||||||
| Production, ad valorem, and other taxes (% of oil, natural gas, and NGL revenue) | 7.1 | % | 6.5 | % | |||||||
Lease operating expenses increased by $2.9 million or $1.92/Boe for the three months ended March 31, 2022, as compared to the three months ended March 31, 2021. The increase is primarily due to a higher number of producing wells, higher workover expense due to our well reactivation program and higher service and material costs driven by inflation.
Production, ad valorem, and other taxes has increased primarily due to higher commodity prices as discussed above. Further, it also increased as a percentage of oil, natural gas, and NGL revenue for the three months ended March 31, 2022 as compared to the same period in 2021, primarily due to increases in production taxes and the sale of NPB.
The average depreciation and depletion rate for our oil and natural gas properties for the three months ended March 31, 2022 decreased by $0.03/Boe from the three months ended March 31, 2021. The decrease is primarily due to an increase in estimated proved reserves.
Impairment
We did not record a full cost ceiling limitation impairment during the three months ended March 31, 2022 or March 31, 2021.
Calculation of the full cost ceiling test is based on, among other factors, trailing twelve-month (“SEC prices”) as adjusted for price differentials and other contractual arrangements. The SEC prices utilized in the calculation of proved reserves included in the full cost ceiling test at March 31, 2022 were $75.24 per barrel of oil and $4.09 per Mcf of natural gas, before price differential adjustments.
Based on the SEC prices over the ten months ended April 30, 2022, as well as two month of NYMEX strip pricing for May and June of 2022 as of April 25, 2022, we anticipate the SEC prices utilized in the June 30, 2022 full cost ceiling test may be $83.80 per barrel of oil and $4.98 per Mcf of natural gas, (the "estimated second quarter prices"). Applying these estimated second quarter prices, and holding all other inputs constant to those used in the calculation of our March 31, 2022 ceiling test, we expect that no full cost ceiling limitation impairment is indicated for the second quarter of 2022.
Any actual full cost ceiling limitation impairment recognized in future quarters may fluctuate significantly from projected amounts based on the outcome of numerous other factors such as additional declines in the actual trailing twelve-month SEC
19
prices, lower NGL pricing, changes in estimated future development costs and operating expenses, and other adjustments to our levels of proved reserves. Any such ceiling test impairments in 2022 could be material to our net earnings.
Full cost pool ceiling limitation impairments have no impact to our cash flow or liquidity.
Other Operating Expenses
Other operating expenses for the three-month periods ended March 31, 2022, and 2021 consisted of the following (in thousands):
| Three Months Ended March 31, | |||||||||||
| 2022 | 2021 | ||||||||||
| General and administrative | $ | 2,530 | $ | 2,090 | |||||||
| Restructuring expenses | 209 | 2,054 | |||||||||
| Employee termination benefits | — | 49 | |||||||||
| (Gain) loss on derivative contracts | 1,064 | — | |||||||||
| (Gain) loss on sale of assets | — | (19,713) | |||||||||
| Other operating (income) expense | (64) | (48) | |||||||||
| Total non-operating expenses | $ | 3,739 | $ | (15,568) | |||||||
General and administrative expenses increased by $0.4 million for the three-months ended March 31, 2022, compared to the same period in 2021. The increase primarily relates to a $0.4 million legal retainer refund that was recorded as a credit, reducing general and administrative expense in the first quarter of 2021.
Restructuring expenses represent fees and costs associated with the 2016 bankruptcy and exit from NPB in Colorado. Restructuring expenses decreased by $1.8 million for the three-months ended March 31, 2022, compared to the same period in 2021. The decrease primarily relates to payments of $1.3 million to settle general unsecured claims related to our 2016 bankruptcy during the quarter ended March 31, 2021.
Employee termination benefits for the three-month period ended March 31, 2021 included cash and share-based severance costs incurred for the sale of NPB and other employee terminations in the relevant periods.
The following table summarizes derivative activity for the three-month periods ended March 31, 2022, and 2021 (in thousands):
| Three Months Ended March 31, | |||||||||||
| 2022 | 2021 | ||||||||||
| (Gain) loss on commodity derivative contracts | $ | 1,064 | $ | — | |||||||
| Cash received (paid) on settlements | $ | (1,085) | $ | — | |||||||
As applicable, our derivative contracts were not designated as accounting hedges and, as a result, changes in their fair values were recorded each quarter as a component of operating expenses. Internally, management has historically viewed the settlement of commodity derivative contracts at contractual maturity as adjustments to the price received for oil and natural gas production to determine “effective prices.” In general, cash is received on settlement of contracts due to lower oil and natural gas prices at the time of settlement, compared to the contract price for our commodity derivative contracts; and, cash is paid on settlement of contracts due to higher oil and natural gas prices at the time of settlement, compared to the contract price for our commodity derivative contracts. See further discussion of derivative contracts in “Item 3. Quantitative and Qualitative Disclosures about Market Risk” included in Part I of this Quarterly Report.
(Gain) loss on sale of assets decreased by $19.7 million for the three-month period ended March 31, 2022, compared to the same period in 2021. The decrease relates to the gain from sale of NPB in February 2021.
20
Other Income (Expense)
Our other income (expense) for the three-month periods ended March 31, 2022, and 2021 are presented in the table below (in thousands):
| Three Months Ended March 31, | |||||||||||
| 2022 | 2021 | ||||||||||
Other income (expense) | |||||||||||
Interest expense, net | $ | (152) | $ | (47) | |||||||
Other income (expense), net | 76 | 28 | |||||||||
Total other income (expense) | $ | (76) | $ | (19) | |||||||
Interest expense incurred during the three-month period ended March 31, 2022 is primarily comprised of interest paid on royalty obligations of $0.1 million. Interest expense incurred during the three-month period ended March 31, 2021 is primarily comprised of interest paid on the prior 2020 Credit Facility as discussed in our 2021 10-K.
The Other income, net line item for the three-month period ended March 31, 2022 primarily relates to a gain on the sale of fleet vehicles.
Liquidity and Capital Resources
As of March 31, 2022, our cash and cash equivalents, including restricted cash was $165.8 million. For the next twelve months, we expect to have ample liquidity with cash on hand and cash from operations. The Company has no outstanding term or revolving debt obligations.
Working Capital and Sources and Uses of Cash
Our principal sources of liquidity for the next year include cash flows from operations and cash on hand.
Our working capital increased to $130.4 million at March 31, 2022, compared to $97.7 million at December 31, 2021. The positive impact on working capital resulted primarily from an increase in cash and cash equivalents at March 31, 2022 as a result of cash flows from operations.
Cash Flows
Our cash flows from operations are substantially dependent on current and future prices for oil and natural gas, which historically have been, and may continue to be, volatile. Cash flows from operations are also affected by timing of cash receipts and disbursements and changes in other working capital assets and liabilities.
Our cash flows for the three-month periods ended March 31, 2022, and 2021 are presented in the following table and discussed below (in thousands):
| Three Months Ended March 31, | |||||||||||
| 2022 | 2021 | ||||||||||
| Cash flows provided by (used in ) operating activities | $ | 32,193 | $ | 14,331 | |||||||
| Cash flows provided by (used in) investing activities | (5,619) | 34,085 | |||||||||
| Cash flows provided by (used in) financing activities | (320) | (167) | |||||||||
| Net increase (decrease) in cash and cash equivalents | $ | 26,254 | $ | 48,249 | |||||||
Cash Flows from Operating Activities
The $17.9 million increase in cash flow from operations for the three-month period ended March 31, 2022 compared to the same period in 2021, is primarily due to higher revenues as a result of improved commodity prices as discussed above and consistent production as a result of the well reactivation program, partially offset by the sale of NPB.
21
Cash Flows from Investing Activities
Our cash flows provided from investing activities during the three-month period ended March 31, 2022 reflects capital expenditures of $5.6 million primarily related to purchases of inventory in preparation of the drilling program and workovers related to the well reactivation program. The increase was partially offset by proceeds from the sale assets of $0.1 million.
During the three-month period ended March 31, 2021, cash flows from investing activities primarily reflects $37.2 million of proceeds from the sale of NPB assets offset by capital expenditures of $3.1 million. See "Note 5—Acquisitions and Divestitures" to the accompanying unaudited condensed consolidated financial statements included in Item 1 of this Quarterly Report for additional information.
Capital expenditures for the three-month periods ended March 31, 2022, and 2021 are summarized below (in thousands):
| Three Months Ended March 31, | |||||||||||
| 2022 | 2021 | ||||||||||
| Capital Expenditures | |||||||||||
| Drilling, completion and capital workovers (1) | $ | 5,691 | $ | 2,037 | |||||||
| Leasehold and geophysical | 287 | 111 | |||||||||
| Capital expenditures, excluding acquisitions (on an accrual basis) | 5,978 | 2,148 | |||||||||
| Acquisitions | — | 59 | |||||||||
| Capital expenditures, including acquisitions | 5,978 | 2,207 | |||||||||
| Change in capital accruals | (349) | 946 | |||||||||
| Total cash paid for capital expenditures | $ | 5,629 | $ | 3,153 | |||||||
(1)The Company capitalized $3.9 million in inventory primarily associated with the planned 2022 drilling program.
Cash Flows from Financing Activities
Cash used in financing activities for the three-month period ended March 31, 2022 consisted primarily of cash paid for tax obligations on vested stock awards of $0.2 million and finance lease payments of $0.1 million offset by immaterial proceeds from the exercise of stock options. Cash used in financing activities for the three-month period ended March 31, 2021 consisted primarily of finance lease payments, debt issuance costs and cash paid for tax obligations on vested awards.
Indebtedness
Credit Facility
On September 2, 2021, we repaid our $20.0 million term loan in full and terminated all commitments and obligations under the 2020 Credit Facility, between us, as Borrower, IEP Energy Holding LLC, as Lender, and Icahn Agency Services LLC, as Administrative Agent. The 2020 Credit Facility consisted of a $10 million revolving loan facility and a $20 million term loan facility. Our payment to the Lender under the Credit Agreement satisfied all of our term debt and revolving debt obligations. We did not incur any early termination penalties as a result of the repayment of indebtedness or termination of the Credit Agreement. See item 7 “Liquidity and Capital Resources” in the Company’s Form 10-K.
Contractual Obligations and Off-Balance Sheet Arrangements
At March 31, 2022, our contractual obligations included asset retirement obligations, leases and other individually insignificant obligations. Additionally, we have certain financial instruments representing potential commitments that were incurred in the normal course of business to support our operations, including surety bonds. The underlying liabilities insured by these instruments are reflected in our balance sheets, where applicable. Therefore, no additional liability is reflected for the surety bonds or other instruments.
There were no other significant changes in total contractual obligations and off-balance sheet arrangements from those reported in the 2021 Form 10-K.
22
Critical Accounting Policies and Estimates
For a description of our critical accounting policies and estimates, refer to Item 7. Management’s Discussion and Analysis of Financial Condition and Results of Operations included in the 2021 Form 10-K. For a discussion of recent accounting pronouncements, newly adopted and recent accounting pronouncements not yet adopted, see “Note 1 - Basis of Presentation” to the accompanying unaudited condensed consolidated financial statements included in Item 1 of this Quarterly Report. We did not have any material changes in critical accounting policies, estimates, judgments and assumptions during the first three months of 2022.
23
ITEM 3. Quantitative and Qualitative Disclosures About Market Risk
General
This discussion provides information about the financial instruments we have historically used to manage commodity prices. All contracts were settled in cash and did not require the actual delivery of a commodity at settlement. Additionally, our exposure to credit risk and interest rate risk is also discussed.
Commodity Price Risk. Our most significant market risk relates to the prices we receive for our oil, natural gas and NGLs. Due to the historical price volatility of these commodities, from time to time we have historically entered into commodity derivative contracts for a portion of our anticipated production volumes for the purpose of reducing the variability of the oil and natural gas prices we receive.
We have used, and may use, a variety of commodity-based derivative contracts, including fixed price swaps, basis swaps and collars. At March 31, 2022, we had no open commodity derivative contracts or obligations to enter into commodity derivative contracts.
Because we historically have not designated any of our derivative contracts as hedges for accounting purposes, changes in the fair value of our derivative contracts were recognized as gains and losses in current period earnings. As a result, and when applicable, current period earnings could have been significantly affected by changes in the fair value of our commodity derivative contracts. Changes in fair value were principally measured based on a comparison of future prices to the contract price at the end of the period.
The following table summarizes derivative activity for the three-month periods ended March 31, 2022, and 2021 (in thousands):
| Three Months Ended March 31, | |||||||||||
| 2022 | 2021 | ||||||||||
| (Gain) loss on commodity derivative contracts | $ | 1,064 | $ | — | |||||||
| Cash received (paid) on settlements | $ | (1,085) | $ | — | |||||||
See “Note 3 - Derivatives” to the accompanying unaudited condensed consolidated financial statements included in this Quarterly Report for additional information regarding our commodity derivatives.
Credit Risk. As applicable, we were exposed to credit risk related to the counterparty to our derivative financial contracts. All of our derivative transactions have been carried out in the over-the-counter market. The use of derivative transactions in over-the-counter markets involves the risk that the counterparty may be unable to meet the financial terms of the transactions. The counterparty for all of our derivative transactions has had an “investment grade” credit rating. We have historically monitored the credit ratings of our derivative counterparties and considered our counterparties’ credit default risk ratings in determining the fair value of our derivative contracts.
We did not require collateral or other security from counterparties to support derivative instruments. We historically had master netting agreements with each of our derivative contract counterparties, which allowed us to net our derivative assets and liabilities by commodity type with the same counterparty. As a result of the netting provisions, our maximum amount of loss under derivative transactions due to credit risk was limited to the net amounts due from the counterparties under the commodity derivative contracts. Therefore, we were not required to post additional collateral under our commodity derivative contracts.
We are also exposed to credit risk related to the collection of receivables from our joint interest partners for their proportionate share of expenditures on wells and properties we operate. Historically, our credit losses on joint interest receivables have been immaterial.
24
ITEM 4. Controls and Procedures
Disclosure Controls and Procedures
Under the supervision and with the participation of the Company’s management, including the Company’s CEO and CFO, the Company performed an evaluation of the effectiveness of the design and operation of its disclosure controls and procedures pursuant to Exchange Act Rules 13a-15 and 15d-15 as of the end of the period covered by this Quarterly Report. Based on that evaluation, the Company’s CEO and CFO concluded that the Company’s disclosure controls and procedures were effective as of March 31, 2022, to provide reasonable assurance that the information required to be disclosed by the Company in its reports filed or submitted under the Exchange Act is recorded, processed, summarized and reported within the time periods specified in the rules and forms of the Securities and Exchange Commission, and such information is accumulated and communicated to management, as appropriate to allow timely decisions regarding required disclosure.
Changes in Internal Control Over Financial Reporting
There was no change in the Company’s internal control over financial reporting during the quarter ended March 31, 2022 that has materially affected, or is reasonably likely to materially affect, the Company’s internal control over financial reporting.
25
PART II. Other Information
ITEM 1. Legal Proceedings
See "Note 7—Commitments and Contingencies” to the accompanying condensed consolidated financial statements in Item 1 of this Quarterly Report.
26
ITEM 1A. Risk Factors
There have been no material changes to the risk factors previously discussed in Item 1A—Risk Factors in the Company's 2021 Form 10-K.
ITEM 2. Unregistered Sales of Equity Securities and Use of Proceeds
The following table presents a summary of share repurchases made by the Company during the three-month period ended March 31, 2022.
| Period | Total Number of Shares Purchased(1) | Average Price Paid per Share | Total Number of Shares Purchased as Part of Publicly Announced Program | Maximum Approximate Dollar Value of Shares that May Yet Be Purchased Under the Program (in Millions) | |||||||||||||||||||
| January 1, 2022 - January 31, 2022 | — | $ | — | N/A | N/A | ||||||||||||||||||
| February 1, 2022 - February 28, 2022 | 7,494 | $ | 13.04 | N/A | N/A | ||||||||||||||||||
| March 1, 2022 - March 31, 2022 | 10,150 | $ | 13.51 | N/A | N/A | ||||||||||||||||||
| Total | 17,644 | — | |||||||||||||||||||||
___________________
(1) Includes shares of common stock tendered by employees in order to satisfy tax withholding requirements upon vesting of their stock awards. Shares withheld are initially recorded as treasury shares, then immediately retired.
ITEM 3. Defaults Upon Senior Securities
None.
ITEM 4. Mine Safety Disclosures
Not applicable.
ITEM 5. Other Information
None.
27
ITEM 6. Exhibits
| Incorporated by Reference | ||||||||||||||||||||||||||||||||
Exhibit No. | Exhibit Description | Form | SEC File No. | Exhibit | Filing Date | Filed Herewith | ||||||||||||||||||||||||||
| 2.1 | 8-A | 001-33784 | 2.1 | 10/4/2016 | ||||||||||||||||||||||||||||
| 3.1 | 8-A | 001-33784 | 3.1 | 10/4/2016 | ||||||||||||||||||||||||||||
| 3.2 | 8-A | 001-33784 | 3.2 | 10/4/2016 | ||||||||||||||||||||||||||||
| 31.1 | * | |||||||||||||||||||||||||||||||
| 31.2 | * | |||||||||||||||||||||||||||||||
| 32.1 | * | |||||||||||||||||||||||||||||||
| 101.INS | XBRL Instance Document - the instance document does not appear in the Interactive Data File because its XBRL tags are embedded within the Inline XBRL document. | * | ||||||||||||||||||||||||||||||
| 101.SCH | XBRL Taxonomy Extension Schema Document | * | ||||||||||||||||||||||||||||||
| 101.CAL | XBRL Taxonomy Extension Calculation Linkbase Document | * | ||||||||||||||||||||||||||||||
| 101.DEF | XBRL Taxonomy Extension Definition Document | * | ||||||||||||||||||||||||||||||
| 101.LAB | XBRL Taxonomy Extension Label Linkbase Document | * | ||||||||||||||||||||||||||||||
| 101.PRE | XBRL Taxonomy Extension Presentation Linkbase Document | * | ||||||||||||||||||||||||||||||
| 104 | Cover Page Interactive Data File (formatted as Inline XBRL and contained in Exhibit 101) | * | ||||||||||||||||||||||||||||||
28
SIGNATURE
Pursuant to the requirements of the Securities Exchange Act of 1934, the registrant has duly caused this report to be signed on its behalf by the undersigned thereunto duly authorized.
SandRidge Energy, Inc. | ||||||||
Date: May 5, 2022 | By: | /s/ Salah Gamoudi | ||||||
Salah Gamoudi Executive Vice President, Chief Financial Officer and Chief Accounting Officer (Principal Financial and Accounting Officer) | ||||||||
29
Serious News for Serious Traders! Try StreetInsider.com Premium Free!
You May Also Be Interested In
- EnerCom is Pleased to Announce that Registration is Now Open for the 29th Annual EnerCom Denver - The Energy Investment Conference
- FendX Announces Corporate Update
- Peralta Community College District Seeks More Outstanding Leaders
Create E-mail Alert Related Categories
SEC FilingsSign up for StreetInsider Free!
Receive full access to all new and archived articles, unlimited portfolio tracking, e-mail alerts, custom newswires and RSS feeds - and more!
