

Form 8-K FALCONSTOR SOFTWARE INC For: Nov 10
 Tweet
Tweet Share
ShareExhibit 99.1
For more information, contact:
FalconStor Software, Inc.
Brad Wolfe
Chief Financial Officer
brad.wolfe@falconstor.com
FalconStor Software Announces Third Quarter of 2021 Results
Managed Service Provider Adoption and Hybrid Cloud Momentum Fuel Subscription Revenue Growth
Partially Offsetting Declines in Legacy Business
•Delivered a 35% year-over-year increase in software subscription revenue for Q3 and a 54% year-over-year increase for the first nine months of 2021
•Added two new managed service provider (MSP) partners for our StorSafe secure backup-as-a-service solution under new disruptive monthly recurring pricing model launched in Q3
•Generated GAAP EPS of $0.01 per share during the quarter and GAAP EPS of ($0.11) per share for the first nine months of 2021
AUSTIN, TEXAS (November 10, 2021) - FalconStor Software, Inc. (OTCQB: FALC), the trusted data protection software leader modernizing disaster recovery and backup operations for the hybrid cloud world, today announced financial results for its third quarter, which ended on September 30, 2021, delivering a 35% year-over-year increase in subscription revenue fueled by the growth in managed service provider business and market adoption of hybrid cloud data protection solutions.
“We continue to make solid progress against our strategic plans to reinvent FalconStor and enable secure hybrid cloud backup and data protection,” said Todd Brooks, FalconStor CEO. “Driven by continued adoption of the FalconStor StorSafe long-term data protection solution, we accelerated our strategic focus on a recurring revenue model better aligned with today’s market. As part of this focus, we introduced a new and disruptive recurring monthly pricing model for our managed service providers, and continued migrating our installed based to a subscription revenue model. As a result, total subscription revenue increased 35% compared to Q3 of 2020, and 54% for the first nine months of 2021 compared to the same period last year.
“While we are encouraged by our subscription revenue growth, we are continuing to work toward our goal of consistent total revenue growth, as total revenue decreased by 26% year-over-year during the quarter and is down 7% for the first nine months of 2021 compared to the same period in 2020. As the recurring percentage of total revenue continues to increase over the next several quarters, and the reduction in perpetual license sales decreases, we are committed to driving more predictable total revenue growth, delivering profitability, and generating cash from operations, as we invest to grow.
“Migration to the cloud, data center rationalization, and increased leverage of outsourced managed services are top priorities for enterprise CIOs in the post-pandemic world, and FalconStor plays a vital role in each,” added Brooks. “We are excited by our hybrid cloud focus, the efficient routes to market that we are building through our managed service provider partners, and trust our shareholders have placed in our team to deliver customer and shareholder value.”
Third Quarter 2021 Financial Results
•Subscription Revenue: 35% increase to $0.8 million, compared to $0.6 million in the third quarter of fiscal year 2020
•Subscription Revenue % of Total Revenue: 23%, compared to 13% in the third quarter of fiscal year 2020
•Total Revenue: $3.3 million, compared to $4.4 million in the third quarter of fiscal year 2020
•Total Cost of Revenue: $0.4 million, compared to $0.4 million in the third quarter of fiscal year 2020
•Total Operating Expenses: $2.4 million, compared to $2.3 million in the third quarter of fiscal year 2020
•GAAP Net Income: $0.4 million, compared to $1.5 million in the third quarter of fiscal year 2020
•Ending Cash: $3.5 million, compared to $0.9 million in the third quarter of fiscal year 2020
1
Nine Months Ended 2021 Financial Results
•Subscription Revenue: 54% increase to $2.6 million, compared to $1.7 million in the first nine months of 2020
•Subscription Revenue % of Total Revenue: 25%, compared to 15% in the first nine months of 2020
•Total Revenue: $10.4 million, compared to $11.1 million in the first nine months of 2020
•Total Cost of Revenue: $1.5 million, compared to $1.4 million in the first nine months of 2020
•Total Operating Expenses: $8.6 million, compared to $7.9 million in the first nine months of 2020
•GAAP Net Income: $0.4 million, compared to $1.2 million in the first nine months of 2020
•Ending Cash: $3.5 million, compared to $0.9 million in the first nine months of 2020
Guidance
Given our less than anticipated year-to-date total revenue, we are revising the 2021 guidance we have previously provided.
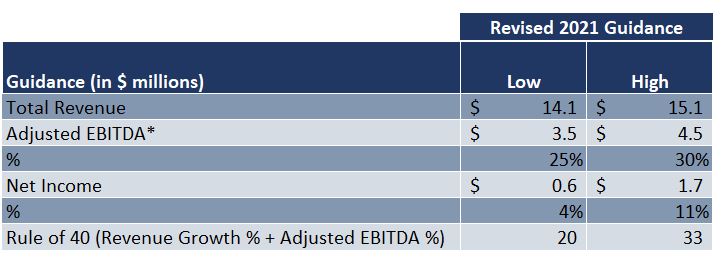
*Adjusted EBITDA adds back Non-Operating and Other Expenses and Income
Conference Call and Webcast Information
WHO: Todd Brooks, Chief Executive Officer, FalconStor and Brad Wolfe, Chief Financial Officer, FalconStor
WHEN: Wednesday, November 10, 2021, 4:00 P.M. Central Time
To register for our earnings call, please click the following link:
FALCONSTOR THIRD QUARTER 2021 FINANCIAL TELECONFERENCE AND PRESENTATION
As an alternative, you can copy and paste the following link into your web browser to register:
https://register.gotowebinar.com/register/4614368145758035469
Conference Call:
Please dial the following if you would like to interact with and ask questions to FalconStor hosts:
Toll Free: 1-877-309-2074
Access Code: 342-776-416
2
Non-GAAP Financial Measures
The non-GAAP financial measures used in this press release are not prepared in accordance with generally accepted accounting principles and may be different from non-GAAP financial measures used by other companies. The Company’s management refers to these non-GAAP financial measures in making operating decisions because they provide meaningful supplemental information regarding the Company’s operating performance. In addition, these non-GAAP financial measures facilitate management’s internal comparisons to the Company’s historical operating results and comparisons to competitors’ operating results. We include these non-GAAP financial measures (which should be viewed as a supplement to, and not a substitute for, their comparable GAAP measures) in this press release because we believe they are useful to investors in allowing for greater transparency into the supplemental information used by management in its financial and operational decision-making. The non-GAAP financial measures exclude (i) restructuring costs, (ii) effects of our Series A redeemable convertible preferred stock, and (iii) non-cash stock-based compensation charges and any potential tax effects. For a reconciliation of our GAAP and non-GAAP financial results, please refer to our reconciliation of GAAP to Non-GAAP financial measures presented in this release.
About FalconStor Software
FalconStor is the trusted data protection software leader modernizing disaster recovery and backup operations for the hybrid cloud world. The Company enables enterprise customers and managed service providers to secure, migrate, and protect their data while reducing data storage and long-term retention costs by up to 95%. More than 1,000 organizations and managed service providers worldwide standardize on FalconStor as the foundation for their cloud first data protection future. Our products are offered through and supported by a worldwide network of leading managed service providers (“MSPs”), systems integrators, resellers, and original equipment manufacturers (“OEMs”).
# # #
FalconStor and FalconStor Software are trademarks or registered trademarks of FalconStor Software, Inc., in the U.S. and other countries. All other company and product names contained herein may be trademarks of their respective holders.
Links to websites or pages controlled by parties other than FalconStor are provided for the reader's convenience and information only. FalconStor does not incorporate into this release the information found at those links nor does FalconStor represent or warrant that any information found at those links is complete or accurate. Use of information obtained by following these links is at the reader's own risk.
CONTACT INFORMATION
For more information, contact:
Brad Wolfe
Chief Financial Officer FalconStor Software Inc.
investorrelations@falconstor.com
CONTACT US AROUND THE GLOBE
| Corporate Headquarters | Europe Headquarters | |||||||
501 Congress Avenue | Landsberger Strasse 302 | |||||||
| Suite 150 | Munich, Germany | |||||||
| Austin, Texas 78701 | Tel: +49 (0) 89.41615321.10 | |||||||
| Tel: +1.631.777.5188 | salesemea@falconstor.com | |||||||
| salesinfo@falconstor.com | ||||||||
3
FalconStor Software, Inc. and Subsidiaries
CONDENSED CONSOLIDATED BALANCE SHEETS
| September 30, 2021 | December 31, 2020 | |||||||||||||
| (unaudited) | ||||||||||||||
| Assets | ||||||||||||||
| Current assets: | ||||||||||||||
| Cash and cash equivalents | $ | 3,474,784 | $ | 1,920,656 | ||||||||||
| Accounts receivable, net | 2,285,117 | 2,836,571 | ||||||||||||
| Prepaid expenses and other current assets | 1,537,267 | 1,837,596 | ||||||||||||
| Contract assets, net | 169,835 | 254,483 | ||||||||||||
| Inventory | 15,421 | 15,275 | ||||||||||||
| Total current assets | 7,482,424 | 6,864,581 | ||||||||||||
| Property and equipment, net | 193,028 | 197,020 | ||||||||||||
| Operating lease right-of-use assets | 140,238 | 536,272 | ||||||||||||
| Deferred tax assets, net | 310,755 | 330,552 | ||||||||||||
| Software development costs, net | 14,345 | 19,278 | ||||||||||||
| Other assets, net | 114,828 | 863,964 | ||||||||||||
| Goodwill | 4,150,339 | 4,150,339 | ||||||||||||
| Other intangible assets, net | 64,295 | 100,134 | ||||||||||||
| Contract assets | 192,286 | 343,934 | ||||||||||||
| Total assets | $ | 12,662,538 | $ | 13,406,074 | ||||||||||
| Liabilities and Stockholders' Deficit | ||||||||||||||
| Current liabilities: | ||||||||||||||
| Accounts payable | $ | 335,092 | $ | 453,791 | ||||||||||
| Accrued expenses | 1,018,878 | 2,293,765 | ||||||||||||
| Operating lease liabilities | 87,381 | 665,074 | ||||||||||||
| Short-term loan, net of debt issuance costs and discounts | — | 3,320,863 | ||||||||||||
| Deferred revenue, net | 3,709,005 | 4,603,270 | ||||||||||||
| Total current liabilities | 5,150,356 | 11,336,763 | ||||||||||||
| Other long-term liabilities | 637,099 | 703,889 | ||||||||||||
| Notes payable, net | 2,150,574 | 754,000 | ||||||||||||
| Operating lease liabilities | 53,430 | — | ||||||||||||
| Deferred tax liabilities, net | 525,512 | 513,027 | ||||||||||||
| Deferred revenue, net | 1,569,813 | 1,765,859 | ||||||||||||
| Total liabilities | 10,086,784 | 15,073,538 | ||||||||||||
| Commitments and contingencies | ||||||||||||||
| Series A redeemable convertible preferred stock | 14,075,434 | 12,940,722 | ||||||||||||
| Total stockholders' deficit | (11,499,680) | (14,608,186) | ||||||||||||
| Total liabilities and stockholders' deficit | $ | 12,662,538 | $ | 13,406,074 | ||||||||||
4
FalconStor Software, Inc. and Subsidiaries
CONDENSED CONSOLIDATED STATEMENTS OF OPERATIONS
(Unaudited)
| Three Months Ended September 30, | Nine Months Ended September 30, | |||||||||||||||||||||||||
| 2021 | 2020 | 2021 | 2020 | |||||||||||||||||||||||
| Revenue: | ||||||||||||||||||||||||||
| Product revenue | $ | 1,547,013 | $ | 2,521,695 | $ | 5,288,747 | $ | 5,202,713 | ||||||||||||||||||
| Support and services revenue | 1,736,456 | 1,914,705 | 5,081,795 | 5,913,486 | ||||||||||||||||||||||
| Total revenue | 3,283,469 | 4,436,400 | 10,370,542 | 11,116,199 | ||||||||||||||||||||||
| Cost of revenue: | ||||||||||||||||||||||||||
| Product | 41,351 | 48,895 | 298,966 | 250,185 | ||||||||||||||||||||||
| Support and service | 400,934 | 367,063 | 1,233,067 | 1,109,379 | ||||||||||||||||||||||
| Total cost of revenue | 442,285 | 415,958 | 1,532,033 | 1,359,564 | ||||||||||||||||||||||
| Gross profit | $ | 2,841,184 | $ | 4,020,442 | $ | 8,838,509 | $ | 9,756,635 | ||||||||||||||||||
| Operating expenses: | ||||||||||||||||||||||||||
| Research and development costs | 711,273 | 600,430 | 2,032,360 | 1,809,354 | ||||||||||||||||||||||
| Selling and marketing | 1,610,635 | 1,026,241 | 4,267,010 | 3,027,372 | ||||||||||||||||||||||
| General and administrative | 633,954 | 358,701 | 2,129,921 | 2,297,451 | ||||||||||||||||||||||
| Gain on litigation settlement | (632,600) | — | (632,600) | — | ||||||||||||||||||||||
| Restructuring costs | 68,704 | 317,595 | 792,754 | 758,740 | ||||||||||||||||||||||
| Total operating expenses | 2,391,966 | 2,302,967 | 8,589,445 | 7,892,917 | ||||||||||||||||||||||
| Operating income (loss) | 449,218 | 1,717,475 | 249,064 | 1,863,718 | ||||||||||||||||||||||
| Gain on debt extinguishment | — | — | 754,000 | — | ||||||||||||||||||||||
| Interest and other expense | (58,257) | (159,994) | (489,264) | (586,082) | ||||||||||||||||||||||
| Income (loss) before income taxes | 390,961 | 1,557,481 | 513,800 | 1,277,636 | ||||||||||||||||||||||
| Income tax expense (benefit) | 16,529 | 11,272 | 63,804 | 44,709 | ||||||||||||||||||||||
| Net income (loss) | $ | 374,432 | $ | 1,546,209 | $ | 449,996 | $ | 1,232,927 | ||||||||||||||||||
| Less: Accrual of Series A redeemable convertible preferred stock dividends | 288,802 | 266,007 | 848,898 | 812,362 | ||||||||||||||||||||||
| Less: Accretion to redemption value of Series A redeemable convertible preferred stock | 13,517 | 175,335 | 285,814 | 366,566 | ||||||||||||||||||||||
| Net income (loss) attributable to common stockholders | $ | 72,113 | $ | 1,104,867 | $ | (684,716) | $ | 53,999 | ||||||||||||||||||
| Basic net income (loss) per share attributable to common stockholders | $ | 0.01 | $ | 0.19 | $ | (0.11) | $ | 0.01 | ||||||||||||||||||
| Diluted net income (loss) per share attributable to common stockholders | $ | 0.01 | $ | 0.19 | $ | (0.11) | $ | 0.01 | ||||||||||||||||||
| Weighted average basic shares outstanding | 6,990,723 | 5,919,837 | 6,324,370 | 5,919,773 | ||||||||||||||||||||||
| Weighted average diluted shares outstanding | 7,039,421 | 5,959,385 | 6,324,370 | 5,943,794 | ||||||||||||||||||||||
5
FalconStor Software, Inc. and Subsidiaries
Reconciliation of GAAP to Non-GAAP Financial Measures
(Unaudited)
| Three Months Ended September 30, | Nine Months Ended September 30, | |||||||||||||||||||||||||
| 2021 | 2020 | 2021 | 2020 | |||||||||||||||||||||||
| GAAP income (loss) from operations | $ | 449,218 | $ | 1,717,475 | $ | 249,064 | $ | 1,863,718 | ||||||||||||||||||
| Non-cash stock option expense (1) | 4,916 | 3,822 | $ | 14,084 | $ | 11,392 | ||||||||||||||||||||
| Restructuring costs (3) | 68,704 | 317,595 | 792,754 | 758,740 | ||||||||||||||||||||||
| Gain on litigation settlement (5) | $ | (632,600) | $ | — | $ | (632,600) | $ | — | ||||||||||||||||||
| Non-GAAP income (loss) from operations | $ | (109,762) | $ | 2,038,892 | $ | 423,302 | $ | 2,633,850 | ||||||||||||||||||
| GAAP net income (loss) attributable to common stockholders | $ | 72,113 | $ | 1,104,867 | $ | (684,716) | $ | 53,999 | ||||||||||||||||||
| Non-cash stock option expense, net of income taxes (2) | 4,916 | 3,822 | 14,084 | 11,392 | ||||||||||||||||||||||
| Restructuring costs (3) | 68,704 | 317,595 | 792,754 | 758,740 | ||||||||||||||||||||||
| Gain on litigation settlement | (632,600) | — | (632,600) | — | ||||||||||||||||||||||
| Gain on debt extinguishment | — | — | (754,000) | — | ||||||||||||||||||||||
| Effects of Series A redeemable convertible preferred stock (4) | 302,319 | 441,342 | 1,134,712 | 1,178,928 | ||||||||||||||||||||||
| Non-GAAP net income (loss) attributable to common stockholders | $ | (184,548) | $ | 1,867,626 | $ | (129,766) | $ | 2,003,059 | ||||||||||||||||||
| GAAP gross margin | 87 | % | 91 | % | 85 | % | 88 | % | ||||||||||||||||||
| Non-cash stock option expense (1) | 0 | % | 0 | % | 0 | % | 0 | % | ||||||||||||||||||
| Non-GAAP gross margin | 87 | % | 91 | % | 85 | % | 88 | % | ||||||||||||||||||
| GAAP gross margin - Product | 97 | % | 98 | % | 94 | % | 95 | % | ||||||||||||||||||
| Non-cash stock option expense (1) | 0 | % | 0 | % | 0 | % | 0 | % | ||||||||||||||||||
| Non-GAAP gross margin - Product | 97 | % | 98 | % | 94 | % | 95 | % | ||||||||||||||||||
| GAAP gross margin - Support and Service | 77 | % | 81 | % | 76 | % | 81 | % | ||||||||||||||||||
| Non-cash stock option expense (1) | 0 | % | 0 | % | 0 | % | 0 | % | ||||||||||||||||||
| Non-GAAP gross margin - Support and Service | 77 | % | 81 | % | 76 | % | 81 | % | ||||||||||||||||||
| GAAP operating margin | 14 | % | 39 | % | 2 | % | 17 | % | ||||||||||||||||||
| Non-cash stock option expense (1) | — | % | — | % | — | % | — | % | ||||||||||||||||||
| Restructuring costs (3) | 2 | % | 7 | % | 8 | % | 7 | % | ||||||||||||||||||
| Non-GAAP operating margin | 16 | % | 46 | % | 10 | % | 24 | % | ||||||||||||||||||
| GAAP Basic EPS | $ | 0.01 | $ | 0.19 | $ | (0.11) | $ | 0.01 | ||||||||||||||||||
| Non-cash stock option expense, net of income taxes (2) | 0.00 | 0.00 | 0.00 | 0.00 | ||||||||||||||||||||||
| Restructuring costs (3) | 0.01 | 0.05 | 0.13 | 0.13 | ||||||||||||||||||||||
6
| Gain on litigation settlement (5) | (0.09) | 0.00 | (0.10) | 0.00 | ||||||||||||||||||||||
| Gain on debt extinguishment (6) | 0.00 | 0.00 | (0.12) | 0.00 | ||||||||||||||||||||||
| Effects of Series A redeemable convertible preferred stock (4) | 0.04 | 0.08 | 0.18 | 0.20 | ||||||||||||||||||||||
| Non-GAAP Basic EPS | $ | (0.03) | $ | 0.32 | $ | (0.02) | $ | 0.34 | ||||||||||||||||||
| GAAP Diluted EPS | $ | 0.01 | $ | 0.19 | $ | (0.11) | $ | 0.01 | ||||||||||||||||||
| Non-cash stock option expense, net of income taxes (2) | 0.00 | 0.00 | 0.00 | 0.00 | ||||||||||||||||||||||
| Restructuring costs (3) | 0.01 | 0.05 | 0.13 | 0.13 | ||||||||||||||||||||||
| Gain on litigation settlement (5) | (0.09) | 0.00 | (0.10) | 0.00 | ||||||||||||||||||||||
| Gain on debt extinguishment (6) | 0.00 | 0.00 | (0.12) | 0.00 | ||||||||||||||||||||||
| Effects of Series A redeemable convertible preferred stock (4) | 0.04 | 0.07 | 0.18 | 0.20 | ||||||||||||||||||||||
| Non-GAAP Diluted EPS | $ | (0.03) | $ | 0.31 | $ | (0.02) | $ | 0.34 | ||||||||||||||||||
| Weighted average basic shares outstanding (GAAP and Non-GAAP) | 6,990,723 | 5,919,837 | 6,324,370 | 5,919,773 | ||||||||||||||||||||||
| Weighted average diluted shares outstanding (GAAP) | 7,039,421 | 5,959,385 | 6,324,370 | 5,943,794 | ||||||||||||||||||||||
| Weighted average diluted shares outstanding (Non-GAAP) | 6,990,723 | 5,959,385 | 6,324,370 | 5,943,794 | ||||||||||||||||||||||
Footnotes:
(1)Represents non-cash, stock-based compensation charges as follows:
| Three Months Ended September 30, | Nine Months Ended September 30, | |||||||||||||||||||||||||
| 2021 | 2020 | 2021 | 2020 | |||||||||||||||||||||||
| Cost of revenue - Product | $ | 232 | $ | — | $ | 688 | $ | — | ||||||||||||||||||
| Cost of revenue - Support and Service | 185 | 104 | 549 | 310 | ||||||||||||||||||||||
| Research and development costs | 167 | 433 | 167 | 1,289 | ||||||||||||||||||||||
| Selling and marketing | 2,915 | 186 | 8,475 | 554 | ||||||||||||||||||||||
| General and administrative | 1,417 | 3,099 | 4,205 | 9,239 | ||||||||||||||||||||||
| Total non-cash stock based compensation expense | $ | 4,916 | $ | 3,822 | $ | 14,084 | $ | 11,392 | ||||||||||||||||||
(2)Represents the effects of non-cash stock-based compensation expense recognized, net of related income tax effects. For the three and nine months ended September 30, 2021 and 2020, the tax expense for both GAAP and Non-GAAP basis approximate the same amount.
(3)Represents restructuring costs which were incurred during each respective period presented.
(4)Represents the effects of the accretion to redemption value of the Series A redeemable convertible preferred stock, accrual of Series A redeemable convertible preferred stock dividends and deemed dividend on Series A redeemable convertible preferred stock.
(5)Represents a gain for the legal settlement of a contractual dispute with a marketing/sales firm.
(6)Represents the gain recorded when the Company's loan with the Paycheck Protection Program under the Coronavirus Aid, Relief, and Economic Security Act was forgiven on March 30, 2021.
7
Serious News for Serious Traders! Try StreetInsider.com Premium Free!
You May Also Be Interested In
- Astellas' XTANDI™ (Enzalutamide) Granted European Commission Approval for Use in Additional Recurrent Early Prostate Cancer Treatment Setting
- Mirasol Resources Closes First Tranche of Private Placement
- Bragar Eagel & Squire, P.C. Reminds Investors That Class Action Lawsuits Have Been Filed Against Ocugen, QuidelOrtho, and Sharecare and Encourages Investors to Contact the Firm
Create E-mail Alert Related Categories
SEC FilingsSign up for StreetInsider Free!
Receive full access to all new and archived articles, unlimited portfolio tracking, e-mail alerts, custom newswires and RSS feeds - and more!
