

Form 8-K 3D SYSTEMS CORP For: Nov 08
 Tweet
Tweet Share
ShareEXHIBIT 99.1
3D Systems Reports Third Quarter 2021 Financial Results
ROCK HILL, S.C., Nov. 08, 2021 (GLOBE NEWSWIRE) -- 3D Systems Corporation (NYSE: DDD) announced today its financial results for the third quarter ended September 30, 2021.
Third Quarter Financial and Operational Results
- Revenue of $156.1 million reflects double-digit growth versus third quarter 2020
- Revenue adjusted for divestitures(1) was 35.9% higher and 21.2% higher than third quarter 2020 and pre-pandemic third quarter 2019, respectively – reflecting the continued strong growth momentum of the business
- Increasing revenue and sustained cost management drove strong profitability, with adjusted EBITDA margin of 10.5%; diluted GAAP earnings per share of $2.34, which includes gains from divestitures, and diluted Non-GAAP earnings per share of $0.08(1)
- Financial performance yielded positive operating cash flow of $20.7 million, the fourth consecutive quarter of positive cash flow from operations
- Closed on previously announced divestitures, increasing cash on the balance sheet to $502.8 million with no debt
- Two recently announced acquisitions, Oqton, closed on November 1, and Volumetric Biotechnologies, anticipated to close in the fourth quarter 2021, are expected to position the company for continued high-margin growth
| Quarter Ended September 30, | ||||||||||
| (in millions, expect per share data) | 2021 | 2020 | ||||||||
| Revenue | $ | 156.1 | $ | 136.2 | ||||||
| Operating loss | $ | (17.2 | ) | $ | (67.6 | ) | ||||
| Net income (loss) | $ | 292.7 | $ | (72.9 | ) | |||||
| Net income (loss) per share - basic | $ | 2.39 | $ | (0.61 | ) | |||||
| Net income (loss) per share - diluted | $ | 2.34 | $ | (0.61 | ) | |||||
| Non-GAAP measures for year-over-year comparisons (1) | ||||||||||
| Non-GAAP operating income (loss) | $ | 10.6 | $ | — | ||||||
| Non-GAAP net income (loss) | $ | 10.0 | $ | (4.1 | ) | |||||
| Non-GAAP income (loss) per share - basic | $ | 0.08 | $ | (0.03 | ) | |||||
| Non-GAAP income (loss) per share - diluted | $ | 0.08 | $ | (0.03 | ) | |||||
| Adjusted EBITDA | $ | 16.3 | $ | 7.2 | ||||||
(1) See Appendix for reconciliation of non-GAAP to GAAP measures
Summary Comments on Results
Commenting on the results, President and Chief Executive Officer, Dr. Jeffrey Graves said, “In the third quarter last year we experienced the beginnings of a recovery from the depths of the COVID-19 pandemic. Businesses were opening up, and customers were returning. A year later, global economies are much stronger. We still see continued challenges with COVID-19, and new challenges around supply chains, but thanks to the great work by our team here at 3D Systems, we are pleased to report another strong quarter of double-digit growth as compared to the same period in both 2020 and pre-pandemic 2019, adjusted for divestitures. While we were delivering these results through our core portfolio of business, we also completed our divestitures of non-core assets and began the transition to a strategic growth phase. Our focus during this phase is investing in significant opportunities that we believe will drive high-margin recurring revenue, as evidenced by our acquisition in the software space of Oqton, and the hiring of a new Chief Scientist to further advance our technology development. More recently we made two announcements in the exciting area of regenerative medicine: the acquisition of Volumetric Biotechnologies and the expansion of our development agreement with United Therapeutics to include two additional human organs. The acquisition brings unique biological talent to our organization, including a new Chief Scientist for Regenerative Medicine, that we believe will allow us to expand and accelerate our growth in human and laboratory applications for bioprinting. These investments in software, products platforms, and regenerative medicine compliment an existing business portfolio that generated $20.7 million in cash from operations during the third quarter to bolster a balance sheet that boasted $503 million of cash, ready to support additional growth.”
Dr. Graves summarized, “I couldn’t be more pleased with our performance this quarter, both organic and inorganic. We will continue to focus investment in areas that we believe solve customers’ complex needs, drive adoption of additive manufacturing, and generate high margin, recurring revenue streams.”
Summary of Third Quarter Results
Revenue for the third quarter of 2021 increased 14.6% to $156.1 million compared to the same period last year and increased 35.9% when excluding businesses divested in 2020 and 2021. The results reflect ongoing strength in Industrial, which had revenue growth of 4.0% to $79.7 million compared to the same period last year. Adjusted for divestitures, Industrial revenue increased 28.1% year-over-year.
Revenue from Healthcare increased 28.3% to $76.4 million, compared to the same period last year. Adjusted for divestitures, Healthcare revenue increased 44.5% year-over-year, as we saw high demand for dental applications, both printers and materials.
Gross profit margin in the third quarter of 2021 was 41.2% compared to 43.1% in the same period last year. Non-GAAP gross profit margin was 41.5% compared to 43.2% in the same period last year. Gross profit margin decreased primarily as a result of businesses divested in 2020 and 2021. Excluding the impact of divestitures, gross profit margin increased 80 basis points in the third quarter of 2021 compared to the same period last year.
Operating expenses decreased 35.4% to $81.5 million in the third quarter of 2021, compared to the same period a year ago, primarily as a result of an impairment to goodwill recorded in the third quarter 2020. On a non-GAAP basis, operating expenses were $54.1 million, an 8.0% decrease from the third quarter of the prior year. The lower non-GAAP operating expenses reflect savings achieved from cost restructuring activities and divestitures, partly offset by spending in targeted areas to support future growth.
2021 Gross Profit Margin Outlook
Updating prior guidance, on a non-GAAP basis the company expects 2021 gross profit margins to be between 41% and 43%.
Financial Liquidity
At September 30, 2021, the company had cash on hand of $502.8 million and no debt. Cash has increased $418.4 million since December 31, 2020, driven primarily by net proceeds from divestitures of $427.3 million and cash generated from operations of $62.7 million, partially offset by capital expenditures and repayment of debt.
Q3 2021 Conference Call and Webcast
3D Systems expects to file its Quarterly Report on Form 10-Q for the quarter ended September 30, 2021 with the Securities and Exchange Commission today, November 8, 2021. The company will host a conference call and simultaneous webcast to discuss these results tomorrow morning, which may be accessed as follows:
Date: Tuesday, November 9, 2021
Time: 8:30 a.m. Eastern Time
Listen via webcast: www.3dsystems.com/investor
Participate via telephone: 201-689-8345
A replay of the webcast will be available approximately two hours after the live presentation at www.3dsystems.com/investor.
Forward-Looking Statements
Certain statements made in this release that are not statements of historical or current facts are forward-looking statements within the meaning of the Private Securities Litigation Reform Act of 1995. Forward-looking statements involve known and unknown risks, uncertainties and other factors that may cause the actual results, performance or achievements of the company to be materially different from historical results or from any future results or projections expressed or implied by such forward-looking statements. In many cases, forward looking statements can be identified by terms such as “believes,” “belief,” “expects,” “may,” “will,” “estimates,” “intends,” “anticipates” or “plans” or the negative of these terms or other comparable terminology. Forward-looking statements are based upon management’s beliefs, assumptions and current expectations and may include comments as to the company’s beliefs and expectations as to future events and trends affecting its business and are necessarily subject to uncertainties, many of which are outside the control of the company. The factors described under the headings “Forward-Looking Statements” and “Risk Factors” in the company’s periodic filings with the Securities and Exchange Commission, as well as other factors, could cause actual results to differ materially from those reflected or predicted in forward-looking statements. Although management believes that the expectations reflected in the forward-looking statements are reasonable, forward-looking statements are not, and should not be relied upon as a guarantee of future performance or results, nor will they necessarily prove to be accurate indications of the times at which such performance or results will be achieved. The forward-looking statements included are made only as the date of the statement. 3D Systems undertakes no obligation to update or revise any forward-looking statements made by management or on its behalf, whether as a result of future developments, subsequent events or circumstances or otherwise, except as required by law.
Presentation of Information in this Press Release
3D Systems reports is financial results in accordance with GAAP. To facilitate a better understanding of the impact that strategic acquisitions, non-recurring charges and certain non-cash expenses had on its financial results, management reviews certain non-GAAP measures, including non-GAAP revenue, non-GAAP revenue adjusted for divestitures, non-GAAP Cost of Sales, non-GAAP Operating Income, non-GAAP Net Income (Loss), non-GAAP Basic and Diluted Income (Loss) per Share, non-GAAP Gross Profit, non-GAAP Gross Profit Margin, non-GAAP Gross Profit Margin adjusted for divestitures, non-GAAP SG&A Expenses, non-GAAP R&D, non-GAAP Other Income and Expense and non-GAAP Operating Expenses, each of which exclude the impact of amortization of intangibles, acquisition and severance expenses, stock-based compensation expense, litigation settlements and charges related to strategic decisions and portfolio realignment, and Adjusted EBITDA, defined as non-GAAP Operating Income plus depreciation, and Adjusted EBITDA Margin, defined as Adjusted EBITDA divided by revenue, to better evaluate period-over-period performance. A reconciliation of GAAP to non-GAAP results is provided in the accompanying schedule.
3D Systems does not provide forward-looking guidance on a GAAP basis. The company is unable to provide a quantitative reconciliation of these forward-looking non-GAAP measures to the most directly comparable forward-looking GAAP measures without unreasonable effort because 3D Systems cannot reliably forecast legal, acquisition and divestiture expenses, restructuring expenses, product end of life adjustments and goodwill impairment, which are difficult to predict and estimate. These items are inherently uncertain and depend on various factors, many of which are beyond the company’s control, and as such, any associated estimate and its impact on GAAP performance could vary materially.
About 3D Systems
More than 30 years ago, 3D Systems brought the innovation of 3D printing to the manufacturing industry. Today, as the leading Additive Manufacturing solutions partner, we bring innovation, performance, and reliability to every interaction - empowering our customers to create products and business models never before possible. Thanks to our unique offering of hardware, software, materials and services, each application-specific solution is powered by the expertise of our application engineers who collaborate with customers to transform how they deliver their products and services. 3D Systems’ solutions address a variety of advanced applications in Healthcare and Industrial markets such as Medical and Dental, Aerospace & Defense, Automotive and Durable Goods. More information on the company is available at www.3dsystems.com
| Investor Contact: | [email protected] |
| Media Contact: | [email protected] |
Tables Follow
3D Systems Corporation
Unaudited Condensed Consolidated Balance Sheets
September 30, 2021 and December 31, 2020
| (In thousands, except par value) | September 30, 2021 (unaudited) | December 31, 2020 | |||||||
| ASSETS | |||||||||
| Current assets: | |||||||||
| Cash and cash equivalents | $ | 502,752 | $ | 75,010 | |||||
| Accounts receivable, net of reserves — $3,470 and $4,392 | 89,926 | 114,254 | |||||||
| Inventories | 89,325 | 116,667 | |||||||
| Prepaid expenses and other current assets | 25,963 | 33,145 | |||||||
| Current assets held for sale | — | 18,439 | |||||||
| Total current assets | 707,966 | 357,515 | |||||||
| Property and equipment, net | 57,720 | 75,356 | |||||||
| Intangible assets, net | 30,251 | 28,083 | |||||||
| Goodwill | 139,906 | 161,765 | |||||||
| Right of use assets | 44,514 | 48,620 | |||||||
| Deferred income tax asset | 3,475 | 6,247 | |||||||
| Assets held for sale | — | 31,684 | |||||||
| Other assets | 21,271 | 23,785 | |||||||
| Total assets | $ | 1,005,103 | $ | 733,055 | |||||
| LIABILITIES AND EQUITY | |||||||||
| Current liabilities: | |||||||||
| Current portion of long-term debt | $ | — | $ | 2,051 | |||||
| Current right of use liabilities | 8,176 | 9,534 | |||||||
| Accounts payable | 44,946 | 45,174 | |||||||
| Accrued and other liabilities | 78,152 | 69,812 | |||||||
| Customer deposits | 9,405 | 7,750 | |||||||
| Deferred revenue | 27,509 | 30,302 | |||||||
| Current liabilities held for sale | — | 11,107 | |||||||
| Total current liabilities | 168,188 | 175,730 | |||||||
| Long-term debt, net of deferred financing costs | — | 19,218 | |||||||
| Long-term right of use liabilities | 45,533 | 48,469 | |||||||
| Deferred income tax liability | 3,142 | 4,716 | |||||||
| Liabilities held for sale | — | 2,952 | |||||||
| Other liabilities | 39,090 | 51,247 | |||||||
| Total liabilities | 255,953 | 302,332 | |||||||
| Commitments and contingencies (Note 14) | |||||||||
| Stockholders’ equity: | |||||||||
| Common stock, $0.001 par value, authorized 220,000 shares; issued 126,758 and 127,626 | 127 | 128 | |||||||
| Additional paid-in capital | 1,410,576 | 1,404,964 | |||||||
| Treasury stock, at cost — 1,623 shares and 3,494 shares | (10,492 | ) | (22,590 | ) | |||||
| Accumulated deficit | (615,051 | ) | (943,303 | ) | |||||
| Accumulated other comprehensive loss | (36,010 | ) | (8,476 | ) | |||||
| Total stockholders’ equity | 749,150 | 430,723 | |||||||
| Total liabilities and stockholders’ equity | $ | 1,005,103 | $ | 733,055 | |||||
3D Systems Corporation
Unaudited Condensed Consolidated Statements of Operations
Quarter Ended September 30, 2021 and 2020
| Quarter Ended September 30, | |||||||||
| (in thousands, except per share amounts) | 2021 | 2020 | |||||||
| Revenue: | |||||||||
| Products | $ | 108,884 | $ | 78,296 | |||||
| Services | 47,212 | 57,880 | |||||||
| Total revenue | 156,096 | 136,176 | |||||||
| Cost of sales: | |||||||||
| Products | 64,252 | 48,213 | |||||||
| Services | 27,529 | 29,336 | |||||||
| Total cost of sales | 91,781 | 77,549 | |||||||
| Gross profit | 64,315 | 58,627 | |||||||
| Operating expenses: | |||||||||
| Selling, general and administrative | 65,737 | 59,065 | |||||||
| Research and development | 15,786 | 18,866 | |||||||
| Impairment of goodwill | — | 48,300 | |||||||
| Total operating expenses | 81,523 | 126,231 | |||||||
| Loss from operations | (17,208 | ) | (67,604 | ) | |||||
| Interest and other income (expense), net | 315,859 | (2,419 | ) | ||||||
| Income (loss) before income taxes | 298,651 | (70,023 | ) | ||||||
| Benefit (provision) for income taxes | (5,995 | ) | (2,866 | ) | |||||
| Net income (loss) | $ | 292,656 | $ | (72,889 | ) | ||||
| Net income (loss) per common share: | |||||||||
| Basic | $ | 2.39 | $ | (0.61 | ) | ||||
| Diluted | $ | 2.34 | $ | (0.61 | ) | ||||
| Weighted average shares outstanding: | |||||||||
| Basic | 122,663 | 118,527 | |||||||
| Diluted | 125,289 | 118,527 | |||||||
3D Systems Corporation
Unaudited Condensed Consolidated Statements of Cash Flows
Nine Months Ended September 30, 2021 and 2020
| Nine Months Ended September 30, | |||||||||
| (in thousands) | 2021 | 2020 | |||||||
| Cash flows from operating activities: | |||||||||
| Net income (loss) | $ | 328,252 | $ | (129,764 | ) | ||||
| Adjustments to reconcile net income (loss) to net cash provided by (used in) operating activities: | |||||||||
| Depreciation and amortization | 26,292 | 34,830 | |||||||
| Stock-based compensation | 43,991 | 16,621 | |||||||
| Provision for inventory obsolescence and revaluation | 1,100 | 10,894 | |||||||
| Loss on hedge accounting de-designation and termination | 721 | 1,235 | |||||||
| Provision for bad debts | 620 | 1,039 | |||||||
| Gain on the disposition of businesses, property, equipment and other assets | (351,981 | ) | 434 | ||||||
| Provision for deferred income taxes and reserve adjustments | (9,380 | ) | — | ||||||
| Impairment of goodwill and assets | — | 54,072 | |||||||
| Changes in operating accounts: | |||||||||
| Accounts receivable | (2,151 | ) | 12,668 | ||||||
| Inventories | 7,095 | (23,987 | ) | ||||||
| Prepaid expenses and other current assets | 5,338 | (15,376 | ) | ||||||
| Accounts payable | 15,517 | (9,166 | ) | ||||||
| Deferred revenue and customer deposits | 5,401 | 2,714 | |||||||
| Accrued and other liabilities | (9,859 | ) | 6,309 | ||||||
| All other operating activities | 1,696 | 4,828 | |||||||
| Net cash provided by (used in) operating activities | 62,652 | (32,649 | ) | ||||||
| Cash flows from investing activities: | |||||||||
| Purchases of property and equipment | (14,814 | ) | (11,015 | ) | |||||
| Proceeds from sale of assets and businesses, net of cash | 427,664 | 552 | |||||||
| Business acquisitions, net of cash acquired | (10,936 | ) | — | ||||||
| Purchase of noncontrolling interest | (4,000 | ) | (12,500 | ) | |||||
| Other investing activities | (2,273 | ) | 504 | ||||||
| Net cash provided by (used in) investing activities | 395,641 | (22,459 | ) | ||||||
| Cash flows from financing activities: | |||||||||
| Proceeds from revolving credit facilities | — | 20,000 | |||||||
| Payments on revolving credit facilities | — | (20,000 | ) | ||||||
| Repayment of borrowings/long-term debt | (21,392 | ) | (26,547 | ) | |||||
| Proceeds from issuance of common stock | — | 25,003 | |||||||
| Proceeds from inventory financing agreements | — | 2,509 | |||||||
| Payments related to net-share settlement of stock-based compensation | (10,386 | ) | (5,034 | ) | |||||
| Other financing activities | (424 | ) | 296 | ||||||
| Net cash used in financing activities | (32,202 | ) | (3,773 | ) | |||||
| Effect of exchange rate changes on cash, cash equivalents and restricted cash | (7,737 | ) | 526 | ||||||
| Net increase (decrease) in cash, cash equivalents and restricted cash | 418,354 | (58,355 | ) | ||||||
| Cash, cash equivalents and restricted cash at the beginning of the period (a) | 84,711 | 134,617 | |||||||
| Cash, cash equivalents and restricted cash at the end of the period (a) | $ | 503,065 | $ | 76,262 | |||||
(a) The amounts for cash and cash equivalents shown above include restricted cash of $540 and $952 as of September 30, 2021 and 2020, respectively, and $998 and $9,161 as of December 31, 2020, and 2019, respectively, which were included in Other assets, net, and $9,161 as of December 31, 2020, which was included in Current assets held for sale in the condensed consolidated balance sheets.
3D Systems Corporation
Income (Loss) Per Share
Quarter Ended September 30, 2021 and 2020
| Quarter Ended September 30, | ||||||||
| (in thousands, except per share amounts) | 2021 | 2020 | ||||||
| Numerator: | ||||||||
| Net income (loss) | $ | 292,656 | $ | (72,889 | ) | |||
| Denominator: | ||||||||
| Weighted average shares - basic | 122,663 | 118,527 | ||||||
| Dilutive securities | 2,626 | — | ||||||
| Weighted average shares - diluted | 125,289 | 118,527 | ||||||
| Net income (loss) per share - basic | $ | 2.39 | $ | (0.61 | ) | |||
| Net income (loss) per share - diluted | $ | 2.34 | $ | (0.61 | ) | |||
Appendix
3D Systems Corporation
Unaudited Reconciliations of GAAP to Non-GAAP Measures
Quarter and Nine Months Ended September 30, 2021 and 2020
| Quarter Ended September 30, | Nine Months Ended September 30, | ||||||||||||||||||
| (in millions) | 2021 | 2020 | 2021 | 2020 | |||||||||||||||
| GAAP Revenue - as reported | $ | 156.1 | $ | 136.2 | $ | 464.8 | $ | 384.6 | |||||||||||
| Non-GAAP Revenue | 156.1 | 136.2 | 464.8 | 384.6 | |||||||||||||||
| GAAP Cost of sales - as reported | 91.8 | 77.5 | 267.2 | 233.7 | |||||||||||||||
| Amortization, stock-based compensation & other | — | 0.1 | 0.3 | 0.3 | |||||||||||||||
| Legal, acquisition and divestiture related | — | 0.1 | — | 0.3 | |||||||||||||||
| Cost optimization plan, including severance costs | — | — | — | 0.7 | |||||||||||||||
| Product end-of-life adjustment | 0.4 | — | — | 10.9 | |||||||||||||||
| Non-GAAP Cost of sales | 91.4 | 77.3 | 266.9 | 221.5 | |||||||||||||||
| GAAP Gross Profit - as reported | 64.3 | 58.7 | 197.6 | 150.9 | |||||||||||||||
| Amortization, stock-based compensation & other | — | 0.1 | 0.3 | 0.3 | |||||||||||||||
| Legal, acquisition and divestiture related | — | 0.1 | — | 0.3 | |||||||||||||||
| Cost optimization plan, including severance costs | — | — | — | 0.7 | |||||||||||||||
| Product end-of-life adjustment | 0.4 | — | — | 10.9 | |||||||||||||||
| Non-GAAP Gross Profit | 64.7 | 58.9 | 197.9 | 163.1 | |||||||||||||||
| GAAP Gross Profit Margin | 41.2 | % | 42.5 | % | |||||||||||||||
| Non-GAAP Gross Profit Margin | 41.5 | % | 43.2 | % | 42.6 | % | 42.4 | % | |||||||||||
| GAAP Selling, general and administrative - as reported | 65.7 | 59.1 | 176.8 | 167.2 | |||||||||||||||
| Amortization, stock-based compensation & other | 16.1 | 7.1 | 51.2 | 29.0 | |||||||||||||||
| Legal, acquisition and divestiture related | 11.4 | 0.1 | 13.6 | 0.4 | |||||||||||||||
| Cost optimization plan, including severance costs | — | 11.9 | 1.6 | 13.8 | |||||||||||||||
| Non-GAAP Selling, general and administrative | 38.3 | 40.0 | 110.5 | 123.9 | |||||||||||||||
| GAAP Research and development - as reported | 15.8 | 18.9 | 50.0 | 55.1 | |||||||||||||||
| Cost optimization plan, including severance costs | — | — | — | 0.1 | |||||||||||||||
| Non-GAAP Research and development | 15.8 | 18.9 | 50.0 | 55.0 | |||||||||||||||
| Goodwill impairment | — | 48.3 | — | 48.3 | |||||||||||||||
| GAAP Operating Expenses - as reported | 81.5 | 126.2 | 226.8 | 270.6 | |||||||||||||||
| Amortization, stock-based compensation & other | 16.1 | 7.1 | 51.2 | 29.0 | |||||||||||||||
| Legal, acquisition and divestiture related | 11.4 | 0.1 | 13.6 | 0.4 | |||||||||||||||
| Cost optimization plan, including severance costs | — | 11.9 | 1.6 | 14.0 | |||||||||||||||
| Goodwill impairment | — | 48.3 | — | 48.3 | |||||||||||||||
| Non-GAAP Operating expenses | 54.1 | 58.8 | 160.4 | 178.9 | |||||||||||||||
| GAAP Operating Income (loss) - as reported | (17.2 | ) | (67.6 | ) | (29.2 | ) | (119.7 | ) | |||||||||||
| Amortization, stock-based compensation & other | 16.1 | 7.2 | 51.5 | 29.3 | |||||||||||||||
| Legal, acquisition and divestiture related | 11.4 | 0.2 | 13.6 | 0.7 | |||||||||||||||
| Cost optimization plan, including severance costs | — | 11.9 | 1.6 | 14.7 | |||||||||||||||
| Product end-of-life adjustment | 0.4 | — | — | 10.9 | |||||||||||||||
| Goodwill impairment | — | 48.3 | — | 48.3 | |||||||||||||||
| Non-GAAP Operating Income (loss) | 10.6 | — | 37.5 | (15.8 | ) | ||||||||||||||
| Depreciation | 5.6 | 7.2 | 18.7 | 21.7 | |||||||||||||||
| Adjusted EBITDA | 16.3 | 7.2 | 56.2 | 5.9 | |||||||||||||||
| GAAP Other Income and expense, net - as reported | 315.9 | (2.4 | ) | 354.4 | (7.6 | ) | |||||||||||||
| Legal, acquisition and divestiture related | (315.5 | ) | 0.2 | (354.9 | ) | — | |||||||||||||
| Impairment of cost-method investments | — | 1.1 | — | 2.2 | |||||||||||||||
| Non-GAAP Other Income and expense, net | 0.3 | (1.2 | ) | (0.5 | ) | (5.4 | ) | ||||||||||||
| GAAP Net Income (loss) - as reported | 292.7 | (72.9 | ) | 328.3 | (129.8 | ) | |||||||||||||
| Amortization, stock-based compensation & other | 16.1 | 7.2 | 51.5 | 29.3 | |||||||||||||||
| Legal, acquisition and divestiture related(1) | (299.1 | ) | 0.4 | (336.2 | ) | 0.8 | |||||||||||||
| Cost optimization plan, including severance costs | — | 11.9 | 1.6 | 14.7 | |||||||||||||||
| Impairment of cost-method investments | — | 1.1 | — | 2.2 | |||||||||||||||
| Product end-of-life adjustment | 0.4 | — | — | 10.9 | |||||||||||||||
| Goodwill impairment | — | 48.3 | — | 48.3 | |||||||||||||||
| Non-GAAP Net Income (loss) | $ | 10.0 | $ | (4.1 | ) | $ | 45.1 | $ | (23.7 | ) | |||||||||
- Amounts in table may not foot due to rounding
(1) Legal Acquisition and divestiture includes 5.1 million of income tax provision related to divestitures for the quarter and nine months Ended September 30, 2021.
3D Systems Corporation
Unaudited Reconciliations of GAAP to Non-GAAP Measures
Quarter and Nine Months Ended September 30, 2021 and 2020
| Quarter Ended September 30, | Nine Months Ended September 30, | ||||||||||||||||||
| 2021 | 2020 | 2021 | 2020 | ||||||||||||||||
| GAAP Net income (loss) per share - basic | $ | 2.39 | $ | (0.61 | ) | $ | 2.69 | $ | (1.12 | ) | |||||||||
| Adjustments: | |||||||||||||||||||
| Amortization, stock-based compensation & other | 0.13 | 0.06 | 0.42 | 0.25 | |||||||||||||||
| Legal, acquisition and divestiture related | (2.44 | ) | — | (2.75 | ) | 0.01 | |||||||||||||
| Cost optimization plan, including severance costs | — | 0.10 | 0.01 | 0.13 | |||||||||||||||
| Impairment of cost-method investments | — | 0.01 | — | 0.02 | |||||||||||||||
| Product end-of-life adjustment | — | — | — | 0.09 | |||||||||||||||
| Goodwill impairment | — | 0.41 | — | 0.42 | |||||||||||||||
| Non-GAAP Net income (loss) per share - basic | $ | 0.08 | $ | (0.03 | ) | $ | 0.37 | $ | (0.20 | ) | |||||||||
| GAAP Net income (loss) per share - diluted | $ | 2.34 | $ | (0.61 | ) | $ | 2.63 | $ | (1.12 | ) | |||||||||
| Adjustments: | |||||||||||||||||||
| Amortization, stock-based compensation & other | 0.13 | 0.06 | 0.41 | 0.25 | |||||||||||||||
| Legal, acquisition and divestiture related | (2.39 | ) | — | (2.69 | ) | 0.01 | |||||||||||||
| Cost optimization plan, including severance costs | — | 0.10 | 0.01 | 0.13 | |||||||||||||||
| Impairment of cost-method investments | — | 0.01 | — | 0.02 | |||||||||||||||
| Product end-of-life adjustment | — | — | — | 0.09 | |||||||||||||||
| Goodwill impairment | — | 0.41 | — | 0.42 | |||||||||||||||
| Non-GAAP Net income (loss) per share - Diluted | $ | 0.08 | $ | (0.03 | ) | $ | 0.36 | $ | (0.20 | ) | |||||||||
- Amounts in table may not foot due to rounding
3D Systems Corporation
Unaudited Reconciliation of Prior Years Revenue Excluding Divestitures (non-GAAP)
2019, 2020 and 2021 by Quarter
| 2019 | |||||||||||||||
| Quarter Ended | |||||||||||||||
| (in millions) | March 31 | June 30 | September 30 | December 31 | |||||||||||
| Revenue | |||||||||||||||
| Healthcare | $ | 56.7 | $ | 63.2 | $ | 61.4 | $ | 63.3 | |||||||
| Industrial | 96.6 | 95.4 | 94.9 | 104.9 | |||||||||||
| Total Revenue | $ | 153.3 | $ | 158.6 | $ | 156.2 | $ | 168.2 | |||||||
| Revenue From Divestitures: | |||||||||||||||
| Healthcare | $ | 11.6 | $ | 12.4 | $ | 14.1 | $ | 15.1 | |||||||
| Industrial | 29.0 | 30.2 | 29.4 | 29.4 | |||||||||||
| Total Revenue | $ | 40.6 | $ | 42.6 | $ | 43.5 | $ | 44.4 | |||||||
| Total Revenue (Excl. Divest.): | |||||||||||||||
| Healthcare | $ | 45.1 | $ | 50.8 | $ | 47.3 | $ | 48.2 | |||||||
| Industrial | 67.5 | 65.2 | 65.5 | 75.6 | |||||||||||
| Total Revenue (Excl. Divest.): | $ | 112.6 | $ | 116.0 | $ | 112.7 | $ | 123.8 | |||||||
- Amounts in table may not foot due to rounding
| 2020 | |||||||||||||||||||||
| Quarter Ended | |||||||||||||||||||||
| (in millions) | March 31 | June 30 | September 30 | December 31 | |||||||||||||||||
| Revenue | |||||||||||||||||||||
| Healthcare | $ | 52.3 | $ | 49.1 | $ | 59.5 | $ | 85.5 | |||||||||||||
| Industrial | 83.3 | 63.6 | 76.7 | 87.1 | |||||||||||||||||
| Total Revenue | $ | 135.6 | $ | 112.8 | $ | 136.2 | $ | 172.7 | |||||||||||||
| Revenue From Divestitures: | |||||||||||||||||||||
| Healthcare | $ | 12.2 | $ | 11.7 | $ | 11.9 | $ | 14.6 | |||||||||||||
| Industrial | 24.8 | 21.1 | 23.6 | 24.6 | |||||||||||||||||
| Total Revenue | $ | 37.0 | $ | 32.8 | $ | 35.6 | $ | 39.3 | |||||||||||||
| Total Revenue (Excl. Divest.): | |||||||||||||||||||||
| Healthcare | $ | 40.1 | $ | 37.4 | $ | 47.6 | $ | 70.9 | |||||||||||||
| Industrial | 58.6 | 42.6 | 53.1 | 62.5 | |||||||||||||||||
| Total Revenue (Excl. Divest.): | $ | 98.6 | $ | 80.0 | $ | 100.6 | $ | 133.4 | |||||||||||||
- Amounts in table may not foot due to rounding
| 2021 | ||||||||||||||||
| Quarter Ended | ||||||||||||||||
| (in millions) | March 31 | June 30 | September 30 | |||||||||||||
| Revenue | ||||||||||||||||
| Healthcare | $ | 72.5 | $ | 82.8 | $ | 76.4 | ||||||||||
| Industrial | 73.6 | 79.7 | 79.7 | |||||||||||||
| Total Revenue | $ | 146.1 | $ | 162.6 | $ | 156.1 | ||||||||||
| Revenue From Divestitures: | ||||||||||||||||
| Healthcare | $ | 11.0 | $ | 13.1 | $ | 7.7 | ||||||||||
| Industrial | 13.8 | 13.1 | 11.8 | |||||||||||||
| Total Revenue | $ | 24.8 | $ | 26.3 | $ | 19.4 | ||||||||||
| Total Revenue (Excl. Divest.): | ||||||||||||||||
| Healthcare | $ | 61.5 | $ | 69.7 | $ | 68.7 | ||||||||||
| Industrial | 59.8 | 66.6 | 67.9 | |||||||||||||
| Total Revenue (Excl. Divest.): | $ | 121.3 | $ | 136.3 | $ | 136.7 | ||||||||||
3D Systems Corporation
Unaudited Gross Profit Margin Adjusted for Divestitures (non-GAAP)
Third Quarter 2020 and 2021
| Quarter Ended September 30, 2021 | ||||||||||||
| (in millions) | Pre-Divestiture | Divested Business | Post-Divestiture | |||||||||
| Revenue | 156.1 | 19.4 | 136.7 | |||||||||
| COGS | 91.4 | 10.0 | 81.4 | |||||||||
| Gross Profit | $ | 64.7 | $ | 9.4 | $ | 55.3 | ||||||
| Gross Profit Margin | 41.4 | % | 40.5 | % | ||||||||
- Amounts in table may not foot due to rounding
| Quarter Ended September 30, 2020 | ||||||||||||
| (in millions) | Pre-Divestiture | Divested Business | Post-Divestiture | |||||||||
| Revenue | 136.2 | 35.6 | 100.6 | |||||||||
| COGS | 77.3 | 16.6 | 60.7 | |||||||||
| Gross Profit | $ | 58.9 | $ | 19.0 | $ | 39.9 | ||||||
| Gross Profit Margin | 43.2 | % | 39.7 | % | ||||||||
EXHIBIT 99.2

©2021 3D Systems, Inc. | All Rights Reserved. Third Quarter 202 1 Financial Results November 9 , 2021 EXHIBIT 99.2

©2021 3D Systems, Inc. | All Rights Reserved. 2 Welcome and Participants Dr. Jeffrey Graves President and Chief Executive Officer Jagtar Narula Executive VP and Chief Financial Officer Andrew Johnson Executive VP and Chief Legal Officer John Nypaver , Jr. VP , Treasurer and Investor Relations To participate via phone, please dial: 1 - 201 - 689 - 8345 ©2021 3D Systems, Inc. | All Rights Reserved.
©2021 3D Systems, Inc. | All Rights Reserved. Certain statements made in this release that are not statements of historical or current facts are forward - looking statements within the meaning of the Private Securities Litigation Reform Act of 1995 . Forward - looking statements involve known and unknown risks, uncertainties and other factors that may cause the actual results, performance or achievements of the company to be materially different from historical results or from any future results or projections expressed or implied by such forward - looking statements . In many cases, forward looking statements can be identified by terms such as “believes,” “belief,” “expects,” “may,” “will,” “estimates,” “intends,” “anticipates” or “plans” or the negative of these terms or other comparable terminology . Forward - looking statements are based upon management’s beliefs, assumptions and current expectations and may include comments as to the company’s beliefs and expectations as to future events and trends affecting its business and are necessarily subject to uncertainties, many of which are outside the control of the company . The factors described under the headings “Forward - Looking Statements” and “Risk Factors” in the company’s periodic filings with the Securities and Exchange Commission, as well as other factors, could cause actual results to differ materially from those reflected or predicted in forward - looking statements . Although management believes that the expectations reflected in the forward - looking statements are reasonable, forward - looking statements are not, and should not be relied upon as a guarantee of future performance or results, nor will they necessarily prove to be accurate indications of the times at which such performance or results will be achieved . The forward - looking statements included are made only as the date of the statement . 3 D Systems undertakes no obligation to update or revise any forward - looking statements made by management or on its behalf, whether as a result of future developments, subsequent events or circumstances or otherwise, except as required by law Further, we encourage you to review “Risk Factors” in Part 1 of our Annual Report on Form 10 - K and Part II of our Quarterly Reports on Form 10 - Q filed with the SEC as well as other information about us in our filings with the SEC . These are available at www . SEC . gov . 3 Forward Looking Statements

©2021 3D Systems, Inc. | All Rights Reserved. Dr. Jeffrey Graves President & Chief Executive Officer 4

©2021 3D Systems, Inc. | All Rights Reserved. Oqton AI - Powered Manufacturing Operating System

©2021 3D Systems, Inc. | All Rights Reserved. 6 Focus High Value Growth Markets with Significant Barriers to Entry Industrial Solutions Healthcare Solutions Group Bioprinting (Laboratories) Regenerative Medicine (Humans) 4 Non - Core Businesses (Exited) Printers Materials Software 1986 – 2020 JULY 2020 2021 AND BEYOND 3D Systems: Company Rebirth for an Even Stronger Future Reorganized, Lean, Focused, Growing and Profitable Cash Generating with Excellent Balance Sheet to Support Future Growth Investments Digital Manufacturing Software

©2021 3D Systems, Inc. | All Rights Reserved. Healthcare Solutions 7 Anatomical Models (since 1994) Surgical Planning (since 2005) Patient - Specific Instruments/Guides (since 2007) Patient - Specific & Stock Implants (since 2010) Relative Size of Market Hardware Materials Services Software Enabling technologies fuel healthcare application growth Unrivaled capabilities Best foundation for growth into new frontiers

©2021 3D Systems, Inc. | All Rights Reserved. Healthcare Solutions Broadest range of FDA - cleared capabilities for anatomic modeling and surgical planning Development and manufacturing services that support 100+ products from head to toe

©2021 3D Systems, Inc. | All Rights Reserved. 9 Recognized Leaders in Biomaterials and Bioprinting
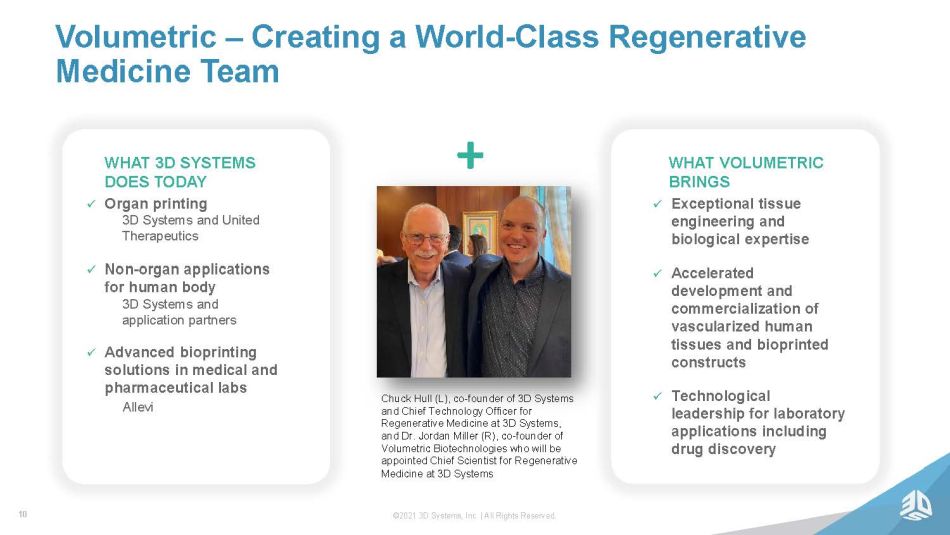
©2021 3D Systems, Inc. | All Rights Reserved. 10 Volumetric – Creating a World - Class Regenerative Medicine Team x Organ printing 3D Systems and United Therapeutics x Non - organ applications for human body 3D Systems and application partners x Advanced bioprinting solutions in medical and pharmaceutical labs Allevi WHAT 3D SYSTEMS DOES TODAY WHAT VOLUMETRIC BRINGS x Exceptional tissue engineering and biological expertise x Accelerated development and commercialization of vascularized human tissues and bioprinted constructs x Technological leadership for laboratory applications including drug discovery + Chuck Hull (L), co - founder of 3D Systems and Chief Technology Officer for Regenerative Medicine at 3D Systems, and Dr. Jordan Miller (R), co - founder of Volumetric Biotechnologies who will be appointed Chief Scientist for Regenerative Medicine at 3D Systems

©2021 3D Systems, Inc. | All Rights Reserved. Jagtar Narula Executive VP & Chief Financial Officer 11

©2021 3D Systems, Inc. | All Rights Reserved. 12 Q 3 Summary * See Appendix for reconciliation of GAAP and non - GAAP operating loss, net loss and net loss per share. HIGHLIGHTS Q 3 Revenue increase d 35.9% and 21.2 % excluding divested business vs. Q3:20 and Q3:19, respectively Fourth consecutive quarter of YoY revenue growth and profitability (on a non - GAAP basis) Adjusted EBITDA more than doubled from Q3:20 QUARTER - ENDED SEPT 30, (IN MILLIONS, EXCEPT PER SHARE AMOUNTS) 2021 2020 2019 REVENUE $156.1 $136.2 $156.2 OPERATING LOSS ($17.2) ($67.6) ($11.9) NET INCOME (LOSS) $292.7 ($72.9) ($16.8) INCOME (LOSS) PER SHARE - BASIC $2.39 ($0.61) ($0.15) INCOME (LOSS) PER SHARE - DILUTED $2.34 ($0.61) ($0.15) NON-GAAP OPERATING INCOME (LOSS) $10.6 $0.0 ($0.4) NON-GAAP NET INCOME (LOSS) $10.0 ($4.1) ($4.5) NON-GAAP INCOME (LOSS) PER SHARE - BASIC $0.08 ($0.03) ($0.04) NON-GAAP INCOME (LOSS) PER SHARE - DILUTED $0.08 ($0.03) ($0.04) ADJUSTED EBITDA $16.3 $7.2 $7.0

©2021 3D Systems, Inc. | All Rights Reserved. 13 Revenue by Market $ in millions $79.7 $79.7 Q2 2021 Q3 2021 Industrial Revenue Q3 QoQ +0.1% $82.8 $76.4 Q2 2021 Q3 2021 Healthcare Revenue Q3 QoQ (7.8%) Excluding divestitures, Heathcare revenue is down 1.4% QoQ Excluding divestitures, Industrial revenue is up 2.1% QoQ
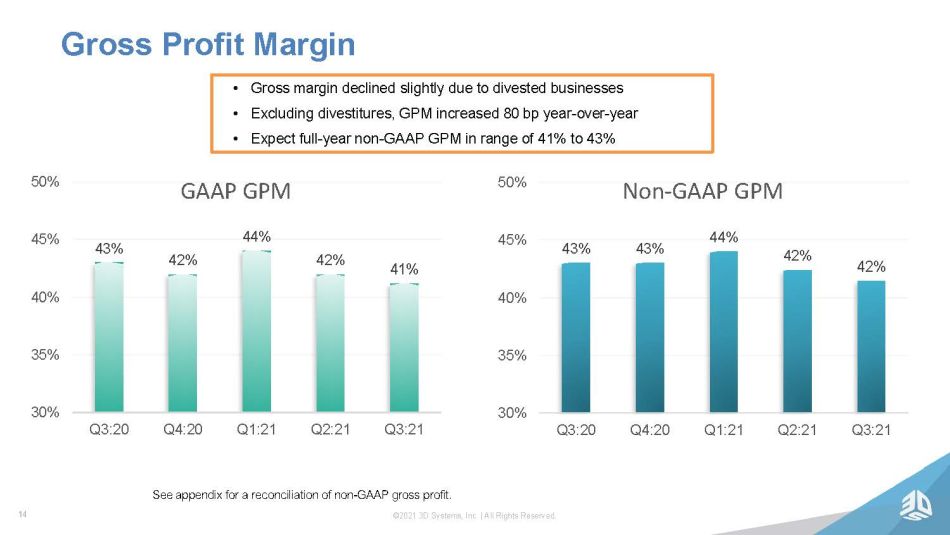
©2021 3D Systems, Inc. | All Rights Reserved. 14 Gross Profit Margin • Gross margin declined slightly due to divested businesses • Excluding divestitures, GPM increased 80 bp year - over - year • Expect full - year non - GAAP GPM in range of 41% to 43% See appendix for a reconciliation of non - GAAP gross profit. 43% 43% 44% 42% 42% 30% 35% 40% 45% 50% Q3:20 Q4:20 Q1:21 Q2:21 Q3:21 Non - GAAP GPM 43% 42% 44% 42% 41% 30% 35% 40% 45% 50% Q3:20 Q4:20 Q1:21 Q2:21 Q3:21 GAAP GPM

©2021 3D Systems, Inc. | All Rights Reserved. 15 Operating Expenses $126.2 $71.7 $66.2 $79.1 $81.5 $0 $20 $40 $60 $80 $100 $120 Q3 2020 Q4 2020 Q1 2021 Q2 2021 Q3 2021 $ in millions GAAP R&D SG&A Goodwill Impairment $58.8 $58.0 $51.2 $55.2 $54.1 $0 $20 $40 $60 Q3 2020 Q4 2020 Q1 2021 Q2 2021 Q3 2021 $ in millions Non - GAAP R&D SG&A Non - GAAP operating expenses decreased 8.0 % compared to the prior year and de creased 2.0% compared to second quarter 2021 reflecting disciplined spending efforts while focusing on growth initiatives See appendix for a reconciliation of non - GAAP operating expenses.

©2021 3D Systems, Inc. | All Rights Reserved. 16 5.3% 13.3% 13.6% 12.4% 10.5% -5.0% 0.0% 5.0% 10.0% 15.0% Q3 2020 Q4 2020 Q1 2021 Q2 2021 Q3 2021 Adjusted EBITDA Margin Defined as non - GAAP Operating Income plus Depreciation divided by Revenue See appendix for a reconciliation of Non - GAAP Operating Income and Adjusted EBITDA.
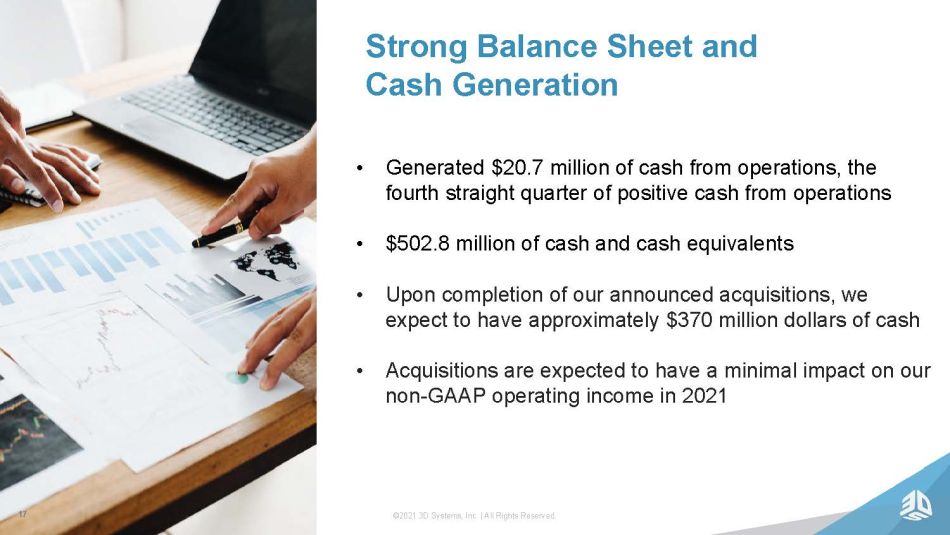
©2021 3D Systems, Inc. | All Rights Reserved. 17 Strong Balance Sheet and Cash Generation • Generated $ 20.7 million of cash fro m operations, the fourth straight quarter of positive cash from operations • $ 502.8 million of cash and cash equivalents • Upon completion of our announced acquisitions, we expect to have approximately $ 37 0 million dollars of cash • Acquisitions are expected to have a minimal impact on our non - GAAP operating income in 2021
©2021 3D Systems, Inc. | All Rights Reserved. ©2021 3D Systems, Inc. | All Rights Reserved. INVESTOR DAY UPDATE
©2021 3D Systems, Inc. | All Rights Reserved. Dr. Jeffrey Graves President & Chief Executive Officer 19

©2021 3D Systems, Inc. | All Rights Reserved. ©2021 3D Systems, Inc. | All Rights Reserved. 20 Transformed into a Differentiated Company in the AM Industry • Adding value for investors through a combination of growth and profitability, a financial profile that distinguishes us in the industry • Deeply integrated with specific markets and customers vs being just a “vendor” • Attracting talented individuals to all areas of the company • Investing for growth ©2021 3D Systems, Inc. | All Rights Reserved.

©2021 3D Systems, Inc. | All Rights Reserved. 21 Q&A Session 1 - 201 - 689 - 8345

©2021 3D Systems, Inc. | All Rights Reserved. 22 Thank You Find out more at: www.3dsystems.com
©2021 3D Systems, Inc. | All Rights Reserved. Appendix

©2021 3D Systems, Inc. | All Rights Reserved. 24 Presentation of Information 3D Systems reports is financial results in accordance with GAAP. To facilitate a better understanding of the impact that strategic acquisitions, non - recurring charges and certain non - cash expenses had on its financial results, management reviews certain non - GAAP measures, including non - GAAP revenue, non - GAAP revenue adjusted for divestitures, non - GAAP Cost of Sales, non - GAAP Operating Income, non - GAAP Net Income (Loss), non - GAAP Basic and Diluted Income (Loss) per Share, non - GAAP Gross Profit, non - GAAP Gross Profit Margin, non - GAAP Gross Profit Margin adjusted for divestitures, non - GAAP SG&A Expenses, non - GAAP R&D, non - GAAP Other Income and Expense and non - GAAP Operating Expenses, each of which exclude the impact of amortization of intangibles, acquisition and severance expenses, stock - based compensation expense, litigation settlements and charges related to strategic decisions and portfolio realignment, and Adjusted EBITDA, defined as non - GAAP Operating Income plus depreciation, and Adjusted EBITDA Margins, defined as Adjusted EBITDA divided by revenue, to better evaluate period - over - period performance. A reconciliation of GAAP to non - GAAP results is provided in the accompanying schedule. 3D Systems does not provide forward - looking guidance on a GAAP basis. The company is unable to provide a quantitative reconciliation of these forward - looking non - GAAP measures to the most directly comparable forward - looking GAAP measures without unreasonable effort because 3D Systems cannot reliably forecast legal, acquisition and divestiture expenses, restructuring expenses, product end of life adjustments and goodwill impairment, which are difficult to predict and estimate. These items are inherently uncertain and depend on various factors, many of which are beyond the company’s control, and as such, any associated estimate and its impact on GAAP performance could vary materially.

©2021 3D Systems, Inc. | All Rights Reserved. Non - GAAP Reconciliation - Operating Income (Loss) (Unaudited) Third Quarter and Nine - Month Non - GAAP Operating Income ( Loss ) 25 (1) For the quarter ended September 30, 2021, the adjustment included $16.1 in SG&A. For the quarter ended September 30, 2020, th e adjustment included $0.1 in COGS and $7.1 in SG&A. For the nine months ended September 30, 2021, the adjustment included $0.3 in COGS and $51.2 in SG&A. For the nine months ended September 30, 2020, the adjustment included $0.3 in COGS and $29.0 in SG&A. (2) For the quarter ended September 30, 2021, the adjustment included $11.4 in SG&A. For the quarter ended September 30, 2020, th e adjustment included $0.1 in COGS, $0.1 in SG&A. For the nine months ended September 30, 2021, the adjustment included $13.6 in SG&A. For the nine months ended September 30, 2020, the adjustment in cluded $0.3 in COGS, $0.4 in SG&A. (3) For the quarter ended September 30, 2020, the adjustment included $11.9 in SG&A. For the nine months ended September 30, 2021 , the adjustment included $1.6 in SG&A. For the nine months ended September 30, 2020, the adjustment included $0.7 in COGS, $13.8 in SG&A, $0.1 in R&D. (4) For the quarter ended September 30, 2021, the adjustment included $0.4 in COGS. For the nine months ended September 30, 2020, th e adjustment included $10.9 in COGS. (5) For the quarter and nine months ended September 30, 2020, the adjustment included $48.3 in Impairment of goodwill. * Tables may not foot due to rounding; amounts calculated based on dollars in thousands. Quarter Ended September 30, Nine Months Ended September 30, (in millions, except per share amounts) 202 1 2020 202 1 2020 GAAP Operating income (loss) $ (17.2) $ (67.6) $ (29.2) $ (119.7 ) Adjustments: Amortization, stock - based compensation & other (1) 16.1 7.2 51.5 29.3 Legal, acquisition and divestiture related (2) 11.4 0 . 2 13.6 0.7 Cost optimization plan, including severance costs (3) — 11.9 1.6 14.7 Product end of life adjustment (4) 0.4 — — 10.9 Goodwill Impairment (5) — 48.3 — 48.3 Non - GAAP Operating income (loss) $ 1 0.6 $ 0.0 $ 37.5 $ ( 15 . 8 )

©2021 3D Systems, Inc. | All Rights Reserved. Non - GAAP Reconciliation - Net Income (Loss) (Unaudited) Third Quarter and Nine - Month Non - GAAP Net Income (Loss) 26 (1) In addition to operating (loss) adjustments, the net income (loss) adjustments include $310.5 and $0.2 in other income/(expen se) , net for the quarters ended September 30, 2021 and 2020, respectively. In addition to the operating (loss) adjustments, the net income (loss) adjustments include $349.8. and $0.2 for t he nine months ended September 30, 2021 and 2020, respectively (2) For the quarter and nine months ended September 30, 2020, the net loss adjustment included $1.1 and $2.2, respectively, in in te rest and other income (expense), net. * Tables may not foot due to rounding; amounts calculated based on dollars in thousands . Quarter Ended September 30, Nine Months Ended September 30, 202 1 2020 202 1 2020 GAAP Net income (loss) $ 292.7 $ ( 72.9 ) $ 328.3 $ ( 129.8 ) Adjustments: Amortization, stock - based compensation & other 16.1 7.2 51.5 29.3 Legal, acquisition and divestiture related (1) (299.1) 0.4 (336.2 ) 0.8 Cost optimization plan, including severance costs — 11.9 1.6 14.7 Impairment of cost - method investments (2) — 1.1 — 2.2 Product end of life adjustment 0.4 — — 10.9 Goodwill Impairment — 48.3 — 48.3 Non - GAAP Net income (loss) $ 10.0 $ (4 . 1 ) $ 45.1 $ (23.7 )

©2021 3D Systems, Inc. | All Rights Reserved. Non - GAAP Reconciliation – EPS (Unaudited) Third Quarter and Nine - Month Net Income (Loss) per Share 27 * Tables may not foot due to rounding; amounts calculated based on dollars in thousands. Quarter Ended September 30, Nine Months Ended September 30, 202 1 2020 202 1 2020 GAAP Net income (loss) per share - basic $ 2.39 $ ( 0 . 61 ) $ 2.69 $ ( 1.12 ) Adjustments: Amortization, stock - based compensation & other 0. 13 0. 06 0.42 0. 25 Legal, acquisition and divestiture related (2.44) — (2.75 ) 0.01 Cost optimization plan, including severance costs — 0.10 0.01 0. 13 Impairment of cost - method investments — 0.01 — 0.0 2 Product end of life adjustment — — — 0.09 Goodwill impairment — 0.41 — 0.42 Non - GAAP Net income (loss) per share - basic $ 0 .08 $ (0 . 03 ) $ 0. 37 $ (0. 20 ) Quarter Ended September 30, Nine Months Ended September 30, 202 1 2020 202 1 2020 GAAP Net income (loss) per share - diluted $ 2.34 $ ( 0 . 61 ) $ 2.63 $ ( 1.12 ) Adjustments: Amortization, stock - based compensation & other 0. 13 0. 06 0.41 0. 25 Legal, acquisition and divestiture related (2.39) — (2.69 ) 0.01 Cost optimization plan, including severance costs — 0.10 0.01 0. 13 Impairment of cost - method investments — 0.01 — 0.0 2 Product end of life adjustment — — — 0.09 Goodwill impairment — 0.41 — 0.42 Non - GAAP Net income (loss) per share - diluted $ 0 .08 $ (0 . 03 ) $ 0. 37 $ (0. 20 )

©2021 3D Systems, Inc. | All Rights Reserved. Non - GAAP Reconciliation - GP and GPM (Unaudited) Quarterly 2020 and 202 1 Non - GAAP Gross Profit & Margin * Tables may not foot due to rounding; amounts calculated based on dollars in thousands. 28 2021 2020 Quarter Ended Quarter Ended (in millions) March 31 June 30 September 30 March 31 June 30 September 30 December 31 GAAP Gross Profit $ 64.2 $ 69.0 $ 64.3 $ 57.1 $ 35.2 $ 58.6 $ 72.5 GAAP Gross Profit Margin 43.9 % 42.4 % 41.2 % 42.4 % 31.4 % 43.4 % 42.0 % Adjustments: Amortization, stock - based compensation & other 0.1 0.2 — 0.1 0.1 0.1 0.1 Legal and acquisition - related — — — 0.1 0.1 0.1 0.1 Cost optimization plan — — — 0.7 — — 1.5 Impairment of cost - method investments — — — — — — — Product end of life adjustment (0.1 ) (0.3 ) 0.4 — 10.9 — Non - GAAP Gross Profit $ 64.2 $ 69.0 $ 64.7 $ 58.0 $ 46.3 $ 58.8 $ 74.1 Non - GAAP Gross Profit Margin 43.9 % 42.4 % 41.4 % 43.1 % 41.3 % 43.5 % 42.9 %

©2021 3D Systems, Inc. | All Rights Reserved. Non - GAAP Reconciliation - Operating Expense (Unaudited) Quarterly 2020 and 202 1 Non - GAAP Operating Expenses * Tables may not foot due to rounding; amounts calculated based on dollars in thousands. 29 2021 2020 Quarter Ended Quarter Ended Full (in millions) Mar 31 Jun 30 Sep 30 Mar 31 Jun 30 Sep 30 Dec 31 Year GAAP SG&A Expenses $ 49.6 $ 61.5 $ 65.7 $ 56.1 $ 52.0 $ 59.1 $ 52.7 $ 219.9 GAAP R&D Expenses 16.6 17.6 15.8 19.2 17.0 18.9 19.0 74.1 GAAP Operating Expenses 66.2 79.1 81.5 75.4 69.0 126.2 71.7 342.3 Adjustments to R&D Expenses: Cost optimization plan — — — 0.1 — — — 0.1 Non - GAAP R&D Expenses 16.6 17.6 15.8 19.1 17.0 18.9 19.0 74.0 Adjustments to SG&A Expenses: Amortization, stock - based compensation & other 13.3 21.8 16.1 10.6 11.3 7.1 4.0 33.0 Legal, acquisition and divestiture - related 0.5 1.7 11.4 0 .2 0.1 0.1 3.7 4.1 Cost optimization plan 1.2 0.4 — 1.5 0.5 11.9 6.1 19.9 Total Adjustments to SG&A Expenses 15.0 23.9 27.4 12.2 12.0 19.1 13.7 57.1 Non - GAAP SG&A Expenses 34.6 37.6 38.3 43.9 40.1 40.0 38.9 162. 1 Non - GAAP Operating Expenses $ 51.2 $ 55.2 $ 54.1 $ 63.0 $ 57.1 $ 58.8 $ 58.0 $ 236.9
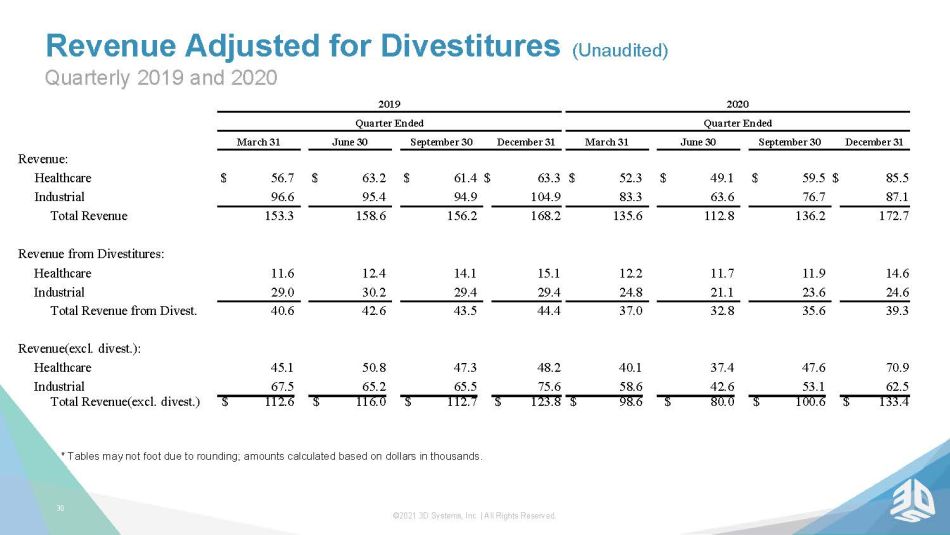
©2021 3D Systems, Inc. | All Rights Reserved. 30 2019 Quarter Ended March 31 June 30 September 30 December 31 Revenue: Healthcare $ 56.7 $ 63.2 $ 61.4 $ 63.3 Industrial 96.6 95.4 94.9 104.9 Total R evenue 153.3 158.6 156.2 168.2 Revenue from Divestitures : Healthcare 11.6 12.4 14.1 15.1 Industrial 29.0 30.2 29.4 29.4 Total Revenue from Divest. 40.6 42.6 43.5 44.4 Revenue(excl. divest.) : Healthcare 45.1 50.8 47.3 48.2 Industrial 67.5 65.2 65.5 75.6 Total Revenue(excl. divest.) $ 112.6 $ 116.0 $ 112.7 $ 123.8 * Tables may not foot due to rounding; amounts calculated based on dollars in thousands. 2020 Quarter Ended March 31 June 30 September 30 December 31 $ 52.3 $ 49.1 $ 59.5 $ 85.5 83.3 63.6 76.7 87.1 135.6 112.8 136.2 172.7 12.2 11.7 11.9 14.6 24.8 21.1 23.6 24.6 37.0 32.8 35.6 39.3 40.1 37.4 47.6 70.9 58.6 42.6 53.1 62.5 $ 98.6 $ 80.0 $ 100.6 $ 133.4 Revenue Adjusted for Divestitures (Unaudited) Quarterly 2019 and 202 0

©2021 3D Systems, Inc. | All Rights Reserved. 31 2021 Quarter Ended March 31 June 30 September 30 Revenue: Healthcare $ 72.5 $ 82.8 $ 76.4 Industrial 73.6 79.7 79.7 Total R evenue 146.1 162.6 156.1 Revenue from Divestitures : Healthcare 11.0 13.1 7.7 Industrial 13.8 13.1 11.8 Total Revenue from Divest. 24.8 26.3 19.4 Revenue(excl. divest.) : Healthcare 61.5 69.7 68.7 Industrial 59.8 66.6 67.9 Total Revenue(excl. divest.) $ 121.3 $ 136.3 $ 136.7 * Tables may not foot due to rounding; amounts calculated based on dollars in thousands. Revenue Adjusted for Divestitures (Unaudited) Quarterly 202 1
Serious News for Serious Traders! Try StreetInsider.com Premium Free!
You May Also Be Interested In
- 3D Systems (DDD) Announces FDA Clearance for 3D-Printed PEEK Cranial Implants
- Li-Metal Announces US$750,000 Equity Financing and Plans to Raise up to US$10.0 Million
- Merlin Chain Launches MERL: A Major Leap Forward in Bitcoin Layer 2 Solutions
Create E-mail Alert Related Categories
SEC FilingsSign up for StreetInsider Free!
Receive full access to all new and archived articles, unlimited portfolio tracking, e-mail alerts, custom newswires and RSS feeds - and more!
