

Form 10-Q CION Investment Corp For: Mar 31
 Tweet
Tweet Share
ShareUNITED STATES
SECURITIES AND EXCHANGE COMMISSION
Washington, D.C. 20549
FORM 10-Q
| [x] | QUARTERLY REPORT PURSUANT TO SECTION 13 OR 15(d) OF THE SECURITIES EXCHANGE ACT OF 1934 | ||||
For the quarterly period ended March 31, 2021
OR
| [ ] | TRANSITION REPORT PURSUANT TO SECTION 13 OR 15(d) OF THE SECURITIES EXCHANGE ACT OF 1934 | ||||
For the transition period from __________ to __________
Commission File Number 000-54755
| CĪON Investment Corporation | ||||||||
| (Exact name of registrant as specified in its charter) | ||||||||
| Maryland | 45-3058280 | |||||||
| (State or other jurisdiction of incorporation or organization) | (I.R.S. Employer Identification No.) | |||||||
3 Park Avenue, 36th Floor New York, New York | 10016 | |||||||
| (Address of principal executive offices) | (Zip Code) | |||||||
| (212) 418-4700 | ||||||||
| (Registrant’s telephone number, including area code) | ||||||||
| Not applicable | ||||||||
| (Former name, former address and former fiscal year, if changed since last report) | ||||||||
Securities registered pursuant to Section 12(b) of the Act:
| Title of each class | Trading symbol(s) | Name of each exchange on which registered | ||||||
| None | Not applicable | Not applicable | ||||||
Indicate by check mark whether the registrant (1) has filed all reports required to be filed by Section 13 or 15(d) of the Securities Exchange Act of 1934 during the preceding 12 months (or for such shorter period that the registrant was required to file such reports), and (2) has been subject to such filing requirements for the past 90 days.
Yes [x] No [ ]
Indicate by check mark whether the registrant has submitted electronically every Interactive Data File required to be submitted pursuant to Rule 405 of Regulation S-T (§232.405 of this chapter) during the preceding 12 months (or for such shorter period that the registrant was required to submit such files).
Yes [ ] No [ ]
Indicate by check mark whether the registrant is a large accelerated filer, an accelerated filer, a non-accelerated filer, a smaller reporting company, or an emerging growth company. See the definitions of “large accelerated filer,” “accelerated filer,” “smaller reporting company,” and "emerging growth company" in Rule 12b-2 of the Exchange Act.
| Large accelerated filer [ ] | Accelerated filer [ ] | |||||||
Non-accelerated filer [x] | Smaller reporting company [ ] | |||||||
| Emerging growth company [ ] | ||||||||
If an emerging growth company, indicate by check mark if the registrant has elected not to use the extended transition period for complying with any new or revised financial accounting standards provided pursuant to Section 13(a) of the Exchange Act.
[ ]
Indicate by check mark whether the registrant is a shell company (as defined in Rule 12b-2 of the Exchange Act).
Yes [ ] No [x]
The number of shares of the registrant’s common stock, $0.001 par value, outstanding as of May 10, 2021 was 113,514,454.
CĪON INVESTMENT CORPORATION
FORM 10-Q
TABLE OF CONTENTS
| Page | ||||||||
PART I – FINANCIAL INFORMATION
Item 1. Financial Statements
CĪON Investment Corporation
Consolidated Balance Sheets
(in thousands, except share and per share amounts)
| March 31, 2021 | December 31, 2020 | |||||||||||||
| (unaudited) | ||||||||||||||
| Assets | ||||||||||||||
| Investments, at fair value: | ||||||||||||||
| Non-controlled, non-affiliated investments (amortized cost of $1,516,451 and $1,501,529, respectively) | $ | 1,474,164 | $ | 1,440,004 | ||||||||||
| Non-controlled, affiliated investments (amortized cost of $150,828 and $134,184, respectively) | 147,477 | 116,895 | ||||||||||||
| Controlled investments (amortized cost of $0 and $15,539, respectively) | — | 12,472 | ||||||||||||
| Total investments, at fair value (amortized cost of $1,667,279 and $1,651,252, respectively) | 1,621,641 | 1,569,371 | ||||||||||||
| Cash | 1,641 | 19,914 | ||||||||||||
| Interest receivable on investments | 17,101 | 17,484 | ||||||||||||
| Receivable due on investments sold and repaid | 39,915 | 6,193 | ||||||||||||
| Dividends receivable on investments | 315 | 45 | ||||||||||||
| Prepaid expenses and other assets | 667 | 1,788 | ||||||||||||
| Total assets | $ | 1,681,280 | $ | 1,614,795 | ||||||||||
| Liabilities and Shareholders' Equity | ||||||||||||||
| Liabilities | ||||||||||||||
| Financing arrangements (net of unamortized debt issuance costs of $8,689 and $5,044, respectively) | $ | 716,311 | $ | 719,956 | ||||||||||
| Payable for investments purchased | 40,217 | 133 | ||||||||||||
| Accounts payable and accrued expenses | 921 | 694 | ||||||||||||
| Interest payable | 2,717 | 2,500 | ||||||||||||
| Accrued management fees | 7,783 | 7,668 | ||||||||||||
| Accrued subordinated incentive fee on income | — | 4,323 | ||||||||||||
| Accrued administrative services expense | 389 | 1,265 | ||||||||||||
| Total liabilities | 768,338 | 736,539 | ||||||||||||
| Commitments and contingencies (Note 4 and Note 11) | ||||||||||||||
| Shareholders' Equity | ||||||||||||||
| Common stock, $0.001 par value; 500,000,000 shares authorized; | ||||||||||||||
| 113,299,836 and 113,293,723 shares issued and outstanding, respectively | 113 | 113 | ||||||||||||
| Capital in excess of par value | 1,054,912 | 1,054,911 | ||||||||||||
| Accumulated distributable losses | (142,083) | (176,768) | ||||||||||||
| Total shareholders' equity | 912,942 | 878,256 | ||||||||||||
| Total liabilities and shareholders' equity | $ | 1,681,280 | $ | 1,614,795 | ||||||||||
| Net asset value per share of common stock at end of period | $ | 8.06 | $ | 7.75 | ||||||||||
See accompanying notes to consolidated financial statements.
1
CĪON Investment Corporation
Consolidated Statements of Operations
(in thousands, except share and per share amounts)
| Three Months Ended March 31, | Year Ended December 31, | |||||||||||||||||||
| 2021 | 2020 | 2020 | ||||||||||||||||||
| (unaudited) | (unaudited) | |||||||||||||||||||
| Investment income | ||||||||||||||||||||
| Non-controlled, non-affiliated investments | ||||||||||||||||||||
| Interest income | $ | 26,102 | $ | 39,421 | $ | 125,395 | ||||||||||||||
| Paid-in-kind interest income | 6,135 | 1,876 | 17,078 | |||||||||||||||||
| Fee income | 933 | 604 | 4,393 | |||||||||||||||||
| Dividend income | 82 | 136 | 331 | |||||||||||||||||
| Non-controlled, affiliated investments | ||||||||||||||||||||
| Interest income | 1,401 | 798 | 7,883 | |||||||||||||||||
| Dividend income | 827 | 475 | 3,012 | |||||||||||||||||
| Paid-in-kind interest income | 823 | 783 | 2,082 | |||||||||||||||||
| Fee income | — | — | 150 | |||||||||||||||||
| Controlled investments | ||||||||||||||||||||
| Dividend income | — | 1,655 | 3,518 | |||||||||||||||||
| Total investment income | 36,303 | 45,748 | 163,842 | |||||||||||||||||
| Operating expenses | ||||||||||||||||||||
| Management fees | 7,783 | 8,451 | 31,828 | |||||||||||||||||
| Administrative services expense | 684 | 394 | 2,465 | |||||||||||||||||
| Subordinated incentive fee on income | — | 3,308 | 7,631 | |||||||||||||||||
| General and administrative | 2,689 | 1,470 | 6,353 | |||||||||||||||||
| Interest expense | 7,548 | 10,464 | 36,837 | |||||||||||||||||
| Total operating expenses | 18,704 | 24,087 | 85,114 | |||||||||||||||||
| Net investment income | 17,599 | 21,661 | 78,728 | |||||||||||||||||
| Realized and unrealized gains (losses) | ||||||||||||||||||||
| Net realized gains (losses) on: | ||||||||||||||||||||
| Non-controlled, non-affiliated investments | 26 | (3,983) | (69,687) | |||||||||||||||||
| Non-controlled, affiliated investments | (1,080) | (211) | (211) | |||||||||||||||||
| Controlled investments | (3,067) | — | — | |||||||||||||||||
| Foreign currency | (7) | (2) | 26 | |||||||||||||||||
| Net realized losses | (4,128) | (4,196) | (69,872) | |||||||||||||||||
| Net change in unrealized appreciation (depreciation) on: | ||||||||||||||||||||
| Non-controlled, non-affiliated investments | 19,238 | (110,726) | 1,110 | |||||||||||||||||
| Non-controlled, affiliated investments | 13,938 | (7,837) | (17,945) | |||||||||||||||||
| Controlled investments | 3,067 | (4,814) | (3,043) | |||||||||||||||||
| Net change in unrealized appreciation (depreciation) | 36,243 | (123,377) | (19,878) | |||||||||||||||||
| Net realized and unrealized gains (losses) | 32,115 | (127,573) | (89,750) | |||||||||||||||||
| Net increase (decrease) in net assets resulting from operations | $ | 49,714 | $ | (105,912) | $ | (11,022) | ||||||||||||||
| Per share information—basic and diluted | ||||||||||||||||||||
| Net increase (decrease) in net assets per share resulting from operations | $ | 0.44 | $ | (0.93) | $ | (0.10) | ||||||||||||||
| Weighted average shares of common stock outstanding | 113,509,925 | 113,700,146 | 113,635,682 | |||||||||||||||||
See accompanying notes to consolidated financial statements.
2
CĪON Investment Corporation
Consolidated Statements of Changes in Net Assets
(in thousands, except share and per share amounts)
| Three Months Ended March 31, | Year Ended December 31, | ||||||||||||||||||||||
| 2021 | 2020 | 2020 | |||||||||||||||||||||
| (unaudited) | (unaudited) | ||||||||||||||||||||||
| Changes in net assets from operations: | |||||||||||||||||||||||
| Net investment income | $ | 17,599 | $ | 21,661 | $ | 78,728 | |||||||||||||||||
| Net realized loss on investments | (4,121) | (4,194) | (69,898) | ||||||||||||||||||||
| Net realized (loss) gain on foreign currency | (7) | (2) | 26 | ||||||||||||||||||||
| Net change in unrealized appreciation (depreciation) on investments | 36,243 | (123,377) | (19,878) | ||||||||||||||||||||
| Net increase (decrease) in net assets resulting from operations | 49,714 | (105,912) | (11,022) | ||||||||||||||||||||
| Changes in net assets from shareholders' distributions: | |||||||||||||||||||||||
| Distributions to shareholders | (15,029) | (20,793) | (63,283) | ||||||||||||||||||||
| Net decrease in net assets resulting from shareholders' distributions | (15,029) | (20,793) | (63,283) | ||||||||||||||||||||
| Changes in net assets from capital share transactions: | |||||||||||||||||||||||
| Reinvestment of shareholders' distributions | 5,292 | 8,071 | 23,298 | ||||||||||||||||||||
| Repurchase of common stock | (5,291) | (8,071) | (23,300) | ||||||||||||||||||||
| Net increase (decrease) in net assets resulting from capital share transactions | 1 | — | (2) | ||||||||||||||||||||
| Total increase (decrease) in net assets | 34,686 | (126,705) | (74,307) | ||||||||||||||||||||
| Net assets at beginning of period | 878,256 | 952,563 | 952,563 | ||||||||||||||||||||
| Net assets at end of period | $ | 912,942 | $ | 825,858 | $ | 878,256 | |||||||||||||||||
| Net asset value per share of common stock at end of period | $ | 8.06 | $ | 7.29 | $ | 7.75 | |||||||||||||||||
| Shares of common stock outstanding at end of period | 113,299,836 | 113,313,249 | 113,293,723 | ||||||||||||||||||||
See accompanying notes to consolidated financial statements.
3
CĪON Investment Corporation
Consolidated Statements of Cash Flows
(in thousands)
| Three Months Ended March 31, | Year Ended December 31, | |||||||||||||||||||
| 2021 | 2020 | 2020 | ||||||||||||||||||
| (unaudited) | (unaudited) | |||||||||||||||||||
| Operating activities: | ||||||||||||||||||||
| Net increase (decrease) in net assets resulting from operations | $ | 49,714 | $ | (105,912) | $ | (11,022) | ||||||||||||||
| Adjustments to reconcile net increase (decrease) in net assets resulting from operations to net cash provided by operating activities: | ||||||||||||||||||||
| Net accretion of discount on investments | (3,172) | (5,181) | (13,214) | |||||||||||||||||
| Proceeds from principal repayment of investments | 174,274 | 182,814 | 465,547 | |||||||||||||||||
| Purchase of investments | (183,634) | (175,631) | (359,633) | |||||||||||||||||
| Paid-in-kind interest and dividends capitalized | (7,515) | (3,270) | (21,420) | |||||||||||||||||
| Increase in short term investments, net | (13,996) | (27,130) | (44,071) | |||||||||||||||||
| Proceeds from sale of investments | 15,000 | 27,584 | 77,630 | |||||||||||||||||
| Net realized loss on investments | 4,121 | 4,194 | 69,898 | |||||||||||||||||
| Net change in unrealized (appreciation) depreciation on investments | (36,243) | 123,377 | 19,878 | |||||||||||||||||
| Amortization of debt issuance costs | 749 | 687 | 5,037 | |||||||||||||||||
| (Increase) decrease in due from counterparty | — | (1,865) | 3,281 | |||||||||||||||||
| (Increase) decrease in interest receivable on investments | (722) | (828) | (1,137) | |||||||||||||||||
| (Increase) decrease in dividends receivable on investments | (270) | (306) | 1,061 | |||||||||||||||||
| (Increase) decrease in receivable due on investments sold and repaid | (33,722) | 17,661 | 12,359 | |||||||||||||||||
| (Increase) decrease in prepaid expenses and other assets | 1,121 | 362 | (803) | |||||||||||||||||
| Increase (decrease) in payable for investments purchased | 40,084 | 19,761 | (1,435) | |||||||||||||||||
| Increase (decrease) in accounts payable and accrued expenses | 227 | 262 | (121) | |||||||||||||||||
| Increase (decrease) in interest payable | 217 | (394) | (663) | |||||||||||||||||
| Increase (decrease) in accrued management fees | 115 | (418) | (1,201) | |||||||||||||||||
| Increase (decrease) in accrued administrative services expense | (876) | (896) | 48 | |||||||||||||||||
| Increase (decrease) in subordinated incentive fee on income payable | (4,323) | (2,304) | (1,289) | |||||||||||||||||
| Net cash provided by operating activities | 1,149 | 52,567 | 198,730 | |||||||||||||||||
| Financing activities: | ||||||||||||||||||||
| Repurchase of common stock | (5,291) | (8,071) | (23,300) | |||||||||||||||||
| Shareholders' distributions paid | (9,737) | (12,722) | (39,985) | |||||||||||||||||
| Repayments under financing arrangements | (125,000) | (75,300) | 486,153 | |||||||||||||||||
| Borrowings under financing arrangements | 125,000 | 41,118 | (602,194) | |||||||||||||||||
| Debt issuance costs paid | (4,394) | — | (5,625) | |||||||||||||||||
| Net cash used in financing activities | (19,422) | (54,975) | (184,951) | |||||||||||||||||
| Net (decrease) increase in cash and restricted cash | (18,273) | (2,408) | 13,779 | |||||||||||||||||
| Cash and restricted cash, beginning of period | 19,914 | 6,135 | 6,135 | |||||||||||||||||
| Cash and restricted cash, end of period | $ | 1,641 | $ | 3,727 | $ | 19,914 | ||||||||||||||
| Supplemental disclosure of cash flow information: | ||||||||||||||||||||
| Cash paid for interest | $ | 6,582 | $ | 10,161 | $ | 32,403 | ||||||||||||||
| Supplemental non-cash financing activities: | ||||||||||||||||||||
| Reinvestment of shareholders' distributions | $ | 5,292 | $ | 8,071 | $ | 23,298 | ||||||||||||||
| Restructuring of portfolio investment | $ | — | $ | — | $ | 91,326 | ||||||||||||||
| Cash interest receivable exchanged for additional securities | $ | 1,304 | $ | — | $ | — | ||||||||||||||
See accompanying notes to consolidated financial statements.
4
CĪON Investment Corporation
Consolidated Schedule of Investments (unaudited)
March 31, 2021
(in thousands)
| Portfolio Company(a) | Index Rate(b) | Industry | Principal/ Par Amount/ Units(e) | Cost(d) | Fair Value(c) | |||||||||||||||||||||||||||
| Senior Secured First Lien Debt - 137.5% | ||||||||||||||||||||||||||||||||
| 1244311 B.C. LTD., L+500, 1.00% LIBOR Floor, 9/30/2025(s) | 3 Month LIBOR | Chemicals, Plastics & Rubber | $ | 2,416 | $ | 2,292 | $ | 2,307 | ||||||||||||||||||||||||
| 1244311 B.C. LTD., L+500, 1.00% LIBOR Floor, 9/30/2025(s)(v) | 3 Month LIBOR | Chemicals, Plastics & Rubber | 820 | 771 | 776 | |||||||||||||||||||||||||||
| Adams Publishing Group, LLC, L+700, 1.75% LIBOR Floor, 7/2/2023(n)(o) | 1 Month LIBOR | Media: Advertising, Printing & Publishing | 11,858 | 11,794 | 11,710 | |||||||||||||||||||||||||||
| Adapt Laser Acquisition, Inc., L+1200, 1.00% LIBOR Floor, 12/31/2023(v) | 3 Month LIBOR | Capital Equipment | 11,280 | 11,280 | 9,560 | |||||||||||||||||||||||||||
| Adapt Laser Acquisition, Inc., L+1000, 1.00% LIBOR Floor, 12/31/2023 | 3 Month LIBOR | Capital Equipment | 2,000 | 2,000 | 1,695 | |||||||||||||||||||||||||||
| Aegis Toxicology Sciences Corp., L+550, 1.00% LIBOR Floor, 5/9/2025(n) | 3 Month LIBOR | Healthcare & Pharmaceuticals | 9,669 | 9,539 | 9,052 | |||||||||||||||||||||||||||
| AIS Holdco, LLC, L+500, 0.00% LIBOR Floor, 8/15/2025(n) | 3 Month LIBOR | Banking, Finance, Insurance & Real Estate | 5,208 | 5,163 | 5,065 | |||||||||||||||||||||||||||
| Alchemy US Holdco 1, LLC, L+550, 10/10/2025(n) | 1 Month LIBOR | Construction & Building | 12,874 | 12,749 | 12,600 | |||||||||||||||||||||||||||
| Alert 360 Opco, Inc., L+600, 1.00% LIBOR Floor, 10/16/2025(n)(s) | 1 Month LIBOR | Services: Consumer | 12,209 | 12,209 | 12,224 | |||||||||||||||||||||||||||
| Allen Media, LLC, L+550, 0.00% LIBOR Floor, 2/10/2027(n)(o) | 3 Month LIBOR | Media: Diversified & Production | 9,784 | 9,784 | 9,784 | |||||||||||||||||||||||||||
| Alliance Healthcare Services, Inc., L+450, 1.00% LIBOR Floor, 10/24/2023(i)(v) | 1 Month LIBOR | Healthcare & Pharmaceuticals | 4,173 | 3,995 | 3,912 | |||||||||||||||||||||||||||
| ALM Media, LLC, L+650, 1.00% LIBOR Floor, 11/25/2024(n)(o) | 3 Month LIBOR | Media: Advertising, Printing & Publishing | 18,750 | 18,465 | 17,859 | |||||||||||||||||||||||||||
| AMCP Staffing Intermediate Holdings III, LLC, L+675, 1.50% LIBOR Floor, 9/24/2025(n) | 3 Month LIBOR | Services: Business | 10,786 | 10,741 | 10,435 | |||||||||||||||||||||||||||
| AMCP Staffing Intermediate Holdings III, LLC, 0.50% Unfunded, 9/24/2025 | None | Services: Business | 1,598 | — | (52) | |||||||||||||||||||||||||||
| American Clinical Solutions LLC, 7.00%, 12/31/2022(n)(s) | None | Healthcare & Pharmaceuticals | 3,500 | 3,437 | 3,264 | |||||||||||||||||||||||||||
| American Clinical Solutions LLC, 7.00%, 6/30/2021(n)(s) | None | Healthcare & Pharmaceuticals | 250 | 250 | 243 | |||||||||||||||||||||||||||
| American Consolidated Natural Resources, Inc., L+1300, 1.00% LIBOR Floor, 9/16/2025(n)(v) | 3 Month LIBOR | Metals & Mining | 623 | 445 | 615 | |||||||||||||||||||||||||||
| American Media, LLC, L+775, 1.50% LIBOR Floor, 12/31/2023(n) | 3 Month LIBOR | Media: Advertising, Printing & Publishing | 10,702 | 10,542 | 10,595 | |||||||||||||||||||||||||||
| American Media, LLC, L+775, 1.50% LIBOR Floor, 12/31/2023(n) | 3 Month LIBOR | Media: Advertising, Printing & Publishing | 1,617 | 1,594 | 1,601 | |||||||||||||||||||||||||||
| American Media, LLC, 0.50% Unfunded, 12/31/2023(n) | None | Media: Advertising, Printing & Publishing | 85 | — | (1) | |||||||||||||||||||||||||||
| American Teleconferencing Services, Ltd., L+650, 1.00% LIBOR Floor, 12/8/2021(n) | 3 Month LIBOR | Telecommunications | 19,505 | 18,850 | 16,189 | |||||||||||||||||||||||||||
| Analogic Corp., L+525, 1.00% LIBOR Floor, 6/21/2024(n)(o) | 1 Month LIBOR | Healthcare & Pharmaceuticals | 4,938 | 4,878 | 4,839 | |||||||||||||||||||||||||||
| Anthem Sports & Entertainment Inc., L+950, 1.00% LIBOR Floor, 9/9/2024(n)(v) | 3 Month LIBOR | Media: Diversified & Production | 16,701 | 16,191 | 16,534 | |||||||||||||||||||||||||||
| Anthem Sports & Entertainment Inc., L+950, 1.00% LIBOR Floor, 9/9/2024(n) | 3 Month LIBOR | Media: Diversified & Production | 833 | 833 | 829 | |||||||||||||||||||||||||||
| Anthem Sports & Entertainment Inc., 0.50% Unfunded, 9/9/2024 | None | Media: Diversified & Production | 1,333 | — | (7) | |||||||||||||||||||||||||||
| APCO Holdings, LLC, L+550, 0.00% LIBOR Floor, 6/9/2025(n) | 1 Month LIBOR | Banking, Finance, Insurance & Real Estate | 9,286 | 9,224 | 9,124 | |||||||||||||||||||||||||||
| Appalachian Resource Company, LLC, L+500, 1.00% LIBOR Floor, 9/10/2023 | 1 Month LIBOR | Metals & Mining | 11,137 | 9,784 | 9,160 | |||||||||||||||||||||||||||
| Appalachian Resource Company, LLC, 0.00% Unfunded, 9/10/2023(p) | None | Metals & Mining | 2,500 | — | — | |||||||||||||||||||||||||||
| Associated Asphalt Partners, LLC, L+525, 1.00% LIBOR Floor, 4/5/2024(n)(o) | 1 Month LIBOR | Construction & Building | 14,479 | 14,095 | 13,556 | |||||||||||||||||||||||||||
| Avison Young (USA) Inc., L+500, 0.00% LIBOR Floor, 1/31/2026(h)(n) | 3 Month LIBOR | Banking, Finance, Insurance & Real Estate | 9,775 | 9,630 | 9,763 | |||||||||||||||||||||||||||
| BK Medical Holding Company, Inc., L+525, 1.00% LIBOR Floor, 6/22/2024(n)(o) | 1 Month LIBOR | Healthcare & Pharmaceuticals | 4,950 | 4,918 | 4,752 | |||||||||||||||||||||||||||
| Blackboard Inc., L+600, 1.00% LIBOR Floor, 6/30/2024(i) | 3 Month LIBOR | Services: Consumer | 4,987 | 4,987 | 4,978 | |||||||||||||||||||||||||||
| Cadence Aerospace, LLC, L+850, 1.00% LIBOR Floor, 11/14/2023(n)(o)(v) | 3 Month LIBOR | Aerospace & Defense | 38,333 | 37,890 | 36,513 | |||||||||||||||||||||||||||
| Cardinal US Holdings, Inc., L+500, 1.00% LIBOR Floor, 7/31/2023(n) | 1 Month LIBOR | Services: Business | 8,203 | 7,939 | 8,162 | |||||||||||||||||||||||||||
See accompanying notes to consolidated financial statements.
5
CĪON Investment Corporation
Consolidated Schedule of Investments (unaudited)
March 31, 2021
(in thousands)
| Portfolio Company(a) | Index Rate(b) | Industry | Principal/ Par Amount/ Units(e) | Cost(d) | Fair Value(c) | |||||||||||||||||||||||||||
| CB URS Holdings Corp., L+575, 1.00% LIBOR Floor, 9/1/2024(n) | 6 Month LIBOR | Transportation: Cargo | 15,750 | 15,692 | 14,654 | |||||||||||||||||||||||||||
| Charming Charlie LLC, 20.00%, 4/24/2023(r)(s) | None | Retail | 777 | 657 | 350 | |||||||||||||||||||||||||||
| CHC Solutions Inc., 12.00%, 7/20/2023(o)(v) | None | Healthcare & Pharmaceuticals | 7,729 | 7,729 | 7,623 | |||||||||||||||||||||||||||
| CircusTrix Holdings, LLC, L+800, 1.00% LIBOR Floor, 1/16/2024(n)(o)(v) | 1 Month LIBOR | Hotel, Gaming & Leisure | 26,430 | 26,179 | 22,895 | |||||||||||||||||||||||||||
| CircusTrix Holdings, LLC, L+800, 1.00% LIBOR Floor, 1/16/2024(n)(v) | 1 Month LIBOR | Hotel, Gaming & Leisure | 2,690 | 2,682 | 2,330 | |||||||||||||||||||||||||||
| CircusTrix Holdings, LLC, L+800, 1.00% LIBOR Floor, 7/16/2023(n)(v) | 1 Month LIBOR | Hotel, Gaming & Leisure | 968 | 968 | 1,124 | |||||||||||||||||||||||||||
| CircusTrix Holdings, LLC, 1.00% Unfunded, 12/31/2021 | None | Hotel, Gaming & Leisure | 802 | — | 129 | |||||||||||||||||||||||||||
| Country Fresh Holdings, LLC, 12.00%, 6/1/2022(v) | None | Beverage, Food & Tobacco | 969 | 941 | 947 | |||||||||||||||||||||||||||
| Country Fresh Holdings, LLC, L+500, 1.00% LIBOR Floor, 4/29/2023(r) | 3 Month LIBOR | Beverage, Food & Tobacco | 1,020 | 1,000 | 338 | |||||||||||||||||||||||||||
| Country Fresh Holdings, LLC, 15.00%, 6/15/2021(v) | None | Beverage, Food & Tobacco | 326 | 312 | 326 | |||||||||||||||||||||||||||
| Country Fresh Holdings, LLC, L+500, 1.00% LIBOR Floor, 4/29/2023(n)(r) | 3 Month LIBOR | Beverage, Food & Tobacco | 414 | 414 | 137 | |||||||||||||||||||||||||||
| Coyote Buyer, LLC, L+600, 1.00% LIBOR Floor, 2/6/2026(n)(o) | 3 Month LIBOR | Chemicals, Plastics & Rubber | 34,634 | 34,384 | 34,634 | |||||||||||||||||||||||||||
| Coyote Buyer, LLC, L+800, 1.00% LIBOR Floor, 8/6/2026(o) | 3 Month LIBOR | Chemicals, Plastics & Rubber | 6,250 | 6,119 | 6,250 | |||||||||||||||||||||||||||
| Coyote Buyer, LLC, 0.50% Unfunded, 2/6/2025 | None | Chemicals, Plastics & Rubber | 2,500 | — | — | |||||||||||||||||||||||||||
| David's Bridal, LLC, L+1000, 1.00% LIBOR Floor, 6/23/2023(v) | 3 Month LIBOR | Retail | 5,409 | 4,555 | 5,409 | |||||||||||||||||||||||||||
| David's Bridal, LLC, L+600, 1.00% LIBOR Floor, 6/30/2023(v) | 3 Month LIBOR | Retail | 756 | 665 | 756 | |||||||||||||||||||||||||||
| Deluxe Entertainment Services, Inc., L+650, 1.00% LIBOR Floor, 3/25/2024(n)(s)(v) | 3 Month LIBOR | Media: Diversified & Production | 3,570 | 3,658 | 3,570 | |||||||||||||||||||||||||||
| DMT Solutions Global Corp., L+700, 0.00% LIBOR Floor, 7/2/2024(n) | (w) | Services: Business | 17,250 | 16,949 | 16,819 | |||||||||||||||||||||||||||
| Eagle Family Foods Group LLC, L+650, 1.00% LIBOR Floor, 6/14/2024 | 3 Month LIBOR | Beverage, Food & Tobacco | 14,075 | 13,890 | 13,934 | |||||||||||||||||||||||||||
| East Valley Tourist Development Authority, L+800, 1.00% LIBOR Floor, 3/7/2022(i) | 6 Month LIBOR | Hotel, Gaming & Leisure | 5,000 | 4,950 | 4,950 | |||||||||||||||||||||||||||
| Entertainment Studios P&A LLC, 6.30%, 5/18/2037(k)(n) | None | Media: Diversified & Production | 11,971 | 11,871 | 11,073 | |||||||||||||||||||||||||||
| Entertainment Studios P&A LLC, 5.00%, 5/18/2037(k) | None | Media: Diversified & Production | — | — | 2,160 | |||||||||||||||||||||||||||
| EnTrans International, LLC, L+600, 0.00% LIBOR Floor, 11/1/2024(n) | 1 Month LIBOR | Capital Equipment | 25,875 | 25,707 | 25,358 | |||||||||||||||||||||||||||
| Extreme Reach, Inc., L+750, 1.50% LIBOR Floor, 3/29/2024(n)(o) | 1 Month LIBOR | Media: Diversified & Production | 19,995 | 19,847 | 19,695 | |||||||||||||||||||||||||||
| Extreme Reach, Inc., 0.50% Unfunded, 3/29/2024(n)(o) | None | Media: Diversified & Production | 1,744 | — | (26) | |||||||||||||||||||||||||||
| F+W Media, Inc., L+1000, 1.50% LIBOR Floor, 5/24/2022(r)(s) | 1 Month LIBOR | Media: Diversified & Production | 1,139 | — | — | |||||||||||||||||||||||||||
| Foundation Consumer Healthcare, LLC, L+575, 1.00% LIBOR Floor, 11/2/2023(n)(o) | 3 Month LIBOR | Healthcare & Pharmaceuticals | 34,205 | 33,878 | 34,205 | |||||||||||||||||||||||||||
| Foundation Consumer Healthcare, LLC, 0.50% Unfunded, 11/2/2023 | None | Healthcare & Pharmaceuticals | 2,094 | — | — | |||||||||||||||||||||||||||
| Genesis Healthcare, Inc., 0.50% Unfunded, 3/6/2023(h)(n) | None | Healthcare & Pharmaceuticals | 35,000 | — | — | |||||||||||||||||||||||||||
| Geo Parent Corp., L+525, 0.00% LIBOR Floor, 12/19/2025(n) | 1 Month LIBOR | Services: Business | 14,700 | 14,592 | 14,663 | |||||||||||||||||||||||||||
| Geon Performance Solutions, LLC, L+625, 1.63% LIBOR Floor, 10/25/2024(n)(o) | 1 Month LIBOR | Chemicals, Plastics & Rubber | 22,134 | 21,853 | 21,912 | |||||||||||||||||||||||||||
| Geon Performance Solutions, LLC, 0.50% Unfunded, 10/25/2024 | None | Chemicals, Plastics & Rubber | 2,586 | — | (26) | |||||||||||||||||||||||||||
| Harland Clarke Holdings Corp., L+475, 1.00% LIBOR Floor, 11/3/2023(n) | 3 Month LIBOR | Services: Business | 12,126 | 12,100 | 10,812 | |||||||||||||||||||||||||||
| Healogics, Inc., L+425, 1.00% LIBOR Floor, 7/1/2021(n) | 3 Month LIBOR | Healthcare & Pharmaceuticals | 4,687 | 4,667 | 4,687 | |||||||||||||||||||||||||||
| Heritage Power, LLC, L+600, 1.00% LIBOR Floor, 7/30/2026(i) | 6 Month LIBOR | Energy: Oil & Gas | 4,987 | 4,800 | 4,791 | |||||||||||||||||||||||||||
See accompanying notes to consolidated financial statements.
6
CĪON Investment Corporation
Consolidated Schedule of Investments (unaudited)
March 31, 2021
(in thousands)
| Portfolio Company(a) | Index Rate(b) | Industry | Principal/ Par Amount/ Units(e) | Cost(d) | Fair Value(c) | |||||||||||||||||||||||||||
| Hilliard, Martinez & Gonzales, LLP, L+1800, 2.00% LIBOR Floor, 12/17/2022(i)(n)(v) | 1 Month LIBOR | Services: Consumer | 22,124 | 22,033 | 21,801 | |||||||||||||||||||||||||||
| Homer City Generation, L.P., 15.00%, 4/5/2023(n)(v) | None | Energy: Oil & Gas | 10,999 | 11,420 | 8,716 | |||||||||||||||||||||||||||
| Hoover Group, Inc., L+850, 1.25% LIBOR Floor, 10/1/2024(o) | 3 Month LIBOR | Services: Business | 5,195 | 5,177 | 5,228 | |||||||||||||||||||||||||||
| HUMC Holdco, LLC, 9.00%, 4/15/2021(n) | None | Healthcare & Pharmaceuticals | 9,667 | 9,662 | 9,594 | |||||||||||||||||||||||||||
| Hummel Station LLC, L+600, 1.00% LIBOR Floor, 10/27/2022(i)(n)(o) | 1 Month LIBOR | Energy: Oil & Gas | 14,120 | 13,800 | 13,643 | |||||||||||||||||||||||||||
| Hummel Station LLC, L+600, 1.00% LIBOR Floor, 10/27/2022(i)(n) | 1 Month LIBOR | Energy: Oil & Gas | 875 | 846 | 845 | |||||||||||||||||||||||||||
| Hyperion Materials & Technologies, Inc., L+550, 1.00% LIBOR Floor, 8/28/2026(n) | 3 Month LIBOR | Chemicals, Plastics & Rubber | 9,875 | 9,713 | 9,850 | |||||||||||||||||||||||||||
| Independent Pet Partners Intermediate Holdings, LLC, 6.00%, 11/20/2023(n)(v) | None | Retail | 9,837 | 9,755 | 8,276 | |||||||||||||||||||||||||||
| Independent Pet Partners Intermediate Holdings, LLC, PRIME+500, 12/22/2022(n)(v) | Prime | Retail | 2,004 | 2,004 | 2,004 | |||||||||||||||||||||||||||
| Independent Pet Partners Intermediate Holdings, LLC, L+600, 0.00% LIBOR Floor, 12/22/2022(n)(v) | 3 Month LIBOR | Retail | 256 | 256 | 256 | |||||||||||||||||||||||||||
| Infinity Sales Group, LLC, L+1050, 1.00% LIBOR Floor, 11/23/2022(n) | 1 Month LIBOR | Services: Business | 6,820 | 6,748 | 6,820 | |||||||||||||||||||||||||||
| InfoGroup Inc., L+500, 1.00% LIBOR Floor, 4/3/2023(n)(o) | 3 Month LIBOR | Media: Advertising, Printing & Publishing | 15,554 | 15,546 | 14,860 | |||||||||||||||||||||||||||
| Instant Web, LLC, L+650, 1.00% LIBOR Floor, 12/15/2022(n)(o) | 1 Month LIBOR | Media: Advertising, Printing & Publishing | 37,060 | 37,024 | 34,513 | |||||||||||||||||||||||||||
| Instant Web, LLC, 0.50% Unfunded, 12/15/2022 | None | Media: Advertising, Printing & Publishing | 2,704 | — | — | |||||||||||||||||||||||||||
| Isagenix International, LLC, L+575, 1.00% LIBOR Floor, 6/14/2025(i)(n) | 3 Month LIBOR | Beverage, Food & Tobacco | 17,667 | 15,866 | 14,708 | |||||||||||||||||||||||||||
| Island Medical Management Holdings, LLC, L+650, 1.00% LIBOR Floor, 9/1/2022(n)(o) | 3 Month LIBOR | Healthcare & Pharmaceuticals | 11,153 | 11,107 | 10,707 | |||||||||||||||||||||||||||
| Jenny C Acquisition, Inc., L+1050, 1.75% LIBOR Floor, 10/1/2024(n)(v) | 2 Month LIBOR | Services: Consumer | 11,661 | 11,592 | 10,597 | |||||||||||||||||||||||||||
| JP Intermediate B, LLC, L+550, 1.00% LIBOR Floor, 11/20/2025(n) | 3 Month LIBOR | Beverage, Food & Tobacco | 15,043 | 14,807 | 14,423 | |||||||||||||||||||||||||||
| KITV, Inc., L+750, 1.00% LIBOR Floor, 3/4/2026(n) | 3 Month LIBOR | Media: Diversified & Production | 20,500 | 20,500 | 20,551 | |||||||||||||||||||||||||||
| KNB Holdings Corp., L+550, 1.00% LIBOR Floor, 4/26/2024(n) | 6 Month LIBOR | Consumer Goods: Durable | 8,019 | 7,918 | 7,183 | |||||||||||||||||||||||||||
| Labvantage Solutions Inc., L+750, 1.00% LIBOR Floor, 9/30/2021(n)(o) | 1 Month LIBOR | High Tech Industries | 2,419 | 2,419 | 2,419 | |||||||||||||||||||||||||||
| Labvantage Solutions Ltd., E+750, 1.00% EURIBOR Floor, 9/30/2021(h) | 1 Month EURIBOR | High Tech Industries | € | 2,684 | 3,017 | 3,149 | ||||||||||||||||||||||||||
| LAV Gear Holdings, Inc., L+750, 1.00% LIBOR Floor, 10/31/2024(n)(o)(v) | 3 Month LIBOR | Services: Business | 25,679 | 25,311 | 24,170 | |||||||||||||||||||||||||||
| LAV Gear Holdings, Inc., L+750, 1.00% LIBOR Floor, 10/31/2024(n)(o)(v) | 3 Month LIBOR | Services: Business | 4,429 | 4,385 | 4,169 | |||||||||||||||||||||||||||
| LGC US Finco, LLC, L+650, 1.00% LIBOR Floor, 12/20/2025(n) | 1 Month LIBOR | Capital Equipment | 9,750 | 9,498 | 9,433 | |||||||||||||||||||||||||||
| Lift Brands, Inc., L+750, 1.00% LIBOR Floor, 6/29/2025(n)(o)(s) | 1 Month LIBOR | Services: Consumer | 23,642 | 23,642 | 23,642 | |||||||||||||||||||||||||||
| Lift Brands, Inc., 9.50%, 6/29/2025(n)(o)(s)(v) | None | Services: Consumer | 4,975 | 4,874 | 4,826 | |||||||||||||||||||||||||||
| Lift Brands, Inc., 6/29/2025(n)(o)(q)(s) | None | Services: Consumer | 5,296 | 4,717 | 4,673 | |||||||||||||||||||||||||||
| Longview Power, LLC, L+1000, 1.50% LIBOR Floor, 7/30/2025(s) | 3 Month LIBOR | Energy: Oil & Gas | 4,221 | 2,559 | 4,295 | |||||||||||||||||||||||||||
| Mimeo.com, Inc., L+700, 1.00% LIBOR Floor, 12/21/2023(q) | 3 Month LIBOR | Services: Business | 23,665 | 23,665 | 23,014 | |||||||||||||||||||||||||||
| Mimeo.com, Inc., L+1700, 1.00% LIBOR Floor, 12/21/2023(v) | 3 Month LIBOR | Services: Business | 2,688 | 2,688 | 2,758 | |||||||||||||||||||||||||||
| Mimeo.com, Inc., 1.00% Unfunded, 12/21/2023 | None | Services: Business | 500 | — | 13 | |||||||||||||||||||||||||||
| Moss Holding Company, L+700, 1.00% LIBOR Floor, 4/17/2024(n)(o)(v) | 3 Month LIBOR | Services: Business | 19,566 | 19,392 | 17,585 | |||||||||||||||||||||||||||
| Moss Holding Company, 0.50% Unfunded, 4/17/2023 | None | Services: Business | 2,232 | — | — | |||||||||||||||||||||||||||
| Napa Management Services Corp., L+500, 1.00% LIBOR Floor, 4/19/2023(i) | 3 Month LIBOR | Healthcare & Pharmaceuticals | 5,360 | 5,283 | 5,291 | |||||||||||||||||||||||||||
See accompanying notes to consolidated financial statements.
7
CĪON Investment Corporation
Consolidated Schedule of Investments (unaudited)
March 31, 2021
(in thousands)
| Portfolio Company(a) | Index Rate(b) | Industry | Principal/ Par Amount/ Units(e) | Cost(d) | Fair Value(c) | |||||||||||||||||||||||||||
| NASCO Healthcare Inc., L+450, 1.00% LIBOR Floor, 6/30/2023(n) | 3 Month LIBOR | Services: Business | 12,577 | 12,577 | 12,200 | |||||||||||||||||||||||||||
| NewsCycle Solutions, Inc., L+700, 1.00% LIBOR Floor, 12/29/2022(n)(o) | 3 Month LIBOR | Media: Advertising, Printing & Publishing | 12,155 | 12,080 | 12,034 | |||||||||||||||||||||||||||
| One Call Corp., L+525, 1.00% LIBOR Floor, 11/25/2022(n) | 3 Month LIBOR | Healthcare & Pharmaceuticals | 3,843 | 3,747 | 3,843 | |||||||||||||||||||||||||||
| Optio Rx, LLC, L+700, 0.00% LIBOR Floor, 6/28/2024(n)(o) | 3 Month LIBOR | Healthcare & Pharmaceuticals | 23,938 | 23,827 | 23,399 | |||||||||||||||||||||||||||
| Optio Rx, LLC, L+1000, 0.00% LIBOR Floor, 6/28/2024(o) | 3 Month LIBOR | Healthcare & Pharmaceuticals | 2,515 | 2,494 | 2,669 | |||||||||||||||||||||||||||
| Palmetto Solar, LLC, 12.00%, 12/12/2024(n) | None | High Tech Industries | 16,738 | 16,342 | 17,240 | |||||||||||||||||||||||||||
| Palmetto Solar, LLC, 0.75% Unfunded, 12/12/2021 | None | High Tech Industries | 3,262 | — | 98 | |||||||||||||||||||||||||||
| Patterson Medical Supply, Inc., L+475, 1.00% LIBOR Floor, 8/28/2022(i) | 1 Month LIBOR | Healthcare & Pharmaceuticals | 5,984 | 5,894 | 5,958 | |||||||||||||||||||||||||||
| PetroChoice Holdings, Inc., L+500, 1.00% LIBOR Floor, 8/20/2022(i) | 3 Month LIBOR | Chemicals, Plastics & Rubber | 3,927 | 3,807 | 3,777 | |||||||||||||||||||||||||||
| PH Beauty Holdings III. Inc., L+500, 0.00% LIBOR Floor, 9/28/2025(n) | 3 Month LIBOR | Consumer Goods: Non-Durable | 9,750 | 9,157 | 9,281 | |||||||||||||||||||||||||||
| Pixelle Specialty Solutions LLC, L+650, 1.00% LIBOR Floor, 10/31/2024(n) | 1 Month LIBOR | Forest Products & Paper | 21,686 | 21,388 | 21,717 | |||||||||||||||||||||||||||
| Plano Molding Company, LLC, L+900, 1.00% LIBOR Floor, 5/12/2022(n)(v) | 3 Month LIBOR | Consumer Goods: Non-Durable | 5,993 | 5,990 | 6,167 | |||||||||||||||||||||||||||
| Plano Molding Company, LLC, L+900, 1.00% LIBOR Floor, 5/11/2022(n)(v) | 3 Month LIBOR | Consumer Goods: Non-Durable | 732 | 727 | 754 | |||||||||||||||||||||||||||
| Polymer Additives, Inc., L+600, 0.00% LIBOR Floor, 7/31/2025(n) | 3 Month LIBOR | Chemicals, Plastics & Rubber | 19,550 | 19,281 | 17,888 | |||||||||||||||||||||||||||
| Securus Technologies Holdings, Inc., L+450, 1.00% LIBOR Floor, 11/1/2024(n) | 6 Month LIBOR | Telecommunications | 3,939 | 3,078 | 3,919 | |||||||||||||||||||||||||||
| Sequoia Healthcare Management, LLC, 12.75%, 8/21/2023(n)(o)(r) | None | Healthcare & Pharmaceuticals | 8,525 | 8,457 | 6,287 | |||||||||||||||||||||||||||
| SIMR, LLC, L+1700, 2.00% LIBOR Floor, 9/7/2023(s)(v) | 1 Month LIBOR | Healthcare & Pharmaceuticals | 17,896 | 17,728 | 15,078 | |||||||||||||||||||||||||||
| Smart & Final Inc., L+675, 0.00% LIBOR Floor, 6/20/2025(n) | 1 Month LIBOR | Retail | 7,755 | 7,202 | 7,823 | |||||||||||||||||||||||||||
| Software Luxembourg Acquisitions S.À.R.L., L+750, 1.00% LIBOR Floor, 4/27/2025(h)(o) | 3 Month LIBOR | High Tech Industries | 3,011 | 2,911 | 3,010 | |||||||||||||||||||||||||||
| Software Luxembourg Acquisitions S.À.R.L., L+750, 1.00% LIBOR Floor, 12/27/2024(h)(o) | 1 Month LIBOR | High Tech Industries | 807 | 784 | 815 | |||||||||||||||||||||||||||
| Sorenson Communications, LLC, L+550, 0.75% LIBOR Floor, 3/17/2026(n) | 3 Month LIBOR | Telecommunications | 10,000 | 9,900 | 10,025 | |||||||||||||||||||||||||||
| Spinal USA, Inc. / Precision Medical Inc., L+950, 10/1/2021(n) | 3 Month LIBOR | Healthcare & Pharmaceuticals | 12,587 | 12,546 | 12,178 | |||||||||||||||||||||||||||
| Spinal USA, Inc. / Precision Medical Inc., L+950, 10/1/2021(n)(v) | 3 Month LIBOR | Healthcare & Pharmaceuticals | 1,146 | 1,056 | 1,154 | |||||||||||||||||||||||||||
| Spinal USA, Inc. / Precision Medical Inc., L+950, 10/1/2021(n)(v) | 3 Month LIBOR | Healthcare & Pharmaceuticals | 619 | 493 | 599 | |||||||||||||||||||||||||||
| Stats Intermediate Holdings, LLC, L+525, 0.00% LIBOR Floor, 7/12/2026(n) | 3 Month LIBOR | High Tech Industries | 9,875 | 9,703 | 9,879 | |||||||||||||||||||||||||||
| Tenere Inc., L+850, 1.00% LIBOR Floor, 5/5/2025(n)(o) | 3 Month LIBOR | Capital Equipment | 18,080 | 18,035 | 18,125 | |||||||||||||||||||||||||||
| Tensar Corp., L+675, 1.00% LIBOR Floor, 10/20/2025(n) | 3 Month LIBOR | Chemicals, Plastics & Rubber | 4,988 | 4,872 | 5,025 | |||||||||||||||||||||||||||
| The Pasha Group, L+800, 1.00% LIBOR Floor, 1/26/2023(n)(o) | 1 Month LIBOR | Transportation: Cargo | 4,198 | 4,145 | 4,167 | |||||||||||||||||||||||||||
| The Pay-O-Matic Corp., L+900, 1.00% LIBOR Floor, 10/29/2021(j)(n) | 3 Month LIBOR | Services: Consumer | 6,737 | 6,737 | 6,738 | |||||||||||||||||||||||||||
| Vesta Holdings, LLC, L+1000, 1.00% LIBOR Floor, 2/25/2024(n) | 2 Month LIBOR | Banking, Finance, Insurance & Real Estate | 25,000 | 25,000 | 25,000 | |||||||||||||||||||||||||||
| Volta Charging, LLC, 12.00%, 6/19/2024(n) | None | Media: Diversified & Production | 15,000 | 15,000 | 16,050 | |||||||||||||||||||||||||||
| Volta Charging, LLC, 12.00%, 6/19/2024(n) | None | Media: Diversified & Production | 12,000 | 11,983 | 12,840 | |||||||||||||||||||||||||||
| West Dermatology Management Holdings, LLC, L+600, 1.00% LIBOR Floor, 2/11/2025(n)(o) | 3 Month LIBOR | Healthcare & Pharmaceuticals | 9,460 | 9,398 | 9,023 | |||||||||||||||||||||||||||
| West Dermatology Management Holdings, LLC, L+600, 1.00% LIBOR Floor, 2/11/2025(n) | 3 Month LIBOR | Healthcare & Pharmaceuticals | 1,657 | 1,644 | 1,578 | |||||||||||||||||||||||||||
| West Dermatology Management Holdings, LLC, L+750, 1.00% LIBOR Floor, 2/11/2025 | 3 Month LIBOR | Healthcare & Pharmaceuticals | 1,182 | 1,182 | 1,173 | |||||||||||||||||||||||||||
| West Dermatology Management Holdings, LLC, 0.75% Unfunded, 2/11/2022 | None | Healthcare & Pharmaceuticals | 7,655 | (23) | (57) | |||||||||||||||||||||||||||
See accompanying notes to consolidated financial statements.
8
CĪON Investment Corporation
Consolidated Schedule of Investments (unaudited)
March 31, 2021
(in thousands)
| Portfolio Company(a) | Index Rate(b) | Industry | Principal/ Par Amount/ Units(e) | Cost(d) | Fair Value(c) | |||||||||||||||||||||||||||
| Williams Industrial Services Group, Inc., L+900, 1.00% LIBOR Floor, 12/16/2025(o) | 3 Month LIBOR | Services: Business | 9,925 | 9,925 | 9,937 | |||||||||||||||||||||||||||
| Williams Industrial Services Group, Inc., 0.50% Unfunded, 6/16/2022 | None | Services: Business | 5,000 | — | 6 | |||||||||||||||||||||||||||
| Wind River Systems, Inc., L+675, 1.00% LIBOR Floor, 6/24/2024 | 3 Month LIBOR | High Tech Industries | 24,671 | 24,452 | 24,455 | |||||||||||||||||||||||||||
| Winebow Holdings, Inc., L+375, 1.00% LIBOR Floor, 7/1/2021(n)(o) | 1 Month LIBOR | Beverage, Food & Tobacco | 5,864 | 5,766 | 5,864 | |||||||||||||||||||||||||||
| Wok Holdings Inc., L+625, 0.00% LIBOR Floor, 3/1/2026(n) | 1 Month LIBOR | Beverage, Food & Tobacco | 20,496 | 19,967 | 19,583 | |||||||||||||||||||||||||||
| Total Senior Secured First Lien Debt | 1,283,804 | 1,255,426 | ||||||||||||||||||||||||||||||
| Senior Secured Second Lien Debt - 16.9% | ||||||||||||||||||||||||||||||||
| Access CIG, LLC, L+775, 0.00% LIBOR Floor, 2/27/2026(n)(o) | 1 Month LIBOR | Services: Business | 17,250 | 17,143 | 17,035 | |||||||||||||||||||||||||||
| Carestream Health, Inc., L+1250, 1.00% LIBOR Floor, 8/8/2023(n)(o)(v) | 3 Month LIBOR | Healthcare & Pharmaceuticals | 11,729 | 11,729 | 11,318 | |||||||||||||||||||||||||||
| Country Fresh Holdings, LLC, L+850, 1.00% LIBOR Floor, 4/29/2024(n)(r)(v) | 3 Month LIBOR | Beverage, Food & Tobacco | 2,297 | 2,297 | — | |||||||||||||||||||||||||||
| Dayton Superior Corp., L+700, 2.00% LIBOR Floor, 12/4/2024(n) | 3 Month LIBOR | Construction & Building | 1,489 | 1,489 | 1,487 | |||||||||||||||||||||||||||
| Deluxe Entertainment Services, Inc., L+850, 1.00% LIBOR Floor, 9/25/2024(n)(r)(s)(v) | 3 Month LIBOR | Media: Diversified & Production | 10,335 | 10,017 | — | |||||||||||||||||||||||||||
| LSCS Holdings, Inc., L+825, 0.00% LIBOR Floor, 3/16/2026(n) | 3 Month LIBOR | Services: Business | 11,891 | 11,695 | 11,653 | |||||||||||||||||||||||||||
| Global Tel*Link Corp., L+825, 0.00% LIBOR Floor, 11/29/2026(o) | 1 Month LIBOR | Telecommunications | 11,500 | 11,340 | 11,385 | |||||||||||||||||||||||||||
| Medical Solutions Holdings, Inc., L+838, 1.00% LIBOR Floor, 6/16/2025(n) | 6 Month LIBOR | Healthcare & Pharmaceuticals | 10,000 | 9,902 | 9,750 | |||||||||||||||||||||||||||
| MedPlast Holdings, Inc., L+775, 0.00% LIBOR Floor, 7/2/2026(n) | 1 Month LIBOR | Healthcare & Pharmaceuticals | 6,750 | 6,700 | 6,193 | |||||||||||||||||||||||||||
| Ministry Brands, LLC, L+925, 1.00% LIBOR Floor, 6/2/2023(n)(o) | 2 Month LIBOR | Services: Business | 7,000 | 6,994 | 6,974 | |||||||||||||||||||||||||||
| Niacet Corp., E+875, 1.00% EURIBOR Floor, 8/1/2024(h) | 1 Month EURIBOR | Chemicals, Plastics & Rubber | € | 6,263 | 6,712 | 7,346 | ||||||||||||||||||||||||||
| Patterson Medical Supply, Inc., L+1050, 1.00% LIBOR Floor, 8/28/2023(n)(v) | 3 Month LIBOR | Healthcare & Pharmaceuticals | 15,187 | 15,129 | 14,769 | |||||||||||||||||||||||||||
| PetroChoice Holdings, Inc., L+875, 1.00% LIBOR Floor, 8/21/2023 | 3 Month LIBOR | Chemicals, Plastics & Rubber | 15,000 | 14,339 | 14,550 | |||||||||||||||||||||||||||
| Premiere Global Services, Inc., L+950, 1.00% LIBOR Floor, 6/6/2024(v) | 3 Month LIBOR | Telecommunications | 3,502 | 3,436 | 1,996 | |||||||||||||||||||||||||||
| Securus Technologies Holdings, Inc., L+825, 1.00% LIBOR Floor, 11/1/2025 | 3 Month LIBOR | Telecommunications | 2,942 | 2,920 | 2,770 | |||||||||||||||||||||||||||
| TMK Hawk Parent, Corp., L+800, 1.00% LIBOR Floor, 8/28/2025 | 1 Month LIBOR | Services: Business | 13,393 | 13,170 | 9,877 | |||||||||||||||||||||||||||
| Winebow Holdings, Inc., L+750, 1.00% LIBOR Floor, 1/2/2022(n) | 1 Month LIBOR | Beverage, Food & Tobacco | 12,823 | 12,763 | 12,823 | |||||||||||||||||||||||||||
| Zest Acquisition Corp., L+750, 1.00% LIBOR Floor, 3/14/2026(n)(o) | 1 Month LIBOR | Healthcare & Pharmaceuticals | 15,000 | 14,895 | 14,700 | |||||||||||||||||||||||||||
| Total Senior Secured Second Lien Debt | 172,670 | 154,626 | ||||||||||||||||||||||||||||||
See accompanying notes to consolidated financial statements.
9
CĪON Investment Corporation
Consolidated Schedule of Investments (unaudited)
March 31, 2021
(in thousands)
| Portfolio Company(a) | Index Rate(b) | Industry | Principal/ Par Amount/ Units(e) | Cost(d) | Fair Value(c) | |||||||||||||||||||||||||||
| Collateralized Securities and Structured Products - Equity - 1.5% | ||||||||||||||||||||||||||||||||
| APIDOS CLO XVI Subordinated Notes, 0.00% Estimated Yield, 1/19/2025(h) | (g) | Diversified Financials | 9,000 | 3,007 | 1,799 | |||||||||||||||||||||||||||
| CENT CLO 19 Ltd. Subordinated Notes, 0.00% Estimated Yield, 10/29/2025(h) | (g) | Diversified Financials | 2,000 | 1,161 | 407 | |||||||||||||||||||||||||||
| Galaxy XV CLO Ltd. Class A Subordinated Notes, 5.76% Estimated Yield, 4/15/2025(h) | (g) | Diversified Financials | 4,000 | 1,937 | 1,784 | |||||||||||||||||||||||||||
| Ivy Hill Middle Market Credit Fund VIII, Ltd. Subordinated Loan, 11.84% Estimated Yield, 2/2/2026(h) | (g) | Diversified Financials | 10,000 | 9,047 | 9,850 | |||||||||||||||||||||||||||
| Total Collateralized Securities and Structured Products - Equity | 15,152 | 13,840 | ||||||||||||||||||||||||||||||
| Unsecured Debt - 0.6% | ||||||||||||||||||||||||||||||||
| WPLM Acquisition Corp., 15.00%, 11/24/2025(v) | None | Media: Advertising, Printing & Publishing | 5,752 | 5,671 | 5,493 | |||||||||||||||||||||||||||
| Total Unsecured Debt | 5,671 | 5,493 | ||||||||||||||||||||||||||||||
| Equity - 11.5% | ||||||||||||||||||||||||||||||||
| 1244301 B.C. LTD., Common Shares(p)(s) | Chemicals, Plastics & Rubber | 807,268 Units | — | 266 | ||||||||||||||||||||||||||||
| ACNR Holdings, Inc., Common Stock(p) | Metals & Mining | 6,018 Units | 90 | 90 | ||||||||||||||||||||||||||||
| ACNR Holdings, Inc., Preferred Stock(p) | Metals & Mining | 1,890 Units | 26 | 168 | ||||||||||||||||||||||||||||
| Alert 360 Topco, Inc., Common Stock(p)(s) | Services: Consumer | 584,498 Units | 3,624 | 3,634 | ||||||||||||||||||||||||||||
| American Clinical Solutions LLC, Class A Membership Interests(p)(s) | Healthcare & Pharmaceuticals | 6,030,384 Units | 1,658 | 4,704 | ||||||||||||||||||||||||||||
| Anthem Sports and Entertainment Inc., Class A Preferred Stock Warrants(p) | Media: Diversified & Production | 907 Units | 205 | 155 | ||||||||||||||||||||||||||||
| Anthem Sports and Entertainment Inc., Class B Preferred Stock Warrants(p) | Media: Diversified & Production | 160 Units | — | — | ||||||||||||||||||||||||||||
| Anthem Sports and Entertainment Inc., Common Stock Warrants(p) | Media: Diversified & Production | 2,960 Units | — | — | ||||||||||||||||||||||||||||
| ARC Financial Partners, LLC, Membership Interests (25% ownership)(p)(s) | Metals & Mining | N/A | — | — | ||||||||||||||||||||||||||||
| Ascent Resources - Marcellus, LLC, Membership Units(p) | Energy: Oil & Gas | 511,255 Units | 1,642 | 419 | ||||||||||||||||||||||||||||
| Ascent Resources - Marcellus, LLC, Warrants(p) | Energy: Oil & Gas | 132,367 Units | 13 | 1 | ||||||||||||||||||||||||||||
| BCP Great Lakes Fund LP, Partnership Interests (11.4% ownership)(h)(s) | Diversified Financials | N/A | 10,857 | 10,857 | ||||||||||||||||||||||||||||
| Carestream Health Holdings, Inc., Warrants(p) | Healthcare & Pharmaceuticals | 233 Units | 565 | 717 | ||||||||||||||||||||||||||||
| CHC Medical Partners, Inc., Series C Preferred Stock, 12% Dividend(u) | Healthcare & Pharmaceuticals | 2,727,273 Units | 5,553 | 7,227 | ||||||||||||||||||||||||||||
| CION SOF Funding, LLC, Membership Interests (87.5% ownership)(t) | Diversified Financials | N/A | — | — | ||||||||||||||||||||||||||||
| Conisus Holdings, Inc., Series B Preferred Stock, 12% Dividend(s)(u) | Healthcare & Pharmaceuticals | 12,677,833 Units | 15,618 | 18,782 | ||||||||||||||||||||||||||||
| Conisus Holdings, Inc., Common Stock(p)(s) | Healthcare & Pharmaceuticals | 4,914,556 Units | 200 | 18,118 | ||||||||||||||||||||||||||||
| Country Fresh Holdings, LLC, Membership Units(p) | Beverage, Food & Tobacco | 2,985 Units | 5,249 | — | ||||||||||||||||||||||||||||
| Dayton HoldCo, LLC, Membership Units(p) | Construction & Building | 37,264 Units | 4,136 | 6,983 | ||||||||||||||||||||||||||||
| DBI Investors, Inc., Series A1 Preferred Stock(p) | Retail | 20,000 Units | 802 | — | ||||||||||||||||||||||||||||
| DBI Investors, Inc., Series A Preferred Stock(p) | Retail | 1,396 Units | 140 | — | ||||||||||||||||||||||||||||
See accompanying notes to consolidated financial statements.
10
CĪON Investment Corporation
Consolidated Schedule of Investments (unaudited)
March 31, 2021
(in thousands)
| Portfolio Company(a) | Industry | Principal/ Par Amount/ Units(e) | Cost(d) | Fair Value(c) | ||||||||||||||||||||||||||||
| DBI Investors, Inc., Series B Preferred Stock(p) | Retail | 4,183 Units | 410 | — | ||||||||||||||||||||||||||||
| DBI Investors, Inc., Common Stock(p) | Retail | 39,423 Units | — | — | ||||||||||||||||||||||||||||
| DBI Investors, Inc., Reallocation Rights(p) | Retail | 7,500 Units | — | — | ||||||||||||||||||||||||||||
| DESG Holdings, Inc., Common Stock(i)(p)(s) | Media: Diversified & Production | 1,268,143 Units | 13,675 | — | ||||||||||||||||||||||||||||
| HDNet Holdco LLC, Preferred Unit Call Option(p) | Media: Diversified & Production | 1 Unit | — | — | ||||||||||||||||||||||||||||
| Independent Pet Partners Intermediate Holdings, LLC, Class A Preferred Units(p) | Retail | 1,000,000 Units | 1,000 | — | ||||||||||||||||||||||||||||
| Independent Pet Partners Intermediate Holdings, LLC, Class B-2 Preferred Units(p) | Retail | 2,632,771 Units | 2,133 | 1,178 | ||||||||||||||||||||||||||||
| Independent Pet Partners Intermediate Holdings, LLC, Class C Preferred Units(p) | Retail | 2,632,771 Units | 2,633 | 2,682 | ||||||||||||||||||||||||||||
| Independent Pet Partners Intermediate Holdings, LLC, Warrants(p) | Retail | 155,880 Units | — | — | ||||||||||||||||||||||||||||
| Longview Intermediate Holdings C, LLC, Membership Units(p)(s) | Energy: Oil & Gas | 589,487 Units | 2,524 | 8,618 | ||||||||||||||||||||||||||||
| Mooregate ITC Acquisition, LLC, Class A Units(p)(s) | High Tech Industries | 500 Units | 563 | 89 | ||||||||||||||||||||||||||||
| Mount Logan Capital Inc., Common Stock(f)(h)(s) | Banking, Finance, Insurance & Real Estate | 1,075,557 Units | 3,534 | 2,397 | ||||||||||||||||||||||||||||
| NS NWN Acquisition, LLC, Voting Units(p) | High Tech Industries | 346 Units | 393 | 1,474 | ||||||||||||||||||||||||||||
| NS NWN Acquisition, LLC, Class A Preferred Units(p) | High Tech Industries | 111 Units | 110 | 332 | ||||||||||||||||||||||||||||
| NSG Co-Invest (Bermuda) LP, Partnership Interests(h)(p) | Consumer Goods: Durable | 1,575 Units | 1,000 | 676 | ||||||||||||||||||||||||||||
| Palmetto Clean Technology, Inc., Warrants(p) | High Tech Industries | 724,112 Units | 472 | 2,556 | ||||||||||||||||||||||||||||
| Phillips Pet Holding Corp., Common Stock(p) | Retail | 235 Units | 13 | 17 | ||||||||||||||||||||||||||||
| SIMR Parent, LLC, Class B Common Units(p)(s) | Healthcare & Pharmaceuticals | 12,283,163 Units | 8,002 | — | ||||||||||||||||||||||||||||
| SIMR Parent, LLC, Class W Units(p)(s) | Healthcare & Pharmaceuticals | 1,778,219 Units | — | — | ||||||||||||||||||||||||||||
| Snap Fitness Holdings, Inc., Class A Stock(p)(s) | Services: Consumer | 9,858 Units | 3,078 | 3,453 | ||||||||||||||||||||||||||||
| Snap Fitness Holdings, Inc., Warrants(p)(s) | Services: Consumer | 3,996 Units | 1,247 | 1,400 | ||||||||||||||||||||||||||||
| Software Luxembourg Holding S.A., Class A Common Stock(h)(p) | High Tech Industries | 28,202 Units | 4,536 | 5,323 | ||||||||||||||||||||||||||||
| Software Luxembourg Holding S.A., Class B Common Stock(h)(p) | High Tech Industries | 2,388 Units | 384 | 647 | ||||||||||||||||||||||||||||
| Software Luxembourg Holding S.A., Class A Warrants(h)(p) | High Tech Industries | 3,512 Units | 117 | — | ||||||||||||||||||||||||||||
| Software Luxembourg Holding S.A., Class B Warrants(h)(p) | High Tech Industries | 7,023 Units | 220 | — | ||||||||||||||||||||||||||||
| Spinal USA, Inc. / Precision Medical Inc., Warrants(p) | Healthcare & Pharmaceuticals | 14,181,915 Units | 5,806 | — | ||||||||||||||||||||||||||||
| Tenere Inc., Warrants(p)(s) | Capital Equipment | N/A | 161 | 1,700 | ||||||||||||||||||||||||||||
| Total Equity | 102,389 | 104,663 | ||||||||||||||||||||||||||||||
| Short Term Investments - 9.6%(l) | ||||||||||||||||||||||||||||||||
| First American Treasury Obligations Fund, Class Z Shares, 0.03%(m) | 87,593 | 87,593 | ||||||||||||||||||||||||||||||
| Total Short Term Investments | 87,593 | 87,593 | ||||||||||||||||||||||||||||||
| TOTAL INVESTMENTS - 177.6% | $ | 1,667,279 | 1,621,641 | |||||||||||||||||||||||||||||
| LIABILITIES IN EXCESS OF OTHER ASSETS - (77.6%) | (708,699) | |||||||||||||||||||||||||||||||
| NET ASSETS - 100% | $ | 912,942 | ||||||||||||||||||||||||||||||
a.All of the Company’s investments are issued by eligible U.S. portfolio companies, as defined in the Investment Company Act of 1940, as amended, or the 1940 Act, except for investments specifically identified as non-qualifying per note h. below. Unless specifically identified in note v. below, investments do not contain a paid-in-kind, or PIK, interest provision.
See accompanying notes to consolidated financial statements.
11
CĪON Investment Corporation
Consolidated Schedule of Investments (unaudited)
March 31, 2021
(in thousands)
b.The 1, 2, 3 and 6 month London Interbank Offered Rate, or LIBOR, rates were 0.11%, 0.13%, 0.19% and 0.21%, respectively, as of March 31, 2021. The actual LIBOR rate for each loan listed may not be the applicable LIBOR rate as of March 31, 2021, as the loan may have been priced or repriced based on a LIBOR rate prior to or subsequent to March 31, 2021. The 1 month Euro Interbank Offered Rate, or EURIBOR, rate was (0.58%) as of March 31, 2021.
c.Fair value determined in good faith by the Company’s board of directors (see Note 9) using significant unobservable inputs unless otherwise noted.
d.Represents amortized cost for debt securities and cost for equity investments.
e.Denominated in U.S. dollars unless otherwise noted.
f.Fair value determined using level 1 inputs.
g.The CLO subordinated notes are considered equity positions in the CLO vehicles and are not rated. Equity investments are entitled to recurring distributions, which are generally equal to the remaining cash flow of the payments made by the underlying vehicle's securities less contractual payments to debt holders and expenses. The estimated yield indicated is based upon a current projection of the amount and timing of these recurring distributions and the estimated amount of repayment of principal upon termination. Such projections are periodically reviewed and adjusted, and the estimated yield may not ultimately be realized.
h.The investment or a portion thereof is not a qualifying asset under the 1940 Act. A business development company may not acquire any asset other than qualifying assets, unless, at the time the acquisition is made, qualifying assets represent at least 70% of the company’s total assets as defined under Section 55 of the 1940 Act. As of March 31, 2021, 96.5% of the Company’s total assets represented qualifying assets.
i.Position or a portion thereof unsettled as of March 31, 2021.
j.As a result of an arrangement between the Company and the other lenders in the syndication, the Company is entitled to less interest than the stated interest rate of this loan, which is reflected in this schedule, in exchange for a higher payment priority.
k.In addition to the interest earned based on the stated interest rate of this loan, which is the amount reflected in this schedule, the Company may be entitled to receive additional residual amounts.
l.Short term investments represent an investment in a fund that invests in highly liquid investments with average original maturity dates of three months or less.
m.7-day effective yield as of March 31, 2021.
n.Investment or a portion thereof held within the Company’s wholly-owned consolidated subsidiary, 34th Street Funding, LLC, or 34th Street, and was pledged as collateral supporting the amounts outstanding under the credit facility with JPMorgan Chase Bank, National Association, or JPM, as of March 31, 2021 (see Note 8).
o.Investment or a portion thereof held within the Company’s wholly-owned consolidated subsidiary, Murray Hill Funding II, LLC, or Murray Hill Funding II, and was pledged as collateral supporting the amounts outstanding under the repurchase agreement with UBS AG, or UBS, as of March 31, 2021 (see Note 8).
p.Non-income producing security.
q.The ultimate interest earned on this loan will be determined based on the portfolio company’s EBITDA at a specified trigger event.
r.Investment or a portion thereof was on non-accrual status as of March 31, 2021.
See accompanying notes to consolidated financial statements.
12
CĪON Investment Corporation
Consolidated Schedule of Investments (unaudited)
March 31, 2021
(in thousands)
s.Investment determined to be an affiliated investment as defined in the 1940 Act as the Company owns between 5% and 25% of the portfolio company’s outstanding voting securities but does not control the portfolio company. Fair value as of December 31, 2020 and March 31, 2021, along with transactions during the three months ended March 31, 2021 in these affiliated investments, are as follows:
| Three Months Ended March 31, 2021 | Three Months Ended March 31, 2021 | |||||||||||||||||||||||||||||||||||||||||||||||||
| Non-Controlled, Affiliated Investments | Fair Value at December 31, 2020 | Gross Additions (Cost)(1) | Gross Reductions (Cost)(2) | Net Unrealized Gain (Loss) | Fair Value at March 31, 2021 | Net Realized Gain (Loss) | Interest Income(3) | Dividend Income | ||||||||||||||||||||||||||||||||||||||||||
| 1244301 B.C. LTD. | ||||||||||||||||||||||||||||||||||||||||||||||||||
| First Lien Term Loan A | $ | 2,289 | $ | 5 | $ | (6) | $ | 19 | $ | 2,307 | $ | — | $ | 41 | $ | — | ||||||||||||||||||||||||||||||||||
| First Lien Term Loan B | 755 | 15 | — | 6 | 776 | — | 14 | — | ||||||||||||||||||||||||||||||||||||||||||
| Common Shares | — | — | — | 266 | 266 | — | — | — | ||||||||||||||||||||||||||||||||||||||||||
| Alert 360 Opco, Inc. | ||||||||||||||||||||||||||||||||||||||||||||||||||
| First Lien Term Loan | — | 12,239 | (31) | 16 | 12,224 | — | 201 | — | ||||||||||||||||||||||||||||||||||||||||||
| Common Stock | — | 3,624 | — | 10 | 3,634 | — | — | — | ||||||||||||||||||||||||||||||||||||||||||
| American Clinical Solutions LLC | ||||||||||||||||||||||||||||||||||||||||||||||||||
| Tranche I Term Loan | 3,124 | 9 | — | 131 | 3,264 | — | 70 | — | ||||||||||||||||||||||||||||||||||||||||||
| First Amendment Tranche I Term Loan | 242 | — | — | 1 | 243 | — | 4 | — | ||||||||||||||||||||||||||||||||||||||||||
| Class A Membership Interests | 663 | — | — | 4,041 | 4,704 | — | — | — | ||||||||||||||||||||||||||||||||||||||||||
| ARC Financial, LLC | ||||||||||||||||||||||||||||||||||||||||||||||||||
| Membership Interests | — | — | — | — | — | — | — | — | ||||||||||||||||||||||||||||||||||||||||||
| BCP Great Lakes Fund LP | ||||||||||||||||||||||||||||||||||||||||||||||||||
| Membership Interests | 12,611 | 904 | (2,911) | 253 | 10,857 | — | — | 323 | ||||||||||||||||||||||||||||||||||||||||||
| Charming Charlie, LLC | ||||||||||||||||||||||||||||||||||||||||||||||||||
| Vendor Payment Financing Facility | 350 | — | — | — | 350 | — | — | — | ||||||||||||||||||||||||||||||||||||||||||
| Conisus Holdings, Inc. | ||||||||||||||||||||||||||||||||||||||||||||||||||
| Series B Preferred Stock | 16,481 | 475 | — | 1,826 | 18,782 | — | — | 475 | ||||||||||||||||||||||||||||||||||||||||||
| Common Stock | 12,401 | — | — | 5,717 | 18,118 | — | — | — | ||||||||||||||||||||||||||||||||||||||||||
| DESG Holdings, Inc. | ||||||||||||||||||||||||||||||||||||||||||||||||||
| First Lien Term Loan | 3,978 | 34 | (432) | (10) | 3,570 | — | 82 | — | ||||||||||||||||||||||||||||||||||||||||||
| Second Lien Term Loan | — | — | — | — | — | — | — | — | ||||||||||||||||||||||||||||||||||||||||||
| Common Stock | — | — | — | — | — | — | — | — | ||||||||||||||||||||||||||||||||||||||||||
| F+W Media, Inc. | ||||||||||||||||||||||||||||||||||||||||||||||||||
| First Lien Term Loan B-1 | — | — | (1,115) | 1,115 | — | (1,080) | — | — | ||||||||||||||||||||||||||||||||||||||||||
| Lift Brands, Inc. | ||||||||||||||||||||||||||||||||||||||||||||||||||
| Term Loan A | 23,642 | — | — | — | 23,642 | — | 502 | — | ||||||||||||||||||||||||||||||||||||||||||
| Term Loan B | 4,751 | 121 | — | (46) | 4,826 | — | 121 | — | ||||||||||||||||||||||||||||||||||||||||||
| Term Loan C | 4,687 | 32 | — | (46) | 4,673 | — | 32 | — | ||||||||||||||||||||||||||||||||||||||||||
| Longview Intermediate Holdings C, LLC | ||||||||||||||||||||||||||||||||||||||||||||||||||
| Membership Units | 7,988 | — | — | 630 | 8,618 | — | — | — | ||||||||||||||||||||||||||||||||||||||||||
| Longview Power, LLC | ||||||||||||||||||||||||||||||||||||||||||||||||||
| First Lien Term Loan | 2,414 | 1,934 | (6) | (47) | 4,295 | — | 150 | — | ||||||||||||||||||||||||||||||||||||||||||
| Mount Logan Capital Inc. | ||||||||||||||||||||||||||||||||||||||||||||||||||
| Common Stock | 2,409 | — | — | (12) | 2,397 | — | — | 29 | ||||||||||||||||||||||||||||||||||||||||||
| SIMR, LLC | ||||||||||||||||||||||||||||||||||||||||||||||||||
| First Lien Term Loan | 13,347 | 1,753 | — | (22) | 15,078 | — | 1,007 | — | ||||||||||||||||||||||||||||||||||||||||||
| SIMR Parent, LLC | ||||||||||||||||||||||||||||||||||||||||||||||||||
| Class B Membership Units | — | — | — | — | — | — | — | — | ||||||||||||||||||||||||||||||||||||||||||
| Warrants | — | — | — | — | — | — | — | — | ||||||||||||||||||||||||||||||||||||||||||
| Snap Fitness Holdings, Inc. | ||||||||||||||||||||||||||||||||||||||||||||||||||
| Class A Stock | 3,389 | — | — | 64 | 3,453 | — | — | — | ||||||||||||||||||||||||||||||||||||||||||
| Warrants | 1,374 | — | — | 26 | 1,400 | — | — | — | ||||||||||||||||||||||||||||||||||||||||||
| Totals | $ | 116,895 | $ | 21,145 | $ | (4,501) | $ | 13,938 | $ | 147,477 | $ | (1,080) | $ | 2,224 | $ | 827 | ||||||||||||||||||||||||||||||||||
(1)Gross additions include increases in the cost basis of investments resulting from new portfolio investments, PIK interest, the amortization of unearned income, the exchange of one or more existing securities for one or more new securities and the movement of an existing portfolio company into this category from a different category.
See accompanying notes to consolidated financial statements.
13
CĪON Investment Corporation
Consolidated Schedule of Investments (unaudited)
March 31, 2021
(in thousands)
(2)Gross reductions include decreases in the cost basis of investments resulting from principal collections related to investment repayments or sales, the exchange of one or more existing securities for one or more new securities and the movement of an existing portfolio company out of this category into a different category.
(3)Includes PIK interest income.
t.Investment determined to be a controlled investment as defined in the 1940 Act as the Company is deemed to exercise a controlling influence over the management or policies of the portfolio company due to beneficially owning, either directly or through one or more controlled companies, more than 25% of the outstanding voting securities of such portfolio company. Fair value as of December 31, 2020 and March 31, 2021, along with transactions during the three months ended March 31, 2021 in these controlled investments, are as follows:
| Three Months Ended March 31, 2021 | Three Months Ended March 31, 2021 | |||||||||||||||||||||||||||||||||||||||||||||||||
| Controlled Investments | Fair Value at December 31, 2020 | Gross Additions (Cost)(1) | Gross Reductions (Cost)(2) | Net Unrealized Gain (Loss) | Fair Value at March 31, 2021 | Net Realized Gain (Loss) | Interest Income(3) | Dividend Income | ||||||||||||||||||||||||||||||||||||||||||
| CION SOF Funding, LLC | ||||||||||||||||||||||||||||||||||||||||||||||||||
| Membership Interests | $ | 12,472 | $ | — | $ | (15,539) | $ | 3,067 | $ | — | $ | (3,067) | $ | — | $ | — | ||||||||||||||||||||||||||||||||||
| Totals | $ | 12,472 | $ | — | $ | (15,539) | $ | 3,067 | $ | — | $ | (3,067) | $ | — | $ | — | ||||||||||||||||||||||||||||||||||
(1)Gross additions include increases in the cost basis of investments resulting from new portfolio investments, PIK interest, the amortization of unearned income, the exchange of one or more existing securities for one or more new securities and the movement of an existing portfolio company into this category from a different category.
(2)Gross reductions include decreases in the cost basis of investments resulting from principal collections related to investment repayments or sales, the exchange of one or more existing securities for one or more new securities and the movement of an existing portfolio company out of this category into a different category.
(3)Includes PIK interest income.
u.For the three months ended March 31, 2021, non-cash dividend income of $475 and $82 was recorded on the Company's investment in Conisus Holdings, Inc. and CHC Medical Partners, Inc., respectively.
See accompanying notes to consolidated financial statements.
14
CĪON Investment Corporation
Consolidated Schedule of Investments (unaudited)
March 31, 2021
(in thousands)
v.As of March 31, 2021, the following investments contain a PIK interest provision whereby the issuer has either the option or the obligation to make interest payments with the issuance of additional securities:
| Interest Rate | ||||||||||||||||||||||||||
| Portfolio Company | Investment Type | Cash | PIK | All-in-Rate | ||||||||||||||||||||||
| 1244311 B.C. LTD. | Senior Secured First Lien Debt | — | 6.00% | 6.00% | ||||||||||||||||||||||
| Adapt Laser Acquisition, Inc. | Senior Secured First Lien Debt | 11.00% | 2.00% | 13.00% | ||||||||||||||||||||||
| Alliance Healthcare Services, Inc. | Senior Secured First Lien Debt | 4.50% | 1.00% | 5.50% | ||||||||||||||||||||||
| American Consolidated Natural Resources, Inc. | Senior Secured First Lien Debt | 11.00% | 3.00% | 14.00% | ||||||||||||||||||||||
| Anthem Sports & Entertainment Inc. | Senior Secured First Lien Debt | 7.75% | 2.75% | 10.50% | ||||||||||||||||||||||
| Cadence Aerospace, LLC | Senior Secured First Lien Debt | 4.25% | 5.25% | 9.50% | ||||||||||||||||||||||
| Carestream Health, Inc. | Senior Secured Second Lien Debt | 5.50% | 8.00% | 13.50% | ||||||||||||||||||||||
| CHC Solutions Inc. | Senior Secured First Lien Debt | 8.00% | 4.00% | 12.00% | ||||||||||||||||||||||
| CircusTrix Holdings, LLC | Senior Secured First Lien Debt | — | 9.00% | 9.00% | ||||||||||||||||||||||
| CircusTrix Holdings, LLC | Senior Secured First Lien Debt | 6.50% | 2.50% | 9.00% | ||||||||||||||||||||||
| Country Fresh Holdings, LLC | Senior Secured First Lien Debt | 8.00% | 4.00% | 12.00% | ||||||||||||||||||||||
| Country Fresh Holdings, LLC | Senior Secured First Lien Debt | — | 15.00% | 15.00% | ||||||||||||||||||||||
| Country Fresh Holdings, LLC | Senior Secured Second Lien Debt | — | 9.50% | 9.50% | ||||||||||||||||||||||
| David's Bridal, LLC | Senior Secured First Lien Debt | 6.00% | 1.00% | 7.00% | ||||||||||||||||||||||
| David's Bridal, LLC | Senior Secured First Lien Debt | 6.00% | 5.00% | 11.00% | ||||||||||||||||||||||
| Deluxe Entertainment Services, Inc. | Senior Secured First Lien Debt | 6.00% | 1.50% | 7.50% | ||||||||||||||||||||||
| Deluxe Entertainment Services, Inc. | Senior Secured Second Lien Debt | 7.00% | 2.50% | 9.50% | ||||||||||||||||||||||
| Hilliard, Martinez & Gonzales, LLP | Senior Secured First Lien Debt | — | 20.00% | 20.00% | ||||||||||||||||||||||
| Homer City Generation, L.P. | Senior Secured First Lien Debt | — | 15.00% | 15.00% | ||||||||||||||||||||||
| Independent Pet Partners Intermediate Holdings, LLC | Senior Secured First Lien Debt | — | 6.00% | 6.00% | ||||||||||||||||||||||
| Independent Pet Partners Intermediate Holdings, LLC | Senior Secured First Lien Debt | — | 8.25% | 8.25% | ||||||||||||||||||||||
| Independent Pet Partners Intermediate Holdings, LLC | Senior Secured First Lien Debt | 0.19% | 6.00% | 6.19% | ||||||||||||||||||||||
| Jenny C Acquisition, Inc. | Senior Secured First Lien Debt | — | 12.25% | 12.25% | ||||||||||||||||||||||
| LAV Gear Holdings, Inc. | Senior Secured First Lien Debt | 3.50% | 5.00% | 8.50% | ||||||||||||||||||||||
| Lift Brands, Inc. | Senior Secured First Lien Debt | — | 9.50% | 9.50% | ||||||||||||||||||||||
| Mimeo.com, Inc. | Revolving Term Loan | 8.00% | 10.00% | 18.00% | ||||||||||||||||||||||
| Moss Holding Company | Senior Secured First Lien Debt | 7.50% | 0.50% | 8.00% | ||||||||||||||||||||||
| Patterson Medical Supply, Inc. | Senior Secured Second Lien Debt | 1.00% | 10.50% | 11.50% | ||||||||||||||||||||||
| Plano Molding Company, LLC | Senior Secured First Lien Debt | 8.50% | 1.50% | 10.00% | ||||||||||||||||||||||
| Premiere Global Services, Inc. | Senior Secured Second Lien Debt | 0.50% | 10.00% | 10.50% | ||||||||||||||||||||||
| SIMR, LLC | Senior Secured First Lien Debt | — | 19.00% | 19.00% | ||||||||||||||||||||||
| Spinal USA, Inc. / Precision Medical Inc. | Senior Secured First Lien Debt | — | 9.70% | 9.70% | ||||||||||||||||||||||
| WPLM Acquisition Corp. | Unsecured Note | — | 15.00% | 15.00% | ||||||||||||||||||||||
w.As of March 31, 2021, the index rate for $250, $8,500 and $8,750 was Prime, 1 Month LIBOR and 3 Month LIBOR, respectively.
See accompanying notes to consolidated financial statements.
15
CĪON Investment Corporation
Consolidated Schedule of Investments
December 31, 2020
(in thousands)
| Portfolio Company(a) | Index Rate(b) | Industry | Principal/ Par Amount/ Units(e) | Cost(d) | Fair Value(c) | |||||||||||||||||||||||||||
| Senior Secured First Lien Debt - 139.3% | ||||||||||||||||||||||||||||||||
| 1244311 B.C. LTD., L+500, 1.00% LIBOR Floor, 9/30/2025(s) | 3 Month LIBOR | Chemicals, Plastics & Rubber | $ | 2,422 | $ | 2,293 | $ | 2,289 | ||||||||||||||||||||||||
| 1244311 B.C. LTD., L+500, 1.00% LIBOR Floor, 9/30/2025(s)(v) | 3 Month LIBOR | Chemicals, Plastics & Rubber | 807 | 756 | 755 | |||||||||||||||||||||||||||
| Adams Publishing Group, LLC, L+700, 1.75% LIBOR Floor, 7/2/2023(n)(o) | 1 Month LIBOR | Media: Advertising, Printing & Publishing | 12,318 | 12,243 | 12,041 | |||||||||||||||||||||||||||
| Adapt Laser Acquisition, Inc., L+800, 1.00% LIBOR Floor, 12/31/2023(n) | 3 Month LIBOR | Capital Equipment | 11,280 | 11,280 | 9,715 | |||||||||||||||||||||||||||
| Adapt Laser Acquisition, Inc., L+800, 1.00% LIBOR Floor, 12/31/2023 | 3 Month LIBOR | Capital Equipment | 2,000 | 2,000 | 1,722 | |||||||||||||||||||||||||||
| Aegis Toxicology Sciences Corp., L+550, 1.00% LIBOR Floor, 5/9/2025(n) | 3 Month LIBOR | Healthcare & Pharmaceuticals | 9,774 | 9,635 | 8,577 | |||||||||||||||||||||||||||
| AIS Holdco, LLC, L+500, 0.00% LIBOR Floor, 8/15/2025(n) | 3 Month LIBOR | Banking, Finance, Insurance & Real Estate | 5,243 | 5,194 | 4,955 | |||||||||||||||||||||||||||
| Alchemy US Holdco 1, LLC, L+550, 10/10/2025(n) | 1 Month LIBOR | Construction & Building | 12,959 | 12,826 | 12,505 | |||||||||||||||||||||||||||
| Alert 360 Opco, Inc., L+600, 1.00% LIBOR Floor, 10/16/2025(n) | 1 Month LIBOR | Services: Consumer | 9,738 | 9,738 | 9,738 | |||||||||||||||||||||||||||
| Allen Media, LLC, L+550, 0.00% LIBOR Floor, 2/10/2027(n)(o) | 3 Month LIBOR | Media: Diversified & Production | 24,809 | 24,809 | 24,747 | |||||||||||||||||||||||||||
| ALM Media, LLC, L+650, 1.00% LIBOR Floor, 11/25/2024(n)(o) | 3 Month LIBOR | Media: Advertising, Printing & Publishing | 19,000 | 18,690 | 18,050 | |||||||||||||||||||||||||||
| AMCP Staffing Intermediate Holdings III, LLC, L+675, 1.50% LIBOR Floor, 9/24/2025(n) | 3 Month LIBOR | Services: Business | 10,813 | 10,765 | 10,273 | |||||||||||||||||||||||||||
| AMCP Staffing Intermediate Holdings III, LLC, L+675, 1.50% LIBOR Floor, 9/24/2025 | 3 Month LIBOR | Services: Business | 228 | 228 | 217 | |||||||||||||||||||||||||||
| AMCP Staffing Intermediate Holdings III, LLC, 0.50% Unfunded, 9/24/2025 | None | Services: Business | 1,370 | — | (68) | |||||||||||||||||||||||||||
| American Clinical Solutions LLC, 7.00%, 12/31/2022(n)(s) | None | Healthcare & Pharmaceuticals | 3,500 | 3,427 | 3,124 | |||||||||||||||||||||||||||
| American Clinical Solutions LLC, 7.00%, 6/30/2021(n)(s) | None | Healthcare & Pharmaceuticals | 250 | 250 | 242 | |||||||||||||||||||||||||||
| American Consolidated Natural Resources, Inc., L+1300, 1.00% LIBOR Floor, 9/16/2025(n)(v) | 1 Month LIBOR | Metals & Mining | 780 | 551 | 754 | |||||||||||||||||||||||||||
| American Media, LLC, L+775, 1.50% LIBOR Floor, 12/31/2023(n) | 3 Month LIBOR | Media: Advertising, Printing & Publishing | 11,077 | 10,894 | 10,952 | |||||||||||||||||||||||||||
| American Media, LLC, L+775, 1.50% LIBOR Floor, 12/31/2023(n) | 3 Month LIBOR | Media: Advertising, Printing & Publishing | 1,702 | 1,677 | 1,683 | |||||||||||||||||||||||||||
| American Teleconferencing Services, Ltd., L+650, 1.00% LIBOR Floor, 12/8/2021(n) | 6 Month LIBOR | Telecommunications | 19,514 | 18,792 | 15,904 | |||||||||||||||||||||||||||
| Analogic Corp., L+525, 1.00% LIBOR Floor, 6/21/2024(n)(o) | 1 Month LIBOR | Healthcare & Pharmaceuticals | 4,950 | 4,885 | 4,851 | |||||||||||||||||||||||||||
| Anthem Sports & Entertainment Inc., L+950, 1.00% LIBOR Floor, 9/9/2024(n)(v) | 3 Month LIBOR | Media: Diversified & Production | 13,815 | 13,647 | 13,642 | |||||||||||||||||||||||||||
| Anthem Sports & Entertainment Inc., L+950, 1.00% LIBOR Floor, 9/9/2024(n) | 3 Month LIBOR | Media: Diversified & Production | 833 | 833 | 825 | |||||||||||||||||||||||||||
| Anthem Sports & Entertainment Inc., 0.50% Unfunded, 9/9/2024 | None | Media: Diversified & Production | 1,333 | — | (13) | |||||||||||||||||||||||||||
| APCO Holdings, LLC, L+550, 0.00% LIBOR Floor, 6/9/2025(n) | 1 Month LIBOR | Banking, Finance, Insurance & Real Estate | 9,436 | 9,368 | 8,935 | |||||||||||||||||||||||||||
| Appalachian Resource Company, LLC, L+500, 1.00% LIBOR Floor, 9/10/2023 | 1 Month LIBOR | Metals & Mining | 11,137 | 9,717 | 9,230 | |||||||||||||||||||||||||||
| Appalachian Resource Company, LLC, 0.00% Unfunded, 9/10/2023(p) | None | Metals & Mining | 2,500 | — | — | |||||||||||||||||||||||||||
| Associated Asphalt Partners, LLC, L+525, 1.00% LIBOR Floor, 4/5/2024(n)(o) | 1 Month LIBOR | Construction & Building | 14,522 | 14,107 | 13,306 | |||||||||||||||||||||||||||
| Avison Young (USA) Inc., L+500, 0.00% LIBOR Floor, 1/31/2026(h)(n) | 3 Month LIBOR | Banking, Finance, Insurance & Real Estate | 9,800 | 9,647 | 9,322 | |||||||||||||||||||||||||||
| BK Medical Holding Company, Inc., L+525, 1.00% LIBOR Floor, 6/22/2024(n)(o) | 1 Month LIBOR | Healthcare & Pharmaceuticals | 4,963 | 4,926 | 4,690 | |||||||||||||||||||||||||||
| Cadence Aerospace, LLC, L+850, 1.00% LIBOR Floor, 11/14/2023(n)(o)(v) | 3 Month LIBOR | Aerospace & Defense | 37,832 | 37,343 | 35,751 | |||||||||||||||||||||||||||
| Cardinal US Holdings, Inc., L+500, 1.00% LIBOR Floor, 7/31/2023(n) | 3 Month LIBOR | Services: Business | 8,224 | 7,933 | 7,597 | |||||||||||||||||||||||||||
| CB URS Holdings Corp., L+575, 1.00% LIBOR Floor, 9/1/2024(n) | 6 Month LIBOR | Transportation: Cargo | 15,882 | 15,818 | 14,631 | |||||||||||||||||||||||||||
| Charming Charlie LLC, 20.00%, 4/24/2023(r)(s) | None | Retail | 662 | 657 | 350 | |||||||||||||||||||||||||||
| CHC Solutions Inc., 12.00%, 7/20/2023(o)(v) | None | Healthcare & Pharmaceuticals | 7,651 | 7,651 | 7,498 | |||||||||||||||||||||||||||
See accompanying notes to consolidated financial statements.
16
CĪON Investment Corporation
Consolidated Schedule of Investments
December 31, 2020
(in thousands)
| Portfolio Company(a) | Index Rate(b) | Industry | Principal/ Par Amount/ Units(e) | Cost(d) | Fair Value(c) | |||||||||||||||||||||||||||
| CircusTrix Holdings, LLC, L+550, 1.00% LIBOR Floor, 12/16/2021(n)(o)(v) | 1 Month LIBOR | Hotel, Gaming & Leisure | 25,472 | 25,117 | 19,900 | |||||||||||||||||||||||||||
| CircusTrix Holdings, LLC, L+550, 1.00% LIBOR Floor, 12/16/2021(n)(v) | 1 Month LIBOR | Hotel, Gaming & Leisure | 2,585 | 2,585 | 2,020 | |||||||||||||||||||||||||||
| CircusTrix Holdings, LLC, 1.00% Unfunded, 12/16/2021 | None | Hotel, Gaming & Leisure | 2,898 | — | — | |||||||||||||||||||||||||||
| Country Fresh Holdings, LLC, L+500, 1.00% LIBOR Floor, 4/29/2023 | 3 Month LIBOR | Beverage, Food & Tobacco | 1,020 | 980 | 858 | |||||||||||||||||||||||||||
| Country Fresh Holdings, LLC, 12.00%, 6/1/2022(v) | None | Beverage, Food & Tobacco | 738 | 713 | 722 | |||||||||||||||||||||||||||
| Country Fresh Holdings, LLC, L+500, 1.00% LIBOR Floor, 4/29/2023(n) | 3 Month LIBOR | Beverage, Food & Tobacco | 414 | 414 | 348 | |||||||||||||||||||||||||||
| Coyote Buyer, LLC, L+600, 1.00% LIBOR Floor, 2/6/2026(n)(o) | 3 Month LIBOR | Chemicals, Plastics & Rubber | 34,738 | 34,453 | 34,564 | |||||||||||||||||||||||||||
| Coyote Buyer, LLC, L+800, 1.00% LIBOR Floor, 8/6/2026(o) | 3 Month LIBOR | Chemicals, Plastics & Rubber | 6,250 | 6,128 | 6,250 | |||||||||||||||||||||||||||
| Coyote Buyer, LLC, 0.50% Unfunded, 2/6/2025 | None | Chemicals, Plastics & Rubber | 2,500 | — | (13) | |||||||||||||||||||||||||||
| David's Bridal, LLC, L+1000, 1.00% LIBOR Floor, 6/23/2023(v) | 3 Month LIBOR | Retail | 5,341 | 4,412 | 5,341 | |||||||||||||||||||||||||||
| David's Bridal, LLC, L+600, 1.00% LIBOR Floor, 6/30/2023(v) | 3 Month LIBOR | Retail | 745 | 648 | 745 | |||||||||||||||||||||||||||
| Deluxe Entertainment Services, Inc., L+650, 1.00% LIBOR Floor, 3/25/2024(n)(s)(v) | 3 Month LIBOR | Media: Diversified & Production | 3,978 | 4,057 | 3,978 | |||||||||||||||||||||||||||
| DMT Solutions Global Corp., L+700, 0.00% LIBOR Floor, 7/2/2024(n) | 3 Month LIBOR | Services: Business | 17,500 | 17,167 | 16,844 | |||||||||||||||||||||||||||
| Eagle Family Foods Group LLC, L+650, 1.00% LIBOR Floor, 6/14/2024(n) | 3 Month LIBOR | Beverage, Food & Tobacco | 14,375 | 14,171 | 14,159 | |||||||||||||||||||||||||||
| Entertainment Studios P&A LLC, 6.30%, 5/18/2037(k)(n) | None | Media: Diversified & Production | 13,990 | 13,889 | 12,871 | |||||||||||||||||||||||||||
| Entertainment Studios P&A LLC, 5.00%, 5/18/2037(k) | None | Media: Diversified & Production | — | — | 2,073 | |||||||||||||||||||||||||||
| EnTrans International, LLC, L+600, 0.00% LIBOR Floor, 11/1/2024(n) | 1 Month LIBOR | Capital Equipment | 26,250 | 26,065 | 25,233 | |||||||||||||||||||||||||||
| ES Chappaquiddick LLC, 10.00%, 5/18/2022(n) | None | Media: Diversified & Production | 915 | 915 | 924 | |||||||||||||||||||||||||||
| Extreme Reach, Inc., L+750, 1.50% LIBOR Floor, 3/29/2024(n)(o) | 1 Month LIBOR | Media: Diversified & Production | 20,402 | 20,233 | 20,096 | |||||||||||||||||||||||||||
| Extreme Reach, Inc., 0.50% Unfunded, 3/29/2024(n) | None | Media: Diversified & Production | 1,744 | — | (26) | |||||||||||||||||||||||||||
| F+W Media, Inc., L+1000, 1.50% LIBOR Floor, 5/24/2022(r)(s)(v) | 1 Month LIBOR | Media: Diversified & Production | 1,174 | 1,115 | — | |||||||||||||||||||||||||||
| Foundation Consumer Healthcare, LLC, L+575, 1.00% LIBOR Floor, 11/2/2023(n)(o) | 3 Month LIBOR | Healthcare & Pharmaceuticals | 43,350 | 43,127 | 43,350 | |||||||||||||||||||||||||||
| Foundation Consumer Healthcare, LLC, 0.50% Unfunded, 11/2/2023 | None | Healthcare & Pharmaceuticals | 4,211 | (15) | — | |||||||||||||||||||||||||||
| Genesis Healthcare, Inc., L+600, 0.50% LIBOR Floor, 3/6/2023(h)(n) | 1 Month LIBOR | Healthcare & Pharmaceuticals | 35,000 | 34,709 | 34,344 | |||||||||||||||||||||||||||
| Geo Parent Corp., L+525, 0.00% LIBOR Floor, 12/19/2025(n) | 1 Month LIBOR | Services: Business | 14,738 | 14,622 | 14,701 | |||||||||||||||||||||||||||
| Geon Performance Solutions, LLC, L+625, 1.63% LIBOR Floor, 10/25/2024(n)(o) | 1 Month LIBOR | Chemicals, Plastics & Rubber | 22,190 | 21,893 | 21,524 | |||||||||||||||||||||||||||
| Geon Performance Solutions, LLC, 0.50% Unfunded, 10/25/2024 | None | Chemicals, Plastics & Rubber | 2,586 | — | (78) | |||||||||||||||||||||||||||
| Harland Clarke Holdings Corp., L+475, 1.00% LIBOR Floor, 11/3/2023(n) | 3 Month LIBOR | Services: Business | 12,337 | 12,305 | 11,021 | |||||||||||||||||||||||||||
| Healogics, Inc., L+425, 1.00% LIBOR Floor, 7/1/2021(n) | 3 Month LIBOR | Healthcare & Pharmaceuticals | 4,699 | 4,659 | 4,359 | |||||||||||||||||||||||||||
| Hilliard, Martinez & Gonzales, LLP, L+1800, 2.00% LIBOR Floor, 12/17/2022(n)(v) | 1 Month LIBOR | Services: Consumer | 17,248 | 17,137 | 17,485 | |||||||||||||||||||||||||||
| Homer City Generation, L.P., 15.00%, 4/5/2023(n)(v) | None | Energy: Oil & Gas | 10,606 | 11,028 | 8,246 | |||||||||||||||||||||||||||
| Hoover Group, Inc., L+850, 1.25% LIBOR Floor, 10/1/2024(o) | 3 Month LIBOR | Services: Business | 5,660 | 5,637 | 5,668 | |||||||||||||||||||||||||||
| HUMC Holdco, LLC, 9.00%, 1/11/2021(n) | None | Healthcare & Pharmaceuticals | 10,000 | 9,985 | 9,925 | |||||||||||||||||||||||||||
| Hummel Station LLC, L+600, 1.00% LIBOR Floor, 10/27/2022(n) | 1 Month LIBOR | Energy: Oil & Gas | 9,432 | 9,237 | 9,066 | |||||||||||||||||||||||||||
| Hyperion Materials & Technologies, Inc., L+550, 1.00% LIBOR Floor, 8/28/2026(n) | 3 Month LIBOR | Chemicals, Plastics & Rubber | 9,900 | 9,729 | 9,269 | |||||||||||||||||||||||||||
| Independent Pet Partners Intermediate Holdings, LLC, 6.00%, 11/20/2023(n)(v) | None | Retail | 9,680 | 9,587 | 7,974 | |||||||||||||||||||||||||||
See accompanying notes to consolidated financial statements.
17
CĪON Investment Corporation
Consolidated Schedule of Investments
December 31, 2020
(in thousands)
| Portfolio Company(a) | Index Rate(b) | Industry | Principal/ Par Amount/ Units(e) | Cost(d) | Fair Value(c) | |||||||||||||||||||||||||||
| Independent Pet Partners Intermediate Holdings, LLC, PRIME+500, 12/22/2022(n) | Prime | Retail | 1,970 | 1,970 | 1,967 | |||||||||||||||||||||||||||
| Independent Pet Partners Intermediate Holdings, LLC, L+600, 0.00% LIBOR Floor, 12/22/2022(n) | 3 Month LIBOR | Retail | 252 | 252 | 252 | |||||||||||||||||||||||||||
| Infinity Sales Group, LLC, L+1050, 1.00% LIBOR Floor, 11/23/2022(n) | 1 Month LIBOR | Services: Business | 6,820 | 6,736 | 6,820 | |||||||||||||||||||||||||||
| InfoGroup Inc., L+500, 1.00% LIBOR Floor, 4/3/2023(n)(o) | 3 Month LIBOR | Media: Advertising, Printing & Publishing | 15,594 | 15,586 | 14,678 | |||||||||||||||||||||||||||
| Instant Web, LLC, L+650, 1.00% LIBOR Floor, 12/15/2022(n)(o) | 1 Month LIBOR | Media: Advertising, Printing & Publishing | 37,379 | 37,326 | 35,136 | |||||||||||||||||||||||||||
| Instant Web, LLC, 0.50% Unfunded, 12/15/2022 | None | Media: Advertising, Printing & Publishing | 2,704 | — | — | |||||||||||||||||||||||||||
| Isagenix International, LLC, L+575, 1.00% LIBOR Floor, 6/14/2025(n) | 3 Month LIBOR | Beverage, Food & Tobacco | 13,002 | 12,910 | 9,361 | |||||||||||||||||||||||||||
| Island Medical Management Holdings, LLC, L+650, 1.00% LIBOR Floor, 9/1/2022(n)(o) | 3 Month LIBOR | Healthcare & Pharmaceuticals | 11,188 | 11,132 | 10,488 | |||||||||||||||||||||||||||
| Jenny C Acquisition, Inc., L+1050, 1.75% LIBOR Floor, 10/1/2024(n)(v) | 6 Month LIBOR | Services: Consumer | 11,089 | 11,018 | 9,993 | |||||||||||||||||||||||||||
| JP Intermediate B, LLC, L+550, 1.00% LIBOR Floor, 11/20/2025(n) | 3 Month LIBOR | Beverage, Food & Tobacco | 15,273 | 15,019 | 13,669 | |||||||||||||||||||||||||||
| KNB Holdings Corp., L+550, 1.00% LIBOR Floor, 4/26/2024(n) | 6 Month LIBOR | Consumer Goods: Durable | 8,073 | 7,966 | 6,741 | |||||||||||||||||||||||||||
| Labvantage Solutions Inc., L+750, 1.00% LIBOR Floor, 3/31/2021(n)(o) | 1 Month LIBOR | High Tech Industries | 2,646 | 2,646 | 2,646 | |||||||||||||||||||||||||||
| Labvantage Solutions Ltd., E+750, 1.00% EURIBOR Floor, 3/31/2021(h) | 1 Month EURIBOR | High Tech Industries | € | 2,912 | 3,273 | 3,557 | ||||||||||||||||||||||||||
| LAV Gear Holdings, Inc., L+750, 1.00% LIBOR Floor, 10/31/2024(n)(o)(v) | 3 Month LIBOR | Services: Business | 25,338 | 24,940 | 24,072 | |||||||||||||||||||||||||||
| LAV Gear Holdings, Inc., L+750, 1.00% LIBOR Floor, 10/31/2024(n)(o)(v) | 3 Month LIBOR | Services: Business | 4,375 | 4,326 | 4,156 | |||||||||||||||||||||||||||
| LD Intermediate Holdings, Inc., L+588, 1.00% LIBOR Floor, 12/9/2022(n) | 3 Month LIBOR | High Tech Industries | 11,030 | 10,869 | 10,981 | |||||||||||||||||||||||||||
| LGC US Finco, LLC, L+650, 1.00% LIBOR Floor, 12/20/2025(n) | 1 Month LIBOR | Capital Equipment | 9,800 | 9,537 | 9,396 | |||||||||||||||||||||||||||
| Lift Brands, Inc., L+375, 0.50% LIBOR Floor, 6/29/2025(n)(o)(s) | 1 Month LIBOR | Services: Consumer | 23,642 | 23,642 | 23,642 | |||||||||||||||||||||||||||
| Lift Brands, Inc., 9.50%, 6/29/2025(n)(o)(s)(v) | None | Services: Consumer | 4,861 | 4,753 | 4,751 | |||||||||||||||||||||||||||
| Lift Brands, Inc., 6/29/2025(n)(o)(q)(s) | None | Services: Consumer | 5,296 | 4,685 | 4,687 | |||||||||||||||||||||||||||
| Longview Power, LLC, L+1000, 1.50% LIBOR Floor, 7/30/2025(s) | 3 Month LIBOR | Energy: Oil & Gas | 2,355 | 631 | 2,414 | |||||||||||||||||||||||||||
| Mimeo.com, Inc., L+700, 1.00% LIBOR Floor, 12/21/2023(n)(q) | 3 Month LIBOR | Services: Business | 23,373 | 23,373 | 22,584 | |||||||||||||||||||||||||||
| Mimeo.com, Inc., L+1700, 1.00% LIBOR Floor, 12/21/2023(n)(v) | 3 Month LIBOR | Services: Business | 2,130 | 2,130 | 2,180 | |||||||||||||||||||||||||||
| Mimeo.com, Inc., 1.00% Unfunded, 12/21/2023 | None | Services: Business | 1,000 | — | 24 | |||||||||||||||||||||||||||
| Moss Holding Company, L+700, 1.00% LIBOR Floor, 4/17/2024(n)(o)(v) | 3 Month LIBOR | Services: Business | 19,535 | 19,349 | 17,630 | |||||||||||||||||||||||||||
| Moss Holding Company, 7.00% Unfunded, 4/17/2024 | None | Services: Business | 106 | — | — | |||||||||||||||||||||||||||
| Moss Holding Company, 0.50% Unfunded, 4/17/2024 | None | Services: Business | 2,126 | — | — | |||||||||||||||||||||||||||
| NASCO Healthcare Inc., L+450, 1.00% LIBOR Floor, 6/30/2023(n) | 3 Month LIBOR | Services: Business | 13,189 | 13,189 | 13,189 | |||||||||||||||||||||||||||
| NewsCycle Solutions, Inc., L+700, 1.00% LIBOR Floor, 12/29/2022(n)(o) | 3 Month LIBOR | Media: Advertising, Printing & Publishing | 12,186 | 12,098 | 12,079 | |||||||||||||||||||||||||||
| One Call Corp., L+525, 1.00% LIBOR Floor, 11/25/2022(n) | 3 Month LIBOR | Healthcare & Pharmaceuticals | 3,858 | 3,747 | 3,732 | |||||||||||||||||||||||||||
| Optio Rx, LLC, L+700, 0.00% LIBOR Floor, 6/28/2024(n)(o) | 1 Month LIBOR | Healthcare & Pharmaceuticals | 24,250 | 24,130 | 23,704 | |||||||||||||||||||||||||||
| Optio Rx, LLC, L+1000, 0.00% LIBOR Floor, 6/28/2024(o) | 1 Month LIBOR | Healthcare & Pharmaceuticals | 2,515 | 2,492 | 2,685 | |||||||||||||||||||||||||||
| Palmetto Solar, LLC, 12.00%, 12/12/2024(n) | None | High Tech Industries | 16,738 | 16,320 | 16,696 | |||||||||||||||||||||||||||
| Palmetto Solar, LLC, 0.75% Unfunded, 12/12/2021 | None | High Tech Industries | 3,262 | — | (8) | |||||||||||||||||||||||||||
| PH Beauty Holdings III. Inc., L+500, 0.00% LIBOR Floor, 9/28/2025(n) | 3 Month LIBOR | Consumer Goods: Non-Durable | 9,775 | 9,152 | 9,189 | |||||||||||||||||||||||||||
| Pixelle Specialty Solutions LLC, L+650, 1.00% LIBOR Floor, 10/31/2024(n) | 1 Month LIBOR | Forest Products & Paper | 21,686 | 21,368 | 21,686 | |||||||||||||||||||||||||||
See accompanying notes to consolidated financial statements.
18
CĪON Investment Corporation
Consolidated Schedule of Investments
December 31, 2020
(in thousands)
| Portfolio Company(a) | Index Rate(b) | Industry | Principal/ Par Amount/ Units(e) | Cost(d) | Fair Value(c) | |||||||||||||||||||||||||||
| Plano Molding Company, LLC, L+900, 1.00% LIBOR Floor, 5/12/2022(n)(v) | 3 Month LIBOR | Consumer Goods: Non-Durable | 5,986 | 5,975 | 5,836 | |||||||||||||||||||||||||||
| Plano Molding Company, LLC, L+900, 1.00% LIBOR Floor, 5/11/2022(n)(v) | 3 Month LIBOR | Consumer Goods: Non-Durable | 731 | 725 | 732 | |||||||||||||||||||||||||||
| Polymer Additives, Inc., L+600, 0.00% LIBOR Floor, 7/31/2025(n) | 3 Month LIBOR | Chemicals, Plastics & Rubber | 19,600 | 19,313 | 16,497 | |||||||||||||||||||||||||||
| Polymer Process Holdings, Inc., L+600, 0.00% LIBOR Floor, 5/1/2026(n) | 1 Month LIBOR | Chemicals, Plastics & Rubber | 24,625 | 24,271 | 24,471 | |||||||||||||||||||||||||||
| Securus Technologies Holdings, Inc., L+450, 1.00% LIBOR Floor, 11/1/2024(n) | 6 Month LIBOR | Telecommunications | 3,949 | 3,039 | 3,949 | |||||||||||||||||||||||||||
| SEK Holding Co LLC, L+1200, 1.00% LIBOR Floor, 3/14/2022(n)(v) | 1 Month LIBOR | Banking, Finance, Insurance & Real Estate | 16,227 | 16,068 | 15,590 | |||||||||||||||||||||||||||
| Sequoia Healthcare Management, LLC, 12.75%, 8/21/2023(n)(o)(r) | None | Healthcare & Pharmaceuticals | 8,525 | 8,457 | 6,905 | |||||||||||||||||||||||||||
| SIMR, LLC, L+1700, 2.00% LIBOR Floor, 9/7/2023(n)(s)(v) | 1 Month LIBOR | Healthcare & Pharmaceuticals | 16,154 | 15,975 | 13,347 | |||||||||||||||||||||||||||
| Smart & Final Inc., L+675, 0.00% LIBOR Floor, 6/20/2025(n) | 1 Month LIBOR | Retail | 7,805 | 7,227 | 7,888 | |||||||||||||||||||||||||||
| Software Luxembourg Acquisitions S.À.R.L., L+750, 1.00% LIBOR Floor, 4/27/2025(h)(o) | 3 Month LIBOR | High Tech Industries | 3,011 | 2,905 | 3,015 | |||||||||||||||||||||||||||
| Software Luxembourg Acquisitions S.À.R.L., L+750, 1.00% LIBOR Floor, 12/27/2024(h)(o) | 1 Month LIBOR | High Tech Industries | 807 | 783 | 815 | |||||||||||||||||||||||||||
| Sorenson Communications, LLC, L+650, 0.00% LIBOR Floor, 4/30/2024(n) | 3 Month LIBOR | Telecommunications | 10,322 | 10,066 | 10,348 | |||||||||||||||||||||||||||
| Spinal USA, Inc. / Precision Medical Inc., L+950, 10/1/2021(n) | 12 Month LIBOR | Healthcare & Pharmaceuticals | 12,562 | 12,486 | 11,965 | |||||||||||||||||||||||||||
| Spinal USA, Inc. / Precision Medical Inc., L+950, 10/1/2021(n)(v) | 12 Month LIBOR | Healthcare & Pharmaceuticals | 1,116 | 1,104 | 1,109 | |||||||||||||||||||||||||||
| Spinal USA, Inc. / Precision Medical Inc., L+950, 10/1/2021(n)(v) | 12 Month LIBOR | Healthcare & Pharmaceuticals | 603 | 493 | 574 | |||||||||||||||||||||||||||
| Stats Intermediate Holdings, LLC, L+525, 0.00% LIBOR Floor, 7/12/2026(n) | 3 Month LIBOR | High Tech Industries | 9,900 | 9,719 | 9,850 | |||||||||||||||||||||||||||
| Tenere Inc., L+850, 1.00% LIBOR Floor, 5/5/2025(n)(o) | 3 Month LIBOR | Capital Equipment | 18,080 | 18,020 | 18,080 | |||||||||||||||||||||||||||
| Tensar Corp., L+675, 1.00% LIBOR Floor, 11/20/2025(n) | 3 Month LIBOR | Chemicals, Plastics & Rubber | 5,000 | 4,878 | 4,975 | |||||||||||||||||||||||||||
| The Pasha Group, L+800, 1.00% LIBOR Floor, 1/26/2023(n)(o) | 2 Month LIBOR | Transportation: Cargo | 4,511 | 4,447 | 4,370 | |||||||||||||||||||||||||||
| The Pay-O-Matic Corp., L+900, 1.00% LIBOR Floor, 10/29/2021(j)(n) | 3 Month LIBOR | Services: Consumer | 7,312 | 7,304 | 7,312 | |||||||||||||||||||||||||||
| Volta Charging, LLC, 12.00%, 6/19/2024(n) | None | Media: Diversified & Production | 15,000 | 15,000 | 16,013 | |||||||||||||||||||||||||||
| Volta Charging, LLC, 12.00%, 6/19/2024(n) | None | Media: Diversified & Production | 12,000 | 11,978 | 12,810 | |||||||||||||||||||||||||||
| West Dermatology Management Holdings, LLC, L+600, 1.00% LIBOR Floor, 2/11/2025(n)(o)(v) | 3 Month LIBOR | Healthcare & Pharmaceuticals | 9,455 | 9,384 | 9,006 | |||||||||||||||||||||||||||
| West Dermatology Management Holdings, LLC, L+600, 1.00% LIBOR Floor, 2/11/2025(n) | 1 Month LIBOR | Healthcare & Pharmaceuticals | 1,657 | 1,645 | 1,579 | |||||||||||||||||||||||||||
| West Dermatology Management Holdings, LLC, L+750, 1.00% LIBOR Floor, 2/11/2025 | 3 Month LIBOR | Healthcare & Pharmaceuticals | 1,185 | 1,182 | 1,170 | |||||||||||||||||||||||||||
| West Dermatology Management Holdings, LLC, 0.75% Unfunded, 2/11/2022 | None | Healthcare & Pharmaceuticals | 7,655 | (26) | (54) | |||||||||||||||||||||||||||
| Williams Industrial Services Group, Inc, L+900, 1.00% LIBOR Floor, 12/16/2025(o) | 1 Month LIBOR | Services: Business | 10,000 | 10,000 | 10,000 | |||||||||||||||||||||||||||
| Williams Industrial Services Group, Inc, 0.50% Unfunded, 6/16/2022 | None | Services: Business | 5,000 | — | — | |||||||||||||||||||||||||||
| Winebow Holdings, Inc., L+375, 1.00% LIBOR Floor, 7/1/2021(n)(o) | 1 Month LIBOR | Beverage, Food & Tobacco | 5,864 | 5,669 | 5,483 | |||||||||||||||||||||||||||
| Wok Holdings Inc., L+625, 0.00% LIBOR Floor, 3/1/2026(n) | 1 Month LIBOR | Beverage, Food & Tobacco | 12,773 | 12,630 | 12,325 | |||||||||||||||||||||||||||
| Total Senior Secured First Lien Debt | 1,266,564 | 1,223,268 | ||||||||||||||||||||||||||||||
| Senior Secured Second Lien Debt - 17.2% | ||||||||||||||||||||||||||||||||
| Access CIG, LLC, L+775, 0.00% LIBOR Floor, 2/27/2026(n)(o) | 3 Month LIBOR | Services: Business | 17,250 | 17,139 | 16,840 | |||||||||||||||||||||||||||
| Carestream Health, Inc., L+1250, 1.00% LIBOR Floor, 8/8/2023(n)(o)(v) | 3 Month LIBOR | Healthcare & Pharmaceuticals | 11,499 | 11,499 | 11,068 | |||||||||||||||||||||||||||
| Country Fresh Holdings, LLC, L+850, 1.00% LIBOR Floor, 4/29/2024(n)(v) | 3 Month LIBOR | Beverage, Food & Tobacco | 2,239 | 2,239 | 1,573 | |||||||||||||||||||||||||||
| Dayton Superior Corp., L+700, 2.00% LIBOR Floor, 12/4/2024(n) | 3 Month LIBOR | Construction & Building | 1,492 | 1,492 | 1,492 | |||||||||||||||||||||||||||
See accompanying notes to consolidated financial statements.
19
CĪON Investment Corporation
Consolidated Schedule of Investments
December 31, 2020
(in thousands)
| Portfolio Company(a) | Index Rate(b) | Industry | Principal/ Par Amount/ Units(e) | Cost(d) | Fair Value(c) | |||||||||||||||||||||||||||
| Deluxe Entertainment Services, Inc., L+850, 1.00% LIBOR Floor, 9/25/2024(n)(r)(s)(v) | 3 Month LIBOR | Media: Diversified & Production | 10,271 | 10,017 | — | |||||||||||||||||||||||||||
| Global Tel*Link Corp., L+825, 0.00% LIBOR Floor, 11/29/2026(n)(o) | 1 Month LIBOR | Telecommunications | 11,500 | 11,333 | 11,385 | |||||||||||||||||||||||||||
| LSCS Holdings, Inc., L+825, 0.00% LIBOR Floor, 3/16/2026(n) | 6 Month LIBOR | Services: Business | 11,891 | 11,684 | 10,999 | |||||||||||||||||||||||||||
| Medical Solutions Holdings, Inc., L+838, 1.00% LIBOR Floor, 6/16/2025(n) | 6 Month LIBOR | Healthcare & Pharmaceuticals | 10,000 | 9,895 | 9,250 | |||||||||||||||||||||||||||
| MedPlast Holdings, Inc., L+775, 0.00% LIBOR Floor, 7/2/2026(n) | 1 Month LIBOR | Healthcare & Pharmaceuticals | 6,750 | 6,697 | 6,134 | |||||||||||||||||||||||||||
| Ministry Brands, LLC, L+925, 1.00% LIBOR Floor, 6/2/2023(n)(o) | 2 Month LIBOR | Services: Business | 7,000 | 6,973 | 6,965 | |||||||||||||||||||||||||||
| Niacet Corp., E+875, 1.00% EURIBOR Floor, 8/1/2024(h) | 1 Month EURIBOR | Chemicals, Plastics & Rubber | € | 6,263 | 6,708 | 7,651 | ||||||||||||||||||||||||||
| Patterson Medical Supply, Inc., L+1050, 1.00% LIBOR Floor, 8/28/2023(n)(v) | 3 Month LIBOR | Healthcare & Pharmaceuticals | 14,536 | 14,472 | 13,972 | |||||||||||||||||||||||||||
| PetroChoice Holdings, Inc., L+875, 1.00% LIBOR Floor, 8/21/2023(n) | 3 Month LIBOR | Chemicals, Plastics & Rubber | 15,000 | 14,282 | 13,500 | |||||||||||||||||||||||||||
| Premiere Global Services, Inc., L+950, 1.00% LIBOR Floor, 6/6/2024(n)(v) | 3 Month LIBOR | Telecommunications | 3,415 | 3,339 | 2,305 | |||||||||||||||||||||||||||
| Securus Technologies Holdings, Inc., L+825, 1.00% LIBOR Floor, 11/1/2025(n) | 6 Month LIBOR | Telecommunications | 2,942 | 2,920 | 2,747 | |||||||||||||||||||||||||||
| TMK Hawk Parent, Corp., L+800, 1.00% LIBOR Floor, 8/28/2025(n) | 1 Month LIBOR | Services: Business | 13,393 | 13,158 | 9,860 | |||||||||||||||||||||||||||
| Winebow Holdings, Inc., L+750, 1.00% LIBOR Floor, 1/2/2022(n) | 1 Month LIBOR | Beverage, Food & Tobacco | 12,823 | 12,747 | 11,477 | |||||||||||||||||||||||||||
| Zest Acquisition Corp., L+750, 1.00% LIBOR Floor, 3/14/2026(n)(o) | 1 Month LIBOR | Healthcare & Pharmaceuticals | 15,000 | 14,886 | 14,288 | |||||||||||||||||||||||||||
| Total Senior Secured Second Lien Debt | 171,480 | 151,506 | ||||||||||||||||||||||||||||||
| Collateralized Securities and Structured Products - Equity - 1.4% | ||||||||||||||||||||||||||||||||
| APIDOS CLO XVI Subordinated Notes, 0.00% Estimated Yield, 1/19/2025(h) | (g) | Diversified Financials | 9,000 | 3,019 | 1,372 | |||||||||||||||||||||||||||
| CENT CLO 19 Ltd. Subordinated Notes, 0.00% Estimated Yield, 10/29/2025(h) | (g) | Diversified Financials | 2,000 | 1,161 | 214 | |||||||||||||||||||||||||||
| Galaxy XV CLO Ltd. Class A Subordinated Notes, 5.76% Estimated Yield, 4/15/2025(h) | (g) | Diversified Financials | 4,000 | 2,007 | 1,617 | |||||||||||||||||||||||||||
| Ivy Hill Middle Market Credit Fund VIII, Ltd. Subordinated Loan, 11.84% Estimated Yield, 2/2/2026(h) | (g) | Diversified Financials | 10,000 | 9,118 | 8,928 | |||||||||||||||||||||||||||
| Total Collateralized Securities and Structured Products - Equity | 15,305 | 12,131 | ||||||||||||||||||||||||||||||
| Unsecured Debt - 0.6% | ||||||||||||||||||||||||||||||||
| WPLM Acquisition Corp., 15.00%, 11/24/2025(v) | None | Media: Advertising, Printing & Publishing | 5,752 | 5,668 | 5,464 | |||||||||||||||||||||||||||
| Total Unsecured Debt | 5,668 | 5,464 | ||||||||||||||||||||||||||||||
| Equity - 11.8% | ||||||||||||||||||||||||||||||||
| 1244301 B.C. LTD., Common Shares(p)(s) | Chemicals, Plastics & Rubber | 807,268 Units | — | — | ||||||||||||||||||||||||||||
| ACNR Holdings, Inc., Common Stock(p) | Metals & Mining | 6,018 Units | 90 | 45 | ||||||||||||||||||||||||||||
| ACNR Holdings, Inc., Preferred Stock(p) | Metals & Mining | 1,890 Units | 26 | 118 | ||||||||||||||||||||||||||||
| Alert 360 Topco, Inc., Common Stock(p) | Services: Consumer | 465,053 Units | 2,883 | 2,883 | ||||||||||||||||||||||||||||
| American Clinical Solutions LLC, Class A Membership Interests(p)(s) | Healthcare & Pharmaceuticals | 6,030,384 Units | 1,658 | 663 | ||||||||||||||||||||||||||||
| Anthem Sports and Entertainment Inc., Class A Preferred Stock Warrants(p) | Media: Diversified & Production | 769 Units | 205 | 138 | ||||||||||||||||||||||||||||
| Anthem Sports and Entertainment Inc., Class B Preferred Stock Warrants(p) | Media: Diversified & Production | 135 Units | — | — | ||||||||||||||||||||||||||||
| Anthem Sports and Entertainment Inc., Common Stock Warrants(p) | Media: Diversified & Production | 2,508 Units | — | — | ||||||||||||||||||||||||||||
| ARC Financial, LLC, Membership Interests (25% ownership)(p)(s) | Metals & Mining | N/A | — | — | ||||||||||||||||||||||||||||
| Ascent Resources - Marcellus, LLC, Membership Units(p) | Energy: Oil & Gas | 511,255 Units | 1,642 | 419 | ||||||||||||||||||||||||||||
| Ascent Resources - Marcellus, LLC, Warrants(p) | Energy: Oil & Gas | 132,367 Units | 13 | 3 | ||||||||||||||||||||||||||||
See accompanying notes to consolidated financial statements.
20
CĪON Investment Corporation
Consolidated Schedule of Investments
December 31, 2020
(in thousands)
| Portfolio Company(a) | Industry | Principal/ Par Amount/ Units(e) | Cost(d) | Fair Value(c) | ||||||||||||||||||||||||||||
| BCP Great Lakes Fund LP, Partnership Interests (11.4% ownership)(h)(s) | Diversified Financials | N/A | 12,865 | 12,611 | ||||||||||||||||||||||||||||
| Carestream Health Holdings, Inc., Warrants(p) | Healthcare & Pharmaceuticals | 233 Units | 565 | 590 | ||||||||||||||||||||||||||||
| CHC Medical Partners, Inc., Series C Preferred Stock, 12% Dividend(u) | Healthcare & Pharmaceuticals | 2,727,273 Units | 5,471 | 6,927 | ||||||||||||||||||||||||||||
| CION SOF Funding, LLC, Membership Interests (87.5% ownership)(h)(t) | Diversified Financials | N/A | 15,539 | 12,472 | ||||||||||||||||||||||||||||
| Conisus Holdings, Inc., Series B Preferred Stock, 12% Dividend(s)(u) | Healthcare & Pharmaceuticals | 12,677,833 Units | 15,143 | 16,481 | ||||||||||||||||||||||||||||
| Conisus Holdings, Inc., Common Stock(p)(s) | Healthcare & Pharmaceuticals | 4,914,556 Units | 200 | 12,401 | ||||||||||||||||||||||||||||
| Country Fresh Holdings, LLC, Membership Units(p) | Beverage, Food & Tobacco | 2,985 Units | 5,249 | — | ||||||||||||||||||||||||||||
| Dayton HoldCo, LLC, Membership Units(p) | Construction & Building | 37,264 Units | 4,136 | 7,350 | ||||||||||||||||||||||||||||
| DBI Investors, Inc., Series A1 Preferred Stock(p) | Retail | 20,000 Units | 802 | — | ||||||||||||||||||||||||||||
| DBI Investors, Inc., Series A Preferred Stock(p) | Retail | 1,396 Units | 140 | — | ||||||||||||||||||||||||||||
| DBI Investors, Inc., Series B Preferred Stock(p) | Retail | 4,183 Units | 410 | — | ||||||||||||||||||||||||||||
| DBI Investors, Inc., Common Stock(p) | Retail | 39,423 Units | — | — | ||||||||||||||||||||||||||||
| DBI Investors, Inc., Reallocation Rights(p) | Retail | 7,500 Units | — | — | ||||||||||||||||||||||||||||
| DESG Holdings, Inc., Common Stock(i)(p)(s) | Media: Diversified & Production | 1,268,143 Units | 13,675 | — | ||||||||||||||||||||||||||||
| HDNet Holdco LLC, Preferred Unit Call Option(p) | Media: Diversified & Production | 1 Unit | — | — | ||||||||||||||||||||||||||||
| Independent Pet Partners Intermediate Holdings, LLC, Class A Preferred Units(p) | Retail | 1,000,000 Units | 1,000 | — | ||||||||||||||||||||||||||||
| Independent Pet Partners Intermediate Holdings, LLC, Class B-2 Preferred Units(p) | Retail | 2,632,771 Units | 2,133 | 2,145 | ||||||||||||||||||||||||||||
| Independent Pet Partners Intermediate Holdings, LLC, Class C Preferred Units(p) | Retail | 2,632,771 Units | 2,633 | 2,633 | ||||||||||||||||||||||||||||
| Independent Pet Partners Intermediate Holdings, LLC, Warrants(p) | Retail | 155,880 Units | — | — | ||||||||||||||||||||||||||||
| Longview Intermediate Holdings C, LLC, Membership Units(p)(s) | Energy: Oil & Gas | 589,487 Units | 2,524 | 7,988 | ||||||||||||||||||||||||||||
| Mooregate ITC Acquisition, LLC, Class A Units(p) | High Tech Industries | 500 Units | 563 | 96 | ||||||||||||||||||||||||||||
| Mount Logan Capital Inc., Common Stock(h)(s) | Banking, Finance, Insurance & Real Estate | 1,075,557 Units | 3,534 | 2,409 | ||||||||||||||||||||||||||||
| NS NWN Acquisition, LLC, Voting Units(p) | High Tech Industries | 346 Units | 393 | 929 | ||||||||||||||||||||||||||||
| NS NWN Acquisition, LLC, Class A Preferred Units(p) | High Tech Industries | 111 Units | 110 | 332 | ||||||||||||||||||||||||||||
| NSG Co-Invest (Bermuda) LP, Partnership Interests(h)(p) | Consumer Goods: Durable | 1,575 Units | 1,000 | 676 | ||||||||||||||||||||||||||||
| Palmetto Clean Technology, Inc., Warrants(p) | High Tech Industries | 693,387 Units | 472 | 506 | ||||||||||||||||||||||||||||
| Phillips Pet Holding Corp., Common Stock(p) | Retail | 235 Units | 13 | 17 | ||||||||||||||||||||||||||||
| SIMR Parent, LLC, Class B Common Units(p)(s) | Healthcare & Pharmaceuticals | 12,283,163 Units | 8,002 | — | ||||||||||||||||||||||||||||
| Software Luxembourg Holding S.A., Class A Common Stock(h)(p) | High Tech Industries | 28,202 Units | 4,536 | 5,516 | ||||||||||||||||||||||||||||
| Software Luxembourg Holding S.A., Class B Common Stock(h)(p) | High Tech Industries | 2,388 Units | 384 | 688 | ||||||||||||||||||||||||||||
| Software Luxembourg Holding S.A., Class A Warrants(h)(p) | High Tech Industries | 3,512 Units | 117 | — | ||||||||||||||||||||||||||||
| Software Luxembourg Holding S.A., Class B Warrants(h)(p) | High Tech Industries | 7,023 Units | 220 | — | ||||||||||||||||||||||||||||
| Snap Fitness Holdings, Inc., Class A Stock(p)(s) | Services: Consumer | 9,858 Units | 3,078 | 3,389 | ||||||||||||||||||||||||||||
| Snap Fitness Holdings, Inc., Warrants(p)(s) | Services: Consumer | 3,996 Units | 1,247 | 1,374 | ||||||||||||||||||||||||||||
| Spinal USA, Inc. / Precision Medical Inc., Warrants(p) | Healthcare & Pharmaceuticals | 14,181,915 Units | 5,806 | — | ||||||||||||||||||||||||||||
| Tenere Inc., Warrants(p) | Capital Equipment | N/A | 161 | 1,606 | ||||||||||||||||||||||||||||
| Total Equity | 118,638 | 103,405 | ||||||||||||||||||||||||||||||
| Short Term Investments - 8.4%(l) | ||||||||||||||||||||||||||||||||
| First American Treasury Obligations Fund, Class Z Shares, 0.03% (m) | 73,597 | 73,597 | ||||||||||||||||||||||||||||||
| Total Short Term Investments | 73,597 | 73,597 | ||||||||||||||||||||||||||||||
See accompanying notes to consolidated financial statements.
21
CĪON Investment Corporation
Consolidated Schedule of Investments
December 31, 2020
(in thousands)
| Cost(d) | Fair Value(c) | |||||||||||||||||||||||||||||||
| TOTAL INVESTMENTS - 178.7% | $ | 1,651,252 | 1,569,371 | |||||||||||||||||||||||||||||
| LIABILITIES IN EXCESS OF OTHER ASSETS - (78.7%) | (691,115) | |||||||||||||||||||||||||||||||
| NET ASSETS - 100% | $ | 878,256 | ||||||||||||||||||||||||||||||
a.All of the Company’s investments are issued by eligible U.S. portfolio companies, as defined in the 1940 Act, except for investments specifically identified as non-qualifying per note h. below. Unless specifically identified in note v. below, investments do not contain a PIK interest provision.
b.The 1, 2, 3, 6 and 12 month LIBOR rates were 0.14%, 0.19%, 0.24%, 0.26% and 0.34%, respectively, as of December 31, 2020. The actual LIBOR rate for each loan listed may not be the applicable LIBOR rate as of December 31, 2020, as the loan may have been priced or repriced based on a LIBOR rate prior to or subsequent to December 31, 2020. The 1 month EURIBOR rate was (0.59%) as of December 31, 2020.
c.Fair value determined in good faith by the Company’s board of directors (see Note 9) using significant unobservable inputs unless otherwise noted.
d.Represents amortized cost for debt securities and cost for equity investments.
e.Denominated in U.S. dollars unless otherwise noted.
f.Fair value determined using level 1 inputs.
g.The CLO subordinated notes are considered equity positions in the CLO vehicles and are not rated. Equity investments are entitled to recurring distributions, which are generally equal to the remaining cash flow of the payments made by the underlying vehicle's securities less contractual payments to debt holders and expenses. The estimated yield indicated is based upon a current projection of the amount and timing of these recurring distributions and the estimated amount of repayment of principal upon termination. Such projections are periodically reviewed and adjusted, and the estimated yield may not ultimately be realized.
h.The investment or a portion thereof is not a qualifying asset under the 1940 Act. A business development company may not acquire any asset other than qualifying assets, unless, at the time the acquisition is made, qualifying assets represent at least 70% of the company’s total assets as defined under Section 55 of the 1940 Act. As of December 31, 2020, 93.4% of the Company’s total assets represented qualifying assets.
i.Position or a portion thereof unsettled as of December 31, 2020.
j.As a result of an arrangement between the Company and the other lenders in the syndication, the Company is entitled to less interest than the stated interest rate of this loan, which is reflected in this schedule, in exchange for a higher payment priority.
k.In addition to the interest earned based on the stated interest rate of this loan, which is the amount reflected in this schedule, the Company may be entitled to receive additional residual amounts.
l.Short term investments represent an investment in a fund that invests in highly liquid investments with average original maturity dates of three months or less.
m.7-day effective yield as of December 31, 2020.
n.Investment or a portion thereof held within the Company’s wholly-owned consolidated subsidiary, 34th Street, and was pledged as collateral supporting the amounts outstanding under the credit facility with JPM as of December 31, 2020 (see Note 8).
o.Investment or a portion thereof held within the Company’s wholly-owned consolidated subsidiary, Murray Hill Funding II, and was pledged as collateral supporting the amounts outstanding under the repurchase agreement with UBS as of December 31, 2020 (see Note 8).
p.Non-income producing security.
q.The ultimate interest earned on this loan will be determined based on the portfolio company’s EBITDA at a specified trigger event.
r.Investment or a portion thereof was on non-accrual status as of December 31, 2020.
See accompanying notes to consolidated financial statements
22
CĪON Investment Corporation
Consolidated Schedule of Investments
December 31, 2020
(in thousands)
s.Investment determined to be an affiliated investment as defined in the 1940 Act as the Company owns between 5% and 25% of the portfolio company’s outstanding voting securities but does not control the portfolio company. Fair value as of December 31, 2019 and 2020, along with transactions during the year ended December 31, 2020 in these affiliated investments, are as follows:
| Year Ended December 31, 2020 | Year Ended December 31, 2020 | |||||||||||||||||||||||||||||||||||||||||||||||||
| Non-Controlled, Affiliated Investments | Fair Value at December 31, 2019 | Gross Additions (Cost)(1) | Gross Reductions (Cost)(2) | Net Unrealized Gain (Loss) | Fair Value at December 31, 2020 | Net Realized Gain (Loss) | Interest Income(3) | Dividend Income | ||||||||||||||||||||||||||||||||||||||||||
| 1244301 B.C. LTD. | ||||||||||||||||||||||||||||||||||||||||||||||||||
| First Lien Term Loan A | $ | — | $ | 2,293 | $ | — | $ | (4) | $ | 2,289 | $ | — | $ | 42 | $ | — | ||||||||||||||||||||||||||||||||||
| First Lien Term Loan B | — | 757 | — | (2) | 755 | — | 15 | — | ||||||||||||||||||||||||||||||||||||||||||
| Common Shares | — | — | — | — | — | — | — | — | ||||||||||||||||||||||||||||||||||||||||||
| American Clinical Solutions LLC | ||||||||||||||||||||||||||||||||||||||||||||||||||
| Tranche I Term Loan | 3,395 | 32 | — | (303) | 3,124 | — | 282 | — | ||||||||||||||||||||||||||||||||||||||||||
| First Amendment Tranche I Term Loan | — | 250 | — | (8) | 242 | — | 13 | — | ||||||||||||||||||||||||||||||||||||||||||
| Class A Membership Interests | — | 1,658 | — | (995) | 663 | — | — | — | ||||||||||||||||||||||||||||||||||||||||||
| ARC Financial, LLC | ||||||||||||||||||||||||||||||||||||||||||||||||||
| Membership Interests | — | — | — | — | — | — | — | — | ||||||||||||||||||||||||||||||||||||||||||
| BCP Great Lakes Fund LP | ||||||||||||||||||||||||||||||||||||||||||||||||||
| Membership Interests | 14,238 | 2,195 | (3,538) | (284) | 12,611 | — | — | 1,039 | ||||||||||||||||||||||||||||||||||||||||||
| Charming Charlie, LLC | ||||||||||||||||||||||||||||||||||||||||||||||||||
| First Lien Term Loan B1 | — | — | — | — | — | — | — | — | ||||||||||||||||||||||||||||||||||||||||||
| First Lien Term Loan B2 | — | — | — | — | — | — | (1) | — | ||||||||||||||||||||||||||||||||||||||||||
| Vendor Payment Financing Facility | 472 | — | (97) | (25) | 350 | — | 7 | — | ||||||||||||||||||||||||||||||||||||||||||
| Conisus Holdings, Inc. | ||||||||||||||||||||||||||||||||||||||||||||||||||
| Series B Preferred Stock | 13,270 | 1,928 | — | 1,283 | 16,481 | — | — | 1,928 | ||||||||||||||||||||||||||||||||||||||||||
| Common Stock | 1,426 | — | — | 10,975 | 12,401 | — | — | — | ||||||||||||||||||||||||||||||||||||||||||
| DESG Holdings, Inc. | ||||||||||||||||||||||||||||||||||||||||||||||||||
| Bridge Loan | — | 4,256 | (4,256) | — | — | — | 600 | — | ||||||||||||||||||||||||||||||||||||||||||
| First Lien Term Loan | 28,978 | 844 | (20,443) | (5,401) | 3,978 | — | 4,278 | — | ||||||||||||||||||||||||||||||||||||||||||
| Second Lien Term Loan | 9,717 | 342 | — | (10,059) | — | — | 784 | — | ||||||||||||||||||||||||||||||||||||||||||
| Common Stock | 14,763 | 13 | — | (14,776) | — | — | — | — | ||||||||||||||||||||||||||||||||||||||||||
| F+W Media, Inc. | ||||||||||||||||||||||||||||||||||||||||||||||||||
| First Lien Term Loan B-1 | — | — | (11) | 11 | — | — | 1 | — | ||||||||||||||||||||||||||||||||||||||||||
| Lift Brands, Inc. | ||||||||||||||||||||||||||||||||||||||||||||||||||
| Term Loan A | — | 23,642 | — | — | 23,642 | — | 519 | — | ||||||||||||||||||||||||||||||||||||||||||
| Term Loan B | — | 4,753 | — | (2) | 4,751 | — | 236 | — | ||||||||||||||||||||||||||||||||||||||||||
| Term Loan C | — | 4,685 | — | 2 | 4,687 | — | 64 | — | ||||||||||||||||||||||||||||||||||||||||||
| Longview Power, LLC | ||||||||||||||||||||||||||||||||||||||||||||||||||
| First Lien Term Loan | — | 634 | (2) | 1,782 | 2,414 | — | 169 | — | ||||||||||||||||||||||||||||||||||||||||||
| Longview Intermediate Holdings C, LLC | ||||||||||||||||||||||||||||||||||||||||||||||||||
| Membership Units | — | 2,524 | — | 5,464 | 7,988 | — | — | — | ||||||||||||||||||||||||||||||||||||||||||
| Mount Logan Capital Inc. | ||||||||||||||||||||||||||||||||||||||||||||||||||
| Common Stock | 2,505 | 199 | — | (295) | 2,409 | — | — | 45 | ||||||||||||||||||||||||||||||||||||||||||
| Petroflow Energy Corp. | ||||||||||||||||||||||||||||||||||||||||||||||||||
| First Lien Term Loan | 10 | — | (223) | 213 | — | (211) | — | — | ||||||||||||||||||||||||||||||||||||||||||
| SIMR, LLC | ||||||||||||||||||||||||||||||||||||||||||||||||||
| First Lien Term Loan | 14,205 | 1,121 | — | (1,979) | 13,347 | — | 2,956 | — | ||||||||||||||||||||||||||||||||||||||||||
| SIMR Parent, LLC | ||||||||||||||||||||||||||||||||||||||||||||||||||
| Class B Membership Units | 3,980 | — | — | (3,980) | — | — | — | — | ||||||||||||||||||||||||||||||||||||||||||
| Snap Fitness Holdings, Inc. | ||||||||||||||||||||||||||||||||||||||||||||||||||
| Class A Stock | — | 3,078 | — | 311 | 3,389 | — | — | — | ||||||||||||||||||||||||||||||||||||||||||
| Warrants | — | 1,247 | — | 127 | 1,374 | — | — | — | ||||||||||||||||||||||||||||||||||||||||||
| Totals | $ | 106,959 | $ | 56,451 | $ | (28,570) | $ | (17,945) | $ | 116,895 | $ | (211) | $ | 9,965 | $ | 3,012 | ||||||||||||||||||||||||||||||||||
(1)Gross additions include increases in the cost basis of investments resulting from new portfolio investments, PIK interest, the amortization of unearned income, the exchange of one or more existing securities for one or more new securities and the movement of an existing portfolio company into this category from a different category.
See accompanying notes to consolidated financial statements.
23
CĪON Investment Corporation
Consolidated Schedule of Investments
December 31, 2020
(in thousands)
(2)Gross reductions include decreases in the cost basis of investments resulting from principal collections related to investment repayments or sales, the exchange of one or more existing securities for one or more new securities and the movement of an existing portfolio company out of this category into a different category.
(3)Includes PIK interest income.
t.Investment determined to be a controlled investment as defined in the 1940 Act as the Company is deemed to exercise a controlling influence over the management or policies of the portfolio company due to beneficially owning, either directly or through one or more controlled companies, more than 25% of the outstanding voting securities of such portfolio company. Fair value as of December 31, 2019 and 2020, along with transactions during the year ended December 31, 2020 in these controlled investments, are as follows:
| Year Ended December 31, 2020 | Year Ended December 31, 2020 | |||||||||||||||||||||||||||||||||||||||||||||||||
| Controlled Investments | Fair Value at December 31, 2019 | Gross Additions (Cost)(1) | Gross Reductions (Cost)(2) | Net Unrealized Gain (Loss) | Fair Value at December 31, 2020 | Net Realized Gain (Loss) | Interest Income(3) | Dividend Income | ||||||||||||||||||||||||||||||||||||||||||
| CION SOF Funding, LLC | ||||||||||||||||||||||||||||||||||||||||||||||||||
| Membership Interests | $ | 31,265 | $ | — | $ | (15,750) | $ | (3,043) | $ | 12,472 | $ | — | $ | — | $ | 3,518 | ||||||||||||||||||||||||||||||||||
| Totals | $ | 31,265 | $ | — | $ | (15,750) | $ | (3,043) | $ | 12,472 | $ | — | $ | — | $ | 3,518 | ||||||||||||||||||||||||||||||||||
(1)Gross additions include increases in the cost basis of investments resulting from new portfolio investments, PIK interest, the amortization of unearned income, the exchange of one or more existing securities for one or more new securities and the movement of an existing portfolio company into this category from a different category.
(2)Gross reductions include decreases in the cost basis of investments resulting from principal collections related to investment repayments or sales, the exchange of one or more existing securities for one or more new securities and the movement of an existing portfolio company out of this category into a different category.
(3)Includes PIK interest income.
u.For the year ended December 31, 2020, non-cash dividend income of $1,928 and $332 was recorded on the Company's investment in Conisus Holdings, Inc. and CHC Medical Partners, Inc., respectively.
See accompanying notes to consolidated financial statements.
24
CĪON Investment Corporation
Consolidated Schedule of Investments
December 31, 2020
(in thousands)
v.As of December 31, 2020, the following investments contain a PIK interest provision whereby the issuer has either the option or the obligation to make interest payments with the issuance of additional securities:
| Interest Rate | ||||||||||||||||||||||||||
| Portfolio Company | Investment Type | Cash | PIK | All-in-Rate | ||||||||||||||||||||||
| 1244311 B.C. LTD. | Senior Secured First Lien Debt | — | 6.00% | 6.00% | ||||||||||||||||||||||
| American Consolidated Natural Resources, Inc. | Senior Secured First Lien Debt | 11.00% | 3.00% | 14.00% | ||||||||||||||||||||||
| Anthem Sports & Entertainment Inc. | Senior Secured First Lien Debt | 7.75% | 2.75% | 10.50% | ||||||||||||||||||||||
| Cadence Aerospace, LLC | Senior Secured First Lien Debt | 4.25% | 5.25% | 9.50% | ||||||||||||||||||||||
| Carestream Health, Inc. | Senior Secured Second Lien Debt | 5.50% | 8.00% | 13.50% | ||||||||||||||||||||||
| CHC Solutions Inc. | Senior Secured First Lien Debt | 8.00% | 4.00% | 12.00% | ||||||||||||||||||||||
| CircusTrix Holdings, LLC | Senior Secured First Lien Debt | — | 6.50% | 6.50% | ||||||||||||||||||||||
| Country Fresh Holdings, LLC | Senior Secured First Lien Debt | 8.00% | 4.00% | 12.00% | ||||||||||||||||||||||
| Country Fresh Holdings, LLC | Senior Secured Second Lien Debt | — | 9.50% | 9.50% | ||||||||||||||||||||||
| David's Bridal, LLC | Senior Secured First Lien Debt | 6.00% | 5.00% | 11.00% | ||||||||||||||||||||||
| David's Bridal, LLC | Senior Secured First Lien Debt | 6.00% | 1.00% | 7.00% | ||||||||||||||||||||||
| Deluxe Entertainment Services, Inc. | Senior Secured First Lien Debt | 6.00% | 1.50% | 7.50% | ||||||||||||||||||||||
| Deluxe Entertainment Services, Inc. | Senior Secured Second Lien Debt | 7.00% | 2.50% | 9.50% | ||||||||||||||||||||||
| F+W Media, Inc. | Senior Secured First Lien Debt | — | 11.50% | 11.50% | ||||||||||||||||||||||
| Hilliard, Martinez & Gonzales, LLP | Senior Secured First Lien Debt | — | 20.00% | 20.00% | ||||||||||||||||||||||
| Homer City Generation, L.P. | Senior Secured First Lien Debt | — | 15.00% | 15.00% | ||||||||||||||||||||||
| Independent Pet Partners Intermediate Holdings, LLC | Senior Secured First Lien Debt | — | 6.00% | 6.00% | ||||||||||||||||||||||
| Jenny C Acquisition, Inc. | Senior Secured First Lien Debt | — | 12.25% | 12.25% | ||||||||||||||||||||||
| LAV Gear Holdings, Inc. | Senior Secured First Lien Debt | 3.50% | 5.00% | 8.50% | ||||||||||||||||||||||
| Lift Brands, Inc. | Senior Secured First Lien Debt | — | 9.50% | 9.50% | ||||||||||||||||||||||
| Mimeo.com, Inc. | Revolving Term Loan | 8.00% | 10.00% | 18.00% | ||||||||||||||||||||||
| Moss Holding Company | Senior Secured First Lien Debt | 7.50% | 0.50% | 8.00% | ||||||||||||||||||||||
| Patterson Medical Supply, Inc. | Senior Secured Second Lien Debt | 1.00% | 10.50% | 11.50% | ||||||||||||||||||||||
| Plano Molding Company, LLC | Senior Secured First Lien Debt | 8.50% | 1.50% | 10.00% | ||||||||||||||||||||||
| Premiere Global Services, Inc. | Senior Secured Second Lien Debt | 0.50% | 10.00% | 10.50% | ||||||||||||||||||||||
| SEK Holding Co LLC | Senior Secured First Lien Debt | 9.00% | 4.00% | 13.00% | ||||||||||||||||||||||
| SIMR, LLC | Senior Secured First Lien Debt | 12.00% | 7.00% | 19.00% | ||||||||||||||||||||||
| Spinal USA, Inc. / Precision Medical Inc. | Senior Secured First Lien Debt | — | 10.47% | 10.47% | ||||||||||||||||||||||
| West Dermatology Management Holdings, LLC | Senior Secured First Lien Debt | 6.25% | 0.75% | 7.00% | ||||||||||||||||||||||
| WPLM Acquisition Corp. | Unsecured Note | — | 15.00% | 15.00% | ||||||||||||||||||||||
See accompanying notes to consolidated financial statements.
25
CĪON Investment Corporation
Notes to Consolidated Financial Statements (unaudited)
March 31, 2021
(in thousands, except share and per share amounts)
Note 1. Organization and Principal Business
CĪON Investment Corporation, or the Company, was incorporated under the general corporation laws of the State of Maryland on August 9, 2011. On December 17, 2012, the Company successfully raised gross proceeds from unaffiliated outside investors of at least $2,500, or the minimum offering requirement, and commenced operations. The Company is an externally managed, non-diversified closed-end management investment company that has elected to be regulated as a business development company, or BDC, under the 1940 Act. The Company elected to be treated for federal income tax purposes as a regulated investment company, or RIC, as defined under Subchapter M of the Internal Revenue Code of 1986, as amended, or the Code.
The Company’s investment objective is to generate current income and, to a lesser extent, capital appreciation for investors. The Company’s portfolio is comprised primarily of investments in senior secured debt, including first lien loans, second lien loans and unitranche loans, and, to a lesser extent, collateralized securities, structured products and other similar securities, unsecured debt, and equity, of private and thinly-traded U.S. middle-market companies.
The Company is managed by CION Investment Management, LLC, or CIM, a registered investment adviser and an affiliate of the Company. Pursuant to an investment advisory agreement with the Company, CIM oversees the management of the Company’s activities and is responsible for making investment decisions for the Company’s investment portfolio. On November 13, 2020, the board of directors of the Company, including a majority of the board of directors who are not interested persons, approved the renewal of the investment advisory agreement with CIM for a period of twelve months commencing December 17, 2020. The Company and CIM previously engaged Apollo Investment Management, L.P., or AIM, a subsidiary of Apollo Global Management, Inc., or, together with its subsidiaries, Apollo, a leading global alternative investment manager, to act as the Company’s investment sub-adviser.
On July 11, 2017, the members of CIM entered into a third amended and restated limited liability company agreement of CIM, or the Third Amended CIM LLC Agreement, for the purpose of creating a joint venture between AIM and CION Investment Group, LLC, or CIG, an affiliate of the Company. Under the Third Amended CIM LLC Agreement, AIM became a member of CIM and was issued a newly-created class of membership interests in CIM pursuant to which AIM, among other things, shares in the profits, losses, distributions and expenses of CIM with the other members in accordance with the terms of the Third Amended CIM LLC Agreement, which results in CIG and AIM each owning a 50% economic interest in CIM.
On July 10, 2017, the Company’s independent directors unanimously approved the termination of the investment sub-advisory agreement with AIM, effective as of July 11, 2017. Although the investment sub-advisory agreement and AIM's engagement as the Company’s investment sub-adviser were terminated, AIM's investment professionals continue to perform certain services for CIM and the Company, including, without limitation, identifying investment opportunities for approval by CIM's investment committee. AIM is not paid a separate fee in exchange for such services, but is entitled to receive distributions as a member of CIM as described above.
On December 4, 2017, the members of CIM entered into a fourth amended and restated limited liability company agreement of CIM, or the Fourth Amended CIM LLC Agreement. Under the Fourth Amended CIM LLC Agreement, AIM's investment professionals perform certain services for CIM, which include, among other services, (i) assistance with identifying and providing information about potential investment opportunities for approval by CIM’s investment committee; and (ii) providing (a) trade and settlement support; (b) portfolio and cash reconciliation; (c) market pipeline information regarding syndicated deals, in each case, as reasonably requested by CIM; and (d) monthly valuation reports and support for all broker-quoted investments. All of the Company's investment decisions are the sole responsibility of, and are made at the sole discretion of, CIM's investment committee, which consists entirely of CIG personnel.
Note 2. Summary of Significant Accounting Policies
Basis of Presentation and Consolidation
The accompanying unaudited consolidated financial statements of the Company have been prepared in accordance with U.S. generally accepted accounting principles, or GAAP, for interim financial information and pursuant to the instructions for Form 10-Q and Article 10 of Regulation S-X. Accordingly, they do not include all of the information and footnotes required by GAAP for complete financial statements. In the opinion of management, all adjustments (consisting of normal recurring adjustments) considered necessary for a fair presentation have been included. For a more complete discussion of significant accounting policies and certain other information, the Company’s interim unaudited consolidated financial statements should be read in conjunction with its audited consolidated financial statements as of December 31, 2020 and for the year then ended included in the Company’s Annual Report on Form 10-K. Operating results for interim periods are not necessarily indicative of the results that may be expected for the full year ending December 31, 2021. The consolidated balance sheet and the consolidated schedule of investments as of December 31, 2020 and the consolidated statements of operations, changes in net assets, and cash flows for the year ended December 31, 2020 are derived from the 2020 audited consolidated financial statements and include the accounts of the Company’s wholly-owned subsidiaries. All intercompany balances and transactions have been eliminated in consolidation. The Company did not consolidate its interest in CION SOF Funding, LLC, or CION SOF. See Note 7 for a description of the Company’s investment in CION SOF.
26
CĪON Investment Corporation
Notes to Consolidated Financial Statements (unaudited)
March 31, 2021
(in thousands, except share and per share amounts)
The Company evaluates subsequent events through the date that the consolidated financial statements are issued.
Recently Announced Accounting Standards
In March 2020, the Financial Accounting Standards Board, or the FASB, issued ASU 2020-04, Reference Rate Reform (Topic 848): Facilitation of the Effects of Reference Rate Reform on Financial Reporting, or ASU 2020-04, which provides optional expedients and exceptions for applying GAAP to contract modifications, hedging relationships and other transactions, subject to meeting certain criteria, that reference LIBOR or another reference rate expected to be discontinued because of the reference rate reform. ASU 2020-04 is effective for all entities as of March 12, 2020 through December 31, 2022. The Company is evaluating the potential impact that the adoption of this guidance will have on the Company’s consolidated financial statements.
Cash and Cash Equivalents
Cash and cash equivalents include cash in banks and highly liquid investments with original maturity dates of three months or less. The Company’s cash and cash equivalents are held principally at one financial institution and at times may exceed insured limits. The Company periodically evaluates the creditworthiness of this institution and has not experienced any losses on such deposits.
Foreign Currency Translations
The accounting records of the Company are maintained in U.S. dollars. All assets and liabilities denominated in foreign currencies are translated into U.S. dollars based on the foreign exchange rate on the date of valuation. The Company does not isolate that portion of the results of operations resulting from changes in foreign exchange rates on investments from the fluctuations arising from changes in market prices of securities held. Changes in the relationship of foreign currencies to the U.S. dollar can significantly affect the value of these investments and therefore the earnings of the Company.
Short Term Investments
Short term investments include an investment in a U.S. Treasury obligations fund, which seeks to provide current income and daily liquidity by purchasing U.S. Treasury securities and repurchase agreements that are collateralized by such securities. The Company had $87,593 and $73,597 of such investments at March 31, 2021 and December 31, 2020, respectively, which are included in investments, at fair value on the accompanying consolidated balance sheets and on the consolidated schedules of investments.
Offering Costs
Offering costs included, among other things, legal fees and other costs pertaining to the preparation of the Company’s registration statements in connection with the continuous public offerings of the Company’s shares. Certain initial offering costs that were funded by CIG on behalf of the Company were submitted by CIG for reimbursement upon meeting the minimum offering requirement on December 17, 2012. These costs were capitalized and amortized over a twelve month period as an adjustment to capital in excess of par value. All other offering costs were expensed as incurred by the Company. The Company's follow-on continuous public offering ended on January 25, 2019.
Income Taxes
The Company elected to be treated for federal income tax purposes as a RIC under Subchapter M of the Code. To qualify and maintain qualification as a RIC, the Company must, among other things, meet certain source of income and asset diversification requirements and distribute to shareholders, for each taxable year, at least 90% of the Company’s “investment company taxable income”, which is generally equal to the sum of the Company’s net ordinary income plus the excess, if any, of realized net short-term capital gains over realized net long-term capital losses. If the Company continues to qualify as a RIC and continues to satisfy the annual distribution requirement, the Company will not be subject to corporate level federal income taxes on any income that the Company distributes to its shareholders. The Company intends to make distributions in an amount sufficient to maintain RIC status each year and to avoid any federal income taxes on income. The Company will also be subject to nondeductible federal excise taxes if the Company does not distribute at least 98.0% of net ordinary income, 98.2% of capital gains, if any, and any recognized and undistributed income from prior years for which it paid no federal income taxes.
Two of the Company’s wholly-owned consolidated subsidiaries, View ITC, LLC and View Rise, LLC, or collectively the Taxable Subsidiaries, have elected to be treated as taxable entities for U.S. federal income tax purposes. As a result, the Taxable Subsidiaries are not consolidated with the Company for income tax purposes and may generate income tax expense or benefit, and the related tax assets and liabilities, as a result of its ownership of certain portfolio investments. The income tax expense or benefit, if any, and the related tax assets and liabilities, where material, are reflected in the Company’s consolidated financial statements. There were no deferred tax assets or liabilities as of March 31, 2021.
27
CĪON Investment Corporation
Notes to Consolidated Financial Statements (unaudited)
March 31, 2021
(in thousands, except share and per share amounts)
Book/tax differences relating to permanent differences are reclassified among the Company’s capital accounts, as appropriate. Additionally, the tax character of distributions is determined in accordance with income tax regulations that may differ from GAAP (see Note 5).
Uncertainty in Income Taxes
The Company evaluates its tax positions to determine if the tax positions taken meet the minimum recognition threshold for the purposes of measuring and recognizing tax liabilities in the consolidated financial statements. Recognition of a tax benefit or liability with respect to an uncertain tax position is required only when the position is “more likely than not” to be sustained assuming examination by the taxing authorities. The Company recognizes interest and penalties, if any, related to unrecognized tax benefits as income tax expense in the consolidated statements of operations. The Company did not have any uncertain tax positions during the periods presented herein.
The Company is subject to examination by U.S. federal, New York State, New York City and Maryland income tax jurisdictions for 2017, 2018, and 2019.
Use of Estimates
The preparation of the consolidated financial statements in conformity with GAAP requires the Company to make estimates and assumptions that affect the reported amounts of assets and liabilities and the disclosure of contingent assets and liabilities at the date of the consolidated financial statements and the reported amounts of revenues and expenses during the reporting period.
During the first half of 2020, there was a global outbreak of a novel coronavirus, or COVID-19, which spread to over 100 countries, including the United States, and spread to every state in the United States. The World Health Organization designated COVID-19 as a pandemic, and numerous countries, including the United States, declared national emergencies with respect to COVID-19. The global impact of the outbreak has been rapidly evolving, and as cases of COVID-19 continued to be identified in additional countries, many countries reacted by instituting quarantines and restrictions on travel, closing financial markets and/or restricting trading, and limiting operations of non-essential businesses. Although countries, including the United States, have slowly started to loosen these restrictions, such actions created and will continue to create disruption in global supply chains, and adversely impacted many industries. In addition, certain European countries instituted another lockdown during the fourth quarter of 2020 as a second wave of the outbreak occurred. The outbreak could have a continued adverse impact on economic and market conditions and trigger a period of global economic slowdown. The rapid development and fluidity of this situation precludes any prediction as to the ultimate adverse impact of COVID-19 on economic and market conditions. The Company believes the estimates and assumptions underlying the consolidated financial statements are reasonable and supportable based on the information available as of March 31, 2021; however, uncertainty over the ultimate impact COVID-19 will have on the global economy generally, and the Company’s business in particular, makes any estimates and assumptions as of March 31, 2021 inherently less certain than they would be absent the current and potential impacts of COVID-19. Actual results may materially differ from those estimates.
Valuation of Portfolio Investments
The fair value of the Company’s investments is determined quarterly in good faith by the Company’s board of directors pursuant to its consistently applied valuation procedures and valuation process in accordance with Accounting Standards Codification Topic 820, Fair Value Measurements and Disclosure, or ASC 820. ASC 820 defines fair value as the price that would be received from the sale of an asset or paid to transfer a liability in an orderly transaction between market participants at the measurement date. ASC 820 also establishes a three-tier fair value hierarchy that prioritizes and ranks the level of market price observability of inputs used in measuring investments at fair value. Inputs used to measure these fair values are classified into the following hierarchy:
Level 1 -Quoted prices in active markets for identical assets or liabilities, accessible by the Company at the measurement date.
Level 2 -Quoted prices for similar assets or liabilities in active markets, or quoted prices for identical or similar assets or liabilities in markets that are not active, or other observable inputs other than quoted prices.
Level 3 -Unobservable inputs for the asset or liability. The inputs used in the determination of fair value may require significant management judgment or estimation. Such information may be the result of consensus pricing information or broker quotes that include a disclaimer that the broker would not be held to such a price in an actual transaction. The non-binding nature of consensus pricing and/or quotes accompanied by the disclaimer would result in classification as a Level 3 asset, assuming no additional corroborating evidence.
Market price observability is affected by a number of factors, including the type of investment and the characteristics specific to the investment. Investments with readily available active quoted prices or for which fair value can be measured from actively quoted prices generally will have a higher degree of market price observability and a lesser degree of judgment used in measuring fair value.
28
CĪON Investment Corporation
Notes to Consolidated Financial Statements (unaudited)
March 31, 2021
(in thousands, except share and per share amounts)
Based on the observability of the inputs used in the valuation techniques, the Company is required to provide disclosures on fair value measurements according to the fair value hierarchy. The level in the fair value hierarchy for each fair value measurement has been determined based on the lowest level of input that is significant to the fair value measurement. Our assessment of the significance of a particular input to the fair value measurement in its entirety requires judgment and considers factors specific to each investment. The level assigned to the investment valuations may not be indicative of the risk or liquidity associated with investing in such investments. Because of the inherent uncertainties of valuation, the values reflected in the consolidated financial statements may differ materially from the value that would be received upon an actual sale of such investments. In addition, changes in the market environment and other events that may occur over the life of the investments may cause the gains or losses that the Company ultimately realizes on these investments to materially differ from the valuations currently assigned.
A portion of the Company’s investments consist of debt securities that are traded on a private over-the-counter market for institutional investments. CIM attempts to obtain market quotations from at least two brokers or dealers for each investment (if available, otherwise from a principal market maker or a primary market dealer or other independent pricing service). CIM typically uses the average midpoint of the broker bid/ask price to determine fair value unless a different point within the range is more representative. Because of the private nature of this marketplace (meaning actual transactions are not publicly reported) and the non-binding nature of consensus pricing and/or quotes, the Company believes that these valuation inputs result in Level 3 classification within the fair value hierarchy. As these quotes are only indicative of fair value, CIM benchmarks the implied fair value yield and leverage against what has been observed in the market. If the implied fair value yield and leverage fall within the range of CIM's market pricing matrix, the quotes are deemed to be reliable and used to determine the investment's fair value.
Notwithstanding the foregoing, if in the reasonable judgment of CIM, the price of any investment held by the Company and determined in the manner described above does not accurately reflect the fair value of such investment, CIM will value such investment at a price that reflects such investment’s fair value and report such change in the valuation to the board of directors or its designee as soon as practicable. Investments that carry certain restrictions on sale will typically be valued at a discount from the public market value of the investment.
Any investments that are not publicly traded or for which a market price is not otherwise readily available are valued at a price that reflects its fair value. With respect to such investments, if CIM is unable to obtain market quotations, the investments are reviewed and valued using one or more of the following types of analyses:
i.Market comparable statistics and public trading multiples discounted for illiquidity, minority ownership and other factors for companies with similar characteristics.
ii.Valuations implied by third-party investments in the applicable portfolio companies.
iii.Discounted cash flow analysis, including a terminal value or exit multiple.
Determination of fair value involves subjective judgments and estimates. Accordingly, these notes to the Company’s consolidated financial statements refer to the uncertainty with respect to the possible effect of such valuations, and any change in such valuations, on the Company’s consolidated financial statements. Below is a description of factors that the Company’s board of directors may consider when valuing the Company’s equity and debt investments where a market price is not readily available:
•the size and scope of a portfolio company and its specific strengths and weaknesses;
•prevailing interest rates for like securities;
•expected volatility in future interest rates;
•leverage;
•call features, put features and other relevant terms of the debt;
•the borrower’s ability to adequately service its debt;
•the fair market value of the portfolio company in relation to the face amount of its outstanding debt;
•the quality of collateral securing the Company’s debt investments;
•multiples of earnings before interest, taxes, depreciation and amortization, or EBITDA, cash flows, net income, revenues or, in some cases, book value or liquidation value; and
•other factors deemed applicable.
All of these factors may be subject to adjustment based upon the particular circumstances of a portfolio company or the Company’s actual investment position. For example, adjustments to EBITDA may take into account compensation to previous owners, or acquisition, recapitalization, and restructuring expenses or other related or non-recurring items. The choice of analyses and the weight assigned to such factors may vary across investments and may change within an investment if events occur that warrant such a change.
29
CĪON Investment Corporation
Notes to Consolidated Financial Statements (unaudited)
March 31, 2021
(in thousands, except share and per share amounts)
The discounted cash flow model deemed appropriate by CIM is prepared for the applicable investments and reviewed by designated members of CIM’s management team. Such models are prepared at least quarterly or on an as needed basis. The model uses the estimated cash flow projections for the underlying investments and an appropriate discount rate is determined based on the latest financial information available for the borrower, prevailing market trends, comparable analysis and other inputs. The model, key assumptions, inputs, and results are reviewed by designated members of CIM’s management team with final approval from the board of directors.
Consistent with the Company’s valuation policy, the Company evaluates the source of inputs, including any markets in which the Company’s investments are trading, in determining fair value.
The Company periodically benchmarks the broker quotes from the brokers or dealers against the actual prices at which the Company purchases and sells its investments. Based on the results of the benchmark analysis and the experience of the Company’s management in purchasing and selling these investments, the Company believes that these quotes are reliable indicators of fair value. The Company may also use other methods to determine fair value for securities for which it cannot obtain market quotations through brokers or dealers, including the use of an independent valuation firm. Designated members of CIM’s management team and the Company's board of directors review and approve the valuation determinations made with respect to these investments in a manner consistent with the Company’s valuation process.
As a practical expedient, the Company uses net asset value, or NAV, as the fair value for its equity investments in CION SOF and BCP Great Lakes Fund LP. CION SOF and BCP Great Lakes Fund LP record their underlying investments at fair value on a quarterly basis in accordance with ASC 820.
Revenue Recognition
Securities transactions are accounted for on the trade date. The Company records interest and dividend income on an accrual basis beginning on the trade settlement date or the ex-dividend date, respectively, to the extent that the Company expects to collect such amounts. For investments in equity tranches of collateralized loan obligations, the Company records income based on the effective interest rate determined using the amortized cost and estimated cash flows, which is updated periodically. Loan origination fees, original issue discounts, or OID, and market discounts/premiums are recorded and such amounts are amortized as adjustments to interest income over the respective term of the loan using the effective interest rate method. Upon the prepayment of a loan or security, prepayment premiums, any unamortized loan origination fees, OID, or market discounts/premiums are recorded as interest income.
The Company may have investments in its investment portfolio that contain a PIK interest provision. PIK interest is accrued as interest income if the portfolio company valuation indicates that such PIK interest is collectible and recorded as interest receivable up to the interest payment date. On the interest payment dates, the Company will capitalize the accrued interest receivable attributable to PIK as additional principal due from the borrower. Additional PIK securities typically have the same terms, including maturity dates and interest rates, as the original securities. In order to maintain RIC status, substantially all of this income must be paid out to shareholders in the form of distributions, even if the Company has not collected any cash. For additional information on investments that contain a PIK interest provision, see the consolidated schedules of investments as of March 31, 2021 and December 31, 2020.
Loans and debt securities, including those that are individually identified as being impaired under Accounting Standards Codification 310, Receivables, or ASC 310, are generally placed on non-accrual status immediately if, in the opinion of management, principal or interest is not likely to be paid, or when principal or interest is past due 90 days or more. Interest accrued but not collected at the date a loan or security is placed on non-accrual status is reversed against interest income. Interest income is recognized on non-accrual loans or debt securities only to the extent received in cash. However, where there is doubt regarding the ultimate collectibility of principal, cash receipts, whether designated as principal or interest, are thereafter applied to reduce the carrying value of the loan or debt security. Loans or securities are restored to accrual status only when interest and principal payments are brought current and future payments are reasonably assured.
Dividend income on preferred equity securities is recorded on an accrual basis to the extent that such amounts are payable by the portfolio company and are expected to be collected. Dividend income on common equity securities is recorded on the record date for private portfolio companies or on the ex-dividend date for publicly-traded portfolio companies.
The Company may receive fees for capital structuring services that are fixed based on contractual terms, are normally paid at the closing of the investments, are generally non-recurring and non-refundable and are recognized as revenue when earned upon closing of the investment. The services that CIM provides vary by investment, but generally include reviewing existing credit facilities, arranging bank financing, arranging equity financing, structuring financing from multiple lenders, structuring financing from multiple equity investors, restructuring existing loans, raising equity and debt capital, and providing general financial advice, which concludes upon closing of the investment. In certain instances where the Company is invited to participate as a co-lender in a transaction and does not provide significant services in connection with the investment, a portion of loan fees paid to the Company in such situations will be deferred and amortized over the estimated life of the loan as interest income.
30
CĪON Investment Corporation
Notes to Consolidated Financial Statements (unaudited)
March 31, 2021
(in thousands, except share and per share amounts)
Other income includes amendment fees that are fixed based on contractual terms and are generally non-recurring and non-refundable and are recognized as revenue when earned upon closing of the transaction. Other income also includes fees for managerial assistance and other consulting services, loan guarantees, commitments, and other services rendered by the Company to its portfolio companies. Such fees are fixed based on contractual terms and are recognized as fee income when earned.
Net Realized Gains or Losses and Net Change in Unrealized Appreciation or Depreciation
Gains or losses on the sale of investments are calculated by using the weighted-average method. The Company measures realized gains or losses by the difference between the net proceeds from the sale and the weighted-average amortized cost of the investment, without regard to unrealized appreciation or depreciation previously recognized, but considering unamortized upfront fees. Net change in unrealized appreciation or depreciation reflects the change in portfolio investment values during the reporting period, including any reversal of previously recorded unrealized appreciation or depreciation when gains or losses are realized.
Capital Gains Incentive Fee
Pursuant to the terms of the investment advisory agreement the Company entered into with CIM, the incentive fee on capital gains earned on liquidated investments of the Company’s investment portfolio during operations is determined and payable in arrears as of the end of each calendar year. Such fee equals 20% of the Company’s incentive fee capital gains (i.e., the Company’s realized capital gains on a cumulative basis from inception, calculated as of the end of each calendar year, computed net of all realized capital losses and unrealized capital depreciation on a cumulative basis), less the aggregate amount of any previously paid capital gains incentive fees. On a cumulative basis and to the extent that all realized capital losses and unrealized capital depreciation exceed realized capital gains as well as the aggregate realized net capital gains for which a fee has previously been paid, the Company would not be required to pay CIM a capital gains incentive fee. On a quarterly basis, the Company accrues for the capital gains incentive fee by calculating such fee as if it were due and payable as of the end of such period.
While the investment advisory agreement with CIM neither includes nor contemplates the inclusion of unrealized gains in the calculation of the capital gains incentive fee, pursuant to an interpretation of the American Institute for Certified Public Accountants, or AICPA, Technical Practice Aid for investment companies, the Company accrues capital gains incentive fees on unrealized gains. This accrual reflects the incentive fees that would be payable to CIM if the Company’s entire investment portfolio was liquidated at its fair value as of the balance sheet date even though CIM is not entitled to an incentive fee with respect to unrealized gains unless and until such gains are actually realized.
Net Increase (Decrease) in Net Assets per Share
Net increase (decrease) in net assets per share is calculated based upon the daily weighted average number of shares of common stock outstanding during the reporting period.
Distributions
Distributions to shareholders are recorded as of the record date. The amount paid as a distribution is declared by the Company's co-chief executive officers and ratified by the board of directors on a quarterly basis. Net realized capital gains, if any, are distributed at least annually.
Note 3. Share Transactions
The Company’s initial continuous public offering commenced on July 2, 2012 and ended on December 31, 2015. The Company’s follow-on continuous public offering commenced on January 25, 2016 and ended on January 25, 2019.
31
CĪON Investment Corporation
Notes to Consolidated Financial Statements (unaudited)
March 31, 2021
(in thousands, except share and per share amounts)
The following table summarizes transactions with respect to shares of the Company’s common stock during the three months ended March 31, 2021 and 2020 and the year ended December 31, 2020:
| Three Months Ended March 31, | Year Ended December 31, | ||||||||||||||||||||||||||||||||||
| 2021 | 2020 | 2020 | |||||||||||||||||||||||||||||||||
| Shares | Amount | Shares | Amount | Shares | Amount | ||||||||||||||||||||||||||||||
| Gross shares/proceeds from the offering | — | $ | — | — | $ | — | — | $ | — | ||||||||||||||||||||||||||
| Reinvestment of distributions | 681,553 | 5,292 | 1,008,333 | 8,071 | 2,992,532 | 23,298 | |||||||||||||||||||||||||||||
| Total gross shares/proceeds | 681,553 | 5,292 | 1,008,333 | 8,071 | 2,992,532 | 23,298 | |||||||||||||||||||||||||||||
| Sales commissions and dealer manager fees | — | — | — | — | — | — | |||||||||||||||||||||||||||||
| Net shares/proceeds | 681,553 | 5,292 | 1,008,333 | 8,071 | 2,992,532 | 23,298 | |||||||||||||||||||||||||||||
| Share repurchase program | (675,440) | (5,291) | (1,076,229) | (8,071) | (3,079,954) | (23,300) | |||||||||||||||||||||||||||||
| Net shares/proceeds from (for) share transactions | 6,113 | $ | 1 | (67,896) | $ | — | (87,422) | $ | (2) | ||||||||||||||||||||||||||
Since commencing its initial continuous public offering on July 2, 2012 and through March 31, 2021, the Company sold 113,299,836 shares of common stock for net proceeds of $1,155,286 at an average price per share of $10.20. The net proceeds include gross proceeds received from reinvested shareholder distributions of $227,254, for which the Company issued 25,788,085 shares of common stock, and gross proceeds paid for shares of common stock tendered for repurchase of $227,254, for which the Company repurchased 25,979,994 shares of common stock.
During the period from April 1, 2021 to May 10, 2021, the Company received gross proceeds of $1,723 from reinvested shareholder distributions, for which the Company issued 214,640 shares of common stock.
Since commencing its initial continuous public offering on July 2, 2012 and through May 10, 2021, the Company sold 113,514,454 shares of common stock for net proceeds of $1,157,009 at an average price per share of $10.19. The net proceeds include gross proceeds received from reinvested shareholder distributions of $228,977, for which the Company issued 26,002,725 shares of common stock, and gross proceeds paid for shares of common stock tendered for repurchase of $227,254, for which the Company repurchased 25,980,017 shares of common stock.
In August 2020, the Company obtained approval from its shareholders authorizing the Company to issue shares of its common stock at prices below the then current NAV per share of the Company’s common stock in one or more offerings for a 12-month period. The Company has not issued any such shares as of the date of these notes to consolidated financial statements and does not currently intend to do so through August 2021 (the 12-month anniversary of such shareholder approval). In 2021, the Company will seek to obtain from its shareholders and they may approve a proposal that again authorizes the Company to issue shares of its common stock at prices below the then current NAV per share of the Company’s common stock in one or more offerings for a 12-month period.
Share Repurchase Program
The Company offers to repurchase shares on such terms as determined by the Company’s board of directors in its complete and absolute discretion unless, in the judgment of the independent directors of the Company’s board of directors, such repurchases would not be in the best interests of the Company’s shareholders or would violate applicable law.
On March 19, 2020, the Company's board of directors, including the independent directors, temporarily suspended the Company's share repurchase program commencing with the second quarter of 2020 and included the third quarter of 2020. On November 13, 2020, the Company recommenced its share repurchase program for the fourth quarter of 2020. Share repurchases for future quarters will be evaluated by the board of directors based on circumstances and expectations existing at the time of consideration.
The Company currently limits the number of shares to be repurchased during any calendar year to the number of shares it can repurchase with the proceeds it receives from the issuance of shares pursuant to its fifth amended and restated distribution reinvestment plan. At the discretion of the Company’s board of directors, it may also use cash on hand, cash available from borrowings and cash from liquidation of investments as of the end of the applicable period to repurchase shares. The Company currently offers to repurchase such shares at a price equal to the estimated net asset value per share on each date of repurchase.
Any periodic repurchase offers are subject in part to the Company’s available cash and compliance with the BDC and RIC qualification and diversification rules promulgated under the 1940 Act and the Code, respectively. While the Company conducts quarterly tender offers as described above, it is not required to do so and may suspend or terminate the share repurchase program at any time, upon 30 days’ notice.
32
CĪON Investment Corporation
Notes to Consolidated Financial Statements (unaudited)
March 31, 2021
(in thousands, except share and per share amounts)
The following table summarizes the share repurchases completed during the year ended December 31, 2020 and the three months ended March 31, 2021:
| Three Months Ended | Repurchase Date | Shares Repurchased | Percentage of Shares Tendered That Were Repurchased | Repurchase Price Per Share | Aggregate Consideration for Repurchased Shares | |||||||||||||||||||||||||||
| 2020 | ||||||||||||||||||||||||||||||||
| March 31, 2020 | March 30, 2020 | 1,076,229 | 13% | $ | 7.50 | $ | 8,071 | |||||||||||||||||||||||||
| June 30, 2020(1) | N/A | 1,765 | N/A | 7.50 | 14 | |||||||||||||||||||||||||||
| September 30, 2020 | N/A | — | N/A | N/A | — | |||||||||||||||||||||||||||
| December 31, 2020 | December 30, 2020 | 2,001,960 | 20% | 7.60 | 15,215 | |||||||||||||||||||||||||||
| Total for the year ended December 31, 2020 | 3,079,954 | $ | 23,300 | |||||||||||||||||||||||||||||
| 2021 | ||||||||||||||||||||||||||||||||
| March 31, 2021 | March 24, 2021 | 675,440 | 6% | $ | 7.83 | $ | 5,291 | |||||||||||||||||||||||||
| Total for the three months ended March 31, 2021 | 675,440 | $ | 5,291 | |||||||||||||||||||||||||||||
(1) Represents an adjustment made during the three months ended June 30, 2020 to shares repurchased during the three months ended March 31, 2020.
Note 4. Transactions with Related Parties
For the three months ended March 31, 2021 and 2020 and the year ended December 31, 2020, fees and other expenses incurred by the Company related to CIM and its affiliates were as follows:
| Three Months Ended March 31, | Year Ended December 31, | ||||||||||||||||||||||||||||||||||
| Entity | Capacity | Description | 2021 | 2020 | 2020 | ||||||||||||||||||||||||||||||
| CIM | Investment adviser | Management fees(1) | $ | 7,783 | $ | 8,451 | $ | 31,828 | |||||||||||||||||||||||||||
| CIM | Investment adviser | Incentive fees(1) | — | 3,308 | 7,631 | ||||||||||||||||||||||||||||||
| CIM | Administrative services provider | Administrative services expense(1) | 684 | 394 | 2,465 | ||||||||||||||||||||||||||||||
| Apollo Investment Administration, L.P. | Administrative services provider | Transaction costs(1) | 47 | 7 | 56 | ||||||||||||||||||||||||||||||
| $ | 8,514 | $ | 12,160 | $ | 41,980 | ||||||||||||||||||||||||||||||
(1)Amounts charged directly to operations.
The Company has entered into an investment advisory agreement with CIM. On November 13, 2020, the board of directors of the Company, including a majority of the board of directors who are not interested persons, approved the renewal of the investment advisory agreement for a period of twelve months commencing December 17, 2020. Pursuant to the investment advisory agreement, CIM is paid an annual base management fee equal to 2.0% of the average value of the Company’s gross assets, less cash and cash equivalents, and an incentive fee based on the Company’s performance, as described below. The base management fee is payable quarterly in arrears and is calculated based on the two most recently completed calendar quarters. The incentive fee consists of two parts. The first part, which is referred to as the subordinated incentive fee on income, is calculated and payable quarterly in arrears based on “pre-incentive fee net investment income” for the immediately preceding quarter and is subject to a hurdle rate, measured quarterly and expressed as a rate of return on adjusted capital, as defined in the investment advisory agreement, equal to 1.875% per quarter, or an annualized rate of 7.5%. The Company receives 100% of pre-incentive fee net investment income once the hurdle rate is exceeded until the annualized rate of 9.375% is exceeded, at which point the Company receives 20% of all pre-incentive fee net investment income that exceeds the annualized rate of 9.375%. For the three months ended March 31, 2021 and 2020, the liabilities recorded for subordinated incentive fees were $0 and $3,308, respectively. The second part of the incentive fee, which is referred to as the capital gains incentive fee, is described in Note 2.
33
CĪON Investment Corporation
Notes to Consolidated Financial Statements (unaudited)
March 31, 2021
(in thousands, except share and per share amounts)
The Company accrues the capital gains incentive fee based on net realized gains and net unrealized appreciation; however, under the terms of the investment advisory agreement, the fee payable to CIM is based on net realized gains and unrealized depreciation and no such fee is payable with respect to unrealized appreciation unless and until such appreciation is actually realized. For the three months ended March 31, 2021 and 2020 and the year ended December 31, 2020, the Company had no liability for and did not record any capital gains incentive fees.
On April 1, 2018, the Company entered into an administration agreement with CIM pursuant to which CIM furnishes the Company with administrative services including accounting, investor relations and other administrative services necessary to conduct its day-to-day operations. CIM is reimbursed for administrative expenses it incurs on the Company’s behalf in performing its obligations, provided that such reimbursement is for the lower of CIM’s actual costs or the amount that the Company would have been required to pay for comparable administrative services in the same geographic location. Such costs are reasonably allocated to the Company on the basis of assets, revenues, time records or other reasonable methods. The Company does not reimburse CIM for any services for which it receives a separate fee or for rent, depreciation, utilities, capital equipment or other administrative items allocated to a person with a controlling interest in CIM. On November 13, 2020, the board of directors of the Company, including a majority of the board of directors who are not interested persons, approved the renewal of the administration agreement with CIM for a period of twelve months commencing December 17, 2020. This administration agreement with CIM replaced the prior administration agreement with CIM's affiliate, ICON Capital, LLC, or ICON Capital, in which ICON Capital provided the same administrative services to the Company under the same terms and conditions.
On January 1, 2019, the Company entered into a servicing agreement with CIM’s affiliate, Apollo Investment Administration, L.P., or AIA, pursuant to which AIA furnishes the Company with administrative services including, but not limited to, loan and high yield trading services, trade and settlement support, and monthly valuation reports and support for all broker quoted investments. AIA is reimbursed for administrative expenses it incurs on the Company’s behalf in performing its obligations, provided that such reimbursement is reasonable, and costs and expenses incurred are documented. The servicing agreement may be terminated at any time, without the payment of any penalty, by either party, upon 60 days' written notice to the other party.
On January 30, 2013, the Company entered into the expense support and conditional reimbursement agreement with CIG, whereby CIG agreed to provide expense support to the Company in an amount that is sufficient to: (1) ensure that no portion of the Company’s distributions to shareholders will be paid from its offering proceeds or borrowings, and/or (2) reduce the Company’s operating expenses until it has achieved economies of scale sufficient to ensure that it bears a reasonable level of expense in relation to its investment income. On December 16, 2015, the Company further amended and restated the expense support and conditional reimbursement agreement for purposes of including AIM as a party to the agreement. On January 2, 2018, the Company entered into an expense support and conditional reimbursement agreement with CIM for purposes of, among other things, replacing CIG and AIM with CIM as the expense support provider pursuant to the terms of the expense support and conditional reimbursement agreement. On December 9, 2020, the Company and CIM further amended the expense support and conditional reimbursement agreement to extend the termination date of such agreement from December 31, 2020 to December 31, 2021.
Pursuant to the expense support and conditional reimbursement agreement, the Company will have a conditional obligation to reimburse CIM for any amounts funded by CIM under such agreement (i) if expense support amounts funded by CIM exceed operating expenses incurred during any fiscal quarter, (ii) if the sum of the Company’s net investment income for tax purposes, net capital gains and the amount of any dividends and other distributions paid to the Company on account of investments in portfolio companies (to the extent not included in net investment income or net capital gains for tax purposes) exceeds the distributions paid by the Company to shareholders, and (iii) during any fiscal quarter occurring within three years of the date on which CIM funded such amount. The obligation to reimburse CIM for any expense support provided by CIM under such agreement is further conditioned by the following: (i) in the period in which reimbursement is sought, the ratio of operating expenses to average net assets, when considering the reimbursement, cannot exceed the ratio of operating expenses to average net assets, as defined, for the period when the expense support was provided; (ii) in the period when reimbursement is sought, the annualized distribution rate cannot fall below the annualized distribution rate for the period when the expense support was provided; and (iii) the expense support can only be reimbursed within three years from the date the expense support was provided.
Expense support, if any, will be determined as appropriate to meet the objectives of the expense support and conditional reimbursement agreement. For the three months ended March 31, 2021 and 2020 and the year ended December 31, 2020, the Company did not receive any expense support from CIM. See Note 5 for additional information on the sources of the Company’s distributions. The Company did not record any obligation to repay expense support from CIM and the Company did not repay any expense support to CIM during the three months ended March 31, 2021 and 2020 and the year ended December 31, 2020. The Company may or may not be requested to reimburse any expense support provided in the future.
The Company or CIM may terminate the expense support and conditional reimbursement agreement at any time. CIM has indicated that it expects to continue such expense support to ensure that the Company bears a reasonable level of expenses in relation to its income. If the Company terminates the investment advisory agreement with CIM, the Company may be required to repay all unreimbursed expense support funded by CIM within three years of the date of termination. There will be no acceleration or increase of such repayment obligation at termination of the investment advisory agreement with CIM. The specific amount of expense support provided by CIM, if any, will be determined at the end of each quarter. There can be no assurance that the expense support and conditional reimbursement agreement will remain in effect or that CIM will support any portion of the Company’s expenses in future quarters.
34
CĪON Investment Corporation
Notes to Consolidated Financial Statements (unaudited)
March 31, 2021
(in thousands, except share and per share amounts)
As of March 31, 2021 and December 31, 2020, the total liability payable to CIM and its affiliates was $8,237 and $13,275, respectively, which primarily related to fees earned by CIM during the three months ended March 31, 2021 and December 31, 2020, respectively.
In the event that CIM undertakes to provide investment advisory services to other clients in the future, it will strive to allocate investment opportunities in a fair and equitable manner consistent with the Company’s investment objective and strategies so that the Company will not be disadvantaged in relation to any other client of the investment adviser or its senior management team. However, it is currently possible that some investment opportunities will be provided to other clients of CIM rather than to the Company.
Indemnifications
The investment advisory agreement, the administration agreement and the dealer manager agreement with CIM and CION Securities, LLC (formerly, ICON Securities, LLC), or CION Securities, each provide certain indemnifications from the Company to the other relevant parties to such agreements. The Company’s maximum exposure under these agreements is unknown. However, the Company has not experienced claims or losses pursuant to these agreements and believes the risk of loss related to such indemnifications to be remote.
Note 5. Distributions
From February 1, 2014 through July 17, 2017, the Company’s board of directors authorized and declared on a monthly basis a weekly distribution amount per share of common stock. On July 18, 2017, the Company's board of directors authorized and declared on a quarterly basis a weekly distribution amount per share of common stock. Effective September 28, 2017, the Company's board of directors delegated to management the authority to determine the amount, record dates, payment dates and other terms of distributions to shareholders, which will be ratified by the board of directors, each on a quarterly basis. Beginning on March 19, 2020, management changed the timing of declaring distributions from quarterly to monthly and temporarily suspended the payment of distributions to shareholders commencing with the month ended April 30, 2020, whether in cash or pursuant to the Company's distribution reinvestment plan, as amended and restated. On July 15, 2020, the board of directors determined to recommence the payment of distributions to shareholders in August 2020. Distributions in respect of future months will be evaluated by management and the board of directors based on circumstances and expectations existing at the time of consideration. Declared distributions are paid monthly.
The Company’s board of directors declared or ratified distributions for 19 and 3 record dates during the year ended December 31, 2020 and the three months ended March 31, 2021, respectively.
The following table presents cash distributions per share that were declared during the year ended December 31, 2020 and the three months ended March 31, 2021:
| Distributions | ||||||||||||||
| Three Months Ended | Per Share | Amount | ||||||||||||
| 2020 | ||||||||||||||
| March 31, 2020 (thirteen record dates) | $ | 0.1829 | $ | 20,793 | ||||||||||
| June 30, 2020 (no record dates) | — | — | ||||||||||||
| September 30, 2020 (two record dates) | 0.0883 | 10,011 | ||||||||||||
| December 31, 2020 (four record dates) | 0.2842 | 32,479 | ||||||||||||
| Total distributions for the year ended December 31, 2020 | $ | 0.5554 | $ | 63,283 | ||||||||||
| 2021 | ||||||||||||||
| March 31, 2021 (three record dates) | $ | 0.1324 | $ | 15,029 | ||||||||||
| Total distributions for the three months ended March 31, 2021 | $ | 0.1324 | $ | 15,029 | ||||||||||
On March 16, 2021, the Company's co-chief executive officers declared regular monthly cash distributions of $0.04413 per share for April 2021. The distributions were paid on April 28, 2021 to shareholders of record as of April 27, 2021. Shareholders who previously elected to receive distributions in additional shares of the Company common stock pursuant to the Company’s distribution reinvestment plan were issued additional shares for the April 2021 distributions on April 28, 2021.
On April 15, 2021, the Company's co-chief executive officers declared regular monthly cash distributions of $0.04413 per share for May 2021. The distributions will be paid on May 26, 2021 to shareholders of record as of May 25, 2021. Shareholders who previously elected to receive distributions in additional shares of the Company common stock pursuant to the Company’s distribution reinvestment plan will be issued additional shares for the May 2021 distributions on May 26, 2021.
35
CĪON Investment Corporation
Notes to Consolidated Financial Statements (unaudited)
March 31, 2021
(in thousands, except share and per share amounts)
The Company has adopted an “opt in” distribution reinvestment plan for shareholders. As a result, if the Company makes a distribution, shareholders will receive distributions in cash unless they specifically “opt in” to the fifth amended and restated distribution reinvestment plan so as to have their cash distributions reinvested in additional shares of the Company’s common stock.
On December 8, 2016, the Company amended and restated its distribution reinvestment plan pursuant to the fifth amended and restated distribution reinvestment plan, or the Fifth Amended DRIP. The Fifth Amended DRIP became effective as of, and first applied to the reinvestment of cash distributions paid on, February 1, 2017. Under the Fifth Amended DRIP, cash distributions to participating shareholders will be reinvested in additional shares of common stock at a purchase price equal to the estimated net asset value per share of common stock as of the date of issuance.
The Company may fund its cash distributions to shareholders from any sources of funds available to the Company, including borrowings, net investment income from operations, capital gains proceeds from the sale of assets, non-capital gains proceeds from the sale of assets, dividends or other distributions paid to it on account of preferred and common equity investments in portfolio companies and expense support from CIM, which is subject to repayment by the Company within three years. The Company has not established limits on the amount of funds it may use from available sources to make distributions. For the three months ended March 31, 2021 and 2020 and the year ended December 31, 2020, none of the Company's distributions resulted from expense support from CIM. The purpose of this arrangement is to avoid such distributions being characterized as a return of capital. Shareholders should understand that any such distributions are not based on the Company’s investment performance, and can only be sustained if the Company maintains positive investment performance in future periods and/or CIM provides such expense support. Shareholders should also understand that the Company’s future repayments of expense support will reduce the distributions that they would otherwise receive. There can be no assurances that the Company will maintain such performance in order to sustain these distributions or be able to pay distributions at all. CIM has no obligation to provide expense support to the Company in future periods.
The following table reflects the sources of cash distributions on a GAAP basis that the Company has declared on its shares of common stock during the three months ended March 31, 2021 and 2020 and the year ended December 31, 2020:
| Three Months Ended March 31, | Year Ended December 31, | |||||||||||||||||||||||||||||||||||||||||||||||||||||||
| 2021 | 2020 | 2020 | ||||||||||||||||||||||||||||||||||||||||||||||||||||||
| Source of Distribution | Per Share | Amount | Percentage | Per Share | Amount | Percentage | Per Share | Amount | Percentage | |||||||||||||||||||||||||||||||||||||||||||||||
| Net investment income | $ | 0.1324 | $ | 15,029 | 100.0 | % | $ | 0.1829 | $ | 20,793 | 100.0 | % | $ | 0.5554 | $ | 63,283 | 100.0 | % | ||||||||||||||||||||||||||||||||||||||
| Total distributions | $ | 0.1324 | $ | 15,029 | 100.0 | % | $ | 0.1829 | $ | 20,793 | 100.0 | % | $ | 0.5554 | $ | 63,283 | 100.0 | % | ||||||||||||||||||||||||||||||||||||||
It is the Company's policy to comply with all requirements of the Code applicable to RICs and to distribute at least 90% of its taxable income to its shareholders. In addition, by distributing during each calendar year at least 90% of its “investment company taxable income”, which is generally equal to the sum of the Company’s net ordinary income plus the excess, if any, of realized net short-term capital gains over realized net long-term capital losses, the Company intends not to be subject to corporate level federal income tax. Accordingly, no federal income tax provision was required for the year ended December 31, 2020. The Company will also be subject to nondeductible federal excise taxes if the Company does not distribute at least 98.0% of net ordinary income, 98.2% of capital gains, if any, and any recognized and undistributed income from prior years for which it paid no federal income taxes.
Income and capital gain distributions are determined in accordance with the Code and federal tax regulations, which may differ from amounts determined in accordance with GAAP. These book/tax differences, which could be material, are primarily due to differing treatments of income and gains on various investments held by the Company. Permanent book/tax differences result in reclassifications to capital in excess of par value, accumulated undistributed net investment income and accumulated undistributed realized gain on investments.
The determination of the tax attributes of the Company’s distributions is made annually as of the end of the Company’s fiscal year based upon the Company’s taxable income for the full year and distributions paid for the full year. The tax characteristics of distributions to shareholders are reported to shareholders annually on Form 1099-DIV. All distributions for 2020 were characterized as ordinary income distributions for federal income tax purposes.
36
CĪON Investment Corporation
Notes to Consolidated Financial Statements (unaudited)
March 31, 2021
(in thousands, except share and per share amounts)
The tax components of accumulated earnings for the current year will be determined at year end. As of December 31, 2020, the components of accumulated losses on a tax basis were as follows:
| December 31, 2020 | |||||
| Undistributed ordinary income | $ | 5,950 | |||
| Other accumulated losses | (1,793) | ||||
| Net unrealized depreciation on investments and total return swap | (161,664) | ||||
| Total accumulated losses | $ | (157,507) | |||
As of March 31, 2021, the aggregate gross unrealized appreciation for all securities in which there was an excess of value over tax cost was $44,443; the aggregate gross unrealized depreciation for all securities in which there was an excess of tax cost over value was $169,819; the net unrealized depreciation was $125,376; and the aggregate cost of securities for Federal income tax purposes was $1,747,017.
As of December 31, 2020, the aggregate gross unrealized appreciation for all securities in which there was an excess of value over tax cost was $31,815; the aggregate gross unrealized depreciation for all securities in which there was an excess of tax cost over value was $193,479; the net unrealized depreciation was $161,664; and the aggregate cost of securities for Federal income tax purposes was $1,731,035.
Note 6. Investments
The composition of the Company’s investment portfolio as of March 31, 2021 and December 31, 2020 at amortized cost and fair value was as follows:
| March 31, 2021 | December 31, 2020 | |||||||||||||||||||||||||||||||||||||
| Cost(1) | Fair Value | Percentage of Investment Portfolio | Cost(1) | Fair Value | Percentage of Investment Portfolio | |||||||||||||||||||||||||||||||||
| Senior secured first lien debt | $ | 1,283,804 | $ | 1,255,426 | 81.8 | % | $ | 1,266,564 | $ | 1,223,268 | 81.8 | % | ||||||||||||||||||||||||||
| Senior secured second lien debt | 172,670 | 154,626 | 10.1 | % | 171,480 | 151,506 | 10.1 | % | ||||||||||||||||||||||||||||||
| Collateralized securities and structured products - equity | 15,152 | 13,840 | 0.9 | % | 15,305 | 12,131 | 0.8 | % | ||||||||||||||||||||||||||||||
| Unsecured debt | 5,671 | 5,493 | 0.4 | % | 5,668 | 5,464 | 0.4 | % | ||||||||||||||||||||||||||||||
| Equity | 102,389 | 104,663 | 6.8 | % | 118,638 | 103,405 | 6.9 | % | ||||||||||||||||||||||||||||||
| Subtotal/total percentage | 1,579,686 | 1,534,048 | 100.0 | % | 1,577,655 | 1,495,774 | 100.0 | % | ||||||||||||||||||||||||||||||
| Short term investments(2) | 87,593 | 87,593 | 73,597 | 73,597 | ||||||||||||||||||||||||||||||||||
| Total investments | $ | 1,667,279 | $ | 1,621,641 | $ | 1,651,252 | $ | 1,569,371 | ||||||||||||||||||||||||||||||
(1)Cost represents the original cost adjusted for the amortization of premiums and/or accretion of discounts, as applicable, for debt investments and cost for equity investments.
(2)Short term investments represent an investment in a fund that invests in highly liquid investments with average original maturity dates of three months or less.
37
CĪON Investment Corporation
Notes to Consolidated Financial Statements (unaudited)
March 31, 2021
(in thousands, except share and per share amounts)
The following tables show the composition of the Company’s investment portfolio by industry classification and geographic dispersion, and the percentage, by fair value, of the total investment portfolio assets in such industries and geographies as of March 31, 2021 and December 31, 2020:
| March 31, 2021 | December 31, 2020 | |||||||||||||||||||||||||
| Industry Classification | Investments at Fair Value | Percentage of Investment Portfolio | Investments at Fair Value | Percentage of Investment Portfolio | ||||||||||||||||||||||
| Healthcare & Pharmaceuticals | $ | 287,329 | 18.7 | % | $ | 298,944 | 19.9 | % | ||||||||||||||||||
| Services: Business | 212,278 | 13.8 | % | 211,572 | 14.0 | % | ||||||||||||||||||||
| Chemicals, Plastics & Rubber | 124,555 | 8.1 | % | 141,654 | 9.5 | % | ||||||||||||||||||||
| Media: Diversified & Production | 113,208 | 7.4 | % | 108,078 | 7.2 | % | ||||||||||||||||||||
| Media: Advertising, Printing & Publishing | 108,664 | 7.1 | % | 110,083 | 7.4 | % | ||||||||||||||||||||
| Services: Consumer | 97,966 | 6.4 | % | 85,254 | 5.7 | % | ||||||||||||||||||||
| Beverage, Food & Tobacco | 83,083 | 5.4 | % | 69,975 | 4.7 | % | ||||||||||||||||||||
| High Tech Industries | 71,486 | 4.7 | % | 55,619 | 3.7 | % | ||||||||||||||||||||
| Capital Equipment | 65,871 | 4.3 | % | 65,752 | 4.4 | % | ||||||||||||||||||||
| Banking, Finance, Insurance & Real Estate | 51,349 | 3.3 | % | 41,211 | 2.8 | % | ||||||||||||||||||||
| Telecommunications | 46,284 | 3.0 | % | 46,638 | 3.1 | % | ||||||||||||||||||||
| Energy: Oil & Gas | 41,328 | 2.7 | % | 28,136 | 1.9 | % | ||||||||||||||||||||
| Aerospace & Defense | 36,513 | 2.4 | % | 35,751 | 2.4 | % | ||||||||||||||||||||
| Construction & Building | 34,626 | 2.3 | % | 34,653 | 2.3 | % | ||||||||||||||||||||
| Hotel, Gaming & Leisure | 31,428 | 2.0 | % | 21,920 | 1.5 | % | ||||||||||||||||||||
| Retail | 28,751 | 1.9 | % | 29,312 | 2.0 | % | ||||||||||||||||||||
| Diversified Financials | 24,697 | 1.6 | % | 37,214 | 2.5 | % | ||||||||||||||||||||
| Forest Products & Paper | 21,717 | 1.4 | % | 21,686 | 1.4 | % | ||||||||||||||||||||
| Transportation: Cargo | 18,821 | 1.2 | % | 19,001 | 1.3 | % | ||||||||||||||||||||
| Consumer Goods: Non-Durable | 16,202 | 1.1 | % | 15,757 | 1.1 | % | ||||||||||||||||||||
| Metals & Mining | 10,033 | 0.7 | % | 10,147 | 0.7 | % | ||||||||||||||||||||
| Consumer Goods: Durable | 7,859 | 0.5 | % | 7,417 | 0.5 | % | ||||||||||||||||||||
| Subtotal/total percentage | 1,534,048 | 100.0 | % | 1,495,774 | 100.0 | % | ||||||||||||||||||||
| Short term investments | 87,593 | 73,597 | ||||||||||||||||||||||||
| Total investments | $ | 1,621,641 | $ | 1,569,371 | ||||||||||||||||||||||
38
CĪON Investment Corporation
Notes to Consolidated Financial Statements (unaudited)
March 31, 2021
(in thousands, except share and per share amounts)
| March 31, 2021 | December 31, 2020 | |||||||||||||||||||||||||
| Geographic Dispersion(1) | Investments at Fair Value | Percentage of Investment Portfolio | Investments at Fair Value | Percentage of Investment Portfolio | ||||||||||||||||||||||
| United States | $ | 1,483,733 | 96.7 | % | $ | 1,446,950 | 96.8 | % | ||||||||||||||||||
| Canada | 15,509 | 1.0 | % | 14,775 | 1.0 | % | ||||||||||||||||||||
| Cayman Islands | 13,840 | 0.9 | % | 12,131 | 0.8 | % | ||||||||||||||||||||
| Luxembourg | 9,795 | 0.7 | % | 10,034 | 0.7 | % | ||||||||||||||||||||
| Netherlands | 7,346 | 0.5 | % | 7,651 | 0.5 | % | ||||||||||||||||||||
| Cyprus | 3,149 | 0.2 | % | 3,557 | 0.2 | % | ||||||||||||||||||||
| Bermuda | 676 | — | 676 | — | ||||||||||||||||||||||
| Subtotal/total percentage | 1,534,048 | 100.0 | % | 1,495,774 | 100.0 | % | ||||||||||||||||||||
| Short term investments | 87,593 | 73,597 | ||||||||||||||||||||||||
| Total investments | $ | 1,621,641 | $ | 1,569,371 | ||||||||||||||||||||||
(1)The geographic dispersion is determined by the portfolio company's country of domicile.
As of March 31, 2021 and December 31, 2020, investments on non-accrual status represented 0.5% and 0.5%, respectively, of the Company's investment portfolio on a fair value basis.
The Company’s investment portfolio may contain senior secured investments that are in the form of lines of credit, delayed draw term loans, revolving credit facilities, or unfunded commitments, which may require the Company to provide funding when requested in accordance with the terms of the underlying agreements. As of March 31, 2021 and December 31, 2020, the Company’s unfunded commitments amounted to $75,738 and $43,130, respectively. As of May 10, 2021, the Company’s unfunded commitments amounted to $79,985. Since these commitments may expire without being drawn upon, unfunded commitments do not necessarily represent future cash requirements or future earning assets for the Company. Refer to Note 11 for further details on the Company’s unfunded commitments.
Note 7. CION SOF
CION SOF was organized on May 21, 2019 as a Delaware limited liability company, and commenced operations on October 2, 2019 when the Company and BCP Special Opportunities Fund I, LP, or BCP, entered into the limited liability company agreement of CION SOF for purposes of establishing the manner in which the parties would invest in and co-manage CION SOF. CION SOF invested primarily in senior secured loans of U.S. middle-market companies. The Company and BCP contributed a portfolio of loans to CION SOF representing membership equity of $31,289 and $4,470, respectively, in exchange for 87.5% and 12.5% of the membership interests of CION SOF, respectively.
In December 2020, the Company and BCP elected to wind-down the operations of CION SOF. On January 28, 2021, CION SOF sold all of its remaining debt and equity investments to the Company. On March 18, 2021, CION SOF declared final cash distributions and on March 19, 2021, distributed all remaining capital to the Company and BCP.
The Company and BCP were not required to make any additional capital contributions to CION SOF. The Company’s equity investment in CION SOF was not redeemable. All portfolio and other material decisions regarding CION SOF required approval of its board of managers, which was comprised of four members, two of whom were selected by the Company and the other two were selected by BCP. Further, all portfolio and other material decisions required the affirmative vote of at least one board member from the Company and one board member from BCP.
The Company also served as administrative agent to CION SOF to provide loan servicing functions and other administrative services. In certain cases, these loan servicing functions and other administrative services were performed by CIM.
On October 2, 2019, CION SOF entered into a senior secured credit facility with MS, or the SOF Credit Facility, for borrowings of up to a maximum amount of $75,000. Advances under the SOF Credit Facility were available through October 2, 2022 and bore interest at a floating rate equal to the three-month LIBOR, plus a spread of (i) 3.0% per year through October 1, 2022 and (i) 3.5% per year thereafter through October 2, 2024. CION SOF's obligations to MS under the SOF Credit Facility were secured by a first priority security interest in all of the assets of CION SOF. The obligations of CION SOF under the SOF Credit Facility were non-recourse to the Company. On October 2, 2019, CION SOF drew down $64,702 of borrowings under the SOF Credit Facility. On December 14, 2020, CION SOF repaid to MS all amounts outstanding under the SOF Credit Facility.
For the three months ended March 31, 2020 and the year ended December 31, 2020, the Company recorded dividend income from its equity interest in CION SOF of $1,412 and $3,518, respectively. The Company did not record any dividend income from its equity interest in CION SOF for the three months ended March 31, 2021.
39
CĪON Investment Corporation
Notes to Consolidated Financial Statements (unaudited)
March 31, 2021
(in thousands, except share and per share amounts)
In accordance with ASU 2015-02, Consolidation, the Company determined that CION SOF was a variable interest entity, or VIE. However, the Company was not the primary beneficiary and therefore did not consolidate CION SOF. The Company's maximum exposure to losses from CION SOF was limited to its equity contribution to CION SOF.
The following table sets forth the individual investments in CION SOF's portfolio as of December 31, 2020:
| Portfolio Company | Index Rate(a) | Industry | Principal/ Par Amount/ Units | Cost(b) | Fair Value | |||||||||||||||||||||||||||
| Senior Secured First Lien Debt | ||||||||||||||||||||||||||||||||
| Alert 360 Opco, Inc., L+600, 1.00% LIBOR Floor, 10/16/2025 | 1 Month LIBOR | Services: Consumer | $ | 2,501 | $ | 2,501 | $ | 2,501 | ||||||||||||||||||||||||
| Total Senior Secured First Lien Debt | 2,501 | 2,501 | ||||||||||||||||||||||||||||||
| Equity | ||||||||||||||||||||||||||||||||
Alert 360 Topco, Inc., Common Stock | Services: Consumer | 119,445 Units | 741 | 741 | ||||||||||||||||||||||||||||
| Total Equity | 741 | 741 | ||||||||||||||||||||||||||||||
| Short Term Investments(c) | ||||||||||||||||||||||||||||||||
| First American Treasury Obligations Fund, Class Z Shares, 0.03%(d) | 10,591 | 10,591 | ||||||||||||||||||||||||||||||
| Total Short Term Investments | 10,591 | 10,591 | ||||||||||||||||||||||||||||||
| TOTAL INVESTMENTS | $ | 13,833 | $ | 13,833 | ||||||||||||||||||||||||||||
a.The 1 month LIBOR rate was 0.14% as of December 31, 2020. The actual LIBOR rate for the loan listed may not be the applicable LIBOR rate as of December 31, 2020, as the loan may have been priced or repriced based on a LIBOR rate prior to or subsequent to December 31, 2020.
b.Represents amortized cost for debt securities and cost for equity investments.
c.Short term investments represent an investment in a fund that invests in highly liquid investments with average original maturity dates of three months or less.
d.7-day effective yield as of December 31, 2020.
The following table includes selected balance sheet information for CION SOF as of December 31, 2020:
| Selected Balance Sheet Information: | December 31, 2020 | |||||||
| Investments, at fair value (amortized cost of $13,833) | $ | 13,833 | ||||||
| Cash and other assets | 41 | |||||||
| Interest receivable on investments | 454 | |||||||
| Total assets | $ | 14,328 | ||||||
| Other liabilities | $ | 75 | ||||||
| Total liabilities | 75 | |||||||
| Members' capital | 14,253 | |||||||
| Total liabilities and members' capital | $ | 14,328 | ||||||
The following table includes selected statement of operations information for CION SOF for the three months ended March 31, 2021 and 2020 and the year ended December 31, 2020:
| Three Months Ended March 31, | Year Ended December 31, | ||||||||||||||||
| Selected Statement of Operations Information: | 2021 | 2020 | 2020 | ||||||||||||||
| Total revenues | $ | 29 | $ | 2,589 | $ | 7,874 | |||||||||||
| Total expenses | 29 | 942 | 3,934 | ||||||||||||||
| Net realized loss on investments | — | — | (3,427) | ||||||||||||||
| Net change in unrealized (depreciation) appreciation on investments | — | (4,107) | 28 | ||||||||||||||
| Net (decrease) increase in net assets | $ | — | $ | (2,460) | $ | 541 | |||||||||||
40
CĪON Investment Corporation
Notes to Consolidated Financial Statements (unaudited)
March 31, 2021
(in thousands, except share and per share amounts)
Note 8. Financing Arrangements
The following table presents summary information with respect to the Company’s outstanding financing arrangements as of March 31, 2021:
| Financing Arrangement | Type of Financing Arrangement | Rate | Amount Outstanding | Amount Available | Maturity Date | |||||||||||||||||||||||||||
| JPM Credit Facility | Term Loan Credit Facility | L+3.10% | $ | 500,000 | $ | 75,000 | May 15, 2024 | |||||||||||||||||||||||||
| 2026 Notes(1) | Note Purchase Agreement | 4.50% | 125,000 | — | February 11, 2026 | |||||||||||||||||||||||||||
| UBS Facility | Repurchase Agreement | L+3.375% | 100,000 | 50,000 | November 19, 2023 | |||||||||||||||||||||||||||
| $ | 725,000 | $ | 125,000 | |||||||||||||||||||||||||||||
(1)As of March 31, 2021, the fair value of the 2026 Notes was $125,000, which was based on a yield analysis and discount rate commensurate with the market yields for similar types of debt. The fair value of these debt obligations would be categorized as Level 3 under ASC 820 as of March 31, 2021.
JPM Credit Facility
On August 26, 2016, 34th Street entered into a senior secured credit facility with JPM. The senior secured credit facility with JPM, or the JPM Credit Facility, provided for borrowings in an aggregate principal amount of $150,000, of which $25,000 could have been funded as a revolving credit facility, each subject to conditions described in the JPM Credit Facility. On August 26, 2016, 34th Street drew down $57,000 of borrowings under the JPM Credit Facility. On August 21, 2018, 34th Street drew down $25,577 of additional borrowings under the Amended JPM Credit Facility (as defined below).
On September 30, 2016, July 11, 2017, November 28, 2017 and May 23, 2018, 34th Street amended and restated the JPM Credit Facility, or the Amended JPM Credit Facility, with JPM. Under the Amended JPM Credit Facility entered into on September 30, 2016, the aggregate principal amount available for borrowings was increased from $150,000 to $225,000, of which $25,000 could have been funded as a revolving credit facility, subject to conditions described in the Amended JPM Credit Facility. On September 30, 2016, 34th Street drew down $167,423 of additional borrowings under the Amended JPM Credit Facility, a portion of which was used to purchase the portfolio of loans from Credit Suisse Park View BDC, Inc. Under the Amended JPM Credit Facility entered into on July 11, 2017 and November 28, 2017, certain immaterial administrative amendments were made as a result of the termination of AIM as the Company's investment sub-adviser as discussed in Note 1. Under the Amended JPM Credit Facility entered into on May 23, 2018, (i) the aggregate principal amount available for borrowings was increased from $225,000 to $275,000, of which $25,000 may be funded as a revolving credit facility, subject to conditions described in the Amended JPM Credit Facility, (ii) the reinvestment period was extended until August 24, 2020 and (iii) the maturity date was extended to August 24, 2021.
On May 15, 2020, 34th Street amended and restated the Amended JPM Credit Facility, or the Second Amended JPM Credit Facility, with JPM in order to fully repay all amounts outstanding under the Citibank Credit Facility and the MS Credit Facility and repay $100,000 of advances outstanding under the UBS Facility (as described below). Under the Second Amended JPM Credit Facility, the aggregate principal amount available for borrowings was increased from $275,000 to $700,000, of which $75,000 may be funded as a revolving credit facility, subject to conditions described in the Second Amended JPM Credit Facility, during the reinvestment period. Under the Second Amended JPM Credit Facility, the reinvestment period was extended until May 15, 2022 and the maturity date was extended to May 15, 2023. Advances under the Second Amended JPM Credit Facility bore interest at a floating rate equal to the three-month LIBOR, plus a spread of 3.25% per year. On May 15, 2020 and May 19, 2020, 34th Street drew down $358,878 and $100,000 of borrowings under the Second Amended JPM Credit Facility, respectively. On May 15, 2020, May 22, 2020, June 12, 2020, June 19, 2020, June 29, 2020, July 6, 2020 and August 14, 2020, 34th Street repaid $13,843, $15,000, $5,000, $18,000, $11,000, $13,500 and $7,535 of borrowings under the Second Amended JPM Credit Facility, respectively.
On February 26, 2021, 34th Street amended and restated the Second Amended JPM Credit Facility, or the Third Amended JPM Credit Facility, with JPM. Under the Third Amended JPM Credit Facility, the aggregate principal amount available for borrowings was reduced from $700,000 to $575,000, subject to conditions described in the Third Amended JPM Credit Facility. In addition, under the Third Amended JPM Credit Facility, the reinvestment period was extended from May 15, 2022 to May 15, 2023 and the maturity date was extended from May 15, 2023 to May 15, 2024. Advances under the Third Amended JPM Credit Facility bear interest at a floating rate equal to the three-month LIBOR, plus a spread of 3.10% per year, which was reduced from a spread of 3.25% per year. 34th Street incurred certain customary costs and expenses in connection with the Third Amended JPM Credit Facility. No other material terms of the Second JPM Credit Facility were revised in connection with the Third Amended JPM Credit Facility. On February 17, 2021, 34th Street repaid $125,000 of borrowings under the Third Amended JPM Credit Facility.
Interest is payable quarterly in arrears. 34th Street may prepay advances pursuant to the terms and conditions of the Third Amended JPM Credit Facility, subject to a 1% premium in certain circumstances. In addition, 34th Street will be subject to a non-usage fee of 1.0% per year on the amount, if any, of the aggregate principal amount available under the Third Amended JPM Credit Facility that has not been borrowed through May 14, 2023. The non-usage fees, if any, are payable quarterly in arrears.
41
CĪON Investment Corporation
Notes to Consolidated Financial Statements (unaudited)
March 31, 2021
(in thousands, except share and per share amounts)
As of March 31, 2021 and December 31, 2020, the principal amount outstanding on the Third Amended JPM Credit Facility and the Second Amended JPM Credit Facility, respectively, was $500,000 and $625,000, respectively.
The Company contributed loans and other corporate debt securities to 34th Street in exchange for 100% of the membership interests of 34th Street, and may contribute additional loans and other corporate debt securities to 34th Street in the future. 34th Street’s obligations to JPM under the Third Amended JPM Credit Facility are secured by a first priority security interest in all of the assets of 34th Street. The obligations of 34th Street under the Third Amended JPM Credit Facility are non-recourse to the Company, and the Company’s exposure under the Third Amended JPM Credit Facility is limited to the value of the Company’s investment in 34th Street.
In connection with the Third Amended JPM Credit Facility, 34th Street has made certain representations and warranties and is required to comply with a borrowing base requirement, various covenants, reporting requirements and other customary requirements for similar facilities. As of and for the three months ended March 31, 2021, 34th Street was in compliance with all covenants and reporting requirements.
Through March 31, 2021, the Company incurred debt issuance costs of $11,402 in connection with obtaining and amending the JPM Credit Facility, which were recorded as a direct reduction to the outstanding balance of the Third Amended JPM Credit Facility, which is included in the Company’s consolidated balance sheet as of March 31, 2021 and will amortize to interest expense over the term of the Third Amended JPM Credit Facility. At March 31, 2021, the unamortized portion of the debt issuance costs was $6,092.
For the three months ended March 31, 2021 and 2020 and the year ended December 31, 2020, the components of interest expense, average borrowings, and weighted average interest rate for the Third Amended JPM Credit Facility and the Second Amended JPM Credit Facility, as applicable, were as follows:
| Three Months Ended March 31, | Year Ended December 31, | |||||||||||||||||||
| 2021 | 2020 | 2020 | ||||||||||||||||||
| Stated interest expense | $ | 4,818 | $ | 3,036 | $ | 19,069 | ||||||||||||||
| Amortization of deferred financing costs | 677 | 152 | 1,582 | |||||||||||||||||
| Non-usage fee | 219 | 63 | 509 | |||||||||||||||||
| Total interest expense | $ | 5,714 | $ | 3,251 | $ | 21,160 | ||||||||||||||
| Weighted average interest rate(1) | 3.56 | % | 4.90 | % | 3.90 | % | ||||||||||||||
| Average borrowings | $ | 565,278 | $ | 250,000 | $ | 493,122 | ||||||||||||||
(1)Includes the stated interest expense and non-usage fee, if any, on the unused portion of the Third Amended JPM Credit Facility and is annualized for periods covering less than one year.
2026 Notes
On February 11, 2021, the Company entered into a Note Purchase Agreement with certain purchasers, or the Note Purchase Agreement, in connection with the Company’s issuance of $125,000 aggregate principal amount of its 4.50% senior unsecured notes due in 2026, or the 2026 Notes. The net proceeds to the Company were approximately $122,300, after the deduction of placement agent fees and other financing expenses, which the Company used to repay debt under its secured financing arrangements.
The 2026 Notes mature on February 11, 2026. The 2026 Notes bear interest at a rate of 4.50% per year payable semi-annually on February 11th and August 11th of each year, commencing on August 11, 2021. The Company has the right to, at its option, redeem all or a part that is not less than 10% of the 2026 Notes (i) on or before February 11, 2024, at a redemption price equal to 100% of the principal amount of 2026 Notes to be redeemed plus an applicable “make-whole” amount equal to (x) the discounted value of the remaining scheduled payments with respect to the principal of such 2026 Note that is to be prepaid or becomes due and payable pursuant to the Note Purchase Agreement over (y) the amount of such called principal, plus accrued and unpaid interest, if any, (ii) after February 11, 2024 but on or before February 11, 2025, at a redemption price equal to 102% of the principal amount of the 2026 Notes to be redeemed, plus accrued and unpaid interest, if any, (iii) after February 11, 2025 but on or before August 11, 2025, at a redemption price equal to 101% of the principal amount of the 2026 Notes to be redeemed, plus accrued and unpaid interest, if any, and (iv) after August 11, 2025, at a redemption price equal to 100% of the principal amount of the 2026 Notes to be redeemed, plus accrued and unpaid interest, if any. For any redemptions occurring on or before February 11, 2024, the discounted value portion of the “make whole amount” is calculated by applying a discount rate on the same periodic basis as that on which interest on the 2026 Notes is payable equal to the sum of 0.50% plus the yield to maturity of the most recently issued U.S. Treasury securities having a maturity equal to the remaining average life of the 2026 Notes, or if there are no such U.S. Treasury securities, using such implied yield to maturity determined in accordance with the terms of the Note Purchase Agreement.
42
CĪON Investment Corporation
Notes to Consolidated Financial Statements (unaudited)
March 31, 2021
(in thousands, except share and per share amounts)
The 2026 Notes are general unsecured obligations of the Company that rank pari passu with all existing and future unsecured unsubordinated indebtedness issued by the Company, rank effectively junior to any of the Company’s secured indebtedness (including unsecured indebtedness that the Company later secures) to the extent of the value of the assets securing such indebtedness, and rank structurally junior to all existing and future indebtedness (including trade payables) incurred by certain of the Company’s subsidiaries, financing vehicles or similar facilities.
The Note Purchase Agreement contains other terms and conditions, including, without limitation, affirmative and negative covenants such as (i) information reporting, (ii) maintenance of the Company’s status as a BDC, (iii) minimum shareholders’ equity of 60% of the Company’s net asset value as of the year ended December 31, 2020 plus 50% of the net cash proceeds of the sale of certain equity interests by the Company after February 11, 2021, if any, (iv) a minimum asset coverage ratio of not less than 200%, or 150% if the Company obtains the requisite shareholder approval and the Company's common stock is listed for trading on a national securities exchange, (v) a minimum interest coverage ratio of 1.25 to 1.00 and (vi) an unencumbered asset coverage ratio of 1.25 to 1.00, provided that (a) first lien senior secured loans and cash represent more than 65% of the total value of unencumbered assets used by the Company for purposes of the ratio and (b) equity interests or structured products in the aggregate represent less than 15% of the total value of unencumbered assets used by the Company for purposes of the ratio. As of and for the three months ended March 31, 2021, the Company was in compliance with all reporting requirements.
The Note Purchase Agreement also contains a “most favored lender” provision in favor of the purchasers in respect of any new unsecured credit facilities, loans or indebtedness in excess of $25,000 incurred by the Company, which indebtedness contains a financial covenant not contained in, or more restrictive against the Company than those contained, in the Note Purchase Agreement. In addition, the Note Purchase Agreement contains customary events of default with customary cure and notice periods, including, without limitation, nonpayment, incorrect representation in any material respect, breach of covenant, cross-default under other indebtedness or derivative securities of the Company in an outstanding aggregate principal amount of at least $25,000, certain judgments and orders, and certain events of bankruptcy.
As of March 31, 2021, the aggregate principal amount of 2026 Notes outstanding was $125,000.
For the three months ended March 31, 2021, the components of interest expense, average borrowings, and weighted average interest rate for the 2026 Notes were as follows:
| For the Period from February 11, 2021 through March 31, 2021 | ||||||||
| Stated interest expense | $ | 766 | ||||||
| Amortization of deferred financing costs | 72 | |||||||
| Total interest expense | $ | 838 | ||||||
| Weighted average interest rate(1) | 4.50 | % | ||||||
| Average borrowings | $ | 125,000 | ||||||
(1)Includes the stated interest expense on the 2026 Notes and is annualized for periods covering less than one year.
UBS Facility
On May 19, 2017, the Company, through two newly-formed, wholly-owned, special-purpose financing subsidiaries, entered into a financing arrangement with UBS pursuant to which up to $125,000 was made available to the Company.
Pursuant to the financing arrangement, assets in the Company's portfolio may be contributed from time to time to Murray Hill Funding II through Murray Hill Funding, LLC, or Murray Hill Funding, each a newly-formed, wholly-owned, special-purpose financing subsidiary of the Company. On May 19, 2017, the Company contributed assets to Murray Hill Funding II. The assets held by Murray Hill Funding II secure the obligations of Murray Hill Funding II under Class A Notes, or the Notes, issued by Murray Hill Funding II. Pursuant to an Indenture, dated May 19, 2017, between Murray Hill Funding II and U.S. Bank National Association, or U.S. Bank, as trustee, or the Indenture, the aggregate principal amount of Notes that may be issued by Murray Hill Funding II from time to time was $192,308. Murray Hill Funding purchased the Notes issued by Murray Hill Funding II at a purchase price equal to their par value. Murray Hill Funding makes capital contributions to Murray Hill Funding II to, among other things, maintain the value of the portfolio of assets held by Murray Hill Funding II.
Principal on the Notes will be due and payable on the stated maturity date of May 19, 2027. Pursuant to the Indenture, Murray Hill Funding II has made certain representations and warranties and is required to comply with various covenants, reporting requirements and other customary requirements for similar transactions. The Indenture contains events of default customary for similar transactions, including, without limitation: (a) the failure to make principal payments on the Notes at their stated maturity or any earlier redemption date or to make interest payments on the Notes and such failure is not cured within three business days; (b) the failure to disburse amounts in accordance with the priority of payments and such failure is not cured within three business days; and (c) the occurrence of certain bankruptcy and insolvency events with respect to Murray Hill Funding II or Murray Hill Funding.
43
CĪON Investment Corporation
Notes to Consolidated Financial Statements (unaudited)
March 31, 2021
(in thousands, except share and per share amounts)
Murray Hill Funding, in turn, entered into a repurchase transaction with UBS, pursuant to the terms of a Global Master Repurchase Agreement and the related Annex and Master Confirmation thereto, each dated May 19, 2017, or collectively, the UBS Facility. Pursuant to the UBS Facility, on May 19, 2017 and June 19, 2017, UBS purchased Notes held by Murray Hill Funding for an aggregate purchase price equal to 65% of the principal amount of Notes purchased. Subject to certain conditions, the maximum principal amount of Notes that may be purchased under the UBS Facility was $192,308. Accordingly, the aggregate maximum amount payable to Murray Hill Funding under the UBS Facility would not exceed $125,000. Murray Hill Funding was required to repurchase the Notes sold to UBS under the UBS Facility by no later than May 19, 2020. The repurchase price paid by Murray Hill Funding to UBS will be equal to the purchase price paid by UBS for the repurchased Notes (giving effect to any reductions resulting from voluntary partial prepayment(s)). The financing fee under the UBS Facility was equal to the three-month LIBOR plus a spread of up to 3.50% per year for the relevant period.
On December 1, 2017, Murray Hill Funding II amended and restated the Indenture, or the Amended Indenture, pursuant to which the aggregate principal amount of Notes that may be issued by Murray Hill Funding II was increased from $192,308 to $266,667. Murray Hill Funding will purchase the Notes to be issued by Murray Hill Funding II from time to time. On December 1, 2017, Murray Hill Funding entered into a First Amended and Restated Master Confirmation to the Global Master Repurchase Agreement, or the Amended Master Confirmation, which sets forth the terms of the repurchase transaction between Murray Hill Funding and UBS under the UBS Facility. As part of the Amended Master Confirmation, on December 15, 2017 and April 2, 2018, UBS purchased the increased aggregate principal amount of Notes held by Murray Hill Funding for an aggregate purchase price equal to 75% of the principal amount of Notes issued. As a result of the Amended Master Confirmation, the aggregate maximum amount payable to Murray Hill Funding and made available to the Company under the UBS Facility was increased from $125,000 to $200,000. No other material terms of the UBS Facility were revised in connection with the amended UBS Facility, or the Amended UBS Facility.
On May 19, 2020, Murray Hill Funding entered into a Second Amended and Restated Master Confirmation to the Global Master Repurchase Agreement, or the Second Amended Master Confirmation, which extended the date that Murray Hill Funding will be required to repurchase the Notes sold to UBS under the Amended UBS Facility from May 19, 2020 to November 19, 2020, and increased the spread on the financing fee from 3.50% to 3.90% per year.
On May 19, 2020, Murray Hill Funding also repurchased Notes in the aggregate principal amount of $133,333 from UBS for an aggregate repurchase price of $100,000, which was then repaid by Murray Hill Funding II. The repurchase of the Notes on May 19, 2020 resulted in a repayment of one-half of the outstanding amount of borrowings under the Amended UBS Facility as of May 19, 2020. As of December 31, 2020, Notes remained outstanding in the aggregate principal amount of $133,333, which was purchased by Murray Hill Funding from Murray Hill Funding II and subsequently sold to UBS under the Amended UBS Facility for aggregate proceeds of $100,000.
On November 12, 2020, Murray Hill Funding entered into a Third Amended and Restated Master Confirmation to the Global Master Repurchase Agreement, or the Third Amended Master Confirmation, to further extend the date that Murray Hill Funding will be required to repurchase the Notes to December 18, 2020.
On December 17, 2020, Murray Hill Funding entered into a Fourth Amended and Restated Master Confirmation to the Global Master Repurchase Agreement, or the Fourth Amended Master Confirmation, which further extended the date that Murray Hill Funding will be required to repurchase the Notes sold to UBS under the Amended UBS Facility from December 18, 2020 to November 19, 2023, and decreased the spread on the financing fee from 3.90% to 3.375% per year. No other material terms of the Amended UBS Facility were revised in connection with the Fourth Amended Master Confirmation.
On December 17, 2020, Murray Hill Funding also entered into a Revolving Credit Note Agreement, or the Revolving Note Agreement, with Murray Hill Funding II, UBS and U.S. Bank, as note agent and trustee, which provides for a revolving credit facility in an aggregate principal amount of $50,000, subject to compliance with a borrowing base. Murray Hill Funding II will issue Class A-R Notes, or the Class A-R Notes, in exchange for advances under the Revolving Note Agreement. Principal on the Class A-R Notes will be due and payable on the stated maturity date of May 19, 2027, which is the same stated maturity date as the Notes.
The Class A-R Notes will be issued pursuant to a Second Amended and Restated Indenture, dated December 17, 2020, between Murray Hill Funding II and U.S. Bank, as trustee, or the Second Amended Indenture. Under the Second Amended Indenture, the aggregate principal amount of Notes and Class A-R Notes that may be issued by Murray Hill Funding II from time to time is $150,000. Murray Hill Funding, in turn, entered into a repurchase transaction with UBS pursuant to the terms of the related Annex and Master Confirmation, dated December 17, 2020, to the Global Master Repurchase Agreement, dated May 19, 2017, related to the Class A-R Notes. Murray Hill Funding is required to repurchase the Class A-R Notes that will be sold to UBS by no later than November 19, 2023. The financing fee for the funded Class A-R Notes is equal to the three-month LIBOR plus a spread of 3.375% per year while the financing fee for the unfunded Class A-R Notes is equal to 0.75% per year.
44
CĪON Investment Corporation
Notes to Consolidated Financial Statements (unaudited)
March 31, 2021
(in thousands, except share and per share amounts)
UBS may require Murray Hill Funding to post cash collateral if, without limitation, the sum of the market value of the portfolio of assets and the cash and eligible investments held by Murray Hill Funding II, together with any posted cash collateral, is less than the required margin amount under the Amended UBS Facility; provided, however, that Murray Hill Funding will not be required to post cash collateral with UBS until such market value has declined at least 10% from the initial market value of the portfolio assets.
The Company has no contractual obligation to post any such cash collateral or to make any payments to UBS on behalf of Murray Hill Funding. The Company may, but is not obligated to, increase its investment in Murray Hill Funding for the purpose of funding any cash collateral or payment obligations for which Murray Hill Funding becomes obligated in connection with the Amended UBS Facility. The Company’s exposure under the Amended UBS Facility is limited to the value of the Company’s investment in Murray Hill Funding.
Pursuant to the Amended UBS Facility, Murray Hill Funding has made certain representations and warranties and is required to comply with a borrowing base requirement, various covenants, reporting requirements and other customary requirements for similar transactions. The Amended UBS Facility contains events of default customary for similar financing transactions, including, without limitation: (a) failure to transfer the Notes to UBS on the applicable purchase date or repurchase the Notes from UBS on the applicable repurchase date; (b) failure to pay certain fees and make-whole amounts when due; (c) failure to post cash collateral as required; (d) the occurrence of insolvency events with respect to Murray Hill Funding; and (e) the admission by Murray Hill Funding of its inability to, or its intention not to, perform any of its obligations under the Amended UBS Facility.
Murray Hill Funding paid an upfront fee and incurred certain other customary costs and expenses totaling $2,637 in connection with obtaining the Amended UBS Facility, which were recorded as a direct reduction to the outstanding balance of the Amended UBS Facility, which is included in the Company’s consolidated balance sheets and amortized to interest expense over the term of the Amended UBS Facility. At March 31, 2021, all upfront fees and other expenses were fully amortized.
As of March 31, 2021, Notes in the aggregate principal amount of $100,000 had been purchased by Murray Hill Funding from Murray Hill Funding II and subsequently sold to UBS under the Amended UBS Facility for aggregate proceeds of $100,000. The carrying amount outstanding under the Amended UBS Facility approximates its fair value. The Company funded each purchase of Notes by Murray Hill Funding through a capital contribution to Murray Hill Funding. As of March 31, 2021, the amount due at maturity under the Amended UBS Facility was $100,000. The Notes issued by Murray Hill Funding II and purchased by Murray Hill Funding eliminate in consolidation on the Company’s consolidated financial statements.
As of March 31, 2021, the fair value of assets held by Murray Hill Funding II was $186,717.
For the three months ended March 31, 2021 and 2020 and the year ended December 31, 2020, the components of interest expense, average borrowings, and weighted average interest rate for the Amended UBS Facility were as follows:
| Three Months Ended March 31, | Year Ended December 31, | |||||||||||||||||||
| 2021 | 2020 | 2020 | ||||||||||||||||||
| Stated interest expense | $ | 902 | $ | 2,703 | $ | 6,732 | ||||||||||||||
| Non-usage fee | 94 | — | 16 | |||||||||||||||||
| Amortization of deferred financing costs | — | 234 | 360 | |||||||||||||||||
| Total interest expense | $ | 996 | $ | 2,937 | $ | 7,108 | ||||||||||||||
| Weighted average interest rate(1) | 3.98 | % | 5.35 | % | 4.81 | % | ||||||||||||||
| Average borrowings | $ | 100,000 | $ | 200,000 | $ | 137,978 | ||||||||||||||
(1)Includes the stated interest expense and non-usage fee, if any, on the unused portion of the Amended UBS Facility and is annualized for periods covering less than one year.
Citibank Credit Facility
On March 29, 2017, Flatiron Funding II entered into a senior secured credit facility with Citibank. The senior secured credit facility with Citibank, or the Citibank Credit Facility, provided for a revolving credit facility in an aggregate principal amount of $325,000, subject to compliance with a borrowing base. On July 11, 2017, Flatiron Funding II amended the Citibank Credit Facility, or the Amended Citibank Credit Facility, with Citibank to make certain immaterial administrative amendments as a result of the termination of AIM as the Company's investment sub-adviser as discussed in Note 1.
On March 14, 2019, Flatiron Funding II further amended the Citibank Credit Facility, or the Second Amended Citibank Credit Facility, with Citibank to (i) increase the aggregate principal amount available for borrowings from $325,000 to $350,000, subject to compliance with a borrowing base, (ii) extend the reinvestment period for two years until March 29, 2021 and (iii) extend the maturity date until March 30, 2022.
45
CĪON Investment Corporation
Notes to Consolidated Financial Statements (unaudited)
March 31, 2021
(in thousands, except share and per share amounts)
As of December 31, 2019, the principal amount outstanding on the Second Amended Citibank Credit Facility was $278,542. On May 15, 2020, Flatiron Funding II repaid all amounts outstanding on the Second Amended Citibank Credit Facility using a portion of the proceeds from the Second Amended JPM Credit Facility (described above).
Advances under the Second Amended Citibank Credit Facility bore interest at a floating rate equal to (1) the higher of (a) the Citibank prime rate, (b) the federal funds rate plus 1.5% or (c) the three-month LIBOR plus 1.0%, plus (2) a spread of 2% per year. In addition, Flatiron Funding II was subject to a non-usage fee of 0.75% per year of the amount of the aggregate principal amount available under the Second Amended Citibank Credit Facility that had not been borrowed. Flatiron Funding II incurred certain customary costs and expenses in connection with obtaining and amending the Citibank Credit Facility.
The Company incurred debt issuance costs of $3,373 in connection with obtaining and amending the Citibank Credit Facility, which were recorded as a direct reduction to the outstanding balance of the Second Amended Citibank Credit Facility, which was included in the Company’s consolidated balance sheets and amortized to interest expense over the term of the Second Amended Citibank Credit Facility. All unamortized debt issuance costs were expensed upon the repayment of all amounts outstanding on the Second Amended Citibank Credit Facility on May 15, 2020.
Flatiron Funding II’s obligations to Citibank under the Second Amended Citibank Credit Facility were secured by a first priority security interest in all of the assets of Flatiron Funding II. The obligations of Flatiron Funding II under the Second Amended Citibank Credit Facility were non-recourse to the Company, and the Company’s exposure under the Second Amended Citibank Credit Facility was limited to the value of the Company’s investment in Flatiron Funding II.
For the three months ended March 31, 2021 and 2020 and the year ended December 31, 2020, the components of interest expense, average borrowings, and weighted average interest rate for the Second Amended Citibank Credit Facility were as follows:
| Three Months Ended March 31, | Year Ended December 31, | |||||||||||||||||||
| 2021 | 2020 | 2020 | ||||||||||||||||||
| Stated interest expense | $ | — | $ | 2,369 | $ | 3,171 | ||||||||||||||
| Non-usage fee | — | 177 | 288 | |||||||||||||||||
| Amortization of deferred financing costs | — | 172 | 1,551 | |||||||||||||||||
| Total interest expense | $ | — | $ | 2,718 | $ | 5,010 | ||||||||||||||
| Weighted average interest rate(1) | — | 3.91 | % | 3.72 | % | |||||||||||||||
| Average borrowings | $ | — | $ | 256,609 | $ | 91,385 | ||||||||||||||
(1)Includes the stated interest expense and non-usage fee, if any, on the unused portion of the Second Amended Citibank Credit Facility and is annualized for periods covering less than one year.
MS Credit Facility
On December 19, 2017, 33rd Street entered into a senior secured credit facility, or the MS Credit Facility, with MS. The MS Credit Facility provided for a revolving credit facility in an aggregate principal amount of up to $200,000, subject to compliance with a borrowing base.
On July 9, 2018, 33rd Street amended and restated the MS Credit Facility to make certain immaterial administrative amendments. 33rd Street further amended and restated the MS Credit Facility, or the Amended MS Credit Facility, with MS on December 18, 2018. Pursuant to the Amended MS Credit Facility, 33rd Street could have prepaid advances pursuant to the terms and conditions of the loan and servicing agreement subject to a 1% premium if the amount of the Amended MS Credit Facility was reduced or terminated on or prior to December 19, 2020.
Pursuant to the terms of the loan and servicing agreement, on March 15, 2019, 33rd Street reduced the aggregate principal amount available for borrowings under the Amended MS Credit Facility from $200,000 to $150,000.
On June 5, 2018, June 12, 2018, June 28, 2018, March 11, 2020 and March 23, 2020, 33rd Street drew down $25,000, $75,000, $50,000, $10,000 and $4,917 of borrowings under the Amended MS Credit Facility, respectively. On May 8, 2019, May 23, 2019, July 29, 2019 and November 6, 2019, 33rd Street repaid $20,000, $5,000, $10,000 and $2,500 of borrowings under the Amended MS Credit Facility, respectively. As of December 31, 2019, the principal amount outstanding on the Amended MS Credit Facility was $112,500. On May 15, 2020, 33rd Street repaid all amounts outstanding on the Amended MS Credit Facility using a portion of the proceeds from the Second Amended JPM Credit Facility.
46
CĪON Investment Corporation
Notes to Consolidated Financial Statements (unaudited)
March 31, 2021
(in thousands, except share and per share amounts)
Advances under the Amended MS Credit Facility were available through December 19, 2020 and bore interest at a floating rate equal to the three-month LIBOR, plus a spread of 3.0% per year through December 19, 2020. All advances under the Amended MS Credit Facility and all accrued and unpaid interest thereunder were due and payable by no later than December 19, 2022. 33rd Street incurred certain customary costs and expenses in connection with obtaining and amending the MS Credit Facility.
33rd Street's obligations to MS under the Amended MS Credit Facility were secured by a first priority security interest in all of the assets of 33rd Street. The obligations of 33rd Street under the Amended MS Credit Facility were non-recourse to the Company, and the Company's exposure under the Amended MS Credit Facility was limited to the value of the Company's investment in 33rd Street. 33rd Street appointed CIM to manage its portfolio.
33rd Street paid an upfront fee and incurred certain other customary costs and expenses totaling $2,591 in connection with obtaining and amending the MS Credit Facility, which the Company initially recorded as prepaid expenses and other assets on the Company’s consolidated balance sheets and amortized to interest expense over the term of the Amended MS Credit Facility. On June 5, 2018, unamortized upfront fees were recorded as a direct reduction to the outstanding balance of the Amended MS Credit Facility in the Company’s consolidated balance sheet. All unamortized debt issuance costs were expensed upon the repayment of all amounts outstanding on the Amended MS Credit Facility on May 15, 2020.
For the three months ended March 31, 2021 and 2020 and the year ended December 31, 2020, the components of interest expense, average borrowings, and weighted average interest rate for the Amended MS Credit Facility were as follows:
| Three Months Ended March 31, | Year Ended December 31, | |||||||||||||||||||
| 2021 | 2020 | 2020 | ||||||||||||||||||
| Stated interest expense | $ | — | $ | 1,362 | $ | 1,928 | ||||||||||||||
| Amortization of deferred financing costs | — | 129 | 1,544 | |||||||||||||||||
| Non-usage fee | — | 67 | 87 | |||||||||||||||||
| Total interest expense | $ | — | $ | 1,558 | $ | 3,559 | ||||||||||||||
| Weighted average interest rate(1) | — | 4.90 | % | 4.50 | % | |||||||||||||||
| Average borrowings | $ | — | $ | 115,294 | $ | 43,984 | ||||||||||||||
(1)Includes the stated interest expense and non-usage fee, if any, on the unused portion of the Amended MS Credit Facility and is annualized for periods covering less than one year.
Note 9. Fair Value of Financial Instruments
The following table presents fair value measurements of the Company’s portfolio investments as of March 31, 2021 and December 31, 2020, according to the fair value hierarchy:
| March 31, 2021(1) | December 31, 2020(2) | ||||||||||||||||||||||||||||||||||||||||||||||
| Level 1 | Level 2 | Level 3 | Total | Level 1 | Level 2 | Level 3 | Total | ||||||||||||||||||||||||||||||||||||||||
| Senior secured first lien debt | $ | — | $ | — | $ | 1,255,426 | $ | 1,255,426 | $ | — | $ | — | $ | 1,223,268 | $ | 1,223,268 | |||||||||||||||||||||||||||||||
| Senior secured second lien debt | — | — | 154,626 | 154,626 | — | — | 151,506 | 151,506 | |||||||||||||||||||||||||||||||||||||||
| Collateralized securities and structured products - equity | — | — | 13,840 | 13,840 | — | — | 12,131 | 12,131 | |||||||||||||||||||||||||||||||||||||||
| Unsecured debt | — | — | 5,493 | 5,493 | — | — | 5,464 | 5,464 | |||||||||||||||||||||||||||||||||||||||
| Equity | 2,397 | — | 91,409 | 93,806 | 2,409 | — | 75,913 | 78,322 | |||||||||||||||||||||||||||||||||||||||
| Short term investments | 87,593 | — | — | 87,593 | 73,597 | — | — | 73,597 | |||||||||||||||||||||||||||||||||||||||
| Total Investments | $ | 89,990 | $ | — | $ | 1,520,794 | $ | 1,610,784 | $ | 76,006 | $ | — | $ | 1,468,282 | $ | 1,544,288 | |||||||||||||||||||||||||||||||
(1)Excludes the Company's $10,857 investment in BCP Great Lakes Fund LP, which was measured at NAV.
(2)Excludes the Company's $12,472 investment in CION SOF and $12,611 investment in BCP Great Lakes Fund LP, which were measured at NAV.
47
CĪON Investment Corporation
Notes to Consolidated Financial Statements (unaudited)
March 31, 2021
(in thousands, except share and per share amounts)
The following tables provide a reconciliation of the beginning and ending balances for investments that use Level 3 inputs for the three months ended March 31, 2021 and 2020:
| Three Months Ended March 31, 2021 | |||||||||||||||||||||||||||||||||||
| Senior Secured First Lien Debt | Senior Secured Second Lien Debt | Collateralized Securities and Structured Products - Equity | Unsecured Debt | Equity | Total | ||||||||||||||||||||||||||||||
| Beginning balance, December 31, 2020 | $ | 1,223,268 | $ | 151,506 | $ | 12,131 | $ | 5,464 | $ | 75,913 | $ | 1,468,282 | |||||||||||||||||||||||
| Investments purchased(2) | 189,026 | 1,027 | — | — | 1,298 | 191,351 | |||||||||||||||||||||||||||||
| Net realized loss | (1,073) | — | — | — | — | (1,073) | |||||||||||||||||||||||||||||
| Net change in unrealized appreciation | 14,918 | 1,930 | 1,862 | 26 | 14,198 | 32,934 | |||||||||||||||||||||||||||||
| Accretion of discount | 3,002 | 167 | — | 3 | — | 3,172 | |||||||||||||||||||||||||||||
| Sales and principal repayments | (173,715) | (4) | (153) | — | — | (173,872) | |||||||||||||||||||||||||||||
| Ending balance, March 31, 2021 | $ | 1,255,426 | $ | 154,626 | $ | 13,840 | $ | 5,493 | $ | 91,409 | $ | 1,520,794 | |||||||||||||||||||||||
| Change in net unrealized appreciation on investments still held as of March 31, 2021(1) | $ | 12,423 | $ | 1,930 | $ | 1,862 | $ | 26 | $ | 14,198 | $ | 30,439 | |||||||||||||||||||||||
(1)Included in net change in unrealized (depreciation) appreciation on investments in the consolidated statements of operations.
(2)Investments purchased includes PIK interest.
| Three Months Ended March 31, 2020 | |||||||||||||||||||||||||||||||||||||||||
| Senior Secured First Lien Debt | Senior Secured Second Lien Debt | Collateralized Securities and Structured Products - Debt | Collateralized Securities and Structured Products - Equity | Unsecured Debt | Equity | Total | |||||||||||||||||||||||||||||||||||
| Beginning balance, December 31, 2019 | $ | 1,351,767 | $ | 248,253 | $ | 7,212 | $ | 14,182 | $ | 4,900 | $ | 56,886 | $ | 1,683,200 | |||||||||||||||||||||||||||
| Investments purchased | 177,154 | 354 | — | — | — | 611 | 178,119 | ||||||||||||||||||||||||||||||||||
| Net realized (gain) loss | (4,195) | 1 | — | — | — | — | (4,194) | ||||||||||||||||||||||||||||||||||
| Net change in unrealized depreciation | (85,030) | (17,215) | — | (3,020) | (104) | (11,042) | (116,411) | ||||||||||||||||||||||||||||||||||
| Accretion of discount | 4,689 | 488 | — | — | 4 | — | 5,181 | ||||||||||||||||||||||||||||||||||
| Sales and principal repayments | (170,060) | (30,716) | (7,212) | (190) | — | — | (208,178) | ||||||||||||||||||||||||||||||||||
| Ending balance, March 31, 2020 | $ | 1,274,325 | $ | 201,165 | $ | — | $ | 10,972 | $ | 4,800 | $ | 46,455 | $ | 1,537,717 | |||||||||||||||||||||||||||
| Change in net unrealized depreciation on investments still held as of March 31, 2020(1) | $ | (81,934) | $ | (16,670) | $ | — | $ | (3,020) | $ | (104) | $ | (11,042) | $ | (112,770) | |||||||||||||||||||||||||||
(1)Included in net change in unrealized (depreciation) appreciation on investments in the consolidated statements of operations.
48
CĪON Investment Corporation
Notes to Consolidated Financial Statements (unaudited)
March 31, 2021
(in thousands, except share and per share amounts)
Significant Unobservable Inputs
The valuation techniques and significant unobservable inputs used in recurring Level 3 fair value measurements of investments as of March 31, 2021 and December 31, 2020 were as follows:
| March 31, 2021 | ||||||||||||||||||||||||||||||||||||||||||||
| Fair Value | Valuation Techniques/ Methodologies | Unobservable Inputs | Range | Weighted Average(1) | ||||||||||||||||||||||||||||||||||||||||
| Senior secured first lien debt | $ | 955,557 | Discounted Cash Flow | Discount Rates | 4.8% | — | 29.0% | 10.3% | ||||||||||||||||||||||||||||||||||||
| 239,724 | Broker Quotes | Broker Quotes | N/A | N/A | ||||||||||||||||||||||||||||||||||||||||
| 25,700 | Market Comparable Approach | Revenue Multiple | 0.16x | — | 1.80x | 1.77x | ||||||||||||||||||||||||||||||||||||||
| 24,238 | EBITDA Multiple | 4.00x | — | 7.50x | 6.18x | |||||||||||||||||||||||||||||||||||||||
| 10,207 | Other(2) | Other(2) | N/A | N/A | ||||||||||||||||||||||||||||||||||||||||
| Senior secured second lien debt | 136,443 | Discounted Cash Flow | Discount Rates | 8.3% | — | 17.6% | 10.9% | |||||||||||||||||||||||||||||||||||||
| 16,187 | Broker Quotes | Broker Quotes | N/A | N/A | ||||||||||||||||||||||||||||||||||||||||
| 1,996 | Market Comparable Approach | EBITDA Multiple | 10.00x | N/A | ||||||||||||||||||||||||||||||||||||||||
| Collateralized securities and structured products - equity | 13,840 | Discounted Cash Flow | Discount Rates | 11.0% | — | 17.0% | 12.6% | |||||||||||||||||||||||||||||||||||||
| Unsecured debt | 5,493 | Discounted Cash Flow | Discount Rates | 16.4% | N/A | |||||||||||||||||||||||||||||||||||||||
| Equity | 44,965 | Market Comparable Approach | EBITDA Multiple | 3.00x | — | 24.00x | 12.33x | |||||||||||||||||||||||||||||||||||||
| 18,784 | Revenue Multiple | 0.60x | — | 2.29x | 1.46x | |||||||||||||||||||||||||||||||||||||||
| 8,618 | $ per kW | $281.5 | N/A | |||||||||||||||||||||||||||||||||||||||||
| 18,782 | Discounted Cash Flow | Discount Rates | 14.3% | N/A | ||||||||||||||||||||||||||||||||||||||||
| 259 | Broker Quotes | Broker Quotes | N/A | N/A | ||||||||||||||||||||||||||||||||||||||||
| 1 | Options Pricing Model | Expected Volatility | N/A | 70% | ||||||||||||||||||||||||||||||||||||||||
| Total | $ | 1,520,794 | ||||||||||||||||||||||||||||||||||||||||||
(1)Weighted average amounts are based on the estimated fair values.
(2)Fair value is based on the expected outcome of proposed corporate transactions and/or other factors.
49
CĪON Investment Corporation
Notes to Consolidated Financial Statements (unaudited)
March 31, 2021
(in thousands, except share and per share amounts)
| December 31, 2020 | ||||||||||||||||||||||||||||||||||||||||||||
| Fair Value | Valuation Techniques/ Methodologies | Unobservable Inputs | Range | Weighted Average(1) | ||||||||||||||||||||||||||||||||||||||||
| Senior secured first lien debt | $ | 881,684 | Discounted Cash Flow | Discount Rates | 5.5% | — | 36.2% | 11.0% | ||||||||||||||||||||||||||||||||||||
| 305,974 | Broker Quotes | Broker Quotes | N/A | N/A | ||||||||||||||||||||||||||||||||||||||||
| 21,920 | Market Comparable Approach | Revenue Multiple | 2.33x | N/A | ||||||||||||||||||||||||||||||||||||||||
| 9,361 | EBITDA Multiple | 2.50x | N/A | |||||||||||||||||||||||||||||||||||||||||
| 4,329 | Other(2) | Other(2) | N/A | N/A | ||||||||||||||||||||||||||||||||||||||||
| Senior secured second lien debt | 121,865 | Discounted Cash Flow | Discount Rates | 8.7% | — | 17.3% | 11.9% | |||||||||||||||||||||||||||||||||||||
| 25,763 | Broker Quotes | Broker Quotes | N/A | N/A | ||||||||||||||||||||||||||||||||||||||||
| 2,305 | Market Comparable Approach | EBITDA Multiple | 4.75x | N/A | ||||||||||||||||||||||||||||||||||||||||
| 1,573 | Revenue Multiple | 0.20x | N/A | |||||||||||||||||||||||||||||||||||||||||
| Collateralized securities and structured products - equity | 12,131 | Discounted Cash Flow | Discount Rates | 12.0% | — | 18.0% | 13.5% | |||||||||||||||||||||||||||||||||||||
| Unsecured debt | 5,464 | Discounted Cash Flow | Discount Rates | 16.5% | N/A | |||||||||||||||||||||||||||||||||||||||
| Equity | 39,644 | Market Comparable Approach | EBITDA Multiple | 3.00x | — | 18.50x | 10.13x | |||||||||||||||||||||||||||||||||||||
| 11,634 | Revenue Multiple | 0.20x | — | 2.33x | 1.56x | |||||||||||||||||||||||||||||||||||||||
| 7,988 | $ per kW | $271.50 | N/A | |||||||||||||||||||||||||||||||||||||||||
| 16,481 | Discounted Cash Flow | Discount Rates | 18.5% | N/A | ||||||||||||||||||||||||||||||||||||||||
| 163 | Broker Quotes | Broker Quotes | N/A | N/A | ||||||||||||||||||||||||||||||||||||||||
| 3 | Options Pricing Model | Expected Volatility | 60.0% | — | 70.0% | 70.0% | ||||||||||||||||||||||||||||||||||||||
| Total | $ | 1,468,282 | ||||||||||||||||||||||||||||||||||||||||||
(1)Weighted average amounts are based on the estimated fair values.
(2)Fair value is based on the expected outcome of proposed corporate transactions and/or other factors.
The significant unobservable inputs used in the fair value measurement of the Company’s senior secured first lien debt, senior secured second lien debt, collateralized securities and structured products, unsecured debt and equity are discount rates, EBITDA multiples, revenue multiples, broker quotes and expected volatility. A significant increase or decrease in discount rates would result in a significantly lower or higher fair value measurement, respectively. A significant increase or decrease in the EBITDA multiples, revenue multiples, expected proceeds from proposed corporate transactions, broker quotes and expected volatility would result in a significantly higher or lower fair value measurement, respectively.
Note 10. General and Administrative Expense
General and administrative expense consisted of the following items for the three months ended March 31, 2021 and 2020 and the year ended December 31, 2020:
| Three Months Ended March 31, | Year Ended December 31, | ||||||||||||||||
| 2021 | 2020 | 2020 | |||||||||||||||
| Professional fees | $ | 1,265 | $ | 297 | $ | 1,490 | |||||||||||
| Transfer agent expense | 422 | 395 | 1,189 | ||||||||||||||
| Valuation expense | 252 | 276 | 999 | ||||||||||||||
| Accounting and administration costs | 237 | 146 | 680 | ||||||||||||||
| Dues and subscriptions | 169 | 82 | 342 | ||||||||||||||
| Insurance expense | 132 | 108 | 489 | ||||||||||||||
| Director fees and expenses | 103 | 116 | 450 | ||||||||||||||
| Printing and marketing expense | 44 | 15 | 378 | ||||||||||||||
| Other expenses | 65 | 35 | 336 | ||||||||||||||
| Total general and administrative expense | $ | 2,689 | $ | 1,470 | $ | 6,353 | |||||||||||
50
CĪON Investment Corporation
Notes to Consolidated Financial Statements (unaudited)
March 31, 2021
(in thousands, except share and per share amounts)
Note 11. Commitments and Contingencies
The Company entered into certain contracts with related and other parties that contain a variety of indemnifications. The Company’s maximum exposure under these arrangements is unknown. However, the Company has not experienced claims or losses pursuant to these contracts and believes the risk of loss related to such indemnifications to be remote.
As of March 31, 2021 and December 31, 2020, the Company’s unfunded commitments were as follows:
| Unfunded Commitments | March 31, 2021(1) | December 31, 2020(1) | ||||||||||||
| Genesis Healthcare, Inc. | $ | 35,000 | $ | — | ||||||||||
| West Dermatology Management Holdings, LLC | 7,655 | 7,655 | ||||||||||||
| Williams Industrial Services Group, Inc. | 5,000 | 5,000 | ||||||||||||
| BCP Great Lakes Fund LP | 4,143 | 2,135 | ||||||||||||
| Palmetto Solar, LLC | 3,262 | 3,262 | ||||||||||||
| Instant Web, LLC | 2,704 | 2,704 | ||||||||||||
| Geon Performance Solutions, LLC | 2,586 | 2,586 | ||||||||||||
| Appalachian Resource Company, LLC | 2,500 | 2,500 | ||||||||||||
| Coyote Buyer, LLC | 2,500 | 2,500 | ||||||||||||
| Moss Holding Company | 2,232 | 2,232 | ||||||||||||
| Foundation Consumer Healthcare, LLC | 2,094 | 4,211 | ||||||||||||
| Extreme Reach, Inc. | 1,744 | 1,744 | ||||||||||||
| AMCP Staffing Intermediate Holdings III, LLC | 1,598 | 1,370 | ||||||||||||
| Anthem Sports & Entertainment Inc. | 1,333 | 1,333 | ||||||||||||
| CircusTrix Holdings, LLC | 802 | 2,898 | ||||||||||||
| Mimeo.com, Inc. | 500 | 1,000 | ||||||||||||
| American Media, LLC | 85 | — | ||||||||||||
| Total | $ | 75,738 | $ | 43,130 | ||||||||||
(1)Unless otherwise noted, the funding criteria for these unfunded commitments had not been met at the date indicated.
Unfunded commitments to provide funds to companies are not recorded on the Company’s consolidated balance sheets. Since these commitments may expire without being drawn upon, unfunded commitments do not necessarily represent future cash requirements or future earning assets for the Company. The Company intends to use cash on hand, short-term investments, proceeds from borrowings, and other liquid assets to fund these commitments should the need arise. For information on the companies to which the Company is committed to fund additional amounts as of March 31, 2021 and December 31, 2020, refer to the table above and the consolidated schedules of investments. As of May 10, 2021, the Company was committed, upon the satisfaction of certain conditions, to fund an additional $79,985.
The Company will fund its unfunded commitments from the same sources it uses to fund its investment commitments that are funded at the time they are made (i.e., advances from its financing arrangements and/or cash flows from operations). The Company will not fund its unfunded commitments from future net proceeds generated by securities offerings, if any. The Company follows a process to manage its liquidity and ensure that it has available capital to fund its unfunded commitments. Specifically, the Company prepares detailed analyses of the level of its unfunded commitments relative to its then available liquidity on a daily basis. These analyses are reviewed and discussed on a weekly basis by the Company's executive officers and senior members of CIM (including members of the investment committee) and are updated on a “real time” basis in order to ensure that the Company has adequate liquidity to satisfy its unfunded commitments.
51
CĪON Investment Corporation
Notes to Consolidated Financial Statements (unaudited)
March 31, 2021
(in thousands, except share and per share amounts)
Note 12. Fee Income
Fee income consists of amendment fees, capital structuring and other fees, and administrative agent fees. The following table summarizes the Company’s fee income for the three months ended March 31, 2021 and 2020 and the year ended December 31, 2020:
| Three Months Ended March 31, | Year Ended December 31, | ||||||||||||||||
| 2021 | 2020 | 2020 | |||||||||||||||
| Amendment fees | $ | 584 | $ | 489 | $ | 3,550 | |||||||||||
| Capital structuring and other fees | 294 | 115 | 968 | ||||||||||||||
| Administrative agent fees | 55 | — | 25 | ||||||||||||||
| Total | $ | 933 | $ | 604 | $ | 4,543 | |||||||||||
Administrative agent fees are recurring income as long as the Company remains the administrative agent for the related investment. Income from all other fees was non-recurring.
Note 13. Financial Highlights
The following is a schedule of financial highlights as of and for the three months ended March 31, 2021 and 2020 and the year ended December 31, 2020:
| Three Months Ended March 31, | Year Ended December 31, | |||||||||||||||||||
| 2021 | 2020 | 2020 | ||||||||||||||||||
| Per share data:(1) | ||||||||||||||||||||
| Net asset value at beginning of period | $ | 7.75 | $ | 8.40 | $ | 8.40 | ||||||||||||||
| Results of operations: | ||||||||||||||||||||
| Net investment income | 0.16 | 0.19 | 0.69 | |||||||||||||||||
| Net realized and net change in unrealized gains (losses)(2) | 0.28 | (1.12) | (0.78) | |||||||||||||||||
| Net increase (decrease) in net assets resulting from operations(2) | 0.44 | (0.93) | (0.09) | |||||||||||||||||
| Shareholder distributions: | ||||||||||||||||||||
| Distributions from net investment income | (0.13) | (0.18) | (0.56) | |||||||||||||||||
| Net decrease in net assets resulting from shareholders' distributions | (0.13) | (0.18) | (0.56) | |||||||||||||||||
| Capital share transactions: | ||||||||||||||||||||
| Issuance of common stock above net asset value(3) | — | — | — | |||||||||||||||||
| Repurchases of common stock(4) | — | — | — | |||||||||||||||||
| Net increase in net assets resulting from capital share transactions | — | — | — | |||||||||||||||||
| Net asset value at end of period | $ | 8.06 | $ | 7.29 | $ | 7.75 | ||||||||||||||
| Shares of common stock outstanding at end of period | 113,299,836 | 113,313,249 | 113,293,723 | |||||||||||||||||
| Total investment return-net asset value(5) | 5.73 | % | (11.25) | % | (0.94) | % | ||||||||||||||
| Net assets at beginning of period | $ | 878,256 | $ | 952,563 | $ | 952,563 | ||||||||||||||
| Net assets at end of period | $ | 912,942 | $ | 825,858 | $ | 878,256 | ||||||||||||||
| Average net assets | $ | 891,806 | $ | 917,565 | $ | 875,846 | ||||||||||||||
| Ratio/Supplemental data: | ||||||||||||||||||||
| Ratio of net investment income to average net assets(6) | 1.97 | % | 2.36 | % | 8.99 | % | ||||||||||||||
| Ratio of gross operating expenses to average net assets(6)(7) | 2.10 | % | 2.62 | % | 9.72 | % | ||||||||||||||
| Ratio of net operating expenses to average net assets(6) | 2.10 | % | 2.62 | % | 9.72 | % | ||||||||||||||
| Portfolio turnover rate(8) | 12.20 | % | 10.53 | % | 22.99 | % | ||||||||||||||
| Asset coverage ratio(9) | 2.26 | 2.02 | 2.21 | |||||||||||||||||
(1)The per share data for the three months ended March 31, 2021 and 2020 and the year ended December 31, 2020 was derived by using the weighted average shares of common stock outstanding during each period.
52
CĪON Investment Corporation
Notes to Consolidated Financial Statements (unaudited)
March 31, 2021
(in thousands, except share and per share amounts)
(2)The amount shown for net realized and net change in unrealized gains (losses) is the balancing figure derived from the other figures in the schedule. The amount shown at this caption for a share outstanding throughout the period may not agree with the change in the aggregate gains and losses in portfolio securities for the period because of the timing of sales and repurchases of the Company’s shares in relation to fluctuating market values for the portfolio. As a result, net increase (decrease) in net assets resulting from operations in this schedule may vary from the consolidated statements of operations.
(3)The continuous issuance of shares of common stock may have caused an incremental increase in net asset value per share due to the sale of shares at the then prevailing public offering price and the receipt of net proceeds per share by the Company in excess of net asset value per share on each subscription closing date. The per share impact of the continuous issuance of shares of common stock was an increase to net asset value of less than $0.01 per share during the three months ended March 31, 2021 and 2020 and the year ended December 31, 2020. The Company's follow-on continuous public offering ended on January 25, 2019.
(4)Repurchases of common stock may cause an incremental decrease in net asset value per share due to the repurchase of shares at a price in excess of net asset value per share on each repurchase date. The per share impact of repurchases of common stock was a decrease to net asset value of less than $0.01 per share during the three months ended March 31, 2021 and 2020 and the year ended December 31, 2020.
(5)Total investment return-net asset value is a measure of the change in total value for shareholders who held the Company’s common stock at the beginning and end of the period, including distributions paid or payable during the period. Total investment return-net asset value is based on (i) the beginning period net asset value per share on the first day of the period, (ii) the net asset value per share on the last day of the period of (A) one share plus (B) any fractional shares issued in connection with the reinvestment of monthly distributions, and (iii) the value of distributions payable, if any, on the last day of the period. The total investment return-net asset value calculation assumes that monthly cash distributions are reinvested in accordance with the Company's distribution reinvestment plan then in effect as described in Note 5. The total investment return-net asset value does not consider the effect of the sales load from the sale of the Company’s common stock. The total investment return-net asset value includes the effect of the issuance of shares at a net offering price that is greater than net asset value per share, which causes an increase in net asset value per share. Total returns covering less than a full year are not annualized.
(6)Ratio is not annualized.
(7)Ratio of gross operating expenses to average net assets does not include expense support provided by CIM, if any.
(8)Portfolio turnover rate is calculated using the lesser of year-to-date sales or purchases over the average of the invested assets at fair value, excluding short term investments, and is not annualized.
(9)Asset coverage ratio is equal to (i) the sum of (a) net assets at the end of the period and (b) total senior securities outstanding at the end of the period (excluding unfunded commitments), divided by (ii) total senior securities outstanding at the end of the period.
Note 14. Subsequent Event
More Term Loan
On April 14, 2021, the Company entered into an Unsecured Term Loan Facility Agreement, or the Term Loan Agreement, with More Provident Funds Ltd., or More, as lender. The Term Loan Agreement with More, or the More Term Loan, provides for an unsecured term loan to the Company in an aggregate principal amount of $30,000. On April 20, 2021, the Company drew down $30,000 of borrowings under the More Term Loan. After the deduction of fees and other financing expenses, the Company received net borrowings of approximately $29,000, which the Company intends to use for working capital and other general corporate purposes.
Advances under the More Term Loan mature on September 30, 2024, and bear interest at a rate of 5.20% per year payable quarterly in arrears. The Company has the right to, at its option, prepay all or any portion of advances then outstanding together with a prepayment fee equal to the higher of (i) zero, or (ii) the discounted present value of all remaining interest payments that would have been paid by the Company through the maturity date with respect to the principal amount of such advance that is to be prepaid or becomes due and payable pursuant to the Term Loan Agreement. The discounted present value portion of the prepayment fee is calculated by applying a discount rate on the same periodic basis as that on which interest on advances is payable equal to the sum of 2.00% plus the yield to maturity of the most recently issued U.S. Treasury securities having a maturity equal to the remaining average life of the More Term Loan, or if there are no such U.S. Treasury securities, using such implied yield to maturity determined in accordance with the terms of the Term Loan Agreement.
Advances under the More Term Loan are general unsecured obligations of the Company that rank pari passu with all existing and future unsecured unsubordinated indebtedness issued by the Company, rank effectively junior to the Company's secured indebtedness (including unsecured indebtedness that the Company later secures) to the extent of the value of the assets securing such indebtedness, and rank structurally junior to all existing and future indebtedness (including trade payables) incurred by certain of the Company's subsidiaries, financing vehicles or similar facilities.
53
CĪON Investment Corporation
Notes to Consolidated Financial Statements (unaudited)
March 31, 2021
(in thousands, except share and per share amounts)
The Term Loan Agreement contains other terms and conditions, including, without limitation, affirmative and negative covenants such as (i) information reporting, (ii) maintenance of the Company's status as a BDC within the meaning of the 1940 Act, (iii) minimum shareholders’ equity of 60% of the Company’s net asset value as of the year ended December 31, 2020 plus 50% of the net cash proceeds of the sale of certain equity interests by the Company after April 14, 2021, if any, (iv) a minimum asset coverage ratio of not less than 200%, or 150% subject to certain U.S. SEC relief actions and the Company's common stock being listed for trading on a national securities exchange, and (v) an unencumbered asset coverage ratio of 1.25 to 1.00, provided that (a) first lien senior secured loans and cash represent more than 65% of the total value of unencumbered assets used by the Company for purposes of the ratio and (b) equity interests or structured products in the aggregate represent less than 15% of the total value of unencumbered assets used by the Company for purposes of the ratio. In addition, the Term Loan Agreement contains customary events of default with customary cure and notice periods, including, without limitation, nonpayment, incorrect representation in any material respect, breach of covenant, cross default under other indebtedness or derivative securities of the Company in an outstanding aggregate principal amount of at least $25,000, certain judgments and orders, and certain events of bankruptcy.
54
Item 2. Management’s Discussion and Analysis of Financial Condition and Results of Operations
As used in this Quarterly Report on Form 10-Q, “we,” “us,” “our” or similar terms include CĪON Investment Corporation and its consolidated subsidiaries. In addition, the term "portfolio companies" refers to companies in which we have invested, either directly or indirectly through our consolidated subsidiaries.
The following discussion should be read in conjunction with our unaudited consolidated financial statements and related notes appearing elsewhere in this Quarterly Report on Form 10-Q and the audited consolidated financial statements and related notes included in our Annual Report on Form 10-K for the year ended December 31, 2020. In addition to historical information, the following discussion and other parts of this Quarterly Report on Form 10-Q contain forward-looking information that involves risks and uncertainties. Amounts and percentages presented herein may have been rounded for presentation and all dollar amounts, excluding share and per share amounts, are presented in thousands unless otherwise noted.
Forward-Looking Statements
Some of the statements within this Quarterly Report on Form 10-Q constitute forward-looking statements because they relate to future events or our future performance or financial condition. The forward-looking statements contained in this Quarterly Report on Form 10-Q may include statements as to:
•our future operating results;
•our business prospects and the prospects of our portfolio companies, including our and their ability to achieve our respective objectives as a result of COVID-19;
•the impact of the investments that we expect to make;
•the ability of our portfolio companies to achieve their objectives;
•our current and expected financings and investments;
•the adequacy of our cash resources, financing sources and working capital;
•the use of borrowed money to finance a portion of our investments;
•the timing of cash flows, if any, from the operations of our portfolio companies;
•our contractual arrangements and relationships with third parties;
•the actual and potential conflicts of interest with CIM and Apollo and their respective affiliates;
•the ability of CIM's and AIM's investment professionals to locate suitable investments for us and the ability of CIM to monitor and administer our investments;
•the ability of CIM and its affiliates to attract and retain highly talented professionals;
•the dependence of our future success on the general economy and its impact on the industries in which we invest, including COVID-19 and the related economic disruptions caused thereby;
•the effects of a changing interest rate environment;
•our ability to source favorable private investments;
•our tax status;
•the effect of changes to tax legislation and our tax position;
•the tax status of the companies in which we invest; and
•the timing and amount of distributions and dividends from the companies in which we invest.
In addition, words such as “anticipate,” “believe,” “expect” and “intend” indicate a forward-looking statement, although not all forward-looking statements include these words. The forward-looking statements contained in this Quarterly Report on Form 10-Q involve risks and uncertainties. Our actual results could differ materially from those implied or expressed in the forward-looking statements for any reason, including the factors set forth in “Risk Factors” in Item 1A of Part II of this Quarterly Report on Form 10-Q. Other factors that could cause actual results to differ materially include:
•changes in the economy;
•risks associated with possible disruption in our operations or the economy generally due to terrorism, pandemics, or natural disasters; and
•future changes in laws or regulations and conditions in our operating areas.
55
We have based the forward-looking statements on information available to us on the date of this Quarterly Report on Form 10-Q. Except as required by the federal securities laws, we undertake no obligation to revise or update any forward-looking statements, whether as a result of new information, future events or otherwise. You are advised to review any additional disclosures that we may make directly to you or through reports that we in the future may file with the SEC, including annual reports on Form 10-K, quarterly reports on Form 10-Q and current reports on Form 8-K. The forward-looking statements contained in this Quarterly Report on Form 10-Q are excluded from the safe harbor protection provided by Section 27A of the Securities Act of 1933, as amended, and Section 21E of the Securities Exchange Act of 1934, as amended.
Overview
We were incorporated under the general corporation laws of the State of Maryland on August 9, 2011 and commenced operations on December 17, 2012 upon raising proceeds of $2,500 from persons not affiliated with us, CIM or Apollo. We are an externally managed, non-diversified closed-end management investment company that has elected to be regulated as a BDC under the 1940 Act. We elected to be treated for federal income tax purposes as a RIC, as defined under Subchapter M of the Code.
Our investment objective is to generate current income and, to a lesser extent, capital appreciation for investors. Our portfolio is comprised primarily of investments in senior secured debt, including first lien loans, second lien loans and unitranche loans, and, to a lesser extent, collateralized securities, structured products and other similar securities, unsecured debt, and equity, of private and thinly-traded U.S. middle-market companies. In connection with our debt investments, we may receive equity interests such as warrants or options as additional consideration. We may also purchase equity interests in the form of common or preferred stock in our target companies, either in conjunction with one of our debt investments or through a co-investment with a financial sponsor.
We are managed by CIM, our affiliate and a registered investment adviser. Pursuant to an investment advisory agreement with us, CIM oversees the management of our activities and is responsible for making investment decisions for our portfolio. On November 13, 2020, our board of directors, including a majority of directors who are not interested persons, approved the renewal of the investment advisory agreement with CIM for a period of twelve months commencing December 17, 2020. We and CIM previously engaged AIM to act as our investment sub-adviser.
On July 11, 2017, the members of CIM entered into the Third Amended CIM LLC Agreement for the purpose of creating a joint venture between AIM and CIG. Under the Third Amended CIM LLC Agreement, AIM became a member of CIM and was issued a newly-created class of membership interests in CIM pursuant to which AIM, among other things, shares in the profits, losses, distributions and expenses of CIM with the other members in accordance with the terms of the Third Amended CIM LLC Agreement, which results in CIG and AIM each owning a 50% economic interest in CIM.
On July 10, 2017, our independent directors unanimously approved the termination of the investment sub-advisory agreement with AIM, effective as of July 11, 2017, as part of the new and ongoing relationship among us, CIM and AIM. Although the investment sub-advisory agreement and AIM's engagement as our investment sub-adviser were terminated, AIM's investment professionals continue to perform certain services for CIM and us, including, without limitation, identifying investment opportunities for approval by CIM's investment committee. AIM is not paid a separate fee in exchange for such services, but is entitled to receive distributions as a member of CIM as described above.
On December 4, 2017, the members of CIM entered into the Fourth Amended CIM LLC Agreement. Under the Fourth Amended CIM LLC Agreement, AIM’s investment professionals perform certain services for CIM, which include, among other services, (i) assistance with identifying and providing information about potential investment opportunities for approval by CIM’s investment committee; and (ii) providing (a) trade and settlement support; (b) portfolio and cash reconciliation; (c) market pipeline information regarding syndicated deals, in each case, as reasonably requested by CIM; and (d) monthly valuation reports and support for all broker-quoted investments. All of our investment decisions are the sole responsibility of, and are made at the sole discretion of, CIM's investment committee, which consists entirely of CIG personnel.
We seek to meet our investment objective by utilizing the experienced management team of CIM, which includes its access to the relationships and human capital of its affiliates in sourcing, evaluating and structuring transactions, as well as monitoring and servicing our investments. We focus primarily on the senior secured debt of private and thinly-traded U.S. middle-market companies, which we define as companies that generally possess annual EBITDA of $50 million or less, with experienced management teams, significant free cash flow, strong competitive positions and potential for growth.
56
Revenue
We primarily generate revenue in the form of interest income on the debt securities that we hold and capital gains on debt or other equity interests that we acquire in portfolio companies. The majority of our senior debt investments bear interest at a floating rate. Interest on debt securities is generally payable quarterly or monthly. In some cases, some of our investments may provide for deferred interest payments or PIK interest. The principal amount of the debt securities and any accrued, but unpaid, interest generally will become due at the maturity date. In addition, we may generate revenue in the form of commitment and capital structuring fees, monitoring fees, fees for providing managerial assistance and possibly consulting fees and performance-based fees. Any such fees generated in connection with our investments will be recognized when earned.
Operating Expenses
Our primary operating expenses are the payment of advisory fees and subordinated incentive fees on income under the investment advisory agreement and interest expense on our financing arrangements. Our investment advisory fees compensate CIM for its work in identifying, evaluating, negotiating, executing, monitoring and servicing our investments. We bear all other expenses of our operations and transactions.
Recent Developments
COVID-19
The rapid spread of COVID-19, and associated impacts on the U.S. and global economies and the financial and credit markets, initially had negatively impacted, and may again negatively impact, our business operations and the business operations of some of our portfolio companies. We cannot at this time fully predict the impact of COVID-19 on our business or the business of our portfolio companies, its duration or magnitude or the extent to which it will negatively impact our portfolio companies’ operating results or our own results of operations or financial condition, including, without limitation, our ability to pay distributions to and repurchase shares from our shareholders. We expect that certain of our portfolio companies will continue to experience economic distress for the foreseeable future and may significantly limit business operations if subjected to prolonged economic distress. These developments could result in a decrease in the value of certain of our investments.
COVID-19 initially had adverse effects on our investment income and may again have adverse effects in the future. These adverse effects may require us to restructure certain of our investments, which could result in further reductions to our investment income or in impairments on our investments. In addition, disruptions in the capital markets have resulted in illiquidity in certain market areas. These market disruptions and illiquidity initially had an adverse effect on our business, financial condition, results of operations and cash flows. Unfavorable economic conditions caused by COVID-19 can also be expected to increase our funding costs and limit our access to the capital markets. These events initially limited our investment originations, which may occur again in the future, and may also have a material negative impact on our operating results.
We will continue to carefully monitor the impact of COVID-19 on our business and the business of our portfolio companies. Because the full effects of COVID-19 are not capable of being known at this time, we cannot estimate the impacts of COVID-19 on our future financial condition, results of operations or cash flows, including its effects on us with respect to our compliance with covenants in our financing arrangements with lenders. We do, however, expect that it will continue to have a negative impact on our business and the financial condition of certain of our portfolio companies.
More Term Loan
On April 14, 2021, we entered into the Term Loan Agreement with More, as lender. The More Term Loan provides for an unsecured term loan to us in an aggregate principal amount of $30,000. On April 20, 2021, we drew down $30,000 of borrowings under the More Term Loan. After the deduction of fees and other financing expenses, we received net borrowings of approximately $29,000, which we intend to use for working capital and other general corporate purposes. See Note 14 to our consolidated financial statements contained in this report for additional information regarding the More Term Loan.
57
Portfolio Investment Activity for the Three Months Ended March 31, 2021 and 2020 and the Year Ended December 31, 2020
The following table summarizes our investment activity, excluding short term investments and PIK securities, for the three months ended March 31, 2021 and 2020 and the year ended December 31, 2020:
| Three Months Ended March 31, | Year Ended December 31, | |||||||||||||||||||
| Net Investment Activity | 2021 | 2020 | 2020 | |||||||||||||||||
| Purchases and drawdowns | ||||||||||||||||||||
| Senior secured first lien debt | $ | 181,990 | $ | 175,543 | $ | 347,992 | ||||||||||||||
| Senior secured second lien debt | — | — | 4,375 | |||||||||||||||||
| Equity | 1,644 | 88 | 7,266 | |||||||||||||||||
| Sales and principal repayments | (189,274) | (210,398) | (543,167) | |||||||||||||||||
| Net portfolio activity | $ | (5,640) | $ | (34,767) | $ | (183,534) | ||||||||||||||
The following tables summarize the composition of our investment portfolio at amortized cost and fair value as of March 31, 2021 and December 31, 2020:
| March 31, 2021 | ||||||||||||||||||||
| Investments Cost(1) | Investments Fair Value | Percentage of Investment Portfolio | ||||||||||||||||||
| Senior secured first lien debt | $ | 1,283,804 | $ | 1,255,426 | 81.8 | % | ||||||||||||||
| Senior secured second lien debt | 172,670 | 154,626 | 10.1 | % | ||||||||||||||||
| Collateralized securities and structured products - equity | 15,152 | 13,840 | 0.9 | % | ||||||||||||||||
| Unsecured debt | 5,671 | 5,493 | 0.4 | % | ||||||||||||||||
| Equity | 102,389 | 104,663 | 6.8 | % | ||||||||||||||||
| Subtotal/total percentage | 1,579,686 | 1,534,048 | 100.0 | % | ||||||||||||||||
| Short term investments(2) | 87,593 | 87,593 | ||||||||||||||||||
| Total investments | $ | 1,667,279 | $ | 1,621,641 | ||||||||||||||||
| Number of portfolio companies | 122 | |||||||||||||||||||
| Average annual EBITDA of portfolio companies | $64.0 million | |||||||||||||||||||
| Median annual EBITDA of portfolio companies | $50.6 million | |||||||||||||||||||
| Purchased at a weighted average price of par | 98.15 | % | ||||||||||||||||||
| Gross annual portfolio yield based upon the purchase price(3) | 8.57 | % | ||||||||||||||||||
(1)Represents amortized cost for debt investments and cost for equity investments. Amortized cost represents the original cost adjusted for the amortization of premiums and/or accretion of discounts, as applicable, on our investments.
(2)Short term investments represent an investment in a fund that invests in highly liquid investments with average original maturity dates of three months or less.
(3)The gross annual portfolio yield does not represent and may be higher than an actual investment return to shareholders because it excludes our expenses and all sales commissions and dealer manager fees and does not consider the cost of leverage.
58
| December 31, 2020 | |||||||||||||||||
| Investments Cost(1) | Investments Fair Value | Percentage of Investment Portfolio | |||||||||||||||
| Senior secured first lien debt | $ | 1,266,564 | $ | 1,223,268 | 81.8 | % | |||||||||||
| Senior secured second lien debt | 171,480 | 151,506 | 10.1 | % | |||||||||||||
| Collateralized securities and structured products - equity | 15,305 | 12,131 | 0.8 | % | |||||||||||||
| Unsecured debt | 5,668 | 5,464 | 0.4 | % | |||||||||||||
| Equity | 118,638 | 103,405 | 6.9 | % | |||||||||||||
| Subtotal/total percentage | 1,577,655 | 1,495,774 | 100.0 | % | |||||||||||||
| Short term investments(2) | 73,597 | 73,597 | |||||||||||||||
| Total investments | $ | 1,651,252 | $ | 1,569,371 | |||||||||||||
| Number of portfolio companies | 119 | ||||||||||||||||
| Average annual EBITDA of portfolio companies | $67.3 million | ||||||||||||||||
| Median annual EBITDA of portfolio companies | $53.2 million | ||||||||||||||||
| Purchased at a weighted average price of par | 98.18 | % | |||||||||||||||
| Gross annual portfolio yield based upon the purchase price(3) | 8.28 | % | |||||||||||||||
(1)Represents amortized cost for debt investments and cost for equity investments. Amortized cost represents the original cost adjusted for the amortization of premiums and/or accretion of discounts, as applicable, on our investments.
(2)Short term investments represent an investment in a fund that invests in highly liquid investments with average original maturity dates of three months or less.
(3)The gross annual portfolio yield does not represent and may be higher than an actual investment return to shareholders because it excludes our expenses and all sales commissions and dealer manager fees and does not consider the cost of leverage.
The following table summarizes the composition of our investment portfolio by the type of interest rate as of March 31, 2021 and December 31, 2020, excluding short term investments of $87,593 and $73,597, respectively:
| March 31, 2021 | December 31, 2020 | |||||||||||||||||||||||||||||||||||||
| Interest Rate Allocation | Investments Cost | Investments Fair Value | Percentage of Investment Portfolio | Investments Cost | Investments Fair Value | Percentage of Investment Portfolio | ||||||||||||||||||||||||||||||||
| Floating interest rate investments | $ | 1,349,948 | $ | 1,306,343 | 85.1 | % | $ | 1,347,194 | $ | 1,284,282 | 85.9 | % | ||||||||||||||||||||||||||
| Fixed interest rate investments | 127,637 | 128,162 | 8.4 | % | 126,962 | 124,816 | 8.3 | % | ||||||||||||||||||||||||||||||
| Non-income producing equity | 66,827 | 65,400 | 4.3 | % | 66,086 | 52,505 | 3.5 | % | ||||||||||||||||||||||||||||||
| Other income producing investments | 35,274 | 34,143 | 2.2 | % | 37,413 | 34,171 | 2.3 | % | ||||||||||||||||||||||||||||||
| Total investments | $ | 1,579,686 | $ | 1,534,048 | 100.0 | % | $ | 1,577,655 | $ | 1,495,774 | 100.0 | % | ||||||||||||||||||||||||||
59
The following table shows the composition of our investment portfolio by industry classification and the percentage, by fair value, of the total assets in such industries as of March 31, 2021 and December 31, 2020:
| March 31, 2021 | December 31, 2020 | |||||||||||||||||||||||||
| Industry Classification | Investments Fair Value | Percentage of Investment Portfolio | Investments Fair Value | Percentage of Investment Portfolio | ||||||||||||||||||||||
| Healthcare & Pharmaceuticals | $ | 287,329 | 18.7 | % | $ | 298,944 | 19.9 | % | ||||||||||||||||||
| Services: Business | 212,278 | 13.8 | % | 211,572 | 14.0 | % | ||||||||||||||||||||
| Chemicals, Plastics & Rubber | 124,555 | 8.1 | % | 141,654 | 9.5 | % | ||||||||||||||||||||
| Media: Diversified & Production | 113,208 | 7.4 | % | 108,078 | 7.2 | % | ||||||||||||||||||||
| Media: Advertising, Printing & Publishing | 108,664 | 7.1 | % | 110,083 | 7.4 | % | ||||||||||||||||||||
| Services: Consumer | 97,966 | 6.4 | % | 85,254 | 5.7 | % | ||||||||||||||||||||
| Beverage, Food & Tobacco | 83,083 | 5.4 | % | 69,975 | 4.7 | % | ||||||||||||||||||||
| High Tech Industries | 71,486 | 4.7 | % | 55,619 | 3.7 | % | ||||||||||||||||||||
| Capital Equipment | 65,871 | 4.3 | % | 65,752 | 4.4 | % | ||||||||||||||||||||
| Banking, Finance, Insurance & Real Estate | 51,349 | 3.3 | % | 41,211 | 2.8 | % | ||||||||||||||||||||
| Telecommunications | 46,284 | 3.0 | % | 46,638 | 3.1 | % | ||||||||||||||||||||
| Energy: Oil & Gas | 41,328 | 2.7 | % | 28,136 | 1.9 | % | ||||||||||||||||||||
| Aerospace & Defense | 36,513 | 2.4 | % | 35,751 | 2.4 | % | ||||||||||||||||||||
| Construction & Building | 34,626 | 2.3 | % | 34,653 | 2.3 | % | ||||||||||||||||||||
| Hotel, Gaming & Leisure | 31,428 | 2.0 | % | 21,920 | 1.5 | % | ||||||||||||||||||||
| Retail | 28,751 | 1.9 | % | 29,312 | 2.0 | % | ||||||||||||||||||||
| Diversified Financials | 24,697 | 1.6 | % | 37,214 | 2.5 | % | ||||||||||||||||||||
| Forest Products & Paper | 21,717 | 1.4 | % | 21,686 | 1.4 | % | ||||||||||||||||||||
| Transportation: Cargo | 18,821 | 1.2 | % | 19,001 | 1.3 | % | ||||||||||||||||||||
| Consumer Goods: Non-Durable | 16,202 | 1.1 | % | 15,757 | 1.1 | % | ||||||||||||||||||||
| Metals & Mining | 10,033 | 0.7 | % | 10,147 | 0.7 | % | ||||||||||||||||||||
| Consumer Goods: Durable | 7,859 | 0.5 | % | 7,417 | 0.5 | % | ||||||||||||||||||||
| Subtotal/total percentage | 1,534,048 | 100.0 | % | 1,495,774 | 100.0 | % | ||||||||||||||||||||
| Short term investments | 87,593 | 73,597 | ||||||||||||||||||||||||
| Total investments | $ | 1,621,641 | $ | 1,569,371 | ||||||||||||||||||||||
Our investment portfolio may contain senior secured investments that are in the form of lines of credit, delayed draw term loans, revolving credit facilities, or unfunded commitments, which may require us to provide funding when requested in accordance with the terms of the underlying agreements. As of March 31, 2021 and December 31, 2020, our unfunded commitments amounted to $75,738 and $43,130, respectively. As of May 10, 2021, our unfunded commitments amounted to $79,985. Since these commitments may expire without being drawn upon, unfunded commitments do not necessarily represent future cash requirements or future earning assets for us. Refer to the section “Commitments and Contingencies and Off-Balance Sheet Arrangements” for further details on our unfunded commitments.
Investment Portfolio Asset Quality
CIM uses an investment rating system to characterize and monitor our expected level of returns on each investment in our portfolio. These ratings are just one of several factors that CIM uses to monitor our portfolio, are not in and of themselves determinative of fair value or revenue recognition and are presented for indicative purposes. CIM rates the credit risk of all investments on a scale of 1 to 5 no less frequently than quarterly. This system is intended primarily to reflect the underlying risk of a portfolio investment relative to our initial cost basis in respect of such portfolio investment (i.e., at the time of acquisition), although it may also take into account under certain circumstances the performance of the portfolio company’s business, the collateral coverage of the investment and other relevant factors.
60
The following is a description of the conditions associated with each investment rating used in this ratings system:
| Investment Rating | Description | |||||||
| 1 | Indicates the least amount of risk to our initial cost basis. The trends and risk factors for this investment since origination or acquisition are generally favorable, which may include the performance of the portfolio company or a potential exit. | |||||||
| 2 | Indicates a level of risk to our initial cost basis that is similar to the risk to our initial cost basis at the time of origination or acquisition. This portfolio company is generally performing in accordance with our analysis of its business and the full return of principal and interest or dividend is expected. | |||||||
| 3 | Indicates that the risk to our ability to recoup the cost of such investment has increased since origination or acquisition, but full return of principal and interest or dividend is expected. A portfolio company with an investment rating of 3 requires closer monitoring. | |||||||
| 4 | Indicates that the risk to our ability to recoup the cost of such investment has increased significantly since origination or acquisition, including as a result of factors such as declining performance and noncompliance with debt covenants, and we expect some loss of interest, dividend or capital appreciation, but still expect an overall positive internal rate of return on the investment. | |||||||
| 5 | Indicates that the risk to our ability to recoup the cost of such investment has increased materially since origination or acquisition and the portfolio company likely has materially declining performance. Loss of interest or dividend and some loss of principal investment is expected, which would result in an overall negative internal rate of return on the investment. | |||||||
For investments rated 3, 4, or 5, CIM enhances its level of scrutiny over the monitoring of such portfolio company.
The following table summarizes the composition of our investment portfolio based on the 1 to 5 investment rating scale at fair value as of March 31, 2021 and December 31, 2020, excluding short term investments of $87,593 and $73,597, respectively:
| March 31, 2021 | December 31, 2020 | |||||||||||||||||||||||||
| Investment Rating | Investments Fair Value | Percentage of Investment Portfolio | Investments Fair Value | Percentage of Investment Portfolio | ||||||||||||||||||||||
| 1 | $ | 53,636 | 3.5 | % | $ | 2,997 | 0.2 | % | ||||||||||||||||||
| 2 | 1,182,221 | 77.1 | % | 1,173,191 | 78.5 | % | ||||||||||||||||||||
| 3 | 288,994 | 18.8 | % | 309,930 | 20.7 | % | ||||||||||||||||||||
| 4 | 8,283 | 0.5 | % | 9,210 | 0.6 | % | ||||||||||||||||||||
| 5 | 914 | 0.1 | % | 446 | — | |||||||||||||||||||||
| $ | 1,534,048 | 100.0 | % | $ | 1,495,774 | 100.0 | % | |||||||||||||||||||
The amount of the investment portfolio in each rating category may vary substantially from period to period resulting primarily from changes in the composition of such portfolio as a result of new investment, repayment and exit activities. In addition, changes in the rating of investments may be made to reflect our expectation of performance and changes in investment values.
61
Current Investment Portfolio
The following table summarizes the composition of our investment portfolio at fair value as of May 10, 2021:
| Investments Fair Value | Percentage of Investment Portfolio | |||||||||||||||||||
| Senior secured first lien debt | $ | 1,318,647 | 83.3 | % | ||||||||||||||||
| Senior secured second lien debt | 141,834 | 9.0 | % | |||||||||||||||||
| Collateralized securities and structured products - equity | 12,908 | 0.8 | % | |||||||||||||||||
| Unsecured debt | 5,493 | 0.3 | % | |||||||||||||||||
| Equity | 104,843 | 6.6 | % | |||||||||||||||||
| Subtotal/total percentage | 1,583,725 | 100.0 | % | |||||||||||||||||
| Short term investments(2) | 130,575 | |||||||||||||||||||
| Total investments | $ | 1,714,300 | ||||||||||||||||||
| Number of portfolio companies | 127 | |||||||||||||||||||
| Average annual EBITDA of portfolio companies | $62.5 million | |||||||||||||||||||
| Median annual EBITDA of portfolio companies | $49.0 million | |||||||||||||||||||
| Purchased at a weighted average price of par | 98.42 | % | ||||||||||||||||||
| Gross annual portfolio yield based upon the purchase price(2) | 8.39 | % | ||||||||||||||||||
(1)Short term investments represent an investment in a fund that invests in highly liquid investments with average original maturity dates of three months or less.
(2)The gross annual portfolio yield does not represent and may be higher than an actual investment return to shareholders because it excludes our expenses and all sales commissions and dealer manager fees and does not consider the cost of leverage.
Results of Operations for the Three Months Ended March 31, 2021 and 2020
Our results of operations for the three months ended March 31, 2021 and 2020 were as follows:
| Three Months Ended March 31, | |||||||||||
| 2021 | 2020 | ||||||||||
| Investment income | $ | 36,303 | $ | 45,748 | |||||||
| Net operating expenses | 18,704 | 24,087 | |||||||||
| Net investment income | 17,599 | 21,661 | |||||||||
| Net realized loss on investments and foreign currency | (4,128) | (4,196) | |||||||||
| Net change in unrealized appreciation (depreciation) on investments | 36,243 | (123,377) | |||||||||
| Net increase (decrease) in net assets resulting from operations | $ | 49,714 | $ | (105,912) | |||||||
Investment Income
For the three months ended March 31, 2021 and 2020, we generated investment income of $36,303 and $45,748, respectively, consisting primarily of interest income on investments in senior secured debt, collateralized securities and structured products, and unsecured debt of 107 and 136 portfolio companies held during each respective period. Our average investment portfolio size, excluding our short term investments, decreased $143,343, from $1,658,254 for the three months ended March 31, 2020 to $1,514,911 for the three months ended March 31, 2021. Additionally, the decrease in LIBOR during the three months ended March 31, 2021 from the three months ended March 31, 2020 also contributed to the decrease in interest income.
62
Operating Expenses
The composition of our operating expenses for the three months ended March 31, 2021 and 2020 was as follows:
| Three Months Ended March 31, | |||||||||||
| 2021 | 2020 | ||||||||||
| Management fees | $ | 7,783 | $ | 8,451 | |||||||
| Administrative services expense | 684 | 394 | |||||||||
| Subordinated incentive fee on income | — | 3,308 | |||||||||
| General and administrative | 2,689 | 1,470 | |||||||||
| Interest expense | 7,548 | 10,464 | |||||||||
| Total operating expenses | $ | 18,704 | $ | 24,087 | |||||||
The decrease in subordinated incentive fee on income was primarily due to the decrease in interest income during the three months ended March 31, 2021 as compared to the three months ended March 31, 2020. The decrease in interest expense was primarily the result of a decrease in LIBOR during the three months ended March 31, 2021 as compared to the three months ended March 31, 2020. The decrease in interest expense was also the result of lower average borrowings on our financing arrangements during the three months ended March 31, 2021 as compared to the three months ended March 31, 2020, which also resulted in a decrease in total assets and a decrease in management fees during the three months ended March 31, 2021.
The composition of our general and administrative expenses for the three months ended March 31, 2021 and 2020 was as follows:
| Three Months Ended March 31, | |||||||||||
| 2021 | 2020 | ||||||||||
| Professional fees | $ | 1,265 | $ | 297 | |||||||
| Transfer agent expense | 422 | 395 | |||||||||
| Valuation expense | 252 | 276 | |||||||||
| Accounting and administration costs | 237 | 146 | |||||||||
| Dues and subscriptions | 169 | 82 | |||||||||
| Insurance expense | 132 | 108 | |||||||||
| Director fees and expenses | 103 | 116 | |||||||||
| Printing and marketing expense | 44 | 15 | |||||||||
| Other expenses | 65 | 35 | |||||||||
| Total general and administrative expense | $ | 2,689 | $ | 1,470 | |||||||
Net Investment Income
Our net investment income totaled $17,599 and $21,661 for the three months ended March 31, 2021 and 2020, respectively. The decrease in our investment income during the three months ended March 31, 2021 as compared to the three months ended March 31, 2020 was offset by a decrease in our operating expenses during the same period.
Net Realized Loss on Investments and Foreign Currency
Our net realized loss on investments and foreign currency totaled $(4,128) and $(4,196) for the three months ended March 31, 2021 and 2020, respectively, which were driven primarily by realized losses on the liquidation of our investment in certain portfolio companies during both periods.
63
Net Change in Unrealized Appreciation (Depreciation) on Investments
The net change in unrealized appreciation (depreciation) on our investments totaled $36,243 and $(123,377) for the three months ended March 31, 2021 and 2020, respectively. This change was driven primarily by tightening credit spreads and increased multiples in equity markets during the three months ended March 31, 2021 that positively impacted the fair value of certain of our investments, as compared to the outbreak and spread of COVID-19 around the world during the three months ended March 31, 2020, which caused significant uncertainty and volatility in the U.S. and global economies as well as in the financial and credit markets and negatively impacted the fair value of certain of our investments.
Net Increase (Decrease) in Net Assets Resulting from Operations
For the three months ended March 31, 2021 and 2020, we recorded a net increase (decrease) in net assets resulting from operations of $49,714 and $(105,912), respectively, as a result of our operating activity for the respective periods.
This “Results of Operations” discussion should also be read in conjunction with “Recent Developments - COVID-19” above.
Net Asset Value per Share, Annual Investment Return and Total Return Since Inception
Our net asset value per share was $8.06 and $7.75 on March 31, 2021 and December 31, 2020, respectively. After considering (i) the overall changes in net asset value per share, (ii) paid distributions of approximately $0.1324 per share during the three months ended March 31, 2021, and (iii) the assumed reinvestment of those distributions in accordance with our distribution reinvestment plan then in effect, the total investment return-net asset value was 5.73% for the three-month period ended March 31, 2021. Total investment return-net asset value does not represent and may be higher than an actual return to shareholders because it excludes all sales commissions and dealer manager fees. Total investment return-net asset value is a measure of the change in total value for shareholders who held our common stock at the beginning and end of the period, including distributions paid or payable during the period, and is described further in Note 13 to our consolidated financial statements included in this report.
Initial shareholders who subscribed to the offering in December 2012 with an initial investment of $10,000 and an initial purchase price equal to $9.00 per share (public offering price excluding sales load) have seen an annualized return of 6.70% and a cumulative total return of 71.27% through March 31, 2021 (see chart below). Initial shareholders who subscribed to the offering in December 2012 with an initial investment of $10,000 and an initial purchase price equal to $10.00 per share (the initial public offering price including sales load) have seen an annualized return of 5.36% and a cumulative total return of 54.14% through March 31, 2021. Over the same time period, the S&P/LSTA Leveraged Loan Index, a primary measure of senior debt covering the U.S. leveraged loan market, which currently consists of approximately 1,000 credit facilities throughout numerous industries, recorded an annualized return of 4.20% and a cumulative total return of 40.64%. In addition, the BofA Merrill Lynch US High Yield Index, a primary measure of short-term US dollar denominated below investment grade corporate debt publicly issued in the US domestic market, recorded an annualized return of 5.76% and a cumulative total return of 59.09% over the same period.
64
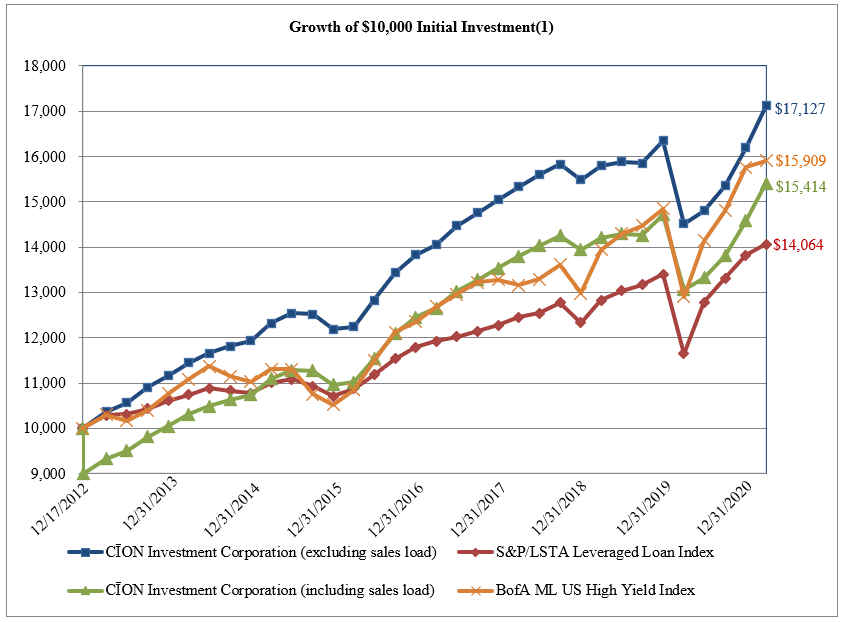
(1) Cumulative performance: December 17, 2012 to March 31, 2021
The calculations for the Growth of $10,000 Initial Investment are based upon (i) an initial investment of $10,000 in our common stock at the beginning of the period, at a share price of $10.00 per share (including sales load) and $9.00 per share (excluding sales load), (ii) assumes reinvestment of monthly distributions in accordance with our distribution reinvestment plan then in effect, (iii) the sale of the entire investment position at the net asset value per share on the last day of the period, and (iv) the distributions declared and payable to shareholders, if any, on the last day of the period.
Financial Condition, Liquidity and Capital Resources
We generate cash primarily from cash flows from interest, fees and dividends earned from our investments as well as principal repayments and proceeds from sales of our investments. We also employ leverage to seek to enhance our returns as market conditions permit and at the discretion of CIM. On March 23, 2018, an amendment to Section 61(a) of the 1940 Act was signed into law to permit BDCs to reduce the minimum "asset coverage" ratio from 200% to 150% and, as a result, to potentially increase the ratio of a BDC's debt to equity from a maximum of 1-to-1 to a maximum of 2-to-1, so long as certain approval and disclosure requirements are satisfied. We intend to seek the approval of our shareholders to reduce our minimum “asset coverage” ratio from 200% to 150% in accordance with the 1940 Act.
The outbreak and spread of COVID-19 have caused severe stress and uncertainty in the U.S. and global economies as well as in the financial and credit markets. Given the uncertainty as to the full severity and duration of the pandemic and its effects on us with respect to our compliance with covenants in our loan facilities with lenders and our borrowers’ ability to timely meet their financial obligations to us, management and our board of directors determined that it was in the best interest of our company and all of our shareholders to take certain steps disclosed below during the three months ended March 31, 2020 that were necessary to improve our cash position and preserve financial flexibility in the short term. This “Financial Condition, Liquidity and Capital Resources” discussion should also be read in conjunction with “Recent Developments - COVID-19” above.
65
On March 19, 2020, our co-chief executive officers determined to (i) change the timing of declaring distributions to shareholders from quarterly to monthly; and (ii) temporarily suspend the payment of distributions to shareholders commencing with the month ended April 30, 2020, whether in cash or pursuant to our distribution reinvestment plan, as amended and restated. On July 15, 2020, our board of directors determined to recommence the payment of distributions to shareholders in August 2020. Distributions in respect of future months will be evaluated by management and our board of directors based on circumstances and expectations existing at the time of consideration.
On March 19, 2020, our board of directors, including the independent directors, also determined to temporarily suspend our share repurchase program commencing with the second quarter of 2020. On November 13, 2020, we recommenced our share repurchase program for the fourth quarter of 2020. Share repurchases for future quarters will be evaluated by our board of directors based on circumstances and expectations existing at the time of consideration.
As of March 31, 2021 and December 31, 2020, we had $87,593 and $73,597 in short term investments, respectively, invested in a fund that primarily invests in U.S. government securities.
JPM Credit Facility
As of March 31, 2021 and May 10, 2021, our outstanding borrowings under the Third Amended JPM Credit Facility were $500,000 and the aggregate unfunded principal amount in connection with the Third Amended JPM Credit Facility was $75,000. For a detailed discussion of our Third Amended JPM Credit Facility, refer to Note 8 to our consolidated financial statements included in this report.
UBS Facility
As of March 31, 2021 and May 10, 2021, our outstanding borrowings under the Amended UBS Facility were $100,000 and the aggregate unfunded principal amount in connection with the Amended UBS Facility was $50,000. For a detailed discussion of our Amended UBS Facility, refer to Note 8 to our consolidated financial statements included in this report.
2026 Notes
As of March 31, 2021 and May 10, 2021, we had $125,000 in aggregate principal amount of 2026 Notes outstanding. For a detailed discussion of our 2026 Notes, refer to Note 8 to our consolidated financial statements included in this report.
More Term Loan
On April 14, 2021, we entered into the More Term Loan. As of May 10, 2021, our outstanding borrowings under the More Term Loan were $30,000 and there was no unfunded principal amount in connection with the More Term Loan. For a detailed discussion of our More Term Loan, refer to Note 14 to our consolidated financial statements included in this report.
Unfunded Commitments
As of March 31, 2021 and May 10, 2021, our unfunded commitments amounted to $75,738 and $79,985, respectively. For a detailed discussion of our unfunded commitments, refer to Note 11 to our consolidated financial statements included in this report.
RIC Status and Distributions
To qualify for and maintain RIC tax treatment, we must, among other things, distribute in respect of each taxable year at least 90% of our net ordinary income and realized net short-term capital gains in excess of realized net long-term capital losses, if any. We will incur certain excise taxes imposed on RICs to the extent we do not distribute in respect of each calendar year an amount at least equal to the sum of (1) 98.0% of our net ordinary income (taking into account certain deferrals and elections) for the calendar year, (2) 98.2% of our capital gains in excess of capital losses, or capital gain net income (adjusted for certain ordinary losses), for the one-year period ending on October 31 of the calendar year and (3) any net ordinary income and capital gain net income from preceding years that were not distributed during such years and on which we paid no federal income tax.
For an additional discussion of our RIC status and distributions, refer to Note 2 and Note 5, respectively, of our consolidated financial statements included in this report.
66
Recent Accounting Pronouncements
See Note 2 to our consolidated financial statements included in this report for a discussion of certain recent accounting pronouncements that are applicable to us.
Critical Accounting Policies
Our consolidated financial statements are prepared in conformity with GAAP, which requires us to make estimates and assumptions that affect the reported amounts of assets and liabilities at the date of the consolidated financial statements and the reported amounts of revenues and expenses during the reporting periods. Critical accounting policies are those that require the application of management’s most difficult, subjective or complex judgments, often because of the need to make estimates about the effect of matters that are inherently uncertain and that may change in subsequent periods. In preparing the consolidated financial statements, we also utilize available information, including our past history, industry standards and the current economic environment, among other factors, in forming our estimates and judgments, giving due consideration to materiality. Actual results may differ from these estimates. In addition, other companies may utilize different estimates, which may impact the comparability of our results of operations to those of companies in similar businesses.
Valuation of Portfolio Investments
The value of our assets is determined quarterly and at such other times that an event occurs that materially affects the valuation. The valuation is made pursuant to Section 2(a)(41) of the 1940 Act, which requires that we value our assets as follows: (i) the market price for those securities for which a market quotation is readily available, and (ii) for all other securities and assets, at fair value, as determined in good faith by our board of directors. As a BDC, Section 2(a)(41) of the 1940 Act requires the board of directors to determine in good faith the fair value of portfolio securities for which a market price is not readily available, and it does so in conjunction with the application of our valuation procedures by CIM.
There is no single standard for determining fair value in good faith. As a result, determining fair value requires that judgment be applied to the specific facts and circumstances of each asset while employing a valuation process that is consistently followed. Determinations of fair value involve subjective judgments and estimates. Accordingly, the notes to our consolidated financial statements refer to the uncertainty with respect to the possible effect of such valuations, and any change in such valuations in our consolidated financial statements.
Valuation Methods
With respect to investments for which market quotations are not readily available, we undertake a multi-step valuation process each quarter, as described below:
•our quarterly valuation process begins with each portfolio company or investment being initially valued by certain of CIM’s investment professionals and certain members of its management team, with such valuation taking into account information received from various sources, including independent valuation firms, if applicable;
•preliminary valuation conclusions are then documented and discussed with members of CIM’s management team;
•designated members of CIM’s management team review the preliminary valuation, and, if applicable, deliver such preliminary valuation to an independent valuation firm for its review;
•designated members of CIM’s management team and, if appropriate, the relevant investment professionals meet with the independent valuation firm to discuss the preliminary valuation;
•designated members of CIM’s management team respond and supplement the preliminary valuation to reflect any comments provided by the independent valuation firm;
•our audit committee meets with members of CIM’s management team and the independent valuation firms to discuss the assistance provided and the results of the independent valuation firms' review; and
•our board of directors discusses the valuation and determines the fair value of each investment in our portfolio in good faith based on various statistical and other factors, including the input and recommendation of CIM, the audit committee and any third-party valuation firm, if applicable.
In addition to the foregoing, certain investments for which a market price is not readily available are evaluated on a quarterly basis by an independent valuation firm and certain other investments are on a rotational basis reviewed by an independent valuation firm. Finally, certain investments are not evaluated by an independent valuation firm unless certain aspects of such investments in the aggregate meet certain criteria.
67
Given the expected types of investments, excluding short term investments and stock of publicly traded companies that are classified as Level 1, management expects our portfolio holdings to be classified as Level 3. Due to the uncertainty inherent in the valuation process, particularly for Level 3 investments, such fair value estimates may differ significantly from the values that would have been used had an active market for the investments existed. In addition, changes in the market environment and other events that may occur over the life of the investments may cause the gains or losses that we ultimately realize on these investments to materially differ from the valuations currently assigned. Inputs used in the valuation process are subject to variability in the future and can result in materially different fair values.
For an additional discussion of our investment valuation process, refer to Note 2 to our consolidated financial statements included in this report.
Related Party Transactions
For a discussion of our relationship with related parties including CION Securities, CIM, CIG, and AIA and amounts incurred under agreements with such related parties, refer to Note 4 to our consolidated financial statements included in this report.
Contractual Obligations
On August 26, 2016, 34th Street entered into the JPM Credit Facility with JPM, as amended and restated on September 30, 2016, July 11, 2017, November 28, 2017, May 23, 2018, May 15, 2020 and February 26, 2021. See Note 8 to our consolidated financial statements for a more detailed description of the JPM Credit Facility.
On May 19, 2017, Murray Hill Funding II entered into the UBS Facility with UBS, as amended on December 1, 2017, May 19, 2020, November 12, 2020 and December 17, 2020. See Note 8 to our consolidated financial statements for a more detailed description of the UBS Facility.
On February 11, 2021, we entered into the Note Purchase Agreement with purchasers of the 2026 Notes. See Note 8 to our consolidated financial statements for a more detailed description of the 2026 Notes.
On April 14, 2021, we entered into the More Term Loan with More. See Note 14 to our consolidated financial statements for a more detailed description of the More Term Loan.
Commitments and Contingencies and Off-Balance Sheet Arrangements
Commitments and Contingencies
We have entered into certain contracts with other parties that contain a variety of indemnifications. Our maximum exposure under these arrangements is unknown. However, we have not experienced claims or losses pursuant to these contracts and believe the risk of loss related to such indemnifications to be remote.
Our investment portfolio may contain debt investments that are in the form of lines of credit, delayed draw term loans, revolving credit facilities, or other unfunded commitments, which may require us to provide funding when requested in accordance with the terms of the underlying agreements. For further details on such debt investments, refer to Note 11 to our consolidated financial statements included in this report.
Off-Balance Sheet Arrangements
We currently have no off-balance sheet arrangements, except for those discussed in Note 11 to our consolidated financial statements included in this report.
68
Item 3. Quantitative and Qualitative Disclosures About Market Risk
We are subject to financial market risks, including changes in interest rates. As of March 31, 2021, 85.1% of our investments paid variable interest rates. A rise in the general level of interest rates can be expected to lead to higher interest rates applicable to our debt investments, especially to the extent that we hold variable rate investments, and to declines in the value of any fixed rate investments we may hold. To the extent that a majority of our investments may be in variable rate investments, an increase in interest rates could make it easier for us to meet or exceed our incentive fee hurdle rate, as defined in our investment advisory agreement, and may result in a substantial increase in our net investment income, and also to the amount of incentive fees payable to CIM with respect to our pre-incentive fee net investment income.
As of March 31, 2021, under the terms of the Third Amended JPM Credit Facility, advances bear interest at a floating rate equal to the three-month LIBOR, plus a spread of 3.10% per year. Pursuant to the terms of the amended UBS Facility, we currently pay a financing fee equal to the three-month LIBOR plus a spread of 3.375% per year. In addition, we may seek to further borrow funds in order to make additional investments. Our net investment income will be impacted, in part, by the difference between the rate at which we borrow funds and the rate at which we invest those funds. As a result, we would be subject to risks relating to changes in market interest rates. In periods of rising interest rates when we have debt outstanding, our cost of funds would increase, which could reduce our net investment income, especially to the extent we hold fixed rate investments. We expect that our long-term investments will be financed primarily with equity and long-term debt. Our interest rate risk management techniques may include various interest rate hedging activities to the extent permitted by the 1940 Act. Adverse developments resulting from changes in interest rates could have a material adverse effect on our business, financial condition and results of operations.
The following table shows the effect over a twelve month period of changes in interest rates on our net interest income, excluding short term investments, assuming no changes in our investment portfolio, the Third Amended JPM Credit Facility or the Amended UBS Facility in effect as of March 31, 2021:
| Basis Point Change in Interest Rates | (Decrease) Increase in Net Interest Income(1) | Percentage Change in Net Interest Income | ||||||||||||
| No change to current base rate (0.19% as of March 31, 2021) | — | — | ||||||||||||
| Up 50 basis points | (1,662) | (1.7) | % | |||||||||||
| Up 100 basis points | (1,478) | (1.5) | % | |||||||||||
| Up 200 basis points | 5,271 | 5.3 | % | |||||||||||
| Up 300 basis points | 12,727 | 12.8 | % | |||||||||||
(1)This table assumes no change in defaults or prepayments by portfolio companies over the next twelve months.
The interest rate sensitivity analysis presented above does not consider the potential impact of the changes in fair value of our fixed rate debt investments, our fixed rate borrowings (the 2026 Notes and the More Term Loan), or the net asset value of our common stock in the event of sudden changes in interest rates. Approximately 8.4% of our investments paid fixed interest rates as of March 31, 2021. Rising market interest rates will most likely lead to fair value declines for fixed interest rate investments and fixed interest rate borrowings and a decline in the net asset value of our common stock, while declining market interest rates will most likely lead to an increase in the fair value of fixed interest rate investments and fixed interest rate borrowings and an increase in the net asset value of our common stock.
In addition, we may have risk regarding portfolio valuation as discussed in Note 2 to our consolidated financial statements included in this report.
Item 4. Controls and Procedures
Evaluation of disclosure controls and procedures
In connection with the preparation of this Quarterly Report on Form 10-Q for the three months ended March 31, 2021, we carried out an evaluation, under the supervision and with the participation of our management, including our Co-Chief Executive Officers and our Chief Financial Officer, of the effectiveness of the design and operation of our disclosure controls and procedures as of the end of the period covered by this report pursuant to Rule 13a-15(b) and Rule 15d-15(b) of the Securities Exchange Act of 1934, as amended. Based on the foregoing evaluation, the Co-Chief Executive Officers and the Chief Financial Officer concluded that our disclosure controls and procedures were effective.
69
In designing and evaluating our disclosure controls and procedures, we recognized that disclosure controls and procedures, no matter how well conceived and operated, can provide only reasonable, not absolute, assurance that the objectives of the disclosure controls and procedures are met. Our disclosure controls and procedures have been designed to meet reasonable assurance standards. Disclosure controls and procedures cannot detect or prevent all error and fraud. Some inherent limitations in disclosure controls and procedures include costs of implementation, faulty decision-making, simple error and mistake. Additionally, controls can be circumvented by the individual acts of some persons, by collusion of two or more people, or by management override of the controls. The design of any system of controls is based, in part, upon certain assumptions about the likelihood of future events, and there can be no assurance that any design will succeed in achieving its stated goals under all anticipated and unanticipated future conditions. Over time, controls may become inadequate because of changes in conditions, or the degree of compliance with established policies or procedures.
Evaluation of internal control over financial reporting
There have been no changes in our internal control over financial reporting during the three months ended March 31, 2021 that have materially affected, or are reasonably likely to materially affect, our internal control over financial reporting.
70
PART II - OTHER INFORMATION
Item 1. Legal Proceedings
We are not currently subject to any material legal proceedings, nor, to our knowledge, is any material legal proceeding threatened against us. From time to time, we may be party to certain legal proceedings in the ordinary course of business, including proceedings relating to the enforcement of our rights under contracts with our portfolio companies and other third parties. While the outcome of these legal proceedings cannot be predicted with certainty, we do not expect that any such proceedings will have a material effect upon our financial condition or results of operations.
Item 1A. Risk Factors
There have been no material changes from the risk factors disclosed in “Item 1A. Risk Factors” of our Annual Report on Form 10-K for the year ended December 31, 2020.
Item 2. Unregistered Sales of Equity Securities and Use of Proceeds
We did not engage in any unregistered sales of equity securities during the three months ended March 31, 2021.
The table below provides information concerning our repurchases of shares of our common stock during the three months ended March 31, 2021 pursuant to our share repurchase program.
| Period | Total Number of Shares Purchased | Average Price Paid per Share | Total Number of Shares Purchased as Part of Publicly Announced Plans or Programs | Maximum Number of Shares That May Yet Be Purchased Under the Plans or Programs | ||||||||||||||||||||||
| January 1 to January 31, 2021 | — | $ | — | — | — | |||||||||||||||||||||
| February 1 to February 28, 2021 | — | — | — | — | ||||||||||||||||||||||
| March 1 to March 31, 2021 | 675,440 | 7.83 | 675,440 | (1) | ||||||||||||||||||||||
| Total | 675,440 | $ | 7.83 | 675,440 | (1) | |||||||||||||||||||||
(1)A description of the maximum number of shares of our common stock that may be repurchased is set forth in a detailed discussion of the terms of our share repurchase program in Note 3 to our unaudited consolidated financial statements contained in this Quarterly Report on Form 10-Q.
Item 3. Defaults Upon Senior Securities
Not applicable.
Item 4. Mine Safety Disclosures
Not applicable.
Item 5. Other Information
Not applicable.
71
Item 6. Exhibits
| Exhibit Number | Description of Document | |||||||
| 2.1 | ||||||||
| 3.1 | ||||||||
| 3.2 | ||||||||
| 4.1 | ||||||||
| 4.2 | ||||||||
| 4.3 | ||||||||
| 10.1 | ||||||||
| 10.2 | ||||||||
| 10.3 | Third Amended and Restated Expense Support and Conditional Reimbursement Agreement, dated as of December 9, 2020, by and between CĪON Investment Corporation and CION Investment Management, LLC (Incorporated by reference to Exhibit 10.1 to the Registrant’s Current Report on Form 8-K filed with the SEC on December 15, 2020 (File No. 814-00941)). | |||||||
| 10.4 | ||||||||
| 10.5 | ||||||||
| 10.6 | ||||||||
| 10.7 | ||||||||
| 10.8 | ||||||||
| 10.9 | ||||||||
| 10.10 | ||||||||
72
| Exhibit Number | Description of Document | |||||||
| 10.11 | ||||||||
| 10.12 | ||||||||
| 10.13 | ||||||||
| 10.14 | ||||||||
| 10.15 | ||||||||
| 10.16 | ||||||||
| 10.17 | ||||||||
| 10.18 | ||||||||
| 10.19 | ||||||||
| 10.20 | ||||||||
| 10.21 | ||||||||
| 10.22 | ||||||||
| 10.23 | ||||||||
| 10.24 | ||||||||
73
| Exhibit Number | Description of Document | |||||||
| 10.25 | ||||||||
| 10.26 | ||||||||
| 10.27 | ||||||||
| 10.28 | ||||||||
| 10.29 | ||||||||
| 10.30 | ||||||||
| 10.31 | ||||||||
| 10.32 | ||||||||
| 10.33 | ||||||||
| 31.1 | ||||||||
| 31.2 | ||||||||
| 31.3 | ||||||||
| 32.1 | ||||||||
| 32.2 | ||||||||
| 32.3 | ||||||||
74
SIGNATURES
Pursuant to the requirements of the Securities Exchange Act of 1934, the registrant has duly caused this report to be signed on its behalf by the undersigned, thereunto duly authorized.
Date: May 14, 2021
CĪON Investment Corporation
(Registrant)
By: /s/ Michael A. Reisner | ||
| Michael A. Reisner | ||
Co-Chief Executive Officer | ||
(Principal Executive Officer) | ||
By: /s/ Mark Gatto | ||
| Mark Gatto | ||
Co-Chief Executive Officer | ||
(Principal Executive Officer) | ||
By: /s/ Keith S. Franz | ||
Keith S. Franz | ||
| Chief Financial Officer | ||
| (Principal Financial and Accounting Officer) | ||
75
Exhibit 31.1
CERTIFICATION OF CO-CHIEF EXECUTIVE OFFICER
PURSUANT TO SECTION 302 OF THE SARBANES-OXLEY ACT OF 2002
I, Michael A. Reisner, certify that:
1.I have reviewed this Quarterly Report on Form 10-Q of CĪON Investment Corporation;
2.Based on my knowledge, this report does not contain any untrue statement of a material fact or omit to state a material fact necessary to make the statements made, in light of the circumstances under which such statements were made, not misleading with respect to the period covered by this report;
3.Based on my knowledge, the financial statements, and other financial information included in this report, fairly present in all material respects the financial condition, results of operations and cash flows of the registrant as of, and for, the periods presented in this report;
4.I am responsible for establishing and maintaining disclosure controls and procedures (as defined in Exchange Act Rules 13a-15(e) and 15d-15(e)) and internal control over financial reporting (as defined in Exchange Act Rules 13a-15(f) and 15d-15(f)) for the registrant and have:
(a)designed such disclosure controls and procedures, or caused such disclosure controls and procedures to be designed under my supervision, to ensure that material information relating to the registrant, including its consolidated subsidiaries, is made known to me by others within those entities, particularly during the period in which this report is being prepared;
(b)designed such internal control over financial reporting, or caused such internal control over financial reporting to be designed under my supervision, to provide reasonable assurance regarding the reliability of financial reporting and the preparation of financial statements for external purposes in accordance with generally accepted accounting principles;
(c)evaluated the effectiveness of the registrant's disclosure controls and procedures and presented in this report my conclusions about the effectiveness of the disclosure controls and procedures, as of the end of the period covered by this report based on such evaluation; and
(d)disclosed in this report any change in the registrant’s internal control over financial reporting that occurred during the registrant’s most recent fiscal quarter (the registrant’s fourth fiscal quarter in the case of an annual report) that has materially affected, or is reasonably likely to materially affect, the registrant’s internal control over financial reporting; and
5.I have disclosed, based on my most recent evaluation of internal control over financial reporting, to the registrant's auditors and the audit committee of the registrant's board of directors (or persons performing the equivalent functions):
(a)all significant deficiencies and material weaknesses in the design or operation of internal control over financial reporting which are reasonably likely to adversely affect the registrant's ability to record, process, summarize and report financial information; and
(b)any fraud, whether or not material, that involves management or other employees who have a significant role in the registrant's internal control over financial reporting.
Date: May 14, 2021
/s/ Michael A. Reisner
Michael A. Reisner
Co-Chief Executive Officer
(Principal Executive Officer)
CĪON Investment Corporation
Exhibit 31.2
CERTIFICATION OF CO-CHIEF EXECUTIVE OFFICER
PURSUANT TO SECTION 302 OF THE SARBANES-OXLEY ACT OF 2002
I, Mark Gatto, certify that:
1.I have reviewed this Quarterly Report on Form 10-Q of CĪON Investment Corporation;
2.Based on my knowledge, this report does not contain any untrue statement of a material fact or omit to state a material fact necessary to make the statements made, in light of the circumstances under which such statements were made, not misleading with respect to the period covered by this report;
3.Based on my knowledge, the financial statements, and other financial information included in this report, fairly present in all material respects the financial condition, results of operations and cash flows of the registrant as of, and for, the periods presented in this report;
4.I am responsible for establishing and maintaining disclosure controls and procedures (as defined in Exchange Act Rules 13a-15(e) and 15d-15(e)) and internal control over financial reporting (as defined in Exchange Act Rules 13a-15(f) and 15d-15(f)) for the registrant and have:
(a)designed such disclosure controls and procedures, or caused such disclosure controls and procedures to be designed under my supervision, to ensure that material information relating to the registrant, including its consolidated subsidiaries, is made known to me by others within those entities, particularly during the period in which this report is being prepared;
(b)designed such internal control over financial reporting, or caused such internal control over financial reporting to be designed under my supervision, to provide reasonable assurance regarding the reliability of financial reporting and the preparation of financial statements for external purposes in accordance with generally accepted accounting principles;
(c)evaluated the effectiveness of the registrant's disclosure controls and procedures and presented in this report my conclusions about the effectiveness of the disclosure controls and procedures, as of the end of the period covered by this report based on such evaluation; and
(d)disclosed in this report any change in the registrant’s internal control over financial reporting that occurred during the registrant’s most recent fiscal quarter (the registrant’s fourth fiscal quarter in the case of an annual report) that has materially affected, or is reasonably likely to materially affect, the registrant’s internal control over financial reporting; and
5.I have disclosed, based on my most recent evaluation of internal control over financial reporting, to the registrant's auditors and the audit committee of the registrant's board of directors (or persons performing the equivalent functions):
(a)all significant deficiencies and material weaknesses in the design or operation of internal control over financial reporting which are reasonably likely to adversely affect the registrant's ability to record, process, summarize and report financial information; and
(b)any fraud, whether or not material, that involves management or other employees who have a significant role in the registrant's internal control over financial reporting.
Date: May 14, 2021
/s/ Mark Gatto
Mark Gatto
Co-Chief Executive Officer
(Principal Executive Officer)
CĪON Investment Corporation
Exhibit 31.3
CERTIFICATION OF CHIEF FINANCIAL OFFICER
PURSUANT TO SECTION 302 OF THE SARBANES-OXLEY ACT OF 2002
I, Keith S. Franz, certify that:
1.I have reviewed this Quarterly Report on Form 10-Q of CĪON Investment Corporation;
2.Based on my knowledge, this report does not contain any untrue statement of a material fact or omit to state a material fact necessary to make the statements made, in light of the circumstances under which such statements were made, not misleading with respect to the period covered by this report;
3.Based on my knowledge, the financial statements, and other financial information included in this report, fairly present in all material respects the financial condition, results of operations and cash flows of the registrant as of, and for, the periods presented in this report;
4.I am responsible for establishing and maintaining disclosure controls and procedures (as defined in Exchange Act Rules 13a-15(e) and 15d-15(e)) and internal control over financial reporting (as defined in Exchange Act Rules 13a-15(f) and 15d-15(f)) for the registrant and have:
(a)designed such disclosure controls and procedures, or caused such disclosure controls and procedures to be designed under my supervision, to ensure that material information relating to the registrant, including its consolidated subsidiaries, is made known to me by others within those entities, particularly during the period in which this report is being prepared;
(b)designed such internal control over financial reporting, or caused such internal control over financial reporting to be designed under my supervision, to provide reasonable assurance regarding the reliability of financial reporting and the preparation of financial statements for external purposes in accordance with generally accepted accounting principles;
(c)evaluated the effectiveness of the registrant's disclosure controls and procedures and presented in this report my conclusions about the effectiveness of the disclosure controls and procedures, as of the end of the period covered by this report based on such evaluation; and
(d)disclosed in this report any change in the registrant’s internal control over financial reporting that occurred during the registrant’s most recent fiscal quarter (the registrant’s fourth fiscal quarter in the case of an annual report) that has materially affected, or is reasonably likely to materially affect, the registrant’s internal control over financial reporting; and
5. I have disclosed, based on my most recent evaluation of internal control over financial reporting, to the registrant’s auditors and the audit committee of the registrant’s board of directors (or persons performing the equivalent functions):
(a)all significant deficiencies and material weaknesses in the design or operation of internal control over financial reporting which are reasonably likely to adversely affect the registrant's ability to record, process, summarize and report financial information; and
(b)any fraud, whether or not material, that involves management or other employees who have a significant role in the registrant's internal control over financial reporting.
Date: May 14, 2021
/s/ Keith S. Franz
Keith S. Franz
Chief Financial Officer
(Principal Financial and Accounting Officer)
CĪON Investment Corporation
Exhibit 32.1
CERTIFICATION OF CO-CHIEF EXECUTIVE OFFICER
PURSUANT TO 18 U.S.C. SECTION 1350,
AS ADOPTED PURSUANT TO
SECTION 906 OF THE SARBANES-OXLEY ACT OF 2002
I, Michael A. Reisner, Co-Chief Executive Officer, in connection with the Quarterly Report of CĪON Investment Corporation (the "Company") on Form 10-Q for the quarter ended March 31, 2021, as filed with the Securities and Exchange Commission on the date hereof (the “Quarterly Report”), certify, pursuant to Section 906 of the Sarbanes-Oxley Act of 2002, that:
1.The Quarterly Report fully complies with the requirements of Section 13(a) or 15(d) of the Securities Exchange Act of 1934, as amended; and
2.The information contained in the Quarterly Report fairly presents, in all material respects, the financial condition and results of operations of the Company.
Date: May 14, 2021
/s/ Michael A. Reisner
Michael A. Reisner
Co-Chief Executive Officer
(Principal Executive Officer)
CĪON Investment Corporation
Exhibit 32.2
CERTIFICATION OF CO-CHIEF EXECUTIVE OFFICER
PURSUANT TO 18 U.S.C. SECTION 1350,
AS ADOPTED PURSUANT TO
SECTION 906 OF THE SARBANES-OXLEY ACT OF 2002
I, Mark Gatto, Co-Chief Executive Officer, in connection with the Quarterly Report of CĪON Investment Corporation (the “Company”) on Form 10-Q for the quarter ended March 31, 2021, as filed with the Securities and Exchange Commission on the date hereof (the “Quarterly Report”), certify, pursuant to Section 906 of the Sarbanes-Oxley Act of 2002, that:
1.The Quarterly Report fully complies with the requirements of Section 13(a) or 15(d) of the Securities Exchange Act of 1934, as amended; and
2.The information contained in the Quarterly Report fairly presents, in all material respects, the financial condition and results of operations of the Company.
Date: May 14, 2021
/s/ Mark Gatto
Mark Gatto
Co-Chief Executive Officer
(Principal Executive Officer)
CĪON Investment Corporation
Exhibit 32.3
CERTIFICATION OF CHIEF FINANCIAL OFFICER
PURSUANT TO 18 U.S.C. SECTION 1350,
AS ADOPTED PURSUANT TO
SECTION 906 OF THE SARBANES-OXLEY ACT OF 2002
I, Keith S. Franz, Chief Financial Officer, in connection with the Quarterly Report of CĪON Investment Corporation (the “Company”) on Form 10-Q for the quarter ended March 31, 2021, as filed with the Securities and Exchange Commission on the date hereof (the “Quarterly Report”), certify, pursuant to Section 906 of the Sarbanes-Oxley Act of 2002, that:
1.The Quarterly Report fully complies with the requirements of Section 13(a) or 15(d) of the Securities Exchange Act of 1934, as amended; and
2.The information contained in the Quarterly Report fairly presents, in all material respects, the financial condition and results of operations of the Company.
Date: May 14, 2021
/s/ Keith S. Franz
Keith S. Franz
Chief Financial Officer
(Principal Financial and Accounting Officer)
CĪON Investment Corporation
Serious News for Serious Traders! Try StreetInsider.com Premium Free!
You May Also Be Interested In
- Helo Corp Announces Annual 2023 Results
- Asante Announces Correction to Press Release
- Invitae Enters into Agreement with Labcorp for Sale of Business
Create E-mail Alert Related Categories
SEC FilingsSign up for StreetInsider Free!
Receive full access to all new and archived articles, unlimited portfolio tracking, e-mail alerts, custom newswires and RSS feeds - and more!
