

Form 424B3 New Frontier Health Corp
 Tweet
Tweet Share
Share
| Filed pursuant to rule 424(b)(3) | |
| Registration No. 333-236079 |
Prospectus Supplement No. 3
(to Prospectus dated April 8, 2020)
NEW FRONTIER HEALTH CORPORATION
Primary Offering of
26,875,000 Ordinary Shares
Secondary Offering of
127,341,048 Ordinary Shares
12,500,000 Warrants
This Prospectus Supplement No. 3 supplements our Prospectus dated April 8, 2020 (the “Prospectus”) that forms a part of our Registration Statement on Form F-1 (File No. 333-236079). This Prospectus Supplement No. 3 is being filed to update and supplement certain information contained in the Prospectus with the information contained in our Current Report on Form 6-K filed with the U.S. Securities and Exchange Commission on December 2, 2020 (the “Current Report”). Accordingly, we have attached the Current Report to this Prospectus Supplement.
This Prospectus Supplement No. 3 should be read in conjunction with the Prospectus, which is required to be delivered with this Prospectus Supplement. If there is any inconsistency between the information in the Prospectus and this Prospectus Supplement, you should rely on the information in this Prospectus Supplement.
These securities involve a high degree of risk. You should carefully consider the risks identified under the caption “Risk Factors” beginning on Page 12 of the Prospectus and under similar headings in any amendments or supplements to the Prospectus.
Neither the Securities and Exchange Commission nor any state securities commission has approved or disapproved of any of these securities or passed upon the adequacy or accuracy of the Prospectus or this Prospectus Supplement. Any representation to the contrary is a criminal offense.
The date of this Prospectus Supplement is December 2, 2020.
FORM 6-K
SECURITIES AND EXCHANGE COMMISSION
Washington, D.C. 20549
Report of Foreign Private Issuer
Pursuant to Rule 13a-16 or 15d-16 of
the Securities Exchange Act of 1934
For the month of December, 2020
Commission File Number: 001-38562
NEW FRONTIER
HEALTH CORPORATION
(Translation of Registrant’s Name into English)
10 Jiuxianqiao Road,
Hengtong Business Park
B7 Building, 1/F
Chaoyang District, 100015
Beijing, China
(Address of principal executive office)
Indicate by check mark whether the registrant files or will file annual reports under cover of Form 20-F or Form 40-F: Form 20-F x Form 40-F ¨
Indicate by check mark if the registrant is submitting the Form 6-K in paper as permitted by Regulation S-T Rule 101(b)(1): Yes ¨ No x
Indicate by check mark if the registrant is submitting the Form 6-K in paper as permitted by Regulation S-T Rule 101(b)(7): Yes ¨ No x
INFORMATION CONTAINED IN THIS FORM 6-K REPORT
Attached as Exhibits 99.1 and 99.2 hereto are the earnings release issued by New Frontier Health Corporation (the “Company”) announcing its financial results for the third quarter ended September 30, 2020 and associated investor presentation, respectively.
Exhibits 99.1 and 99.2 to this Report on Form 6-K shall not be deemed “filed” for purposes of Section 18 of the Securities Exchange Act of 1934, as amended, (the “Exchange Act”) or otherwise subject to the liabilities of that section, nor shall they be deemed incorporated by reference in any filing under the Securities Act of 1933, as amended, or the Exchange Act.
EXHIBIT INDEX
| Exhibit | Description of Exhibit |
| 99.1 | Earnings Release. |
| 99.2 | Investor Presentation. |
SIGNATURES
Pursuant to the requirements of the Securities Exchange Act of 1934, as amended, the registrant has duly caused this report to be signed on its behalf by the undersigned, thereunto duly authorized.
| New Frontier Health Corporation | ||
| By: | /s/ Roberta Lipson | |
| Name: Roberta Lipson | ||
| Title: Chief Executive Officer | ||
Date: December 2, 2020
Exhibit 99.1
New Frontier Health Corporation Announces Third Quarter 2020 Financial Results
BEIJING, China, December 2, 2020 /Business Wire/ -- New Frontier Health Corporation (“NFH” or the “Company”) (NYSE: NFH), operator of the premium healthcare services provider United Family Healthcare (“UFH"), today announced its unaudited financial results for the third quarter ended September 30, 2020.
Financial and Operating Highlights1
All comparisons made on both a year-over-year (“yoy”) and quarter-on-quarter (“qoq”) basis. 2
Third Quarter 2020 Highlights:
| · | Revenue increased by 3.7% yoy to RMB626.6 million from RMB603.9 million and increased by 14.1% from the prior quarter, as revenue continued to recover since the initial outbreak of the COVID-19 pandemic in February. |
| · | Adjusted EBITDA (before IFRS 16 adoption)3 increased by 162.8% yoy to RMB89.9 million from RMB34.2 million and increased by 66.6% from the prior quarter. The increase was primarily due to revenue recovery and continued implementation of cost savings initiatives, as well as strong revenue ramp-up from Tier 1 expansion assets. |
| · | Net loss decreased to RMB69.8 million from RMB79.3 million in the prior quarter, representing a decrease from RMB86.3 million in the prior year period. Despite an increase in finance expenses to RMB61.8 million from RMB33.7 million in the prior year period as a result of the Company’s Senior Secured Term Loan, net loss continued to narrow primarily due to increased patient volume and strong revenue growth month-over-month in the third quarter of 2020, continued implementation of cost-saving initiatives, and other cost reductions as a benefit of government policies enacted in response to the COVID-19 pandemic. |
| · | Tier 1 Operating Assets: revenue increased by 2.1% yoy to RMB446.2 million from RMB436.9 million and increased by 16.7% qoq. Adjusted EBITDA (before IFRS 16 adoption) increased by 14.7% yoy to RMB126.1 million from RMB109.9 million and increased by 27.9% qoq. The yoy increases in revenue and Adjusted EBITDA were primarily attributable to steady recovery of patient volume across various specialties and continued implementation of cost controls. |
| Tier 2 Operating and Other Assets: revenue decreased by 14.4% yoy to RMB79.6 million from RMB93.0 million, as patient volume impacted by lower birth rates in 2020 and lower paediatric patient volume observed across China. Adjusted EBITDA (before IFRS 16 adoption) increased to RMB3.9 million from RMB2.3 million, primarily due to the gradual recovery of patient volume and implementation of cost controls. |
| · | Expansion Assets: revenue increased by 36.0% yoy to RMB100.7 million from RMB74.0 million due to strong growth of the new hospitals in Guangzhou and Pudong, Shanghai. Adjusted EBITDA (before IFRS 16 adoption) increased by 67.8% yoy to RMB(12.9) million from RMB(40.0) million. |
| · | Outpatient visits decreased by 0.5% yoy to 152,951 from 153,667 and increased by 21.7% qoq. |
| · | Inpatient admissions decreased by 15.1% yoy to 2,210 from 2,604 and increased by 7.3% qoq. |
| · | Bed utilization rate* decreased to 33.7% yoy from 39.4% due to lower inpatient admissions and expanded bed capacity from new hospitals. |
| · | ASP: outpatient ASP increased by 9.4% yoy and inpatient ASP increased by 15.2% yoy due to an increase in the number of higher acuity services provided at the Company’s facilities. |
* Bed utilization is calculated based on the weighted average maximum bed capacity for the period.
1 As a result of the adoption of International Financial Reporting Standard 16 (“IFRS 16”), effective January 1, 2019, related lease expenses have been reflected in depreciation and amortization expenses and finance costs. Segment revenue and Adjusted EBITDA (before IFRS 16 adoption) are presented for the purposes of comparison with prior years. The financial statements have been translated into United States dollars for convenience purposes at a rate of RMB6.7896 to US$1.00, the exchange rate on September 30, 2020, set forth in the H.10 statistical release of the Federal Reserve Board.
2 The Company acquired UFH in a business combination that closed on December 18, 2019. The financial results for the three and nine months ended September 30, 2019 presented herein are those of the Company’s wholly owned subsidiary, Healthy Harmony Holdings, L.P. (the “Predecessor”), while the financial results for the three and nine months ended September 30, 2020, presented herein are those of the combined Company (the “Successor”).
3 Adjusted EBITDA (before IFRS 16 adoption) is a non-IFRS performance measure. See “Non-IFRS Financial Measures” for a reconciliation of Adjusted EBITDA to its most comparable financial measure calculated in accordance with IFRS.
“We are pleased to see strong sequential revenue growth in the third quarter,” said Mr. Antony Leung, Chairman of NFH. “Despite restrictions related to COVID-19, our business continued to recover as our volumes for outpatient visits and inpatient admissions continued to grow from last quarter, mainly as a result of increased demand from the Chinese patient population. Under the leadership of the new combined management team, we are pleased to report significant improvement in Adjusted EBITDA profitability. Over the last several months, we have seen rapid growth in our Chinese patient base. At the same time, as domestic travel restrictions continue to ease and international borders open on a controlled basis, we expect foreign patient volumes to improve as well. In the event there is another wave of the COVID-19 outbreak during the winter, we believe that NFH is well prepared with strict internal controls to protect patients and staff. As we continue to expand our capabilities to withstand future outbreaks, we remain confident in our Company and expect to be able to continue to execute our operational and strategic plans to provide sustainable growth for our shareholders.”
Ms. Roberta Lipson, Chief Executive Officer of NFH and founder of UFH, commented, “We are optimistic about our ongoing recovery trend in the third quarter as demonstrated by the increase in both outpatient and inpatient numbers from the prior quarter. We are also pleased with several important developments in recent months. Our recent collaboration with Shandong University Qilu Hospital allows us to enhance our service offerings in the Qingdao United Family Hospital (“QDU”), providing patients with a deeper bench of medical specialty talent and options of faster access and more personalized care at United Family for traditional public hospital patients. Also, our hospital in Guangzhou reported positive Adjusted EBITDA for the first time in May after only 21 months of operation and is expected to contribute regularly to our Adjusted EBITDA performance moving forward. Additionally, in August, our Shanghai United Family Hospital (“PXU”) performed its first percutaneous coronary intervention (PCI) procedure in its state-of-the-art hybrid operating room, demonstrating the leading techniques of our PXU clinical team. We continue to add new talent to our medical team to provide more in-depth clinical guidance and enhanced services to our patients as demonstrated by the increase in our high acuity procedures.”
Ms. Lipson continued, “Looking ahead, we remain focused on working closely with multi-national corporations, state-owned enterprises, schools and embassies to minimize COVID risk and meet society’s COVID-19 testing needs while continuing to expand our service capabilities. We remain committed to optimizing our business performance and delivering long-term value to our shareholders.”
Third Quarter 2020 Results
For management purposes, the Company is organized into business units based on the category and stage of development of the Company’s healthcare facilities and geographic locations. There are three reportable operating segments, as follows:
(a) Tier 1 Operating Assets: the existing general healthcare facilities located in tier 1 cities in China, such as Beijing United Family Hospital (“BJU”), Shanghai United Family Hospital (“PXU”), and their associated clinics.
(b) Tier 2 Operating and Other Assets: the existing general healthcare facilities located in tier 2 cities in China, such as Tianjin United Family Hospital (“TJU”), Qingdao United Family Hospital (“QDU”), and other assets, such as a Beijing United Family Rehabilitation Hospital (“Rehab”) and other clinic assets.
(c) Expansion Assets: the facilities recently opened or about to open including Shanghai Xincheng United Family Hospital (“PDU”), Guangzhou United Family Hospital (“GZU”), and Beijing Jingbei Women and Children’s United Family Hospital (“DTU”).
| Revenue (RMB mm) | 3Q19 | 3Q20 | Y-o-y Change % | Q-o-q Change % |
| Tier 1 Operating Assets (1) | 436.9 | 446.2 | 2.1% | 16.7% |
| Tier 2 Operating and Other Assets (3) | 93.0 | 79.6 | -14.4% | 2.7% |
| Operating Assets(4) | 529.9 | 525.8 | -0.8% | 14.4% |
| Expansion Assets(5) | 74.0 | 100.7 | 36.0% | 13.0% |
| Total | 603.9 | 626.6 | 3.7% | 14.1% |
| (1) | Tier 1 Operating Assets: revenue from UFH’s tier 1 facilities and their associated clinics increased by 2.1% yoy due to double digit revenue growth yoy in various specialties such as family medicine, internal medicine, surgery, and orthopaedics, however, Tier 1 Operating Assets were also impacted by lower obstetrics revenue due to low birth rates in 2020 and lower revenue from paediatrics comparing to 2019 Revenue increased by 16.7% qoq due to strong revenue recovery in Beijing following the second wave of the COVID-19 outbreak there in June and an increase in demand for non-emergency medical services. Both BJU and PXU, as well as their associated clinics, achieved double digit revenue growth qoq. |
| (2) | Tier 2 Operating and Other Assets: revenue from UFH’s tier 2 facilities and other assets, as a group, decreased by 14.4% yoy and increased by 2.7% qoq due to the gradual recovery of patient volume and an increase in demand for non-emergency medical services. Despite strong revenue growth yoy in specialties including internal medicine, family medicine, emergency medicine, overall revenue for tier 2 facilities is still in the process of recovering to last year’s level due to higher revenue contribution from obstetrics and paediatrics. |
| (3) | Total Operating Assets: UFH’s operating assets, as a group, decreased by 0.8% yoy and increased by 14.4% qoq due to recovery of patient volume and an increase in demand for non-emergency medical services. |
| (4) | Expansion Assets: UFH’s GZU and PDU facilities were formally launched with complete practice licenses4 in the fourth quarter of 2018. As a result of increased brand recognition and new patient uptick at GZU and PDU, revenue for UFH’s expansion assets, as a group, increased to RMB100.7 million in the third quarter of 2020 from RMB74.0 million in the third quarter of 2019. GZU recorded revenue growth of 45.6% yoy and PDU 37.6% yoy. In addition, since opening, both GZU and PDU gradually developed their higher acuity services, which has contributed significantly to revenue growth in the third quarter of 2020 and a qoq increase of 13.0%. |
| Adjusted EBITDA (before IFRS 16 adoption) (RMB mm) | |||||
| 3Q19 | 3Q20 | Y-o-Y Change % | Q-o-q Change % | ||
| Adjusted EBITDA (before IFRS 16 adoption) | |||||
| Tier 1 Operating Assets(1) | 109.9 | 126.1 | 14.7% | 27.9% | |
| Tier 2 Operating and Other Assets(2) | 2.3 | 3.9 | 70.7% | 10.3% | |
| Operating Assets(3) | 112.2 | 130.0 | 15.8% | 27.3% | |
| Expansion Assets(4) | -40.0 | -12.9 | 67.8% | 33.7% | |
| Unallocated Cost | -37.9 | -27.2 | 28.4% | 5.4% | |
| Total Adjusted EBITDA (before IFRS 16 adoption)(5) | 34.2 | 89.9 | 162.8% | 66.6% | |
| (1) | Tier 1 Operating Assets: BJU, PXU, and their associated clinics, achieved Adjusted EBITDA (before IFRS 16 adoption) of RMB126.1 million in the third quarter of 2020, an increase of 14.7% yoy and 27.9% qoq due to revenue recovery and implementation of cost control measures. |
| (2) | Tier 2 Operating and Other Assets: TJU, Rehab, and QDU achieved Adjusted EBITDA (before IFRS 16 adoption) of RMB3.9 million in the third quarter of 2020 compared to RMB2.3 million in the third quarter of 2019, primarily attributable to the implementation of cost control measures. |
| (3) | Total Operating Assets: UFH’s operating assets, as a group, achieved Adjusted EBITDA (before IFRS 16 adoption) increase of 15.8% yoy to RMB130.0 million in the third quarter of 2020, an increase of 27.3% qoq, primarily due to strong revenue recovery and implementation of cost control measures. |
| (4) | Expansion Assets: expansion assets, as a group, experienced an increase in Adjusted EBITDA (before IFRS 16 adoption) to RMB(12.9) million in the third quarter of 2020, an improvement from RMB(40.0) million in the third quarter of 2019, due to strong revenue growth. Adjusted EBITDA (before IFRS 16 adoption) for GZU reached breakeven for five consecutive months, beginning in May. |
| (5) | Total Adjusted EBITDA (before IFRS 16 adoption) for the third quarter of 2020 was RMB89.9 million compared to RMB34.2 million in the prior year period, primarily due to revenue recovery, strong ramp-up of expansion assets, and implementation of cost control measures. |
4 Complete practicing licenses means after receiving the formal approval of practicing license for medical institutions and obstetrics operating license
| Key Operating Metrics | 3Q2019 | 3Q2020 | Y-o-Y Change % | Q-o-q Change % | |||||||
| Outpatient Volume |
Inpatient Admission |
Outpatient Volume | Inpatient Admission | Outpatient Volume | Inpatient Admission | Outpatient Volume | Inpatient Admission | ||||
| Tier 1 Operating Assets | 114,626 | 1,598 | 109,639 | 1,293 | -4.4% | -19.1% | 22.6% | 7.4% | |||
| Tier 2 Operating and Other Assets | 21,782 | 614 | 21,232 | 428 | -2.5% | -30.3% | 15.2% | -4.9% | |||
| Operating Assets(1) | 136,408 | 2,212 | 130,871 | 1,721 | -4.1% | -22.2% | 21.3% | 4.1% | |||
| Expansion Assets(2) | 17,259 | 392 | 22,080 | 489 | 27.9% | 24.7% | 23.6% | 20.7% | |||
| Total UFH | 153,667 | 2,604 | 152,951 | 2,210 | -0.5% | -15.1% | 21.7% | 7.3% | |||
| (1) | Operating Assets (Tier 1 and Tier 2): the yoy decline of both inpatient and outpatient volume was primarily due to circumstances related to the COVID-19 pandemic, as patients postponed or cancelled non-emergency medical services. Following the downgrade of the emergency response to Beijing’s second wave of COVID-19 cases in June, outpatient volumes began to recover gradually in August. By September, total outpatient volume of operating assets had recovered to the same level as in the same month in the prior year. Inpatient volume continued to be affected as the Company was encouraged to delay non-emergency and elective procedures. The yoy decline in inpatient admission was attributable to 1) lower admissions in obstetrics department due to nation-wide low birth rates in 2020, and 2) lower admissions in the paediatrics department throughout UFH’s facilities, as schools remained closed and enhanced personal hygiene and protective measures for school children were implemented. However, the Company continued to see strong yoy growth in other departments, such as family medicine, dental, internal medicine, surgery and orthopaedics. |
| (2) | Expansion Assets: Both PDU and GZU had significant growth in both outpatient and inpatient volumes. In the third quarter of 2020, outpatient volume for PDU and GZU achieved 41.3% and 21.5% yoy, respectively, primarily driven by OBGYN, family medicine, and other specialties. With increased brand recognition, inpatient volume achieved 24.7% yoy as a result of OBGYN, internal medicine, as well as other specialties. |
FINANCIAL RESULTS
Unaudited Third Quarter 2020 Results
Revenue was RMB626.6 million ($92.3 million) in the third quarter, representing an increase of 3.7% yoy from RMB603.9 million in the third quarter of 2019. The increase was primarily driven by growth in both operating assets and expansion assets. Revenue increased by 14.1% from the prior quarter due to strong recovery in patient volume and increased demand for premium healthcare service.
| · | Tier 1 Operating Assets: revenue increased by 2.1% yoy to RMB446.2 million from RMB436.9 million and increased by 16.7% qoq. Adjusted EBITDA (before IFRS 16 adoption) increased by 14.7% yoy to RMB126.1 million from RMB109.9 million and increased by 27.9% qoq. The yoy increases in revenue and Adjusted EBITDA were primarily attributable to steady recovery of patient volume in various specialties and implementation of cost controls. |
| Tier 2 Operating and Other Assets: revenue decreased by 14.4% yoy to RMB79.6 million from RMB93.0 million, and Adjusted EBITDA (before IFRS 16 adoption) increased to RMB3.9 million from RMB2.3 million, primarily due to the gradual recovery of patient volume and implementation of cost controls. |
| · | Expansion Assets: revenue increased by 36.0% yoy to RMB100.7 million from RMB74.0 million, due to continued ramp up of patient volume at GZU and PDU. Adjusted EBITDA (before IFRS 16 adoption) increased by 67.8% yoy to RMB(12.9) million from RMB(40.0) million. |
Operating expenses were RMB591.3 million in the third quarter, representing a decrease of 5.8% yoy from RMB627.9 million and an increase of 4.6% qoq.
| · | Salaries, wages and benefits expenses decreased by 16.1% yoy to RMB295.0 million from RMB351.7 million and increased by 2.1% qoq. The yoy decrease was primarily due to the implementation of cost-saving initiatives, which included voluntary pay reductions at headquarters, utilization of employee leave, and reduction in social insurance and benefits expenses as a result of government policies during the pandemic. The qoq increase was primarily a result of a new government policy starting from July 2020, whereby only hospitals and clinics with smaller sizes received benefits from reductions in social insurance and current government policies. |
| · | Supplies and purchased medical services expenses increased by 20.0% yoy to RMB114.0 million from RMB95.0 million and increased by 10.2% qoq, mainly due to the enhancement of vaccination services and increased use of medical supplies as a result of the increased number of patients treated and the Company’s expansion to provide more complex and sophisticated services. |
| · | Depreciation and amortization expenses increased by 23.9% yoy to RMB105.2 million from RMB84.9 million and decreased by 0.9% qoq. The yoy increase was mainly due to fair value appreciation of plant and equipment, contracts with insurers related to the business combination, and full depreciation of the expanded PXU facility. |
| · | Lease and rental expense decreased by 81.0% yoy to RMB0.7 million from RMB3.7 million, primarily due to a reduction in rental expenses as a result of government policies implemented during the pandemic. |
| · | Bad debt expense was an expense of RMB0.6 million compared to a bad debt benefit of RMB0.2 million in the prior year period, and a bad debt benefit of RMB1.8 million in the prior quarter, primarily due to the increase in trade receivable as a result of revenue growth. |
| · | Other operating expenses decreased by 18.1% yoy to RMB76.0 million from RMB92.8 million, mainly due to cost-saving initiatives, a decrease in transaction costs, and fees payable to certain Chinese partners of the Company. Other operating expenses increased by 9.9%, or RMB6.9 million, from the prior quarter, mainly attributable to an increase in utilities expenses due to recovery of patient volumes, and an increase in fees payable to certain Chinese partners due to increased profitability as a result of revenue recovery from the prior quarter. |
As a result of the above, income from operations in the third quarter of 2020 was RMB35.2 million ($5.2 million) compared to loss from operations of RMB23.9 ($3.5 million) in the prior year period. Loss before income taxes in the third quarter of 2020 was RMB60.3 million ($8.9 million), compared to loss before income taxes of RMB71.5 million ($10.5 million) in the prior year period. Net loss in the third quarter of 2020 was RMB69.8 million ($10.3 million), compared to net loss of RMB86.3 million ($12.7 million) in the prior year period. The decrease in losses yoy mainly resulted from increased patient volume and strong revenue growth month-over-month in the third quarter of 2020, cost-saving initiatives, and cost reductions as a benefit of government policies in response to the COVID-19 pandemic, despite the increase in finance costs due to the Company’s Senior Secured Term Loan.
As of September 30, 2020, the Company had RMB748.9 million ($110.3 million) in cash and cash equivalents. Cash generated from operating activities for the third quarter were RMB48.6 million ($7.2 million), cash used for investing activities were RMB88.3 million ($13.0 million), and cash used for financing activities were RMB43.5 million ($6.4 million) for capital lease payments and repayment of Senior Secured Term Loan.
RECONCILIATON OF NON-IFRS FINANCIAL MEASURES
| (RMB mm) | ||||||||
| For the three months ended September 30, | ||||||||
| 2019 | 2020 | |||||||
| Net loss | (86 | ) | (70 | ) | ||||
| Less: Finance income | (1 | ) | (1 | ) | ||||
| Add: Finance costs | 33 | 62 | ||||||
| Add: Foreign exchange loss | 21 | 30 | ||||||
| Less: Gain on disposal of a subsidiary | - | (1 | ) | |||||
| Less: Other (income)/expenses, net | (6 | ) | 5 | |||||
| Add: Income tax expense | 15 | 10 | ||||||
| Operating (loss)/income | (24 | ) | 35 | |||||
| Add: Share-based compensation expense/(benefit) | 10 | (3 | ) | |||||
| Add: Depreciation and amortization | 85 | 105 | ||||||
| Add: Discontinued monitoring fee payable to Fosun Pharma and TPG | 1 | - | ||||||
| Add: Transaction related costs | 9 | 1 | ||||||
| Add: Severance costs | - | 2 | ||||||
| Add: Relocation costs of New Puxi Hospital | 3 | - | ||||||
| Adjusted EBITDA | 84 | 140 | ||||||
| Less: Lease expense adjustments as a result of IFRS 16 adoption | (50 | ) | (50 | ) | ||||
| Adjusted EBITDA (before IFRS 16 adoption) | 34 | 90 | ||||||
| For the three months ended September 30, 2020 | ||||||||||||||||
| Operating assets Tier 1 | Operating assets - Tier 2 and other assets | Expansion assets | Total | |||||||||||||
| Segment results | 147 | 9 | 8 | 164 | ||||||||||||
| Less: Segment lease expense adjustment as a result of adoption of IFRS 16 | (23 | ) | (5 | ) | (21 | ) | (49 | ) | ||||||||
| Add: Severance costs | 2 | - | - | 2 | ||||||||||||
| Adjusted EBITDA (before IFRS 16 Adoption) | 126 | 4 | (13 | ) | 117 | |||||||||||
| Less: Unallocated costs – others | (27 | ) | ||||||||||||||
| Total Adjusted EBITDA (before IFRS 16 Adoption) | 90 | |||||||||||||||
| Add: Lease expense adjustment as a result of adoption of IFRS 16 | 50 | |||||||||||||||
| Adjusted EBITDA | 140 | |||||||||||||||
| Add: Share-based compensation benefit | 3 | |||||||||||||||
| Less: Depreciation and amortization | (105 | ) | ||||||||||||||
| Less: Transaction related costs | (1 | ) | ||||||||||||||
| Less: Severance costs | (2 | ) | ||||||||||||||
| Operating income | 35 | |||||||||||||||
| Add: Finance income | 1 | |||||||||||||||
| Less: Finance costs | (62 | ) | ||||||||||||||
| Less: Foreign exchange loss | (30 | ) | ||||||||||||||
| Less: Other expenses, net | (5 | ) | ||||||||||||||
| Add: Gain on disposal of a subsidiary | 1 | |||||||||||||||
| Less: Income tax expense | (10 | ) | ||||||||||||||
| Net loss | (70 | ) | ||||||||||||||
RECENT DEVELOPMENTS
COVID-19 Recovery Trend & Operational Focus
The Company’s volumes for outpatient visits and inpatient admissions continued to recover during the quarter. While patient numbers during the quarter remained lower compared to the prior year period, the gap continues to narrow from the previous two quarters. Local government restrictions related to COVID-19 continue to have some impact on our facilities. Although patient volume has yet to fully recover, there was positive quarter-over-quarter growth in both outpatient volumes and inpatient admission during the quarter.
For the most part, China has been able to control the spread of COVID-19 with few to no cases in cities where UFH has its medical facilities since July. Although daily life in China has mostly returned to normal, the public health system and UFH facilities remain diligent in the fight against COVID-19. Not only do we continue to strictly adhere to safety protocols to protect our patients and staff, we have also continued to expand our capabilities in the event there is another wave of COVID-19 this winter. To this end, we continue to ensure and demonstrate our ability to provide sufficient COVID-19 PCR tests and COVID-19 antibody tests as we accumulate what we expect to be sufficient PPE for a potential resurgence of the virus in China.
Patient Nationality Mix Trends
Due to the closure of international borders and other travel restrictions within China since the onset of the pandemic, the Company has seen a shift in patient mix. Since this time, there has been strong growth in the Chinese patient population at all UFH facilities. Beginning in the second quarter, Chinese patient numbers not only returned to prior levels but also continued to increase for overall growth. UFH also saw an increase in foreign patient volumes in the third quarter of 2020 compared to the second quarter of 2020. As domestic travel restrictions continue to ease and international borders open on a controlled basis, the Company expects foreign patient volumes to maintain its growth trend in the near future.
QDU Strategic Co-operations Kick-Off
During the quarter, Qingdao United Family Hospital signed an agreement for a close cooperation with Shandong University Qilu Hospital. The agreement calls for clinical collaboration by offering our patients a deeper bench of medical specialty talent, as well as offering traditional patients of the public tertiary facility options to seek faster access and more personalized care at our Qingdao facility.
The Qingdao hospital also completed construction of its Radiation Therapy Cancer Treatment Center. The center will be managed jointly by QDU and Icon Corporation of Australia under a profit-sharing agreement signed in August of this year. Housing a state-of-the-art Varian Linac, a radiation cancer treatment linear accelerator, the center is designed to attract cancer patients who are expected to also bring revenues from imaging, laboratory and surgery to the hospital.
BJU Building 1 Lease Expiration
The lease on Building 1 of the BJU campus started in 1995 and was renewed in 2016. The renewal expires on December 31, 2020, and an extension agreement has not yet been reached. Provisions are underway for potential non-renewal, with plans underway for certain existing operations to be relocated to the clinics and other UFH facilities in Beijing. A majority of the clinics will be relocated to Building 2, in addition to some newly-leased, street front commercial space adjacent to the hospital. Losses in patient maternity rooms will be supplemented by a space in the new Beijing Jingbei Women and Children’s United Family Hospital (“DTU”) Facility.
GZU Positive Adjusted EBITDA starting from May
After only 21 months of operations, GZU reported positive Adjusted EBITDA for the first time in May 2020 and maintained positive Adjusted EBITDA since. Even during the COVID-19 period, GZU has seen months of continuous volume growth driven by OBGYN, postpartum care, internal medicine, orthopaedics, surgery, and the recently-expanded cosmetic dermatology center.
PXU New Cardiac Surgery Clinical Service Line
During the quarter, PXU performed its first percutaneous coronary intervention (PCI) procedure in its state-of-the-art, hybrid operating room, equipped with the Siemens Artis Pheno DSA. This marks the first of several successful, complicated cardiac procedures performed by the PXU clinical team, including the first CIED defibrillator implant equipped with a Medtronic CareLink remote tracking system for improved patient safety management.
Key Clinical Additions during the Quarter
In the past few months, UFH has continued to make key clinical hires to expand the system’s medical team’s capabilities.
In September, BJU brought on Dr. Lai Ailun as senior GYN physician. Dr. Lai brings with her more than 30 years of clinical experience at Fuxing Hospital, an affiliate hospital of Capital Medical University. Dr. Lai specializes in the diagnosis and treatment of gynecological endocrine diseases, and she is also experienced in gynecological endoscopy and vaginal surgeries, including laparoscopic surgery for tumors, hysteroscopic surgery, and plastic and reconstructive surgery for the women’s reproductive system.
During the quarter, PXU introduced Dr. Mike Huang as the hospital’s new Chair of Internal Medicine. Dr. Huang joins the UFH family with more than 27 years of experience. Prior to joining PXU, Dr. Huang served as the Deputy Director and Chief Physician of the Department of Gastroenterology & Endoscopy at Shanghai East Hospital. Dr. Huang specializes in several areas, including gastroenterology and advanced endoscopic diagnosis and therapy, endoscopic submucosal dissection (ESD), endoscopic retrograde cholangiopancreatography (ERCP), endoscopic ultrasound (EUS), fine needle aspiration (FNA), and scleroant injection and band ligation for gastro-esophageal varices and internal hemorrhoids.
Also in the quarter, Dr. Jixi Liu joined BJU as the new Section Chief for its Digestive Center. Dr. Liu has vast experience in internal medicine, with previous work experience at Peking Union Medical College Hospital in Beijing, Centro Hospitalar Conde Sao Januario in Macau, and Alborg University Hospital in Denmark. Dr. Liu is an expert in the diagnosis and treatment of gastroesophageal reflux disease, Helicobacter pylori related disease, inflammatory bowel disease, celiac disease, irritable bowel syndrome, alcoholic liver disease, autoimmune hepatic disease, and autoimmune pancreatitis. As an expert in endoscopy, Dr. Liu specializes in the endoscopic diagnosis of gastrointestinal cancer, neuroendocrine neoplasm, and gastrointestinal stromal tumors.
BUSINESS OUTLOOK
Despite the challenges brought by COVID-19, the Company expects to see a continued increase in revenues over previous quarters with the steady recovery of our patient volumes. For the fourth quarter, the Company expects a flat to slight year -over -year revenue increase. This forecast reflects the Company’s current and preliminary views, which are subject to change.
CONFERENCE CALL
A conference call and webcast to discuss New Frontier Healthcare’s financial results and guidance will be held at 8:00 a.m. U.S. Eastern Time on Wednesday, December 2, 2020 (or Wednesday, December 2, 2020, at 9:00 pm Beijing Time). Interested parties may listen to the conference call by dialing numbers below:
United States: 1-877-407-0789
International: 1-201-689-8562
China Domestic: 86 400 120 2840
Hong Kong: 800 965 561
Conference ID: 13713649
The replay will be accessible through December 9, 2020, by dialing the following numbers:
United States: 1-844-512-2921
International: 1-412-317-6671
Replay PIN: 13713649
The webcast will be available on the Company’s investor relations website at www.nfh.com.cn and will be archived on the site shortly after the call has concluded. A presentation to accompany the call will also be available for download on the website.
About New Frontier Health Corporation
New Frontier Health Corporation (NYSE: NFH) is the operator of United Family Healthcare (UFH), a leading private healthcare provider offering comprehensive premium healthcare services in China through a network of private hospitals and affiliated ambulatory clinics. UFH currently has nine hospitals in operation or under construction in all four tier 1 cities and selected tier 2 cities. Additional information may be found at www.nfh.com.cn.
Forward-Looking Statements
Certain statements made in this release are "forward looking statements" within the meaning of the "safe harbor" provisions of the United States Private Securities Litigation Reform Act of 1995. When used in this press release, the words "estimates," "projected," "expects," "anticipates," "forecasts," "plans," "intends," "believes," "seeks," "may," "will," "should," "future," "propose" and variations of these words or similar expressions (or the negative versions of such words or expressions) are intended to identify forward-looking statements. These forward-looking statements include, without limitation, NFH’s ability to address the effects of the COVID-19 pandemic; NFH’s ability to manage patient inflows; and NFH’s ability to prevent the spread of COVID-19 within its facilities; NFH’s ability to grow its business manage its growth; the benefits and synergies of the business combination it completed in December 2019, including anticipated cost savings, results of operations, financial condition, liquidity, prospects, growth, strategies and the markets in which the Company operates. Such forward-looking statements are based on available current market material and management’s expectations, beliefs and forecasts concerning future events impacting NFH. These forward-looking statements are not guarantees of future results and involve a number of known and unknown risks, uncertainties, assumptions and other important factors, many of which are outside NFH’s control that could cause actual results or outcomes to differ materially from those discussed in the forward-looking statements. For a discussion of such risks, please refer to NFH’s Annual Report on Form 20-F, filed with the SEC on March 31, 2020 and NFH’s subsequent filings with the SEC. NFH undertakes no obligation to update or revise any forward-looking statements, whether as a result of new information, future events or otherwise, except as required by law.
Non-IFRS Measures
The discussion and analysis includes certain measures, including Adjusted EBITDA (before IFRS 16 adoption), which have not been prepared in accordance with IFRS. This measure does not have any standardized meaning prescribed by IFRS and are therefore unlikely to be comparable to similar measures presented by other companies. This measure should be considered as supplemental in nature and not as a substitute for the related financial information prepared in accordance with IFRS. We use this measure to evaluate our operating results and for financial and operational decision-making purposes. We believe that Adjusted EBITDA is helpful in comparing our performance over various reporting periods on a consistent basis by removing from operating results the impact of items that do not reflect core operating performance, and in identifying underlying operating results and trends.
Adjusted EBITDA (before IFRS 16 adoption), is calculated as net loss plus (i) depreciation and amortization, (ii) finance costs/(income), (iii) other gains or losses, (iv) other expenses (such as share based compensation), (v) provision for income taxes, as further adjusted for (vi) certain monitoring fees paid to certain shareholders prior to the Business Combination, (vii) lease expense adjustments as a result of adoption of IFRS 16, (viii) transaction related costs (such as insurance amortization), and (ix) severance costs as a result of the restructuring process mainly in corporate headquarters since the second quarter of 2020. UFH adopted IFRS 16 on January 1, 2019, and recognized lease liabilities and corresponding “right-of-use” assets for all applicable leases, and recognized interest expense accrued on the outstanding balance of the lease liabilities and depreciation of right-of-use assets. As a result, the adoption of IFRS 16 caused depreciation and amortization and finance costs to increase in 2019, and excluded all applicable lease expenses in Adjusted EBITDA. For ease of comparison to prior periods, the Company eliminated the impact of IFRS 16 on Adjusted EBITDA.
Please see the table captioned “Reconciliations of non-IFRS Financial Measures.”
Exchange Rate Information
The translations from Renminbi to U.S. dollars included in the financial statements and elsewhere in this press release have been included for purposes of convenience were made at a rate of RMB6.7896 to US$1.00, the exchange rate set forth in the H.10 statistical release of the Federal Reserve Board on September 30, 2020.
Contacts
Investors
Harry Chang
Tel: +852-9822-1806
Email: [email protected]
ICR, LLC
William Zima
Tel: +1-203-682-8200
Email: [email protected]
Media
Wenjing Liu
Tel: +86-186-1151-5796
Email: [email protected]
Source: New Frontier Health Corporation
NEW FRONTIER HEALTH CORPORATION
UNAUDITED CONSOLIDATED STATEMENTS OF COMPREHENSIVE INCOME (LOSS)
(All amounts in thousands)
| Predecessor | Successor | Predecessor | Successor | |||||||||||||||||||||
For the three months ended September 30, 2019 | For the three months ended September 30, 2020 | For the nine months ended September 30, 2019 | For the nine months ended September 30, 2020 | |||||||||||||||||||||
| RMB | RMB | US$ | RMB | RMB | US$ | |||||||||||||||||||
| Revenues | 603,929 | 626,567 | 92,283 | 1,809,462 | 1,606,458 | 236,606 | ||||||||||||||||||
| Operating expenses | ||||||||||||||||||||||||
| Salaries, wages and benefits | (351,711 | ) | (295,005 | ) | (43,450 | ) | (1,039,607 | ) | (888,208 | ) | (130,819 | ) | ||||||||||||
| Supplies and purchased medical services | (94,966 | ) | (113,954 | ) | (16,784 | ) | (288,590 | ) | (292,888 | ) | (43,138 | ) | ||||||||||||
| Depreciation and amortization expense | (84,887 | ) | (105,166 | ) | (15,489 | ) | (253,740 | ) | (319,410 | ) | (47,044 | ) | ||||||||||||
| Lease and rental expense | (3,660 | ) | (696 | ) | (103 | ) | (10,402 | ) | (2,179 | ) | (321 | ) | ||||||||||||
| Bad debt benefit/(expense) | 156 | (555 | ) | (82 | ) | (3,060 | ) | (2,804 | ) | (413 | ) | |||||||||||||
| Other operating expenses | (92,786 | ) | (75,962 | ) | (11,188 | ) | (248,907 | ) | (210,185 | ) | (30,957 | ) | ||||||||||||
| Expense total | (627,854 | ) | (591,338 | ) | (87,096 | ) | (1,844,306 | ) | (1,715,674 | ) | (252,692 | ) | ||||||||||||
| Operating (loss)/income | (23,925 | ) | 35,229 | 5,187 | (34,844 | ) | (109,216 | ) | (16,086 | ) | ||||||||||||||
| Finance income | 549 | 563 | 83 | 1,740 | 1,586 | 234 | ||||||||||||||||||
| Finance costs | (33,722 | ) | (61,789 | ) | (9,101 | ) | (103,142 | ) | (199,853 | ) | (29,435 | ) | ||||||||||||
| Foreign exchange losses | (20,869 | ) | (30,405 | ) | (4,478 | ) | (22,695 | ) | (12,873 | ) | (1,896 | ) | ||||||||||||
| Gain on disposal of a subsidiary | - | 796 | 117 | - | 3,558 | 524 | ||||||||||||||||||
| Other income/(expenses), net | 6,424 | (4,672 | ) | (688 | ) | 7,220 | 8,339 | 1,228 | ||||||||||||||||
| Loss before income taxes | (71,543 | ) | (60,278 | ) | (8,880 | ) | (151,721 | ) | (308,459 | ) | (45,431 | ) | ||||||||||||
| Income tax expense | (14,707 | ) | (9,547 | ) | (1,406 | ) | (55,397 | ) | (9,281 | ) | (1,367 | ) | ||||||||||||
| Loss for the period | (86,250 | ) | (69,825 | ) | (10,286 | ) | (207,118 | ) | (317,740 | ) | (46,798 | ) | ||||||||||||
| Attributable to | ||||||||||||||||||||||||
| Equity holders of the parent | (78,913 | ) | (64,129 | ) | (9,447 | ) | (184,782 | ) | (298,107 | ) | (43,906 | ) | ||||||||||||
| Non-controlling interests | (7,337 | ) | (5,696 | ) | (839 | ) | (22,336 | ) | (19,633 | ) | (2,892 | ) | ||||||||||||
| Loss per share attributed to ordinary equity holders of the parent | ||||||||||||||||||||||||
| Basic | (0.49 | ) | (0.07 | ) | (2.27 | ) | (0.33 | ) | ||||||||||||||||
| Diluted | (0.49 | ) | (0.07 | ) | (2.27 | ) | (0.33 | ) | ||||||||||||||||
| Other comprehensive loss | ||||||||||||||||||||||||
| Items to be reclassified to profit or loss in subsequent periods (net of tax): Currency translation differences | 15,453 | 21,588 | 3,180 | 15,893 | 11,965 | 1,762 | ||||||||||||||||||
| Other comprehensive loss | 15,453 | 21,588 | 3,180 | 15,893 | 11,965 | 1,762 | ||||||||||||||||||
| Comprehensive loss for the period | (70,797 | ) | (48,237 | ) | (7,106 | ) | (191,225 | ) | (305,775 | ) | (45,036 | ) | ||||||||||||
| Comprehensive loss attributable to | ||||||||||||||||||||||||
| Equity holders of the parent | (63,460 | ) | (42,541 | ) | (6,267 | ) | (168,889 | ) | (286,142 | ) | (42,144 | ) | ||||||||||||
| Non-controlling interests | (7,337 | ) | (5,696 | ) | (839 | ) | (22,336 | ) | (19,633 | ) | (2,892 | ) | ||||||||||||
NEW FRONTIER HEALTH CORPORATION
UNAUDITED CONSOLIDATED STATEMENTS OF FINANCIAL POSITION
(All amounts in thousands)
December 31, 2019 (Audited) | September 30, 2020 | |||||||||||
| RMB | RMB | US$ | ||||||||||
| Non-current assets | ||||||||||||
| Plant and equipment | 1,962,781 | 1,915,975 | 282,193 | |||||||||
| Goodwill | 6,056,253 | 6,052,861 | 891,490 | |||||||||
| Intangible assets | 2,584,893 | 2,540,191 | 374,130 | |||||||||
| Right-of-use assets | 1,773,007 | 1,673,744 | 246,516 | |||||||||
| Deferred tax assets | 59,001 | 53,073 | 7,817 | |||||||||
| Restricted cash | 350 | 350 | 52 | |||||||||
| Investment in an associate | - | 1,000 | 147 | |||||||||
| Other non-current assets | 106,121 | 61,092 | 8,998 | |||||||||
| Total non-current assets | 12,542,406 | 12,298,286 | 1,811,343 | |||||||||
| Current assets | ||||||||||||
| Inventories | 56,592 | 81,843 | 12,054 | |||||||||
| Trade receivable | 215,376 | 194,371 | 28,628 | |||||||||
| Due from related parties | 66,923 | 9,689 | 1,427 | |||||||||
| Prepayments and other current assets | 38,323 | 47,600 | 7,011 | |||||||||
| Restricted cash | 376,715 | - | - | |||||||||
| Cash and cash equivalents | 1,353,300 | 748,915 | 110,303 | |||||||||
| Total current assets | 2,107,229 | 1,082,418 | 159,423 | |||||||||
| TOTAL ASSETS | 14,649,635 | 13,380,704 | 1,970,766 | |||||||||
| Current liabilities | ||||||||||||
| Trade payables | 99,082 | 88,775 | 13,075 | |||||||||
| Contract liabilities | 270,196 | 330,005 | 48,604 | |||||||||
| Accrued expenses and other current liabilities | 882,158 | 347,205 | 51,142 | |||||||||
| Due to related parties | 4,045 | 3,580 | 527 | |||||||||
| Tax payable | 15,278 | 6,047 | 891 | |||||||||
| Long-term borrowings | 400,325 | 6,193 | 912 | |||||||||
| Lease liabilities | 90,521 | 85,841 | 12,643 | |||||||||
| Total current liabilities | 1,761,605 | 867,646 | 127,794 | |||||||||
| NET CURRENT ASSETS | 345,624 | 214,772 | 31,629 | |||||||||
| TOTAL ASSETS LESS CURRENT LIABILITIES | 12,888,030 | 12,513,058 | 1,842,972 | |||||||||
| Non-current liabilities | ||||||||||||
| Long-term borrowings | 2,060,933 | 2,060,093 | 303,419 | |||||||||
| Contract liabilities | 67,873 | 60,992 | 8,983 | |||||||||
| Deferred tax liabilities | 681,715 | 669,512 | 98,608 | |||||||||
| Lease liabilities | 1,661,182 | 1,611,385 | 237,331 | |||||||||
| Other long-term liabilities | 9,358 | 9,284 | 1,367 | |||||||||
| Total non-current liabilities | 4,481,061 | 4,411,266 | 649,708 | |||||||||
| Net assets | 8,406,969 | 8,101,792 | 1,193,264 | |||||||||
| EQUITY | ||||||||||||
| Equity attributable to the equity holders of the Company | ||||||||||||
| Ordinary shares | 91 | 91 | 13 | |||||||||
| Capital surplus | 8,430,405 | 8,431,004 | 1,241,753 | |||||||||
| Translation reserves | 6,302 | 18,266 | 2,690 | |||||||||
| Accumulated deficit | (265,618 | ) | (563,725 | ) | (83,028 | ) | ||||||
| 8,171,180 | 7,885,636 | 1,161,428 | ||||||||||
| Non-controlling interests | 235,789 | 216,156 | 31,836 | |||||||||
| Total equity | 8,406,969 | 8,101,792 | 1,193,264 | |||||||||
NEW FRONTIER HEALTH CORPORATION
UNAUDITED CONDENSED CONSOLIDATED STATEMENTS OF CASH FLOWS
(All amounts in thousands)
| Predecessor | Successor | Predecessor | Successor | |||||||||||||||||||||
| For the three months ended September 30, 2019 | For the three months ended September 30, 2020 | For the nine months ended September 30, 2019 | For the nine months ended September 30, 2020 | |||||||||||||||||||||
| Cash generated from (used for): | RMB | RMB | US$ | RMB | RMB | US$ | ||||||||||||||||||
| Operating activities | 102,332 | 48,550 | 7,151 | 280,417 | 198,089 | 29,175 | ||||||||||||||||||
| Investing activities | (112,508 | ) | (88,298 | ) | (13,005 | ) | (292,424 | ) | (215,534 | ) | (31,745 | ) | ||||||||||||
| Financing activities | (69,625 | ) | (43,539 | ) | (6,413 | ) | (172,234 | ) | (573,403 | ) | (84,453 | ) | ||||||||||||
| Net decrease in cash and cash equivalents | (79,801 | ) | (83,287 | ) | (12,267 | ) | (184,241 | ) | (590,848 | ) | (87,023 | ) | ||||||||||||
Exhibit 99.2

1 1 New Frontier Health Q3 2020 Results Dec 2, 2020

2 2 Disclaimer Forward - Looking Statements This presentation includes “forward - looking statements” within the meaning of the “safe harbor” provisions of the Private Securi ties Litigation Reform Act of 1995. The actual results of New Frontier Health Corporation (the “Company”) may differ from the Company’s expectations, estimates and projections and consequently, you should not rely on these forward - looking statements as predictions of future events. Words such as “expect”, “estimate”, “project”, “budget”, “forecast”, “anticipate”, “intend”, “plan”, “may”, “will”, “could”, “should”, “believes”, “predicts”, “potential”, “continue”, and simila r e xpressions are intended to identify such forward - looking statements. These forward - looking statements involve significant risks and uncertainties that could cause the actual results to differ materially from the expected results, including, but no t l imited to, the Company’s ability to manage growth; the Company’s ability to execute its business plan, including its planned expansions, and meet its projections; rising costs adversely affecting the Company’s profitability; potential litigat ion involving the Company; general economic and market conditions impacting demand for the Company’s services, and in particular the effects of COVID - 19 on the Company's business and financial condition as well as other economic and market conditions in the Chinese healthcare industry and changes in the rules and regulations that apply to such business, including as it relates to foreign investments in such businesses; and other risks and uncertainties indicated from ti me to time in the Company’s filings with the U.S. Securities and Exchange Commission (the “SEC”). Most of these factors are outside of the Company’s control and are difficult to predict. The Company cautions readers not to place undue re lia nce upon any forward - looking statements, which speak only as of the date made. The Company does not undertake or accept any obligation or undertaking to release publicly any updates or revisions to any forward - looking statements to reflect any change in its expectations or any change in events, conditions or circumstances on which any such statement is based, except as required by law. Financial Information The Company acquired UFH in a business combination that closed on December 18, 2019. The financial results for the years ende d D ecember 31, 2018 and 2019, and for the quarter ended S eptember 30, 2019 presented herein are those of the Company’s wholly owned subsidiary, Healthy Harmony Holdings, L.P. (the “Predecessor”), while the financial results for th e quarter ended S eptember 30, 2020, presented herein are those of the combined Company (the “Successor”). Industry and Market Data In this presentation, we rely on and refer to information and statistics regarding market participants in the sectors in whic h t he Company competes and other industry data. The Company obtained this information and statistics from third - party sources, including reports by market research firms and company filings. Use of Non - IFRS Financial Matters The discussion and analysis includes certain measures, including Adjusted EBITDA (before IFRS 16 adoption), Adjusted EBITDA M arg in, Free Cash Flow and Pro - forma Adjusted EBITDA, and Pro - forma Adjusted EBITDA Margin, which have not been prepared in accordance with IFRS. These measures do not have any standardized meaning prescribed by IFRS and ar e t herefore unlikely to be comparable to similar measures presented by other companies. These measures should be considered as supplemental in nature and not as a substitute for the related financial information prepare d i n accordance with IFRS. We use these measures to evaluate our operating results and for financial and operational decision - making purposes. We believe that Adjusted EBITDA and Pro - forma Adjusted EBITDA helps compare our performanc e over various reporting periods on a consistent basis by removing from operating results the impact of items that do not reflect core operating performance and helps identify underlying operating results and trends. Adjusted EBITDA (before IFRS 16 adoption), is calculated as net loss plus ( i ) depreciation and amortization, (ii) finance expense/(income), (iii) other gains or losses, (iv) other expenses (such as sha re based compensation), (v) provision for income taxes, as further adjusted for (vi) certain monitoring fees paid to certain shareholders prior to the Business Combina tio n, (vii) lease expense adjustments as a result of adoption of IFRS 16, (viii) transaction related costs, (ix) Gain on disposal of an associate and (x) Severance costs as a result of the restructuring process mainly in corporate headquarters si nce the second quarter of 2020. UFH adopted IFRS 16 on January 1, 2019, and recognized lease liabilities and corresponding “right - of - use” assets for all applicable leases, and recognized interest expense accrued on the outstanding balanc e of the lease liabilities and depreciation of right - of - use assets. As a result, the adoption of IFRS 16 caused depreciation and amortization and finance costs to increase in 2019 and excluded all applicable lease expenses in Adjusted EB ITD A. For ease of comparison to prior periods, the Company eliminated the impact of IFRS 16 on Adjusted EBITDA. Pro - forma Adjusted EBITDA, is calculated as net loss plus ( i ) depreciation and amortization, (ii) finance expense/(income), (iii) other gains or losses, (iv) other expenses (such as sha re based compensation), (v) provision for income taxes, as further adjusted for (vi) certain monitoring fees paid to certain shareholders prior to the Business Combination, (vii) le ase expense adjustment as a result of adoption of IFRS 16, (viii) transaction related costs, (ix) Gain on disposal of an associate, (x) Severance costs as a result of the restructuring process mainly in corporate headquarters since the second qua rte r of 2020 and (xi) Pro - forma adjustments in PXU. See slide 46 for further information on these pro - forma adjustments. Adjusted EBITDA margin is calculated by dividing Adjusted EBITDA (before IFRS 16 adoption), by total revenue and Pro - forma Adjus ted EBITDA margin is calculated by dividing Pro - forma Adjusted EBITDA by total revenue. Free cash flow is calculated as 1) cash flow generated from operating activities 2) minus release of restricted cash, 3) minu s c apital lease payments, 4) add interest expense paid, 5) add one - off transaction expense related to the business combination, 6) minus capital expenditure on existing operations of the facilities. A reconciliation of non - IFRS forward looking information to their corresponding IFRS measures are not included in this presentat ion as they cannot be provided without unreasonable effort because of the inherent difficulty of accurately forecasting the occurrence and financial impact of the various adjusting items necessary for such reconciliation that have no t y et occurred, are out of our control, or cannot be reasonably predicted.

3 3 Overview Q3 2020 Business Highlights Q3 2020 Financial R esults Growth Initiatives Appendix A - I ndustry Overview Appendix B - Additional Materials Table of Contents

4 4 Beijing United Family Hospital North ( 2020 ) OVERVIEW

5 5 Leading Private Healthcare Service Provider in China COMPREHENSIVE SERVICE OFFERING covering 30+ specialties 9 hospitals 1 14 clinics 1 1,000+ licensed beds 800+ physician staff 1000+ physician consultants 2019 A outpatient visits: ~ 6 33 ,000 2019 A inpatient visits: ~ 11, 000 Operating Assets 2 2019A Pro - Forma Adjusted EBITDA: RMB 483mm 2015A - 201 9 A CAGR: 30 .4 % Source: Company; As of Dec 31, 2019 1 . I ncludes 2 hospitals under construction, 14 directly operated clinics 2 . Operating assets include Beijing, Shanghai Puxi , Tianjin, Qingdao and Beijing Rehab Hospitals as well as B o’Ao and Hangzhou Clinics and post - partum care worker business 3 . All hospital and clinics with at least 3 years of operating experience are accredited or re - accredited on a 3 - year cycle . The newest Qingdao and Shanghai Pudong hospitals were not yet eligible in the 2017 audit, but Qingdao will be included in the 2020 audit and Pudong will be eligible in the next cycle . One of the LARGEST private healthcare service providers in China by revenue 2019 A total revenue : RMB ~ 2. 45 bn 2015A - 201 9 A CAGR: 1 5.1 % 1 1 TOP - RANKED brand among high - end private hospitals ALL 3 JCI accredited Beijing United Family ONLY JCI and CAP accredited hospital FIRST da Vinci and MAKO in private hospital GCP certification from CFDA for conducting clinical drug trials

6 6 5 Hospitals Hub Spoke 8 Clinics Hub - and - Spoke Model 2 Hospitals Hub Spoke 4 Clinics Hub - and - Spoke Model 2 Hospitals Hub Spoke 2 Clinics Hub - and - Spoke Model Beijing Tianjin Qingdao Guangzhou Hangzhou Hainan Shenzhen 2 Shanghai Source: Company ; As of Dec 31, 2019 1. 5 hospitals in Beijing Cluster including Qingdao United Family and Tianjin United Family 2. UFH is expected to be given the exclusive right to manage New Frontier Group’s 64,000 sq. meter flagship Shenzhen city cen ter hospital as part of the transaction Broad geographic coverage across all four Tier 1 cities Strategic opportunity for expansion into Tier 2 cities GREATER BAY CLUSTER SHANGHAI CLUSTER + EAST CHINA BEIJING CLUSTER + NORTH CHINA 1 Nationwide Geographic Footprint

7 7 Expat 46% Local 54% BROADER ADDRESSABLE MARKET WITH MORE LOCAL PATIENTS 3 Commercial Insurance 37% Self - pay 63% Diversified Foundation for Future Growth Expat 29% Local 71% MULTI - SPECIALTY SERVICE OFFERING 1 2019A Source: Company 1. OB/GYN: Obstetrics and Gynecology; Peds: Pediatrics; Ortho: Orthopaedics; FM: Family Medicine; IM: Internal Medicine; ER: Eme rgency Room; PPR: Post - Partum Rehab 2. Split by revenue from insurance / self - pay patients 3. Split by volume of expat and local Chinese patients REVENUE MIX BETWEEN SERVICE & PHARMACY 2019A OB/GYN 22% Peds 14% Surgery 7% Ortho 7% FM 10% IM 8% ER 7% PPR 5% Others 19% 2014 2019A DIVERSIFIED PAYER STRUCTURE 2 Pharmacy 10% Service 90% 2019A

8 8 Revenue driven by high acuity departments including Orthopedics & Surgery High Acuity 163 351 2014 2019A Surgery Orthopedics Potential for Dermatology, ENT 1 , Ophthalmology & New Hope Oncology Centre New Specialties 51 138 2014 2019A Ophthalmology ENT Dermatology Comprehensive Provider with Entire “Lifecycle" Coverage Hub - and - spoke model creates comprehensive healthcare services platform with multiple patient touchpoints Clinics Home Health Attracting traffic with OB/GYN and Pediatrics 483 902 2014 2019A Pediatrics OB/GYN Revenue (RMB mm) Prenatal Care Pediatrics OB/ GYN 1 Expanding differentiated services complemented by Rehabilitation and PPR PPR 1 Rehabilitation 35 2014 2019A PPR Rehabilitation Broader patient base built up by Family Medicine 112 252 2014 2019A Family Medicine Family Medicine Dental Source: Company 1. OB/GYN: Obstetrics and Gynecology; ENT: Ear, Nose and Throat; PPR: Post - Partum Rehabilitation Hospitals 169

9 9 UFH A B C D E 1.85 1.55 1.53 1.50 1.08 1.48 UFH A B C D E 1.75 1.64 1.55 1.38 1.30 1.38 One of the Most Reputable Private Healthcare Brands in China Ranks top for medical quality among high - end private hospitals by patients, doctors and government regulators Source: Company, Company Analysis 1. Survey Question 4: Please rank the following private hospital brands’ medical quality. Screening criteria: Have had any ki nd of medical treatment in private hospital in past 36 months 2. Scoring methods: a) Score 5 for brand ranked 1 st ; Score 3 for brand ranked 2 nd ; Score 1 for brand ranked 3 rd ; b) Divide summed score by the number of respondents 3. Sample size for Beijing, Shanghai and Guangzhou were 105, 110 and 62 respondents, respectively Ranking score of private brands among monthly households income >RMB 27K 1,2,3 BEIJING UFH A B C D E SHANGHAI GUANGZHOU 1.64 1.37 1.30 1.28 1.03 1.25 2003 – The designated healthcare institution for foreigners during the SARS period 2010 – Official designated medical institutions for the Shanghai World Expo 2015 - Named as Most Investment - Worthy Healthcare Company 2016 – Ranked No.1 in China Top 100 Private Hospitals 2016 – Ranked No.2 in China Private Hospital Valuable Brands 2016 – Ranked No.18 in China Private Hospital Conglomerates Top 50 League 2018 – The designated Well - Known Trademark 2018 - Ranked No.1 repeatedly as The Best Employer among all private hospitals

10 10 Operating Stats 4 Open Date 1997/2014 2004 2019 2012 2015 2013 2018 2018 2020 2021 Signed MoU & framework agreement in major Tier 2 locations (lease / operate and management contract model) Gross Floor Area (sqm) 34,448 2 7,559 2 20,844 2 6,900 30,057 3 16,145 69,008 2 28,471 22,834 64,000 # of Beds 4 93 41 71 23 100 3 83 99 85 200 250 - 350 # of Consultation Rooms 237 3 71 3 97 3 31 31 32 123 5 41 5 37 5 TBC # of Satellite Clinics 8 2 0 0 0 1 1 N/A TBC TIER 1 Shanghai Puxi 1 (new) Shanghai Puxi (old) Asset Overview Source: Company ; As of Dec 31, 2019 Note: 1. New Shanghai Puxi is the expansion of the old Shanghai Puxi 2. Includes satellite clinics associated with hospitals UFH Beijing City Cluster Shanghai City Cluster Greater Bay Cluster OPERATING ASSETS EXPANSION ASSETS (TIER 1 ONLY) JCI - Accredited Beijing Chaoyang Shanghai Pudong Beijing Datun Shenzhen Management Contract Guangzhou Qingdao Beijing Rehab Tianjin TIER 2 EXPANSION ASSETS (TIER 2) 3. Includes Building A and additional capacity from Building B expansion; Revenue per sqm only accounts for the 20,057 sqm cu rre ntly in use 4. Stands for the maximum bed capacity as of fiscal year - end 5. Stands for the maximum number of consultation rooms designed

11 FY2019 Revenue (in million RMB) FY2019 Pro - forma Adjusted EBITDA (in million RMB) 2019 Revenue / Pro - forma Adjusted EBITDA 1 Summary 483 163 161 159 Tier 1 Operating Assets Total 0 HQ Tier 2 Operating & Other Assets Expansion Assets 1,811 359 280 Tier 1 Operating Assets Total Tier 2 Operating & Other Assets Expansion Assets 2,449 9% Y - o - y Growth 19% 21% 170% Pro - Forma Adjusted EBITDA Margin % 27% n.m. 0% - 58% 7% Revenue per Bed 2 Notes: 1. See slide 46 for a reconciliation of net loss to Pro - forma Adjusted EBITDA 2.Revenue per bed is calculated based on the weighted average maximum bed capacity of the fiscal year 3.Refferring to Beijing United Family Hospital in Chaoyang as its associated clinics 4.Referring to Shanghai Puxi United Family Hospital and its associated clinics. Maximum bed capacity for Shanghai Puxi United Family Hospital increased with the relocation to new site in Q4 2019 Beijing 3 14.0 1.7 1.5 4.6 Shanghai 4 10.8

12 Significant White Space for Growth in Tier 1 Cities 1 Tier 1 Cities # of UFH Patients 2 ~200,000 Tier 1 Cities Target Addressable Market 3 ~4.1 million Tier 1 Cities Total Resident Population 4 ~ 74 million ~5% ~0.3% Significant white space within Tier 1 Cities for future growth Source: Company Analysis, National Bureau of Statistics 1. Tier 1 Cities include Beijing, Shanghai, Guangzhou and Shenzhen 2. Number of unique UFH patients in Tier 1 cities in 2019 3. Addressable market includes target expatriate population, local population with out - of - pocket payment and local population with premium hea lthcare insurance coverage as of 2018 4. Number of residents in Beijing, Shanghai, Guangzhou and Shenzhen as of 2018

13 13 Shanghai United Family Pudong Hospital Q3 2020 BUSINESS HIGHLIGHTS

14 14 Financial Snapshot Outpatient Visit - 0.5 % YoY 21.7 % QoQ 152,951 Visits Inpatient Admission - 15.1 % YoY 7.3 % QoQ Utilization Rate Compared to 39.4 % in 3Q19 33.7 % Operational Snapshot Adjusted EBITDA (before IFRS 16 Adoption) 1 RMB 89.9 mn Total Revenue 3.7 % YoY 14.1 % QoQ RMB 626.6 mn 2,210 Admissions Q3 2020 Operational and Financial Snapshot Notes: 1. See slide 46 for a reconciliation of net loss to Adjusted EBITDA (before IFRS 16 Adoption) Outpatient ASP 9.4 % YoY RMB 2,580 Inpatient ASP 15.2 % YoY RMB 103,386 162.8 % YoY
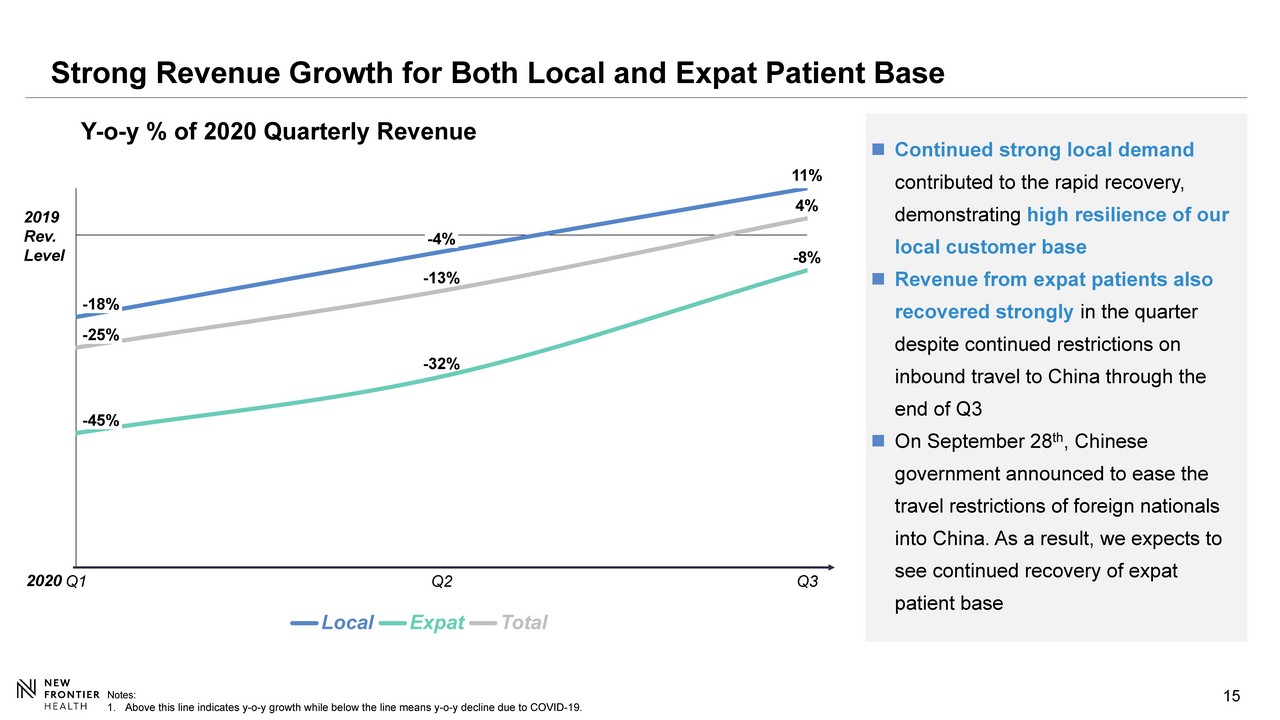
15 15 Strong Revenue Growth for Both Local and Expat Patient Base - 13% - 18% - 45% 11% - 32% 4% - 25% Q1 - 4% Q2 - 8% Q3 Y - o - y % of 2020 Quarterly Revenue 2020 Expat Local Total Continued strong local demand contributed to the rapid recovery, demonstrating high resilience of our local customer base Revenue from expat patients also recovered strongly in the quarter despite continued restrictions on inbound travel to China through the end of Q3 On September 28 th , Chinese government announced to ease the travel restrictions of foreign nationals into China. As a result, we expects to see continued recovery of expat patient base Notes: 1. Above this line indicates y - o - y growth while below the line means y - o - y decline due to COVID - 19. 2019 Rev. Level
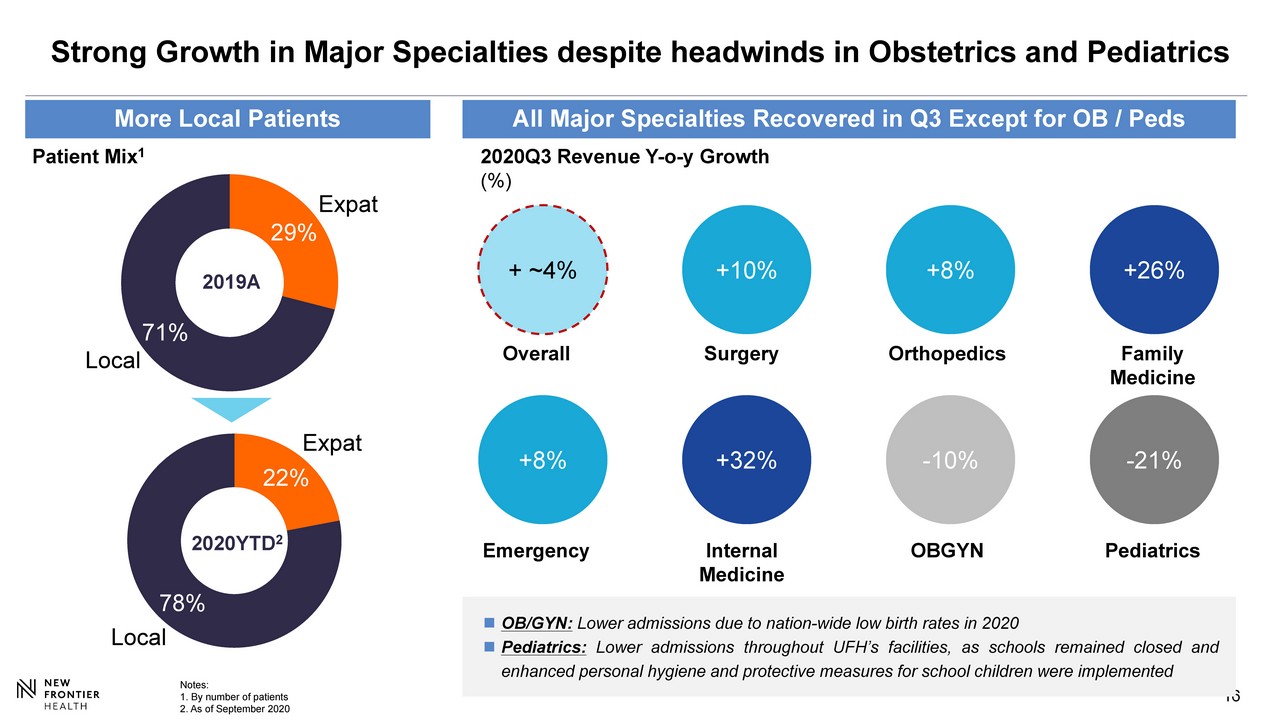
16 16 Strong Growth in Major Specialties despite headwinds in Obstetrics and Pediatrics 22% 78% Expat Local Notes: 1. By number of patients 2. As of September 2020 29% 71% Local Expat 2020YTD 2 2019A Patient Mix 1 More Local Patients All Major Specialties Recovered in Q3 Except for OB / Peds - 10% +8% - 21% +8% +26% +10% +32% + ~4% Pediatrics 2020Q3 Revenue Y - o - y Growth (%) OBGYN Overall Surgery Orthopedics Family Medicine Emergency Internal Medicine OB/GYN : Lower admissions due to nation - wide low birth rates in 2020 Pediatrics : Lower admissions throughout UFH’s facilities, as schools remained closed and enhanced personal hygiene and protective measures for school children were implemented

17 17 GZU: Positive EBITDA for 6 Consecutive Months with 9% EBITDA Margin in Oct. After only 21 months of Operations 1 Mar Apr 22.3% 3.7% 47.4% Jan 8.9% Feb - 2.6% 22.5% Aug May 31.7% Jun 43.5% Jul 46.2% Sep 44.7% Oct Guangzhou United Family Hospital 2020 Monthly Revenue (Y - o - y%) 2020 Positive EBITDA Notes: 1. Since the hospital obtained its OB license

18 18 New Project Update: Shenzhen New Frontier United Family Hospital Shenzhen New Frontier United Family Hospital (“SZU”) is on track with its construction schedule despite the effect of COVID - 19 s ituation, and is expected to commence operations in Q3 2021 Upon completion, SZU will be the largest UFH hospital with a gross floor area of 63,645 sqm and 350 beds, with state - of - the - art equipment including PET/CT and linear accelerator. SZU is planning to have 22 specialties ranging from Obstetrics, pediatrics, family m edi cine, emergency medicine to oncology, internal medicine and general surgery Top management positions such as GM, CMO, CNO, CRO, HR Director are confirmed while some specialty chairs are being finalized Marketing campaigns to promote SZU and educate local market are under preparation and are planning to launch in Q1 / Q2 2021

19 19 New Project Update: Beijing Jingbei Women and Children’s United Family Hospital Beijing Jingbei Women and Children’s United Family Hospital (“DTU”) is designed as a level III Women and Children’s hospital with 200 licensed beds , aiming to provide comprehensive OB/ GYN, PPR, pediatrics and other consumer healthcare services (e.g. dental, ophthalmology, dermatology, vaccination, etc.) to attract and capture affluent younger customers in the north - west of Beijing Expected to complete construction and soft open in March 2021 Secured the recruitment of a number of external clinical talents in core specialties incl. OB, gynecology, Pediatrics, PPR an d F M with confirmed staff internal transfer plan from other UFH facilities in Beijing to support the new hospital

20 20 Ramp - up Strategy Hospital Revenue (mm RMB) Source: Company ( Unaudited); As of September 30, 2020 1. Since the hospital obtained its OB license 2. Run - rate revenue is defined as quarterly revenue * 4 3. Only 20,057 sqm Building A is currently in use and contributes revenue for now; total GFA is 30,057 sqm which includes Bui ldi ng A and additional capacity from Building B expansion 0 50 100 150 200 250 300 350 400 450 500 550 600 650 700 750 800 850 900 950 1,000 1,050 1,100 1997 1998 1999 2000 2001 2002 2003 2004 2005 2006 2007 2008 2009 2010 2011 2012 2013 2014 2015 2016 2017 2018 2019 2020 GZM (69,008 sqm) 20Q3 Run Rate Revenue 2 (RMB 237mm) by Sep - 20 (Month 25 1 ) PDU (28,471 sqm) 20Q3 Run Rate Revenue 2 (RMB 158mm) by Sep - 20 (Month 23 1 ) BJU (24,959 sqm) PXU (previously 7,559 sqm; 20,844 sqm after relocation) TJU (6,900 sqm) Rehab (16,145 sqm) QDU (20,057 sqm 3 ) Due to capacity bottleneck with only 5,886 sqm, Shanghai hospital struggled to take on additional patient volume and develop higher acuity services. Capacity issue was solved in October 2019 when Shanghai hospital moved to a new site with 19,172 sqm of facility size

21 21 Lease Renewal of Building 1 of Beijing United Family Hospital Situation Overview and Plan for BJU Building 1 Lease Expiration The lease on Building 1 of the BJU campus started in 1995 and was renewed in 2016. The renewal expires on December 31, 2020, and an extension agreement has not yet been reached. Provisions are underway for potential non - renewal, with plans for certain existing operations to be relocated to the existing UFH satellite clinics and other UFH facilities in Beijing. Majority of the clinics will be relocated to Building 2, in addition to some newly - leased, street front commercial space adjacent to the hospital. Losses in patient maternity rooms will be supplemented by a new space in the new Beijing Jingbei Women and Children’s United Family Hospital (“DTU”)

22 22 Various Strategic Co - operations Kick - Off in Qingdao Completed construction of its Radiation Therapy Cancer Treatment Center To be managed jointly by QDU and Icon under profit - sharing model Housing a state - of - the - art Varian Linac Expected to attract cancer patients , who could also bring revenues from imaging, laboratory and surgery to the hospital Signing of Cooperation Agreement with Shandong University Qilu Hospital Opening of Oncology Center at QDU The various new co - operations are expected to help enhance UFH’s medical capability and expand its patient base Offer UFH patients a deeper bench in medical specialty talents with multi - site practice of top public hospital (i.e. Qilu Hospital) physicians Provide traditional patients of the public tertiary facility options to seek faster access and more personalized care at UFH Qingdao facility Notes: 1. Icon Corporation is the largest cancer diagnosis and treatment service provider in Australia
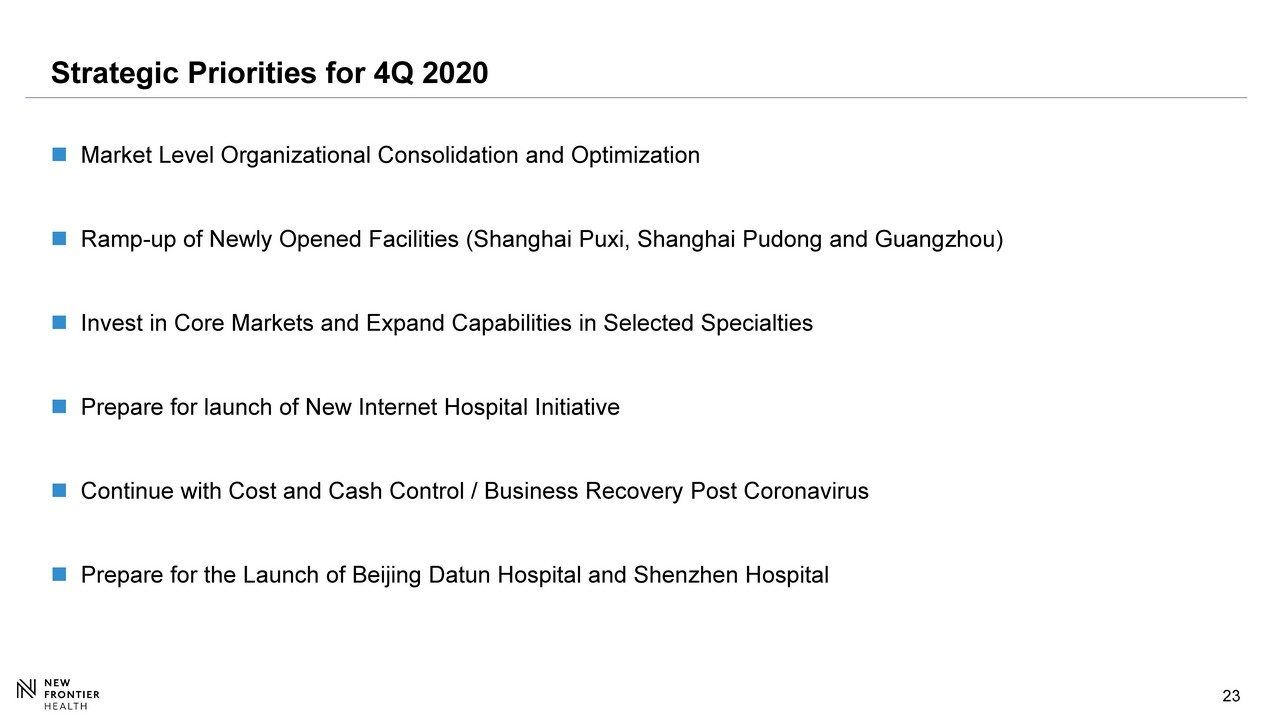
23 Strategic Priorities for 4Q 2020 Market Level Organizational Consolidation and Optimization Ramp - up of Newly Opened Facilities (Shanghai Puxi , Shanghai Pudong and Guangzhou) Invest in Core Markets and Expand Capabilities in Selected Specialties Prepare for launch of New Internet Hospital Initiative Continue with Cost and Cash Control / Business Recovery Post Coronavirus Prepare for the Launch of Beijing Datun Hospital and Shenzhen Hospital

24 24 Shanghai United Family Hospital Q3 2020 FINANCIAL RESULTS

25 Q3 Revenue Con tinued Recovering and Recorded Y - o - y Growth 43 55 69 74 82 65 89 101 61 71 79 84 87 83 93 96 64 78 80 391 429 405 434 435 477 437 462 302 382 446 431 18 18Q4 18Q1 19Q4 18Q2 18Q3 20 19Q1 19Q2 19Q3 470 20Q1 20Q2 627 520 507 562 577 628 604 640 549 20Q3 23 Operating Tier 1 Operating Tier 2 & Other Assets Expansion Revenue (in million RMB) - 13% 14% - 25% Y - o - y Growth 2% - 14% 36% Y - o - y Growth 4% 14% Q - o - q Recovery
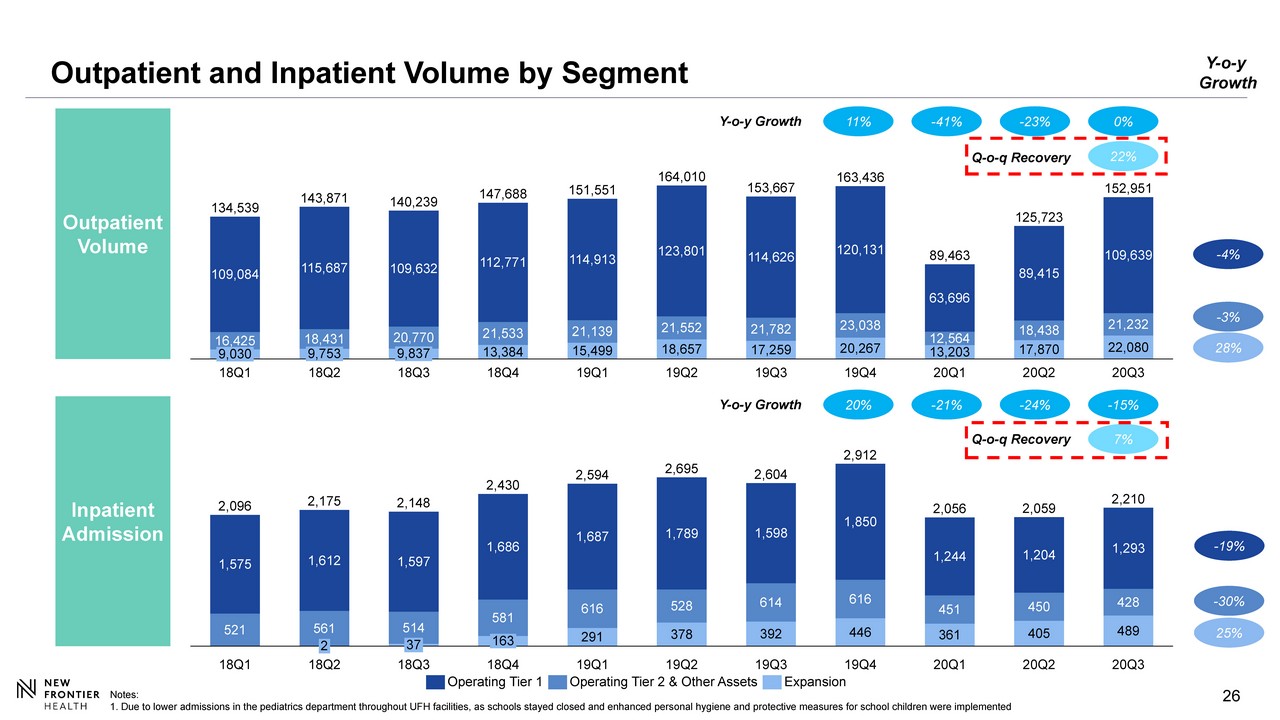
26 Outpatient and Inpatient Volume by Segment Outpatient Volume Inpatient Admission 521 291 378 392 446 361 405 489 1,575 561 514 581 616 528 614 616 451 450 428 1,612 1,597 1,686 1,687 1,789 1,598 1,850 1,244 1,204 1,293 37 19Q1 2,695 18Q3 18Q1 2 18Q2 163 2,210 2,059 18Q4 19Q2 19Q3 19Q4 20Q1 20Q2 2,096 2,430 2,175 2,148 2,594 2,604 2,912 2,056 20Q3 13,384 15,499 18,657 17,259 20,267 13,203 17,870 22,080 16,425 18,431 20,770 21,533 21,139 21,552 21,782 23,038 12,564 18,438 21,232 109,084 115,687 109,632 112,771 114,913 123,801 114,626 120,131 63,696 89,415 109,639 19Q3 19Q2 152,951 134,539 19Q1 18Q1 18Q2 18Q3 18Q4 143,871 19Q4 20Q1 9,030 20Q2 20Q3 140,239 147,688 151,551 164,010 153,667 163,436 89,463 125,723 9,753 9,837 - 23% 11% - 41% - 4% - 3% 28% - 19% - 30% 25% Y - o - y Growth Y - o - y Growth Operating Tier 1 Operating Tier 2 & Other Assets Expansion 0% 22% 7% Q - o - q Recovery Q - o - q Recovery Notes: 1. Due to lower admissions in the pediatrics department throughout UFH facilities, as schools stayed closed and enhanced pers ona l hygiene and protective measures for school children were implemented - 24% 20% - 21% Y - o - y Growth - 15%

27 ASP 1 Increased in Q3 Due to Higher Acuity Procedures Outpatient ASP Inpatient ASP 19Q4 18Q4 18Q3 89,969 101,024 20Q1 19Q2 19Q1 20Q2 18Q2 79,807 18Q1 86,847 19Q3 20Q3 81,965 87,019 86,379 89,755 92,964 103,386 83,932 2,240 18Q3 2,383 20Q2 18Q2 2,580 2,377 20Q1 19Q1 18Q1 18Q4 19Q2 19Q4 2,358 2,267 20Q3 2,390 2,341 2,226 2,608 2,640 19Q3 11% 9% 2% Y - o - y Growth Notes: 1. Average selling price 9% 16% 13% - 3% Y - o - y Growth 15%

28 Adjusted and Pro - forma Adjusted EBITDA 1 Tier 1 Operating Assets Tier 2 Operating and Other Assets Expansion Assets Total 52.8 5.8 5.8 5.8 1.9 18Q4 20Q3 20Q1 30.9 18Q1 18Q2 18Q3 19Q1 35.9 19Q2 19Q3 25.7 8.8 19Q4 20Q2 50.5 - 10.9 36.7 58.6 40.0 27.6 89.9 - 67.7 54.0 34.2 - 24.1 - 37.5 - 60.6 - 63.8 - 43.6 - 40.8 - 40.0 - 37.0 - 42.6 - 19.5 - 12.9 18Q2 18Q1 18Q3 19Q4 19Q2 18Q4 19Q1 19Q3 20Q3 20Q1 20Q2 - 4.2 - 1.4 - 0.7 - 3.7 0.4 - 3.5 2.3 0.6 - 11.5 3.6 3.9 18Q1 19Q4 19Q2 18Q2 18Q3 18Q4 19Q3 19Q1 20Q1 20Q2 20Q3 5.8 1.9 19Q2 126.1 5.8 110.5 18Q3 141.6 107.6 20Q1 98.6 97.3 119.4 88.0 109.5 115.7 20Q3 5.8 20Q2 116.3 135.8 18Q2 18Q4 18Q1 109.9 19Q3 19Q1 19Q4 116.3 22.9 15% 71% 68% 163% Y - o - y Growth Pro - forma Adjustments 1 Notes: 1. See slide 46 for a reconciliation of net loss to Adjusted EBITDA (before IFRS 16 Adoption) and Pro - forma Adjusted EBITDA Unallocated HQ Expenses - 33.1 - 30.1 - 37.6 - 39.9 - 36.5 - 38.7 - 37.9 - 45.4 - 36.4 - 28.7 - 27.2 19Q3 18Q1 18Q2 19Q1 18Q3 19Q2 19Q4 18Q4 20Q1 20Q2 20Q3 28%
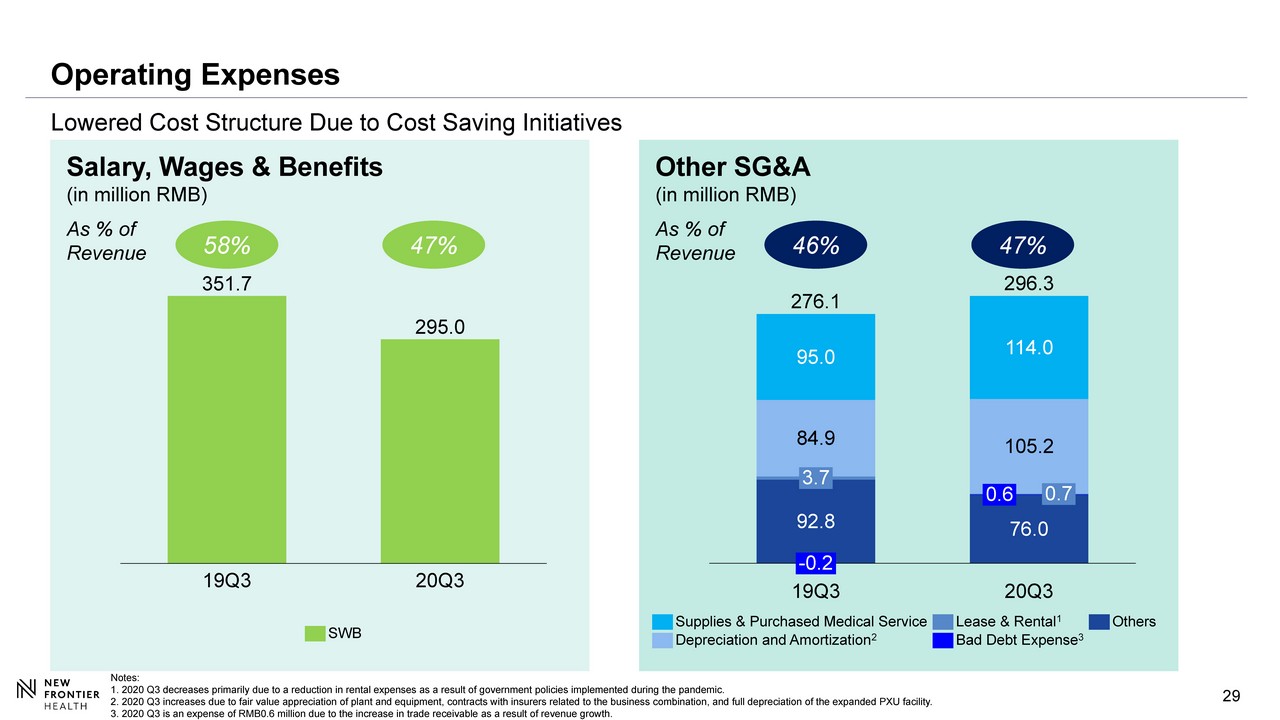
29 29 Operating Expenses L owered Cost Structure Due to Cost Saving Initiatives 351.7 295.0 20Q3 19Q3 SWB 58% As % of Revenue 47% Salary, Wages & Benefits (in million RMB) 92.8 76.0 84.9 95.0 105.2 114.0 20Q3 3.7 0.7 - 0.2 19Q3 0.6 276.1 296.3 Supplies & Purchased Medical Service Depreciation and Amortization 2 Lease & Rental 1 Others Bad Debt Expense 3 46% As % of Revenue 47 % Other SG&A (in million RMB) Notes: 1. 2020 Q3 decreases primarily due to a reduction in rental expenses as a result of government policies implemented during th e p andemic. 2. 2020 Q3 increases due to fair value appreciation of plant and equipment, contracts with insurers related to the business c omb ination, and full depreciation of the expanded PXU facility. 3. 2020 Q3 is an expense of RMB0.6 million due to the increase in trade receivable as a result of revenue growth.
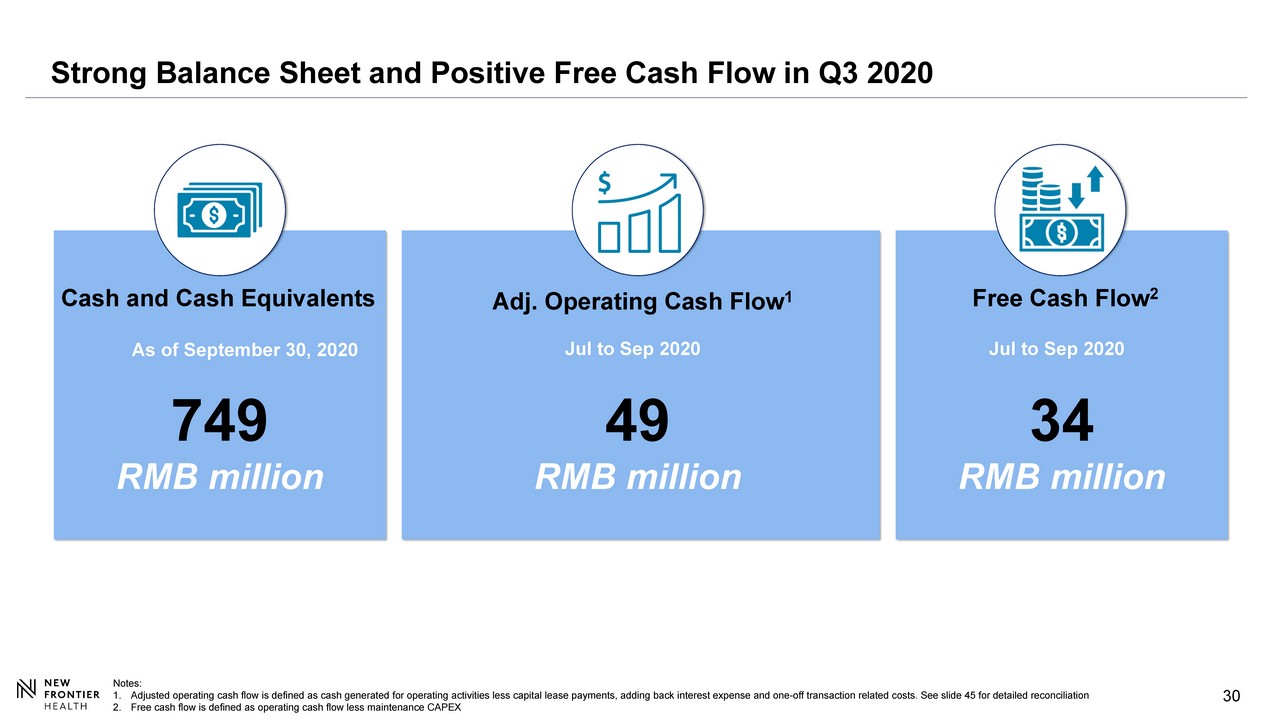
30 Strong Balance Sheet and Positive Free Cash Flow in Q3 2020 Notes: 1. Adjusted operating cash flow is defined as cash generated for operating activities less capital lease payments, adding back i nte rest expense and one - off transaction related costs. See slide 45 for detailed reconciliation 2. Free cash flow is defined as operating cash flow less maintenance CAPEX Adj. Operating Cash Flow 1 Jul to Sep 2020 49 RMB million Cash and Cash Equivalents As of September 30, 2020 749 RMB million Free Cash Flow 2 Jul to Sep 2020 34 RMB million

31 31 Qingdao United Family Hospital GROWTH INITIATIVES
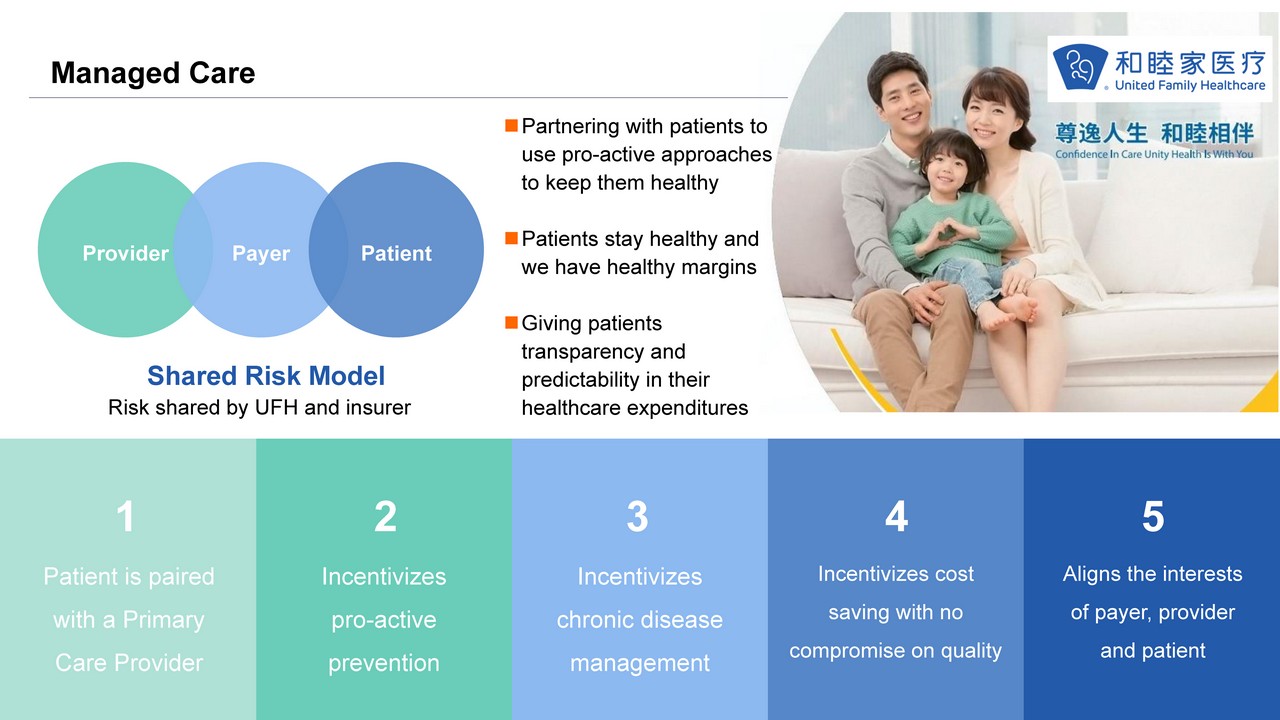
32 32 Managed Care Patient is paired with a Primary Care Provider Incentivizes pro - active prevention Aligns the interests of payer, provider and patient I ncentivizes chronic disease management I ncentivizes cost saving with no compromise on quality 1 2 3 4 5 Provider Patient Payer Shared Risk Model Partnering with patients to use pro - active approaches to keep them healthy Patients stay healthy and we have healthy margins Giving patients transparency and predictability in their healthcare expenditures Risk shared by UFH and insurer

33 33 Enhance Clinic Networks in Existing Markets Integrated Healthcare Services Model Generating Significant Synergies. Continue to Replicate Outpatient Networks in Existing Mar kets Significant Referral Revenue from Beijing Clinics (RMB mm) SUCCESSFUL HUB & SPOKE BUSINESS MODEL Source: Company; As of Dec 31, 2019 Hospitals Clinic Clinic Clinic Clinic Clinic Clinic 79 88 93 89 9.4% 9.7% 9.2% 8.4% 2019 2016 2017 2018 Beijing Hospital referral revenue from clinics C ontribution to hospital revenue

34 34 Upside Catalysts Delivering Additional Value CLEAR SPECIALTY FOCUS Continue deep specialization in select areas but maintain a comprehensive suite of services Grow IVF from Tianjin to nationwide New centers of excellence: oncology, orthopedics, ENT, sleep center, geriatric center, gynecology, advanced surgical , etc. TECHNOLOGY UPGRADES M&A OPPORTUNITIES Strategic acquisitions of specialty hospitals, outpatient and services network to further complement our existing portfolio Management contracts include a right to acquire managed hospitals Focus on increasing acuity services (robotics, oncology, advance imaging) to drive ASP / margin and create higher barriers to competitors Develop internet hospital and online portal to further engage with patients Continued investment in the AI and mobile technology for data analytics, online consultation, risk underwriting, preventive care

35 35 Investment Highlights Well - established nationwide platform with scale and an experienced management platform 4 Attractive valuation on a sum - of - the - parts basis 5 Multi - dimensional growth opportunities 6 The leading comprehensive healthcare services provider with the most reputable brand in China 2 Robust outlook of the Chinese private healthcare industry supported by favorable long term secular drivers 1 Unique hospital + clinic hub & spoke network; “entire lifecycle” coverage 3

36 APPENDIX A - INDUSTRY OVERVIEW

37 37 REVENUE FOR HEALTHCARE SERVICES IN CHINA - HOSPITALS & PRIMARY CARE (US$ bn) 1 CAGR 13 - 18 (%) CAGR 18 - 23 (%) 22% 11% 21% 9% (US$ bn) 1 42% 58% 59% 59% 59% 60% 62% 41% 41% 41% 40% 38% Rapid Growth in Demand for Healthcare Services 23% 25% CAGR 17 - 23 (%) 20% 22% CAGR 13 - 17 (%) Source: NHFPC, Company Analysis 1. Exchange rate at USD:RMB = 1.00 : 6.80 2. Annual high - end medical spending by residents (Expatriate, Local out of Pocket, Local Insured Patients) in Tier 1 & Tier 2 ci ties of China Local out of Pocket is defined as affluent households with annual income > RMB 324K Assumed addressable population all live in Tier 1 and Tier 2 cities; Tier 1 cities: Beijing, Shanghai, Guangzhou and Shenzhen ; Tier 2 cities: 46 cities incl. Tianjin, Nanjing, Hangzhou, Chongqing, Chengdu, Ningbo and etc. PREMIUM HEALTHCARE EXPENDITURE 2 IN CHINA 2023E 488 2013A 8% 389 340 2014A 92% 2015A 91% 2016A 88% 434 1,009 90% 2017A 89% 12% 544 2018A 609 10% 8% 9% 19% 11% 92% 81% Private Public 41% 59% 42% 58% 41% 2013A 2014A 59% 62% 2015A 41% 59% 2016A 40% 60% 2017A 38% 2023E 5 7 8 10 13 40 1st tier 2nd tier

38 38 China is Under - penetrated in Private Healthcare 0 5 10 15 20 25 30 35 40 45 50 55 60 65 70 75 80 85 300 700 500 600 900 1,000 1,100 400 1,300 1,200 800 5,300 0 Germany SOUTH AFRICA Spain Private healthcare spending per capita (US$) Taiwan South Korea GDP per capita (US$ ‘000) Canada Japan United States Singapore China France Switzerland BRAZIL Australia Asia NA EU LatAm & Africa AU South Africa and Brazil have lower/comparable income but higher spending than China China Tier 1 1 Source: EIU, Euromonitor, BMI, Hong Kong Food and Health Bureau; A s of 2017 1. Tier 1 cities include Beijing, Shanghai, Guangzhou and Shenzhen. Private healthcare spending per capita assumed to mirror pri vate vs. public hospital revenue trends in China Countries and Regions

39 39 (2,300) ( RMB bn ) Top Trends in the Chinese Public and Private Hospital Sectors Source: Frost & Sullivan, PwC survey on urban middle class Chinese, National Health and Family Planning Commission, Company A nal ysis; As of 2016 SCARCITY AND UNEVEN DISTRIBUTION OF QUALITY MEDICAL RESOURCES IMMENSE PRESSURE ON PUBLIC HEALTHCARE SYSTEM 3+ hours Average time to visit a physician 90+% Average bed occupancy rate in public hospitals <5 mins Actual time spent in a physician consultation Class III: 2,232 (8%) Class II: 7,944 (27%) Class I: 9,282 (32%) Unrated: 9,682 (33%) # of Annual Hospital Outpatient Visits (mm) Class III: 1,628 (50%) Class II: 1,217 (37%) Class I: 218 (7%) Unrated: 207 (6%) # of Hospitals in China EXPECTED DEFICIT OF THE BASIC SOCIAL MEDICAL INSURANCE 2020E 2026E Deficit is expected to arise TOP TRENDS IN THE PRIVATE HOSPITAL SECTOR Private hospitals in China are facing challenges that present unique opportunities for a branded comprehensive player like UFH Lack of a Comprehensive Service Provider − Most private hospital systems are focused on a single specialty / low acuity situations Highly Fragmented Market − Limited scaled players provide opportunity for a large, branded player like UFH Willingness to Pay − >80% of patients are willing to pay a premium to visit a private hospital − Huge under supply of premium hospitals Brand Recognition and Reputational Issues − Scarcity value as few players have both a strong brand and reputation TOP TRENDS IN THE PUBLIC HOSPITAL SECTOR

40 40 25 40 64 103 314 106 139 183 240 483 131 179 247 343 797 90 109 155 212 303 7% 8% 11% 15% 22% 0 200 400 2000A 2010A 2020E 2030E 2040E Population Aged 65+ as % of Total Population Aging Population and Commercial Healthcare Insurance are Key Long - Term Growth Drivers of Healthcare Services 15% 28% CAGR 18 - 23 (%) 15% 25% CAGR 12 - 18 (%) RAPIDLY AGING POPULATION China population aged 65+ (Persons mm) HIGH - END PHI 2 ADDRESSABLE POPULATION ('000) COMMERCIAL HEALTH INSURANCE GWP 1 (US$ bn) 2 China Population Aged 65+ (Persons mm) 2012A 2014A 2016A 2018E 2023E Source: United Nations, China Insurance Yearbook, CIRC, McKinsey Global Institute, Company Analysis 1. Include all local and foreign players. Health insurance GWP (gross written premium) includes premium sold by both life and P& C insurers 2. PHI = Private Health Insurance 3. Exchange rate at USD:RMB = 1.00 : 6.80 Tier 1 cities Tier 2 cities 2023E 2012A 13 2016A 2014A 2018E 23 59 94 294

41 41 APPENDIX B – ADDITIONAL MATERIALS
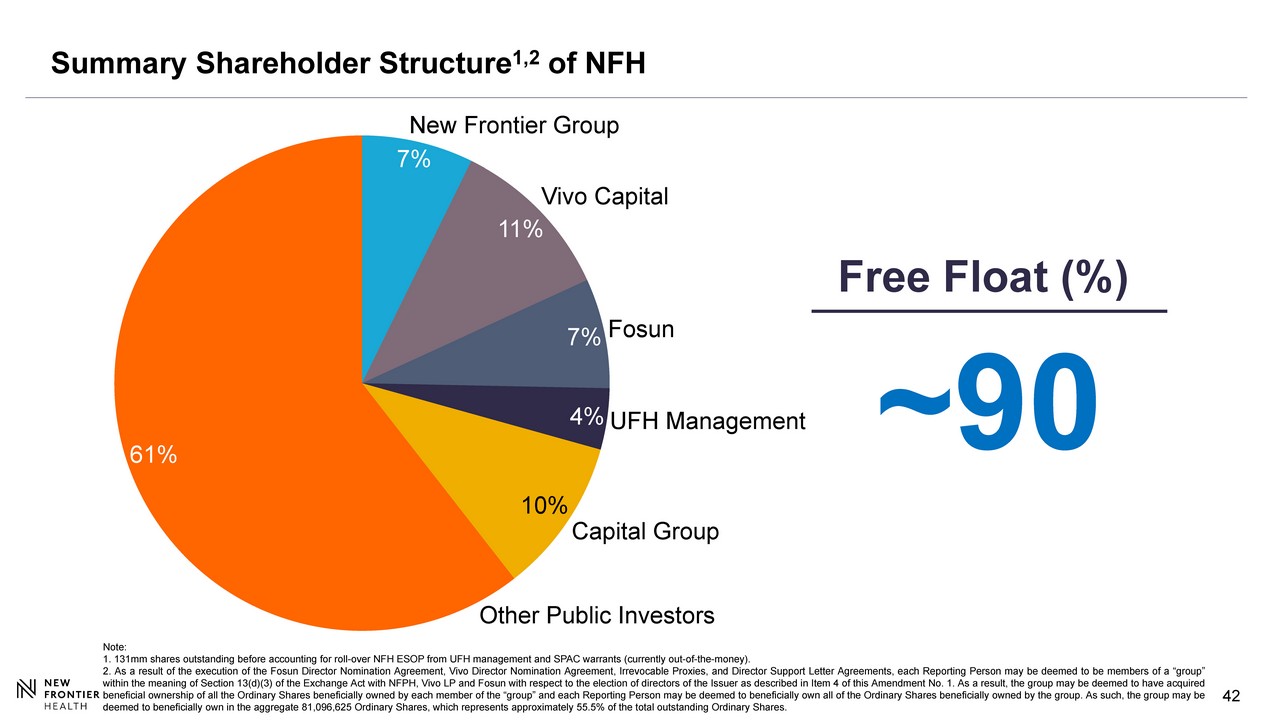
42 42 Summary Shareholder Structure 1,2 of NFH 7% 11% 7% 4% 10% 61% New Frontier Group Other Public Investors Vivo Capital Capital Group Fosun UFH Management Free Float (%) ~90 Note : 1 . 131 mm s hares outstanding before accounting for roll - over NFH ESOP from UFH management and SPAC warrants (currently out - of - the - money) . 2 . As a result of the execution of the Fosun Director Nomination Agreement, Vivo Director Nomination Agreement, Irrevocable Proxies, and Director Support Letter Agreements, each Reporting Person may be deemed to be members of a “group” within the meaning of Section 13 (d)( 3 ) of the Exchange Act with NFPH, Vivo LP and Fosun with respect to the election of directors of the Issuer as described in Item 4 of this Amendment No . 1 . As a result, the group may be deemed to have acquired beneficial ownership of all the Ordinary Shares beneficially owned by each member of the “group” and each Reporting Person may be deemed to beneficially own all of the Ordinary Shares beneficially owned by the group . As such, the group may be deemed to beneficially own in the aggregate 81 , 096 , 625 Ordinary Shares, which represents approximately 55 . 5 % of the total outstanding Ordinary Shares .

43 43 Management Team of NFH Roberta Lipson Antony Leung Carl Wu Executive Committee of the Board of Directors ▪ CEO of NFH ▪ Founder of United Family Healthcare ▪ Medical industry experience: 35+ years ▪ One of the most well - regarded healthcare executives in China ▪ Chairman of NFH ▪ Chairman / Co - Founder of New Frontier Group ▪ Chairman of Nan Fung Group ▪ Former HK Financial Secretary ▪ Former Chairman of Blackstone Greater China, JP Morgan Asia ▪ President and C hairman of Executive Committee of NFH ▪ CEO / Co - Founder of New Frontier Group ▪ Experienced healthcare entrepreneur (Co - founder of Care Alliance, YD Care, and Heal) ▪ Former Managing Director at Blackstone Operational / Medical Experts Sylvia Pan GM, Beijing ▪ Medical industry experience: 25+ years ▪ Medical industry experience: 15+ years ▪ Past experience: US CDC, Hawaii DMAT Dr. Kate Gaynor GM, Guangzhou ▪ Past experience: 25+ years in healthcare industry Walter Xue Chief Financial Officer David Zeng Chief Operating Officer ▪ Past experience: Blackstone Private Equity Group (HK), Barclays Daniel Liu GM, Tianjin ▪ Medical industry experience: 25+ years ▪ Past experience: CR Phoenix ▪ Medical industry experience: 20+ years ▪ Past experience: SIMC, Xinhua Hospital Dr. Michael Zhang GM, Shanghai Xiaoyan Shen Chief Nursing Officer ▪ Medical industry experience: 30+ years ▪ Medical industry experience: 12+ years Ao Wang GM, Qingdao Chairman of the Board Shan Fu ▪ Managing Partner, Co - CEO of Vivo Capital, CEO of Vivo Capital Greater China ▪ Former Senior Managing Director and Chief Representative of Blackstone China ▪ Department of Foreign Investment in National Development and Reform Commission (NDRC) ▪ State Economic and Trade Commission Dr. Kelly Xia CMO, Guangzhou UFH ▪ Professor of Pediatrics in China ▪ Published over 20 papers in medical journals

44 44 Experienced Board of Directors Independent Non - executive Directors Antony Leung Carl Wu Non - Independent Directors ▪ COO of NFH ▪ Managing Director of New Frontier Group ▪ Blackstone Private Equity Group (HK) ▪ Barclays David Zeng ▪ Chairman of NFH ▪ Chairman / Co - Founder of New Frontier Group ▪ Former Financial Secretary of Hong Kong ▪ Nan Fung Group Chairman and CEO ▪ Blackstone Chairman of Greater China ▪ J.P. Morgan Chairman of Asia ▪ Citibank Head of China & Hong Kong and Private Bank for Asia ▪ President and Chairman of Executive Committee of NFH ▪ CEO / Co - Founder of New Frontier Group ▪ Experienced healthcare entrepreneur (Co - founder of Care Alliance, YD Care, and Heal) ▪ Founding member of Blackstone Asia Pacific and Blackstone China Roberta Lipson Shan Fu Qiyu Chen ▪ CEO of NFH ▪ Founder of UFH ▪ Medical industry experience: 35+ years ▪ One of the most well regarded healthcare executives in China ▪ Managing Partner, Co - CEO and CEO of Vivo Capital in Greater China ▪ Senior Managing Director and Chief Representative of Blackstone ▪ Department of Foreign Investment in National Development and Reform Commission (NDRC) ▪ State Economic and Trade Commission ▪ Executive Director and the Co - CEO of Fosun International ▪ Executive Director and the Chairman of Fosun Pharma ▪ Non - executive director and Vice Chairman of Sinopharm Group Dr. C H Leong Frederick Ma ▪ Senior Advisor of New Frontier Group ▪ Hong Kong University Council Chairman ▪ Non - official member of the Executive Council of HKSAR ▪ Hong Kong Hospital Authority Chairman ▪ Member of Hong Kong Legislative Council ▪ Senior Advisor of New Frontier Group ▪ Independent Non - Executive Director of Guangshen Railway ▪ Non - executive Chairman of MTR ▪ Secretary for Commerce & Economic Development of HKSAR ▪ Secretary for Financial Services and the Treasury for HKSAR ▪ CFO of PCCW ▪ CEO of the Samling Group ▪ Former CEO of Deloitte China ▪ Former Executive Committee of Deloitte Touche Tohmatsu Limited ▪ Independent Non - Executive Director of BC Technology Group ▪ Over 30 years of experience in financial advisory and corporate finance in Greater China Lawrence Chia

45 Strong Cash Flow and Balance Sheet Notes: 1. Due to IFRS 16 adoption, capital lease payments is categorized as cash used for financing activities. 2. Maintenance capex is defined as all capex spent for existing operations of the facilities. 3. Expansionary capex is defined as capex spent for building new facilities including the new site of Shanghai Puxi Hospital, Sh ang hai Pudong Hospital, Guangzhou Hospital and Beijing Jingbei Women and Children’s United Family Hospital (“DTU”) (RMB million) 3Q20 Operating Cash Flow & Free Cash Flow: Cash Flow Generated from Operating Activities 49 Less: Capital Lease Payments 1 (40) Add: Interest Expense Paid 34 Add: One - off Transaction Expense Paid 6 Adjusted Operating Cash Flow 49 Less: Maintenance CAPEX (15) Free Cash Flow 34 CAPEX: Maintenance CAPEX 2 15 Expansionary CAPEX 3 75 Total CAPEX 90

46 46 Reconciliation of Non - IFRS Financial Measures Notes: 1. Monitoring fee payable to TPG and Fosun is not related to business operation and is discontinued from 2020 onwards . 2. The adjustments include ( i ) giving a pro forma effect to annual rent reimbursement of approximately RMB15 million which took effect in November 2019 as if such reimbursement commenced on January 1, 2019, (ii) adding back RMB 3.7 million for additional rental expenses incurred prior to the PXU relocation due to space constraints, and (iii) RMB 3.7 million of on goi ng net savings on fees payable to our business partner for this property in accordance with the rental reimbursement. For the quarter ended 31 December For the year ended 31 December For the quarter ended 30 September 2019 2019 2019 2020 Net loss (223) (430) (86) (70) Less: Finance income (1) (2) (1) (1) Add: Finance costs 54 157 33 62 Add: Foreign exchange loss/(gain) (13) 9 21 30 Less: Gain on disposal of a subsidiary - - - (1) Less: Other (income)/expenses, net 13 6 (6) 5 Add: Income tax expense/(benefit) 7 63 15 10 Operating (loss)/income (163) (198) (24) 35 Add: Share-based compensation expense/(benefit) 2 34 10 (3) Add: Depreciation and amortization 88 342 85 105 Add: Discontinued monitoring fee payable to Fosun Pharma and TPG 1 1 4 1 - Add: One-off transaction costs 147 160 9 1 Add: Relocation costs of New Puxi Hospital 3 6 3 - Add: Severance costs - - - 2 Adjusted EBITDA 79 349 84 140 Less: Lease expense adjustments as a result of IFRS 16 adoption (53) (205) (50) (50) Adjusted EBITDA (before IFRS 16 adoption) 26 144 34 90 Add: PXU Pro-forma Adjustments 2 2 19 Pro-forma Adjusted EBITDA 28 163 34 90 (in RMB million)
Serious News for Serious Traders! Try StreetInsider.com Premium Free!
You May Also Be Interested In
- Renewable Fuels Project in Canada Begins Production
- ROSEN, A TRUSTED AND LEADING LAW FIRM, Encourages Zoetis Inc. Investors to Inquire About Securities Class Action Investigation – ZTS
- Inverness Graham Strengthens its Value Creation Group with the Addition of Two Seasoned Operating Executives
Create E-mail Alert Related Categories
SEC FilingsSign up for StreetInsider Free!
Receive full access to all new and archived articles, unlimited portfolio tracking, e-mail alerts, custom newswires and RSS feeds - and more!
