

Form 8-K Daseke, Inc. For: Oct 30
 Tweet
Tweet Share
ShareExhibit 99.1
| Q3 2020 Earnings Presentation October 30, 2020 |
| Important Disclaimers 2 Forward-Looking Statements This presentation contains “forward-looking statements” within the meaning of the Private Securities Litigation Reform Act of 1995. All statements, other than statements of historical fact, are forward-looking statements. Forward-looking statements may be identified by the use of words such as “may,” “will,” “continue,” “forecast,” “intend,” “seek,” “target,” “anticipate,” “believe,” “expect,” “estimate,” “plan,” “outlook,” “should,” “could,” “would,” “predict,” “potential,” and “project,” the negative of these terms, or other comparable terminology and similar expressions. Forward-looking statements may include projected financial information and results as well as statements about Daseke’s goals, including its restructuring plans; Daseke’s financial strategy, liquidity and capital required for its business strategy and plans; and general economic conditions. The forward-looking statements contained herein are based on information available as of the date of this news release and current expectations, forecasts and assumptions. While management believes that these forward-looking statements are reasonable as and when made, there can be no assurance that future developments affecting us will be those that Daseke anticipates, and readers are cautioned not to place undue reliance on the forward-looking statements. A number of factors, many of which are beyond our control, could cause actual results or outcomes to differ materially from those indicated by the forward-looking statements contained herein. These factors include, but are not limited to, general economic and business risks, such as downturns in customers’ business cycles and disruptions in capital and credit markets (including as a result of the coronavirus (COVID-19) pandemic or other global and national heath epidemics or concerns); Daseke’s ability to adequately address downward pricing and other competitive pressures; driver shortages and increases in driver compensation or owner-operator contracted rates; Daseke’s ability to execute and realize all of the expected benefits of its integration, business improvement and comprehensive restructuring plans; loss of key personnel; Daseke’s ability to realize all of the intended benefits from recent or future acquisitions; Daseke’s ability to complete recent or future divestitures successfully; seasonality and the impact of weather and other catastrophic events; fluctuations in the price or availability of diesel fuel; increased prices for, or decreases in the availability of, new revenue equipment and decreases in the value of used revenue equipment; Daseke’s ability to generate sufficient cash to service all of its indebtedness and Daseke’s ability to finance its capital requirements; restrictions in Daseke’s existing and future debt agreements; increases in interest rates; changes in existing laws or regulations, including environmental and worker health safety laws and regulations and those relating to tax rates or taxes in general; the impact of governmental regulations and other governmental actions related to Daseke and its operations; insurance and claims expenses; and litigation and governmental proceedings. For additional information regarding known material factors that could cause our actual results to differ from those expressed in forward-looking statements, please see Daseke’s filings with the Securities and Exchange Commission (the “SEC”), available at www.sec.gov, including Daseke’s Annual Report on Form 10-K filed with the SEC on March 10, 2020 and subsequent Quarterly Reports on Form 10-Q, particularly the section titled “Risk Factors.” The effect of the COVID-19 pandemic may remain prevalent for a significant period of time and may continue to adversely affect the Company’s business, results of operations and financial condition even after the COVID-19 pandemic has subsided and “stay at home” mandates have been lifted. The extent to which the COVID-19 pandemic impacts the Company will depend on numerous evolving factors and future developments that we are not able to predict. There are no comparable recent events that provide guidance as to the effect the COVID-19 global pandemic may have, and, as a result, the ultimate impact of the pandemic is highly uncertain and subject to change. Additionally, the Company will regularly evaluate its capital structure and liquidity position. From time to time and as opportunities arise, the Company may access the debt capital markets and modify its debt arrangements to optimize its capital structure and liquidity position. Daseke does not undertake any obligation to update forward-looking statements to reflect events or circumstances after the date as of when they were made, whether as a result of new information, future events or otherwise, except as may be required under applicable securities laws. You should not place undue reliance on these forward-looking statements. Non-GAAP Financial Measures This presentation includes non-GAAP financial measures for the Company and its reporting segments. The Company believes its presentation of Non-GAAP financial measures is useful because it provides investors and industry analysts the same information that the Company uses internally for purposes of assessing its core operating performance. You can find the reconciliations of these measures to the nearest comparable GAAP measure in the Appendix of this presentation. Please note that non-GAAP measures are not a substitute for, or more meaningful than, net income (loss), cash flows from operating activities, operating income or any other measure prescribed by GAAP, and there are limitations to using non-GAAP measures. Certain items excluded from these non- GAAP measures are significant components in understanding and assessing a company’s financial performance, such as a company’s cost of capital, tax structure and the historic costs of depreciable assets. Also, other companies in Daseke’s industry may define these non‐GAAP measures differently than Daseke does, and as a result, it may be difficult to use these non‐GAAP measures to compare the performance of those companies to Daseke’s performance. Because of these limitations, these non-GAAP measures should not be considered a measure of the income generated by Daseke’s business or discretionary cash available to it to invest in the growth of its business. Daseke’s management compensates for these limitations by relying primarily on Daseke’s GAAP results and using these non-GAAP measures supplementally. Daseke defines Adjusted EBITDA as net income (loss) plus (i) depreciation and amortization, (ii) interest expense, and other fees and charges associated with financings, net of interest income, (iii) income taxes, (iv) acquisition-related transaction expenses (including due diligence costs, legal, accounting and other advisory fees and costs, retention and severance payments and financing fees and expenses), (v) business transformation costs, (vi) non-cash impairment, (vii) restructuring charges, (viii) stock compensation expense, and (ix) impaired lease termination. Daseke defines Adjusted EBITDA Margin as Adjusted EBITDA as a percentage of total revenue. Daseke defines Adjusted Net Income (Loss) as net income (loss) adjusted for acquisition related transaction expenses, business transformation costs, non-cash impairments, restructuring charges, amortization of intangible assets, the net impact of step-up in basis of acquired assets and unusual or non-regularly recurring expenses or recoveries. Daseke defines Adjusted Operating Expenses as (a) total operating expenses (i) less, acquisition-related transaction expenses, non-cash impairment charges, unusual or non-regularly recurring expenses or recoveries, (ii) less, business transformation costs, (iii) adjusted for impaired lease termination and (iv) further adjusted for the net impact of the step-up in basis (such as increased depreciation and amortization expense) and amortization of identifiable intangible assets resulting from acquisitions. Daseke defines Adjusted Operating Income (Loss) as (a) total revenue less (b) Adjusted Operating Expenses. Daseke defines Adjusted Operating Ratio as (a) Adjusted Operating Expenses, as a percentage of (b) total revenue.. Daseke defines Free Cash Flow as net cash provided by operating activities less purchases of property and equipment, plus proceeds from sale of property and equipment as such amounts are shown on the face of the Statements of Cash Flows. Daseke defines Net Debt as total debt less cash. See the Appendix for directly comparable GAAP measures. Industry and Market Data This presentation includes market data and other statistical information from third party sources, including independent industry publications, government publications and other published independent sources. Although Daseke believes these third-party sources are reliable as of their respective dates, Daseke has not independently verified the accuracy or completeness of this information. |
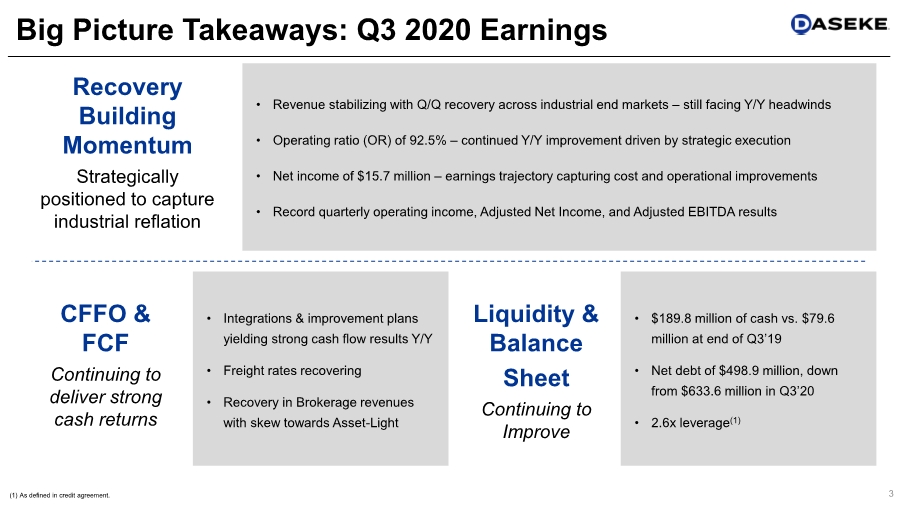
| • Integrations & improvement plans yielding strong cash flow results Y/Y • Freight rates recovering • Recovery in Brokerage revenues with skew towards Asset-Light 3 Big Picture Takeaways: Q3 2020 Earnings Liquidity & Balance Sheet Continuing to Improve Recovery Building Momentum Strategically positioned to capture industrial reflation • $189.8 million of cash vs. $79.6 million at end of Q3’19 • Net debt of $498.9 million, down from $633.6 million in Q3’20 • 2.6x leverage(1) • Revenue stabilizing with Q/Q recovery across industrial end markets – still facing Y/Y headwinds • Operating ratio (OR) of 92.5% – continued Y/Y improvement driven by strategic execution • Net income of $15.7 million – earnings trajectory capturing cost and operational improvements • Record quarterly operating income, Adjusted Net Income, and Adjusted EBITDA results CFFO & FCF Continuing to deliver strong cash returns (1) As defined in credit agreement. |
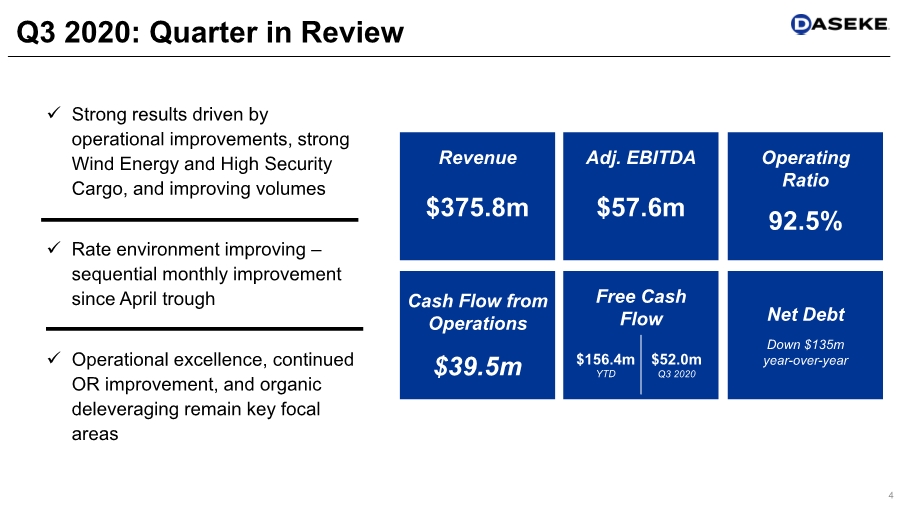
| ✓ Strong results driven by operational improvements, strong Wind Energy and High Security Cargo, and improving volumes ✓ Rate environment improving – sequential monthly improvement since April trough ✓ Operational excellence, continued OR improvement, and organic deleveraging remain key focal areas Cash Flow from Operations $39.5m Net Debt Down $135m year-over-year Q3 2020: Quarter in Review Revenue $375.8m 4 Adj. EBITDA $57.6m Free Cash Flow $156.4m YTD $52.0m Q3 2020 Operating Ratio 92.5% |
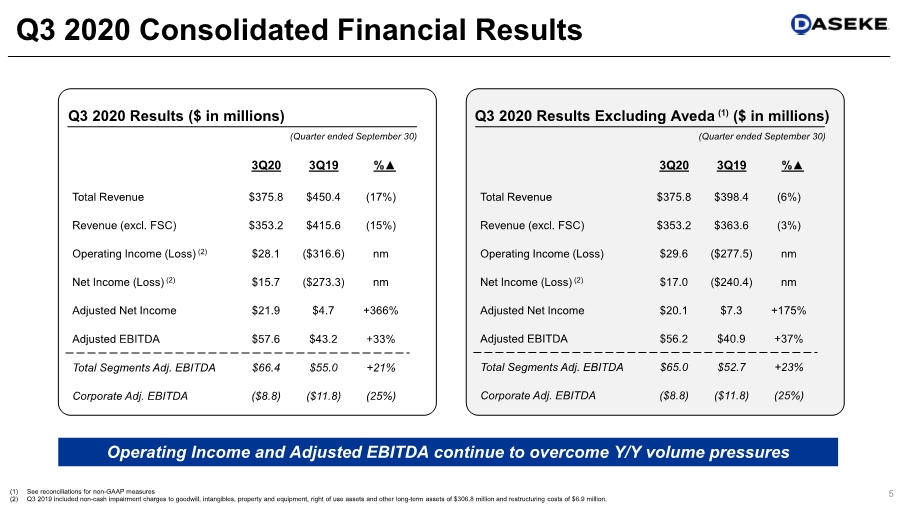
| 5 Q3 2020 Consolidated Financial Results (Quarter ended September 30) Q3 2020 Results ($ in millions) Operating Income and Adjusted EBITDA continue to overcome Y/Y volume pressures 3Q20 3Q19 %▲ Total Revenue $375.8 $450.4 (17%) Revenue (excl. FSC) $353.2 $415.6 (15%) Operating Income (Loss) (2) $28.1 ($316.6) nm Net Income (Loss) (2) $15.7 ($273.3) nm Adjusted Net Income $21.9 $4.7 +366% Adjusted EBITDA $57.6 $43.2 +33% Total Segments Adj. EBITDA $66.4 $55.0 +21% Corporate Adj. EBITDA ($8.8) ($11.8) (25%) (Quarter ended September 30) Q3 2020 Results Excluding Aveda (1) ($ in millions) 3Q20 3Q19 %▲ Total Revenue $375.8 $398.4 (6%) Revenue (excl. FSC) $353.2 $363.6 (3%) Operating Income (Loss) $29.6 ($277.5) nm Net Income (Loss) (2) $17.0 ($240.4) nm Adjusted Net Income $20.1 $7.3 +175% Adjusted EBITDA $56.2 $40.9 +37% Total Segments Adj. EBITDA $65.0 $52.7 +23% Corporate Adj. EBITDA ($8.8) ($11.8) (25%) (1) See reconciliations for non-GAAP measures (2) Q3 2019 included non-cash impairment charges to goodwill, intangibles, property and equipment, right of use assets and other long-term assets of $306.8 million and restructuring costs of $6.9 million. |
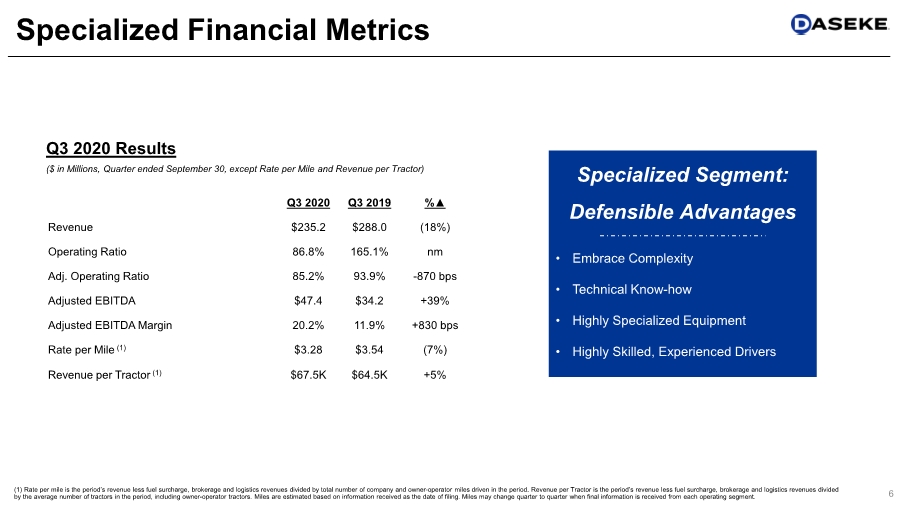
| 6 Specialized Financial Metrics (1) Rate per mile is the period’s revenue less fuel surcharge, brokerage and logistics revenues divided by total number of company and owner-operator miles driven in the period. Revenue per Tractor is the period’s revenue less fuel surcharge, brokerage and logistics revenues divided by the average number of tractors in the period, including owner-operator tractors. Miles are estimated based on information received as the date of filing. Miles may change quarter to quarter when final information is received from each operating segment. Q3 2020 Q3 2019 %▲ Revenue $235.2 $288.0 (18%) Operating Ratio 86.8% 165.1% nm Adj. Operating Ratio 85.2% 93.9% -870 bps Adjusted EBITDA $47.4 $34.2 +39% Adjusted EBITDA Margin 20.2% 11.9% +830 bps Rate per Mile (1) $3.28 $3.54 (7%) Revenue per Tractor (1) $67.5K $64.5K +5% ($ in Millions, Quarter ended September 30, except Rate per Mile and Revenue per Tractor) Q3 2020 Results Specialized Segment: Defensible Advantages • Embrace Complexity • Technical Know-how • Highly Specialized Equipment • Highly Skilled, Experienced Drivers |
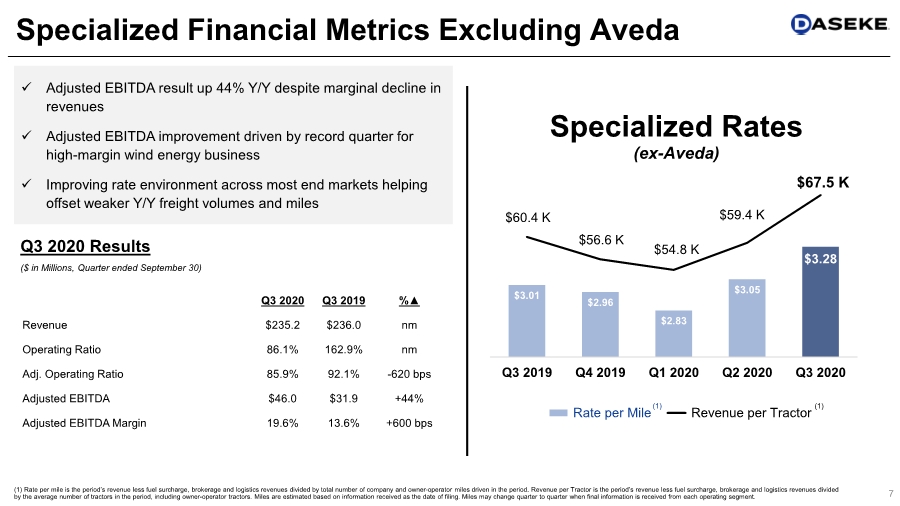
| $3.01 $2.96 $2.83 $3.05 $3.28 $60.4 K $56.6 K $54.8 K $59.4 K $67.5 K $40.00 $45.00 $50.00 $55.00 $60.00 $65.00 $70.00 $2.50 $2.70 $2.90 $3.10 $3.30 $3.50 $3.70 Q3 2019 Q4 2019 Q1 2020 Q2 2020 Q3 2020 Specialized Rates (ex-Aveda) Rate per Mile Revenue per Tractor 7 Specialized Financial Metrics Excluding Aveda Q3 2020 Q3 2019 %▲ Revenue $235.2 $236.0 nm Operating Ratio 86.1% 162.9% nm Adj. Operating Ratio 85.9% 92.1% -620 bps Adjusted EBITDA $46.0 $31.9 +44% Adjusted EBITDA Margin 19.6% 13.6% +600 bps (1) (1) ($ in Millions, Quarter ended September 30) Q3 2020 Results ✓ Adjusted EBITDA result up 44% Y/Y despite marginal decline in revenues ✓ Adjusted EBITDA improvement driven by record quarter for high-margin wind energy business ✓ Improving rate environment across most end markets helping offset weaker Y/Y freight volumes and miles (1) Rate per mile is the period’s revenue less fuel surcharge, brokerage and logistics revenues divided by total number of company and owner-operator miles driven in the period. Revenue per Tractor is the period’s revenue less fuel surcharge, brokerage and logistics revenues divided by the average number of tractors in the period, including owner-operator tractors. Miles are estimated based on information received as the date of filing. Miles may change quarter to quarter when final information is received from each operating segment. |
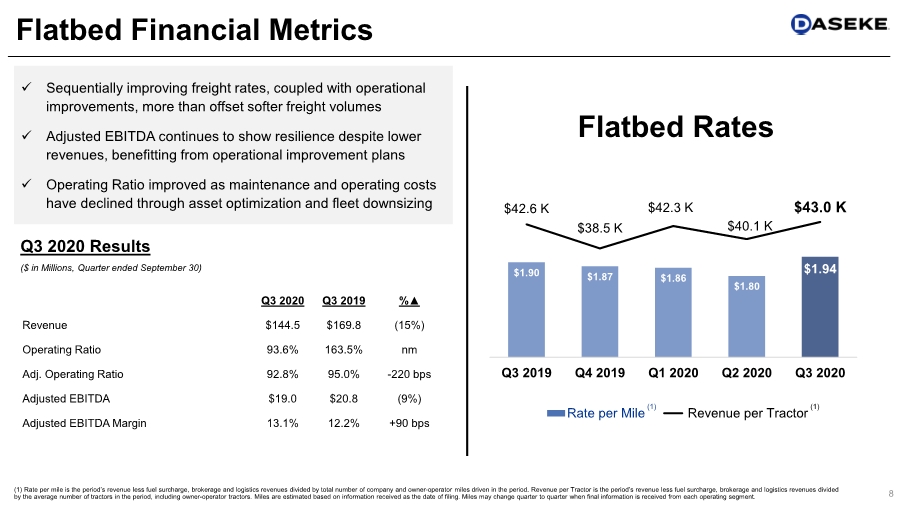
| 8 Flatbed Financial Metrics $1.90 $1.87 $1.86 $1.80 $1.94 $42.6 K $38.5 K $42.3 K $40.1 K $43.0 K $20.00 $25.00 $30.00 $35.00 $40.00 $45.00 $50.00 $1.20 $1.40 $1.60 $1.80 $2.00 $2.20 $2.40 Q3 2019 Q4 2019 Q1 2020 Q2 2020 Q3 2020 Flatbed Rates Rate per Mile Revenue per Tractor (1) (1) Q3 2020 Q3 2019 %▲ Revenue $144.5 $169.8 (15%) Operating Ratio 93.6% 163.5% nm Adj. Operating Ratio 92.8% 95.0% -220 bps Adjusted EBITDA $19.0 $20.8 (9%) Adjusted EBITDA Margin 13.1% 12.2% +90 bps ($ in Millions, Quarter ended September 30) Q3 2020 Results ✓ Sequentially improving freight rates, coupled with operational improvements, more than offset softer freight volumes ✓ Adjusted EBITDA continues to show resilience despite lower revenues, benefitting from operational improvement plans ✓ Operating Ratio improved as maintenance and operating costs have declined through asset optimization and fleet downsizing (1) Rate per mile is the period’s revenue less fuel surcharge, brokerage and logistics revenues divided by total number of company and owner-operator miles driven in the period. Revenue per Tractor is the period’s revenue less fuel surcharge, brokerage and logistics revenues divided by the average number of tractors in the period, including owner-operator tractors. Miles are estimated based on information received as the date of filing. Miles may change quarter to quarter when final information is received from each operating segment. |
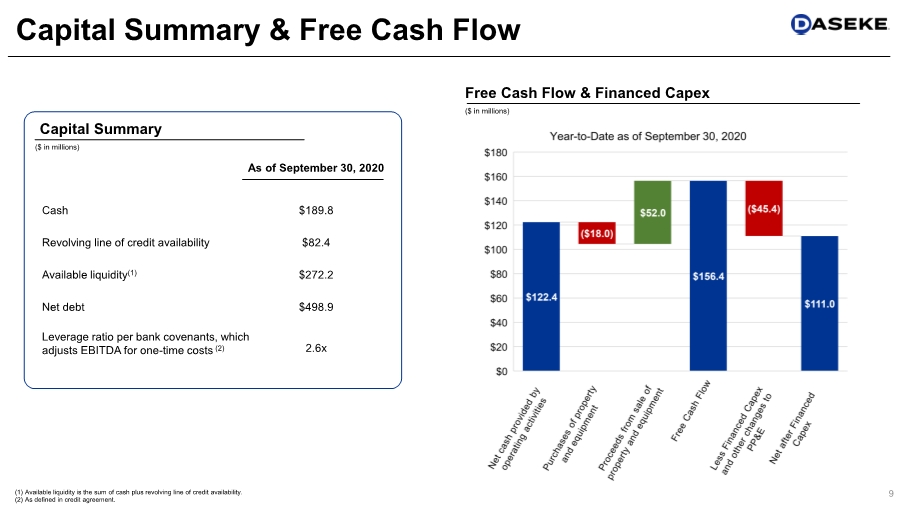
| Cash $189.8 Revolving line of credit availability $82.4 Available liquidity(1) $272.2 Net debt $498.9 Leverage ratio per bank covenants, which adjusts EBITDA for one-time costs (2) 2.6x 9 Capital Summary & Free Cash Flow (1) Available liquidity is the sum of cash plus revolving line of credit availability. (2) As defined in credit agreement. ($ in millions) Capital Summary As of September 30, 2020 ($ in millions) Free Cash Flow & Financed Capex |
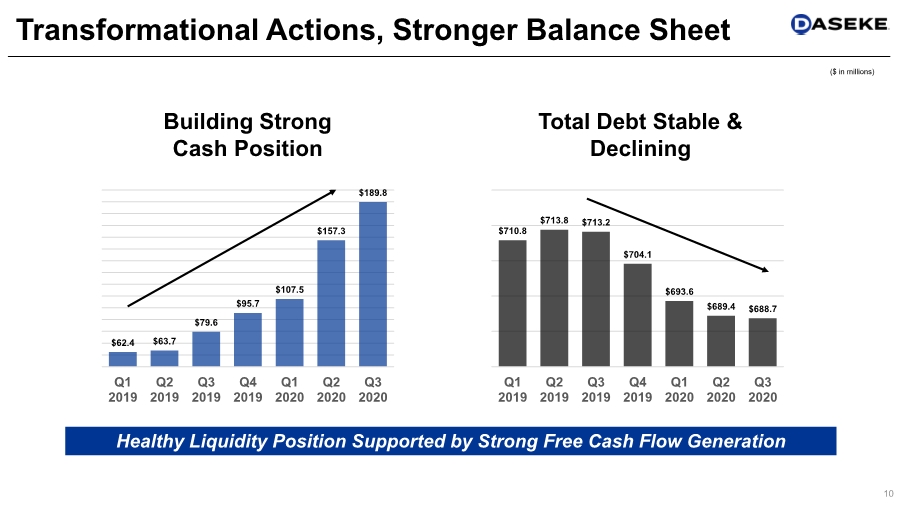
| Transformational Actions, Stronger Balance Sheet 10 $62.4 $63.7 $79.6 $95.7 $107.5 $157.3 $189.8 $50.00 $60.00 $70.00 $80.00 $90.00 $100.00 $110.00 $120.00 $130.00 $140.00 $150.00 $160.00 $170.00 $180.00 $190.00 $200.00 Q1 2019 Q2 2019 Q3 2019 Q4 2019 Q1 2020 Q2 2020 Q3 2020 Building Strong Cash Position $710.8 $713.8 $713.2 $704.1 $693.6 $689.4 $688.7 $675.00 $685.00 $695.00 $705.00 $715.00 $725.00 Q1 2019 Q2 2019 Q3 2019 Q4 2019 Q1 2020 Q2 2020 Q3 2020 Total Debt Stable & Declining Healthy Liquidity Position Supported by Strong Free Cash Flow Generation ($ in millions) |
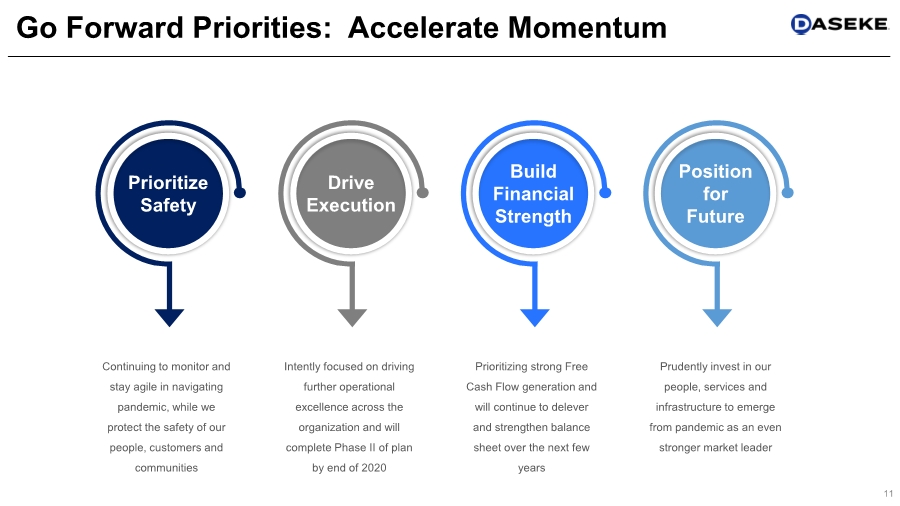
| Go Forward Priorities: Accelerate Momentum 11 Prioritize Safety Continuing to monitor and stay agile in navigating pandemic, while we protect the safety of our people, customers and communities Drive Execution Intently focused on driving further operational excellence across the organization and will complete Phase II of plan by end of 2020 Build Financial Strength Prioritizing strong Free Cash Flow generation and will continue to delever and strengthen balance sheet over the next few years Position for Future Prudently invest in our people, services and infrastructure to emerge from pandemic as an even stronger market leader |
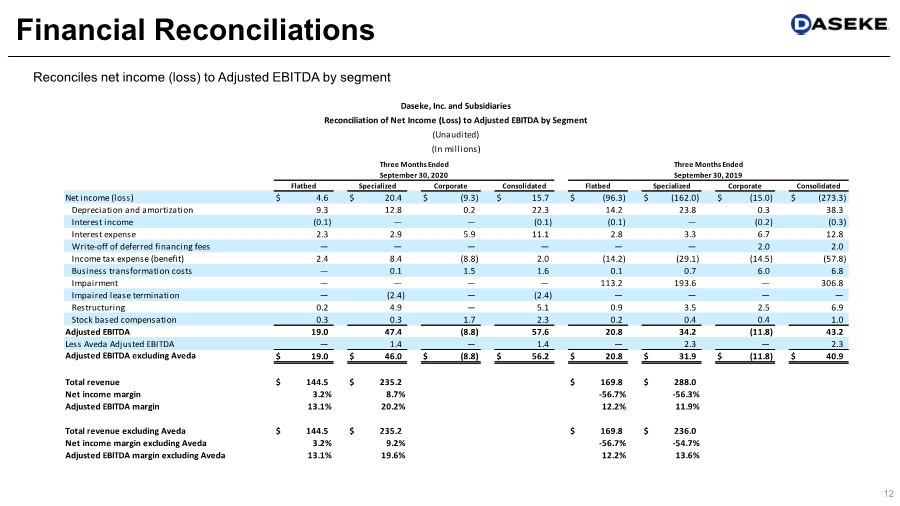
| 12 Financial Reconciliations Reconciles net income (loss) to Adjusted EBITDA by segment Net income (loss) $ 4.6 $ 20.4 $ (9.3) $ 15.7 $ (96.3) $ (162.0) $ (15.0) $ (273.3) Depreciation and amortization 9.3 12.8 0.2 22.3 14.2 23.8 0.3 38.3 Interest income (0.1) — — (0.1) (0.1) — (0.2) (0.3) Interest expense 2.3 2.9 5.9 11.1 2.8 3.3 6.7 12.8 Write-off of deferred financing fees — — — — — — 2.0 2.0 Income tax expense (benefit) 2.4 8.4 (8.8) 2.0 (14.2) (29.1) (14.5) (57.8) Business transformation costs — 0.1 1.5 1.6 0.1 0.7 6.0 6.8 Impairment — — — — 113.2 193.6 — 306.8 Impaired lease termination — (2.4) — (2.4) — — — — Restructuring 0.2 4.9 — 5.1 0.9 3.5 2.5 6.9 Stock based compensation 0.3 0.3 1.7 2.3 0.2 0.4 0.4 1.0 Adjusted EBITDA 19.0 47.4 (8.8) 57.6 20.8 34.2 (11.8) 43.2 Less Aveda Adjusted EBITDA — 1.4 — 1.4 — 2.3 — 2.3 Adjusted EBITDA excluding Aveda $ 19.0 $ 46.0 $ (8.8) $ 56.2 $ 20.8 $ 31.9 $ (11.8) $ 40.9 Total revenue $ 144.5 $ 235.2 $ 169.8 $ 288.0 Net income margin 3.2% 8.7% -56.7% -56.3% Adjusted EBITDA margin 13.1% 20.2% 12.2% 11.9% Total revenue excluding Aveda $ 144.5 $ 235.2 $ 169.8 $ 236.0 Net income margin excluding Aveda 3.2% 9.2% -56.7% -54.7% Adjusted EBITDA margin excluding Aveda 13.1% 19.6% 12.2% 13.6% Flatbed Specialized Corporate Consolidated Daseke, Inc. and Subsidiaries Reconciliation of Net Income (Loss) to Adjusted EBITDA by Segment (Unaudited) (In millions) Flatbed Specialized Corporate Consolidated Three Months Ended September 30, 2019 Three Months Ended September 30, 2020 |
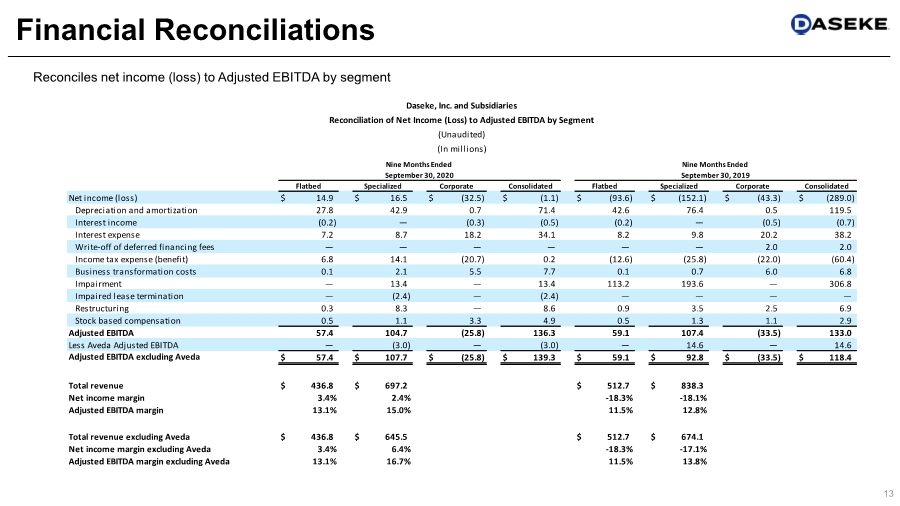
| 13 Financial Reconciliations Reconciles net income (loss) to Adjusted EBITDA by segment Net income (loss) $ 14.9 $ 16.5 $ (32.5) $ (1.1) $ (93.6) $ (152.1) $ (43.3) $ (289.0) Depreciation and amortization 27.8 42.9 0.7 71.4 42.6 76.4 0.5 119.5 Interest income (0.2) — (0.3) (0.5) (0.2) — (0.5) (0.7) Interest expense 7.2 8.7 18.2 34.1 8.2 9.8 20.2 38.2 Write-off of deferred financing fees — — — — — — 2.0 2.0 Income tax expense (benefit) 6.8 14.1 (20.7) 0.2 (12.6) (25.8) (22.0) (60.4) Business transformation costs 0.1 2.1 5.5 7.7 0.1 0.7 6.0 6.8 Impairment — 13.4 — 13.4 113.2 193.6 — 306.8 Impaired lease termination — (2.4) — (2.4) — — — — Restructuring 0.3 8.3 — 8.6 0.9 3.5 2.5 6.9 Stock based compensation 0.5 1.1 3.3 4.9 0.5 1.3 1.1 2.9 Adjusted EBITDA 57.4 104.7 (25.8) 136.3 59.1 107.4 (33.5) 133.0 Less Aveda Adjusted EBITDA — (3.0) — (3.0) — 14.6 — 14.6 Adjusted EBITDA excluding Aveda $ 57.4 $ 107.7 $ (25.8) $ 139.3 $ 59.1 $ 92.8 $ (33.5) $ 118.4 Total revenue $ 436.8 $ 697.2 $ 512.7 $ 838.3 Net income margin 3.4% 2.4% -18.3% -18.1% Adjusted EBITDA margin 13.1% 15.0% 11.5% 12.8% Total revenue excluding Aveda $ 436.8 $ 645.5 $ 512.7 $ 674.1 Net income margin excluding Aveda 3.4% 6.4% -18.3% -17.1% Adjusted EBITDA margin excluding Aveda 13.1% 16.7% 11.5% 13.8% Nine Months Ended Nine Months Ended September 30, 2020 September 30, 2019 Flatbed Specialized Corporate Consolidated Flatbed Specialized Corporate Consolidated Daseke, Inc. and Subsidiaries Reconciliation of Net Income (Loss) to Adjusted EBITDA by Segment (Unaudited) (In millions) |
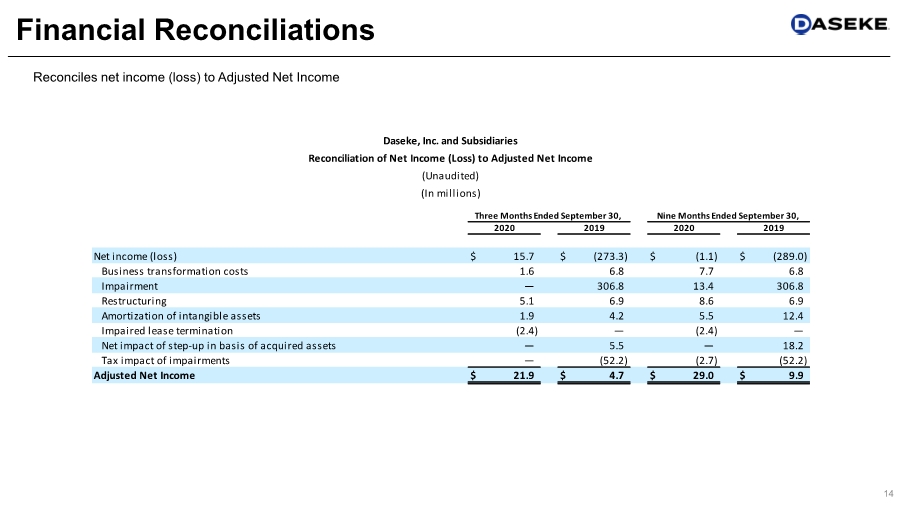
| 14 Financial Reconciliations Reconciles net income (loss) to Adjusted Net Income Net income (loss) $ 15.7 $ (273.3) $ (1.1) $ (289.0) Business transformation costs 1.6 6.8 7.7 6.8 Impairment — 306.8 13.4 306.8 Restructuring 5.1 6.9 8.6 6.9 Amortization of intangible assets 1.9 4.2 5.5 12.4 Impaired lease termination (2.4) — (2.4) — Net impact of step-up in basis of acquired assets — 5.5 — 18.2 Tax impact of impairments — (52.2) (2.7) (52.2) Adjusted Net Income $ 21.9 $ 4.7 $ 29.0 $ 9.9 2020 2019 2020 2019 Daseke, Inc. and Subsidiaries Reconciliation of Net Income (Loss) to Adjusted Net Income (Unaudited) (In millions) Three Months Ended September 30, Nine Months Ended September 30, |
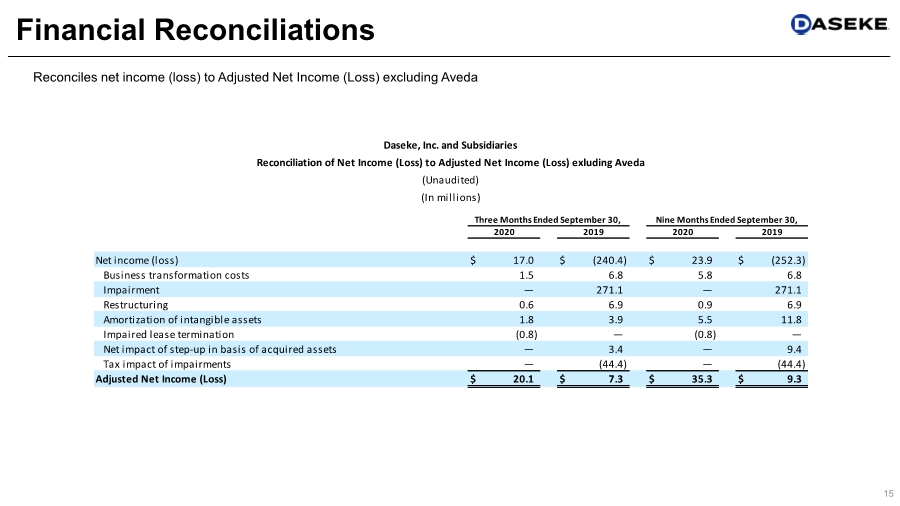
| 15 Financial Reconciliations Reconciles net income (loss) to Adjusted Net Income (Loss) excluding Aveda Net income (loss) $ 17.0 $ (240.4) $ 23.9 $ (252.3) Business transformation costs 1.5 6.8 5.8 6.8 Impairment — 271.1 — 271.1 Restructuring 0.6 6.9 0.9 6.9 Amortization of intangible assets 1.8 3.9 5.5 11.8 Impaired lease termination (0.8) — (0.8) — Net impact of step-up in basis of acquired assets — 3.4 — 9.4 Tax impact of impairments — (44.4) — (44.4) Adjusted Net Income (Loss) $ 20.1 $ 7.3 $ 35.3 $ 9.3 2020 2019 2020 2019 Daseke, Inc. and Subsidiaries Reconciliation of Net Income (Loss) to Adjusted Net Income (Loss) exluding Aveda (Unaudited) (In millions) Three Months Ended September 30, Nine Months Ended September 30, |
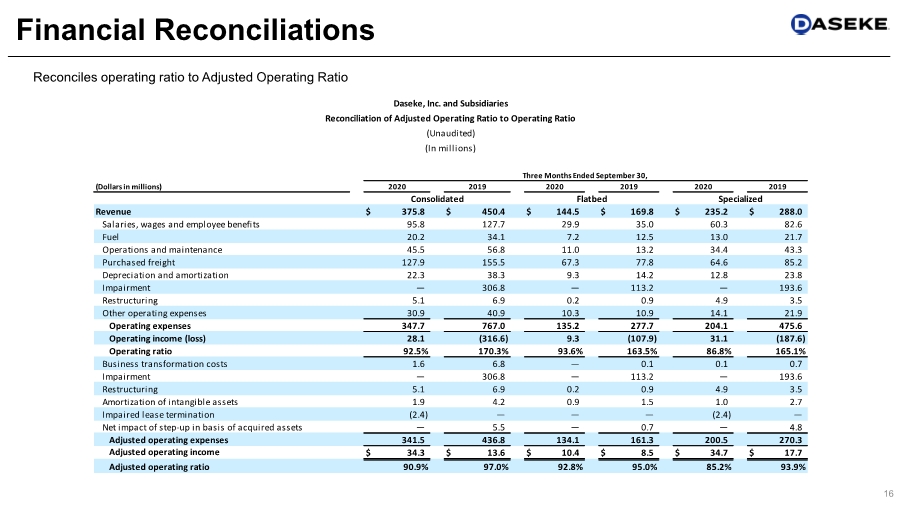
| 16 Financial Reconciliations Reconciles operating ratio to Adjusted Operating Ratio (Dollars in millions) Revenue $ 375.8 $ 450.4 $ 144.5 $ 169.8 $ 235.2 $ 288.0 Salaries, wages and employee benefits 95.8 127.7 29.9 35.0 60.3 82.6 Fuel 20.2 34.1 7.2 12.5 13.0 21.7 Operations and maintenance 45.5 56.8 11.0 13.2 34.4 43.3 Purchased freight 127.9 155.5 67.3 77.8 64.6 85.2 Depreciation and amortization 22.3 38.3 9.3 14.2 12.8 23.8 Impairment — 306.8 — 113.2 — 193.6 Restructuring 5.1 6.9 0.2 0.9 4.9 3.5 Other operating expenses 30.9 40.9 10.3 10.9 14.1 21.9 Operating expenses 347.7 767.0 135.2 277.7 204.1 475.6 Operating income (loss) 28.1 (316.6) 9.3 (107.9) 31.1 (187.6) Operating ratio 92.5% 170.3% 93.6% 163.5% 86.8% 165.1% Business transformation costs 1.6 6.8 — 0.1 0.1 0.7 Impairment — 306.8 — 113.2 — 193.6 Restructuring 5.1 6.9 0.2 0.9 4.9 3.5 Amortization of intangible assets 1.9 4.2 0.9 1.5 1.0 2.7 Impaired lease termination (2.4) — — — (2.4) — Net impact of step-up in basis of acquired assets — 5.5 — 0.7 — 4.8 Adjusted operating expenses 341.5 436.8 134.1 161.3 200.5 270.3 Adjusted operating income $ 34.3 $ 13.6 $ 10.4 $ 8.5 $ 34.7 $ 17.7 Adjusted operating ratio 90.9% 97.0% 92.8% 95.0% 85.2% 93.9% Daseke, Inc. and Subsidiaries Reconciliation of Adjusted Operating Ratio to Operating Ratio (Unaudited) (In millions) Three Months Ended September 30, 2020 2019 Consolidated 2020 2019 Flatbed 2020 2019 Specialized |
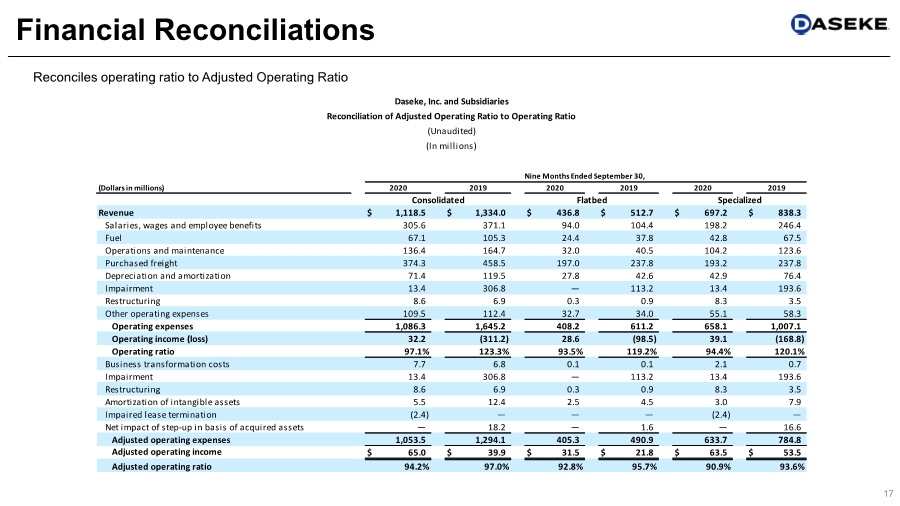
| Financial Reconciliations Reconciles operating ratio to Adjusted Operating Ratio 17 (Dollars in millions) Revenue $ 1,118.5 $ 1,334.0 $ 436.8 $ 512.7 $ 697.2 $ 838.3 Salaries, wages and employee benefits 305.6 371.1 94.0 104.4 198.2 246.4 Fuel 67.1 105.3 24.4 37.8 42.8 67.5 Operations and maintenance 136.4 164.7 32.0 40.5 104.2 123.6 Purchased freight 374.3 458.5 197.0 237.8 193.2 237.8 Depreciation and amortization 71.4 119.5 27.8 42.6 42.9 76.4 Impairment 13.4 306.8 — 113.2 13.4 193.6 Restructuring 8.6 6.9 0.3 0.9 8.3 3.5 Other operating expenses 109.5 112.4 32.7 34.0 55.1 58.3 Operating expenses 1,086.3 1,645.2 408.2 611.2 658.1 1,007.1 Operating income (loss) 32.2 (311.2) 28.6 (98.5) 39.1 (168.8) Operating ratio 97.1% 123.3% 93.5% 119.2% 94.4% 120.1% Business transformation costs 7.7 6.8 0.1 0.1 2.1 0.7 Impairment 13.4 306.8 — 113.2 13.4 193.6 Restructuring 8.6 6.9 0.3 0.9 8.3 3.5 Amortization of intangible assets 5.5 12.4 2.5 4.5 3.0 7.9 Impaired lease termination (2.4) — — — (2.4) — Net impact of step-up in basis of acquired assets — 18.2 — 1.6 — 16.6 Adjusted operating expenses 1,053.5 1,294.1 405.3 490.9 633.7 784.8 Adjusted operating income $ 65.0 $ 39.9 $ 31.5 $ 21.8 $ 63.5 $ 53.5 Adjusted operating ratio 94.2% 97.0% 92.8% 95.7% 90.9% 93.6% 2020 2019 2020 2019 Consolidated Flatbed Specialized 2020 2019 Nine Months Ended September 30, Daseke, Inc. and Subsidiaries Reconciliation of Adjusted Operating Ratio to Operating Ratio (Unaudited) (In millions) |
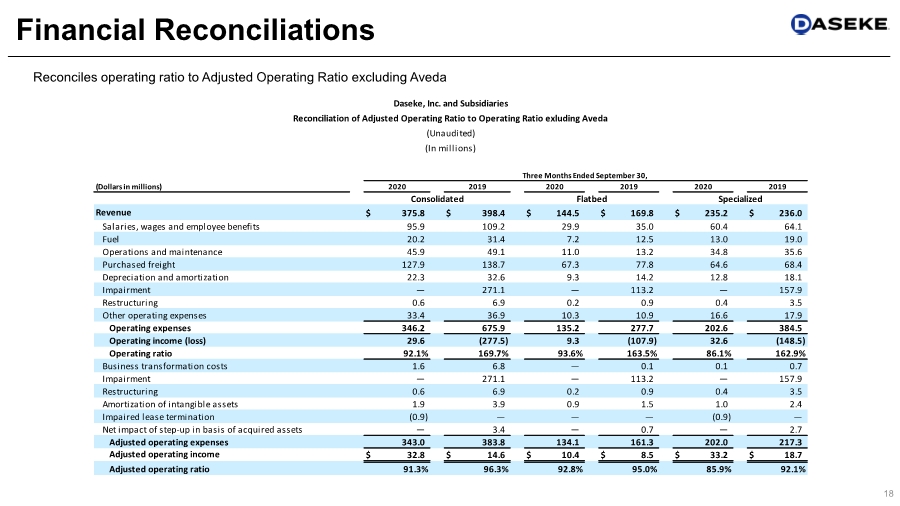
| 18 Financial Reconciliations Reconciles operating ratio to Adjusted Operating Ratio excluding Aveda (Dollars in millions) Revenue $ 375.8 $ 398.4 $ 144.5 $ 169.8 $ 235.2 $ 236.0 Salaries, wages and employee benefits 95.9 109.2 29.9 35.0 60.4 64.1 Fuel 20.2 31.4 7.2 12.5 13.0 19.0 Operations and maintenance 45.9 49.1 11.0 13.2 34.8 35.6 Purchased freight 127.9 138.7 67.3 77.8 64.6 68.4 Depreciation and amortization 22.3 32.6 9.3 14.2 12.8 18.1 Impairment — 271.1 — 113.2 — 157.9 Restructuring 0.6 6.9 0.2 0.9 0.4 3.5 Other operating expenses 33.4 36.9 10.3 10.9 16.6 17.9 Operating expenses 346.2 675.9 135.2 277.7 202.6 384.5 Operating income (loss) 29.6 (277.5) 9.3 (107.9) 32.6 (148.5) Operating ratio 92.1% 169.7% 93.6% 163.5% 86.1% 162.9% Business transformation costs 1.6 6.8 — 0.1 0.1 0.7 Impairment — 271.1 — 113.2 — 157.9 Restructuring 0.6 6.9 0.2 0.9 0.4 3.5 Amortization of intangible assets 1.9 3.9 0.9 1.5 1.0 2.4 Impaired lease termination (0.9) — — — (0.9) — Net impact of step-up in basis of acquired assets — 3.4 — 0.7 — 2.7 Adjusted operating expenses 343.0 383.8 134.1 161.3 202.0 217.3 Adjusted operating income $ 32.8 $ 14.6 $ 10.4 $ 8.5 $ 33.2 $ 18.7 Adjusted operating ratio 91.3% 96.3% 92.8% 95.0% 85.9% 92.1% Daseke, Inc. and Subsidiaries Reconciliation of Adjusted Operating Ratio to Operating Ratio exluding Aveda (Unaudited) (In millions) Three Months Ended September 30, 2020 2019 2020 2019 2020 2019 Consolidated Flatbed Specialized |
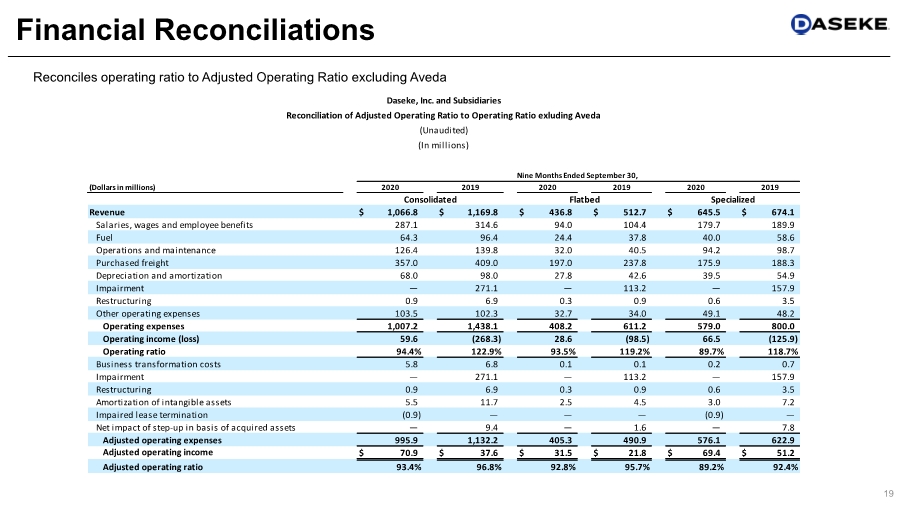
| 19 Financial Reconciliations Reconciles operating ratio to Adjusted Operating Ratio excluding Aveda (Dollars in millions) Revenue $ 1,066.8 $ 1,169.8 $ 436.8 $ 512.7 $ 645.5 $ 674.1 Salaries, wages and employee benefits 287.1 314.6 94.0 104.4 179.7 189.9 Fuel 64.3 96.4 24.4 37.8 40.0 58.6 Operations and maintenance 126.4 139.8 32.0 40.5 94.2 98.7 Purchased freight 357.0 409.0 197.0 237.8 175.9 188.3 Depreciation and amortization 68.0 98.0 27.8 42.6 39.5 54.9 Impairment — 271.1 — 113.2 — 157.9 Restructuring 0.9 6.9 0.3 0.9 0.6 3.5 Other operating expenses 103.5 102.3 32.7 34.0 49.1 48.2 Operating expenses 1,007.2 1,438.1 408.2 611.2 579.0 800.0 Operating income (loss) 59.6 (268.3) 28.6 (98.5) 66.5 (125.9) Operating ratio 94.4% 122.9% 93.5% 119.2% 89.7% 118.7% Business transformation costs 5.8 6.8 0.1 0.1 0.2 0.7 Impairment — 271.1 — 113.2 — 157.9 Restructuring 0.9 6.9 0.3 0.9 0.6 3.5 Amortization of intangible assets 5.5 11.7 2.5 4.5 3.0 7.2 Impaired lease termination (0.9) — — — (0.9) — Net impact of step-up in basis of acquired assets — 9.4 — 1.6 — 7.8 Adjusted operating expenses 995.9 1,132.2 405.3 490.9 576.1 622.9 Adjusted operating income $ 70.9 $ 37.6 $ 31.5 $ 21.8 $ 69.4 $ 51.2 Adjusted operating ratio 93.4% 96.8% 92.8% 95.7% 89.2% 92.4% Reconciliation of Adjusted Operating Ratio to Operating Ratio exluding Aveda Daseke, Inc. and Subsidiaries Consolidated Flatbed Specialized (Unaudited) (In millions) Nine Months Ended September 30, 2020 2019 2020 2019 2020 2019 |
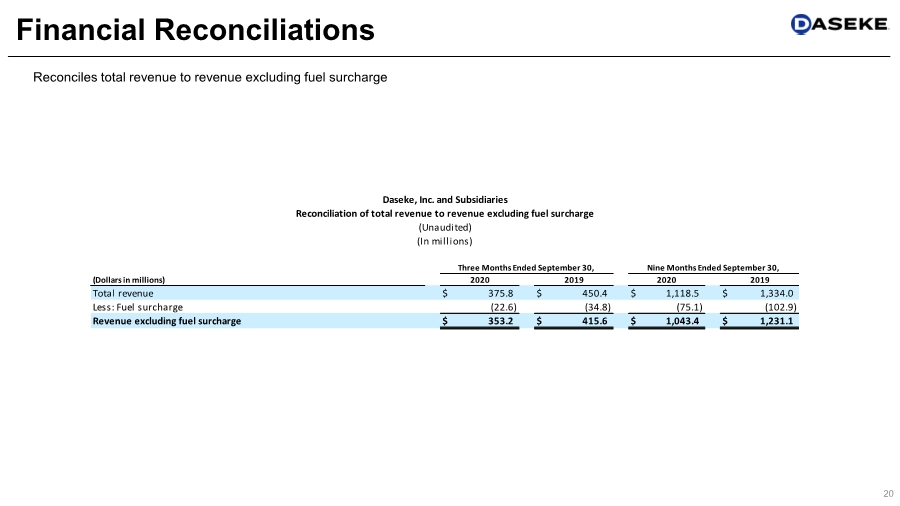
| 20 Financial Reconciliations Reconciles total revenue to revenue excluding fuel surcharge (Dollars in millions) Total revenue $ 375.8 $ 450.4 $ 1,118.5 $ 1,334.0 Less: Fuel surcharge (22.6) (34.8) (75.1) (102.9) Revenue excluding fuel surcharge $ 353.2 $ 415.6 $ 1,043.4 $ 1,231.1 2020 2019 2020 2019 Daseke, Inc. and Subsidiaries Reconciliation of total revenue to revenue excluding fuel surcharge (Unaudited) (In millions) Three Months Ended September 30, Nine Months Ended September 30, |
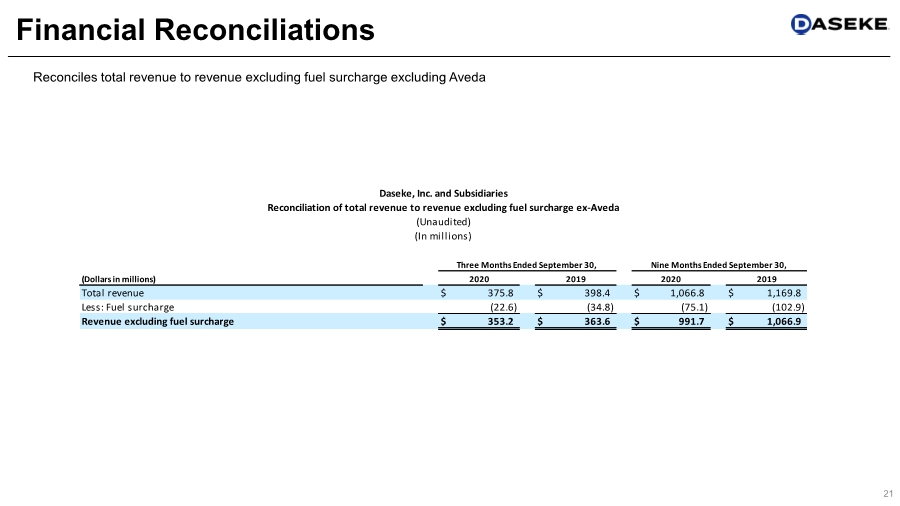
| 21 Financial Reconciliations Reconciles total revenue to revenue excluding fuel surcharge excluding Aveda (Dollars in millions) Total revenue $ 375.8 $ 398.4 $ 1,066.8 $ 1,169.8 Less: Fuel surcharge (22.6) (34.8) (75.1) (102.9) Revenue excluding fuel surcharge $ 353.2 $ 363.6 $ 991.7 $ 1,066.9 2020 2019 2020 2019 Daseke, Inc. and Subsidiaries Reconciliation of total revenue to revenue excluding fuel surcharge ex-Aveda (Unaudited) (In millions) Three Months Ended September 30, Nine Months Ended September 30, |
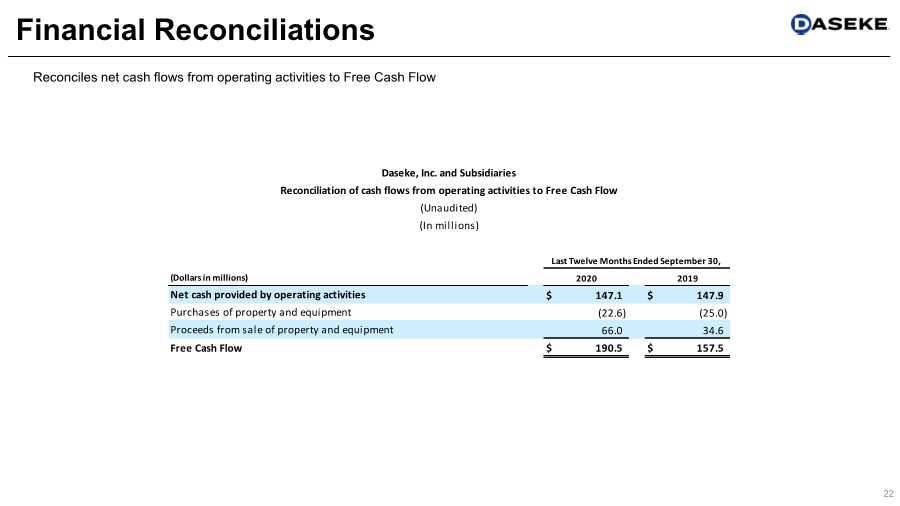
| 22 Financial Reconciliations Reconciles net cash flows from operating activities to Free Cash Flow (Dollars in millions) Net cash provided by operating activities $ 147.1 $ 147.9 Purchases of property and equipment (22.6) (25.0) Proceeds from sale of property and equipment 66.0 34.6 Free Cash Flow $ 190.5 $ 157.5 2020 2019 Daseke, Inc. and Subsidiaries Reconciliation of cash flows from operating activities to Free Cash Flow (Unaudited) (In millions) Last Twelve Months Ended September 30, |
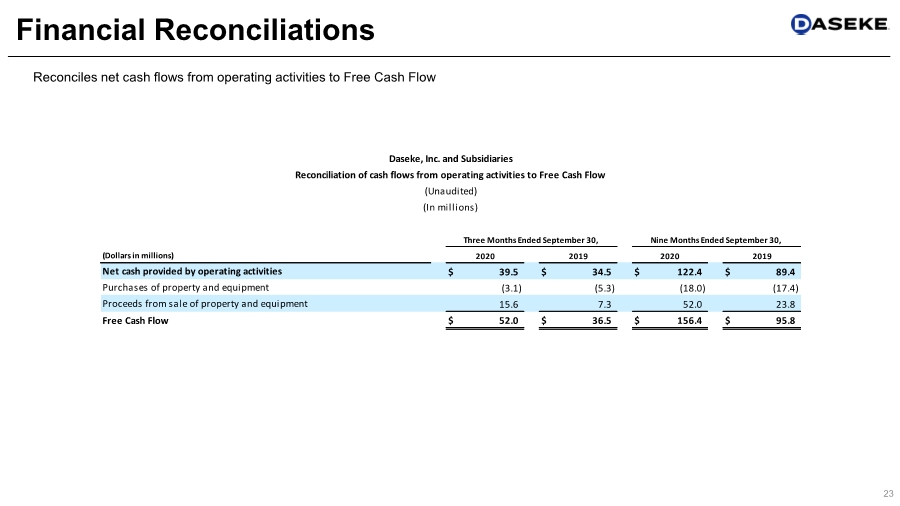
| 23 Financial Reconciliations Reconciles net cash flows from operating activities to Free Cash Flow (Dollars in millions) Net cash provided by operating activities $ 39.5 $ 34.5 $ 122.4 $ 89.4 Purchases of property and equipment (3.1) (5.3) (18.0) (17.4) Proceeds from sale of property and equipment 15.6 7.3 52.0 23.8 Free Cash Flow $ 52.0 $ 36.5 $ 156.4 $ 95.8 2020 2019 2020 2019 Daseke, Inc. and Subsidiaries Reconciliation of cash flows from operating activities to Free Cash Flow (Unaudited) (In millions) Three Months Ended September 30, Nine Months Ended September 30, |
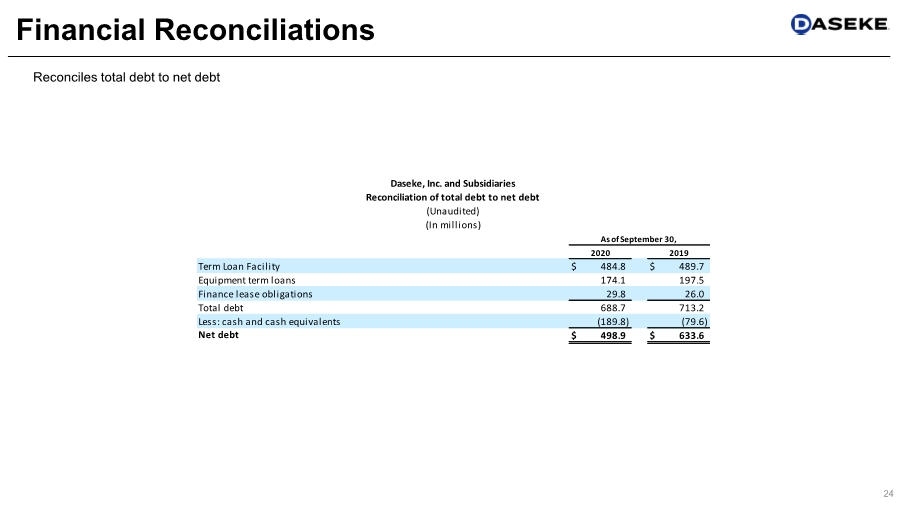
| 24 Financial Reconciliations Reconciles total debt to net debt Term Loan Facility $ 484.8 $ 489.7 Equipment term loans 174.1 197.5 Finance lease obligations 29.8 26.0 Total debt 688.7 713.2 Less: cash and cash equivalents (189.8) (79.6) Net debt $ 498.9 $ 633.6 2020 2019 Daseke, Inc. and Subsidiaries Reconciliation of total debt to net debt (Unaudited) (In millions) As of September 30, |
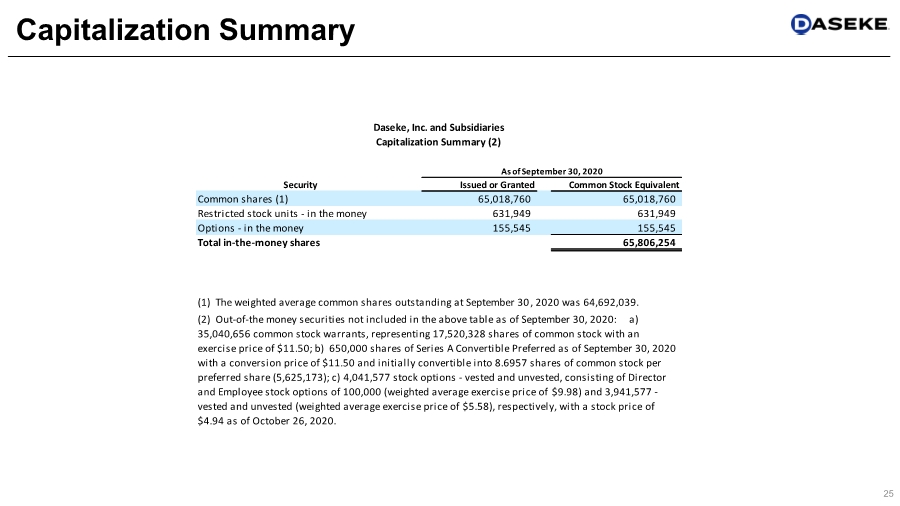
| 25 Capitalization Summary Security Issued or Granted Common Stock Equivalent Common shares (1) 65,018,760 65,018,760 Restricted stock units - in the money 631,949 631,949 Options - in the money 155,545 155,545 Total in-the-money shares 65,806,254 (1) The weighted average common shares outstanding at September 30, 2020 was 64,692,039. (2) Out-of-the money securities not included in the above table as of September 30, 2020: a) 35,040,656 common stock warrants, representing 17,520,328 shares of common stock with an exercise price of $11.50; b) 650,000 shares of Series A Convertible Preferred as of September 30, 2020 with a conversion price of $11.50 and initially convertible into 8.6957 shares of common stock per preferred share (5,625,173); c) 4,041,577 stock options - vested and unvested, consisting of Director and Employee stock options of 100,000 (weighted average exercise price of $9.98) and 3,941,577 - vested and unvested (weighted average exercise price of $5.58), respectively, with a stock price of $4.94 as of October 26, 2020. Capitalization Summary (2) Daseke, Inc. and Subsidiaries As of September 30, 2020 |
| Daseke, Inc. 15455 Dallas Parkway, Ste 550 Addison, TX 75001 www.Daseke.com Investor Relations Joe Caminiti or Chris Hodges, Alpha IR 312-445-2870 [email protected] 26 Contact Information |

Serious News for Serious Traders! Try StreetInsider.com Premium Free!
You May Also Be Interested In
- Amerant Reports First Quarter 2024 Results
- Tiger Aesthetics Medical, LLC Acquires Assets of Sientra, Inc.
- Pivotree to Release First Quarter 2024 Financial Results
Create E-mail Alert Related Categories
SEC FilingsSign up for StreetInsider Free!
Receive full access to all new and archived articles, unlimited portfolio tracking, e-mail alerts, custom newswires and RSS feeds - and more!
