

Form 424B3 New Frontier Health Corp
 Tweet
Tweet Share
Share| Filed pursuant to rule 424(b)(3) | |
| Registration No. 333-236079 |
Prospectus Supplement No. 2
(to Prospectus dated April 8, 2020)
NEW FRONTIER HEALTH CORPORATION
Primary Offering of
26,875,000 Ordinary Shares
Secondary Offering of
127,341,048 Ordinary Shares
12,500,000 Warrants
This Prospectus Supplement No. 2 supplements our Prospectus dated April 8, 2020 (the “Prospectus”) that forms a part of our Registration Statement on Form F-1 (File No. 333-236079). This Prospectus Supplement No. 2 is being filed to update and supplement certain information contained in the Prospectus with the information contained in our Current Report on Form 6-K, filed with the U.S. Securities and Exchange Commission on August 27, 2020 (the “Current Report”). Accordingly, we have attached the Current Report to this Prospectus Supplement.
This Prospectus Supplement No. 2 should be read in conjunction with the Prospectus, which is required to be delivered with this Prospectus Supplement. If there is any inconsistency between the information in the Prospectus and this Prospectus Supplement, you should rely on the information in this Prospectus Supplement.
These securities involve a high degree of risk. You should carefully consider the risks identified under the caption “Risk Factors” beginning on Page 12 of the Prospectus and under similar headings in any amendments or supplements to the Prospectus.
Neither the Securities and Exchange Commission nor any state securities commission has approved or disapproved of any of these securities or passed upon the adequacy or accuracy of the Prospectus or this Prospectus Supplement. Any representation to the contrary is a criminal offense.
The date of this Prospectus Supplement is August 27, 2020.
FORM 6-K
SECURITIES AND EXCHANGE COMMISSION
Washington, D.C. 20549
Report of Foreign Private Issuer
Pursuant to Rule 13a-16 or 15d-16 of
the Securities Exchange Act of 1934
For the month of August, 2020
Commission File Number: 001-38562
NEW FRONTIER
HEALTH CORPORATION
(Translation of Registrant’s Name into English)
10 Jiuxianqiao Road,
Hengtong Business Park
B7 Building, 1/F
Chaoyang District, 100015
Beijing, China
(Address of principal executive office)
Indicate by check mark whether the registrant
files or will file
annual reports under cover of Form 20-F or Form 40-F:
Form 20-F x Form 40-F ¨
Indicate by check mark if the registrant
is submitting the Form 6-K
in paper as permitted by Regulation S-T Rule 101(b)(1):
Yes ¨ No x
Indicate by check mark if the registrant
is submitting the Form 6-K
in paper as permitted by Regulation S-T Rule 101(b)(7):
Yes ¨ No x
INFORMATION CONTAINED IN THIS FORM 6-K REPORT
Attached as Exhibits 99.1 and 99.2 hereto are the earnings release issued by New Frontier Health Corporation (the “Company”) announcing its financial results for the second quarter ended June 30, 2020 and associated investor presentation, respectively.
Exhibits 99.1 and 99.2 to this Report on Form 6-K shall not be deemed “filed” for purposes of Section 18 of the Securities Exchange Act of 1934, as amended, (the “Exchange Act”) or otherwise subject to the liabilities of that section, nor shall they be deemed incorporated by reference in any filing under the Securities Act of 1933, as amended, or the Exchange Act.
EXHIBIT INDEX
| Exhibit | Description of Exhibit |
| 99.1 | Earnings Release. |
| 99.2 | Investor Presentation. |
SIGNATURES
Pursuant to the requirements of the Securities Exchange Act of 1934, as amended, the registrant has duly caused this report to be signed on its behalf by the undersigned, thereunto duly authorized.
| New Frontier Health Corporation | ||
| By: | /s/ Roberta Lipson | |
| Name: Roberta Lipson | ||
| Title: Chief Executive Officer | ||
Date: August 27, 2020
Exhibit 99.1
New Frontier Health Corporation Announces Second Quarter 2020 Financial Results
BEIJING, China, August 27, 2020 /Business Wire/ -- New Frontier Health Corporation (“NFH” or the “Company”) (NYSE: NFH), operator of the premium healthcare services provider United Family Healthcare (“UFH"), today announced its unaudited financial results for the second quarter ended June 30, 2020.
Financial and Operating Highlights1
All comparisons made on both a year-over-year (“yoy”) and quarter-on-quarter (“qoq”) basis. 2
Second Quarter 2020 Highlights:
| · | Revenue decreased by 12.6% yoy to RMB548.9 million from RMB628.1 million and increased by 27.4% from the prior quarter, as revenue continued to recover since the initial outbreak of the COVID-19 pandemic in February. |
| · | Adjusted EBITDA (before IFRS 16 adoption)3 reverted to a profit of RMB54.0 million in the second quarter of 2020 compared to a loss of RMB(67.7) million in the prior quarter, representing a slight increase from RMB52.8 million in the prior year period. The change was primarily due to a recovery of revenue and implementation of cost controls. |
| · | Net loss decreased to RMB79.3 million in second quarter of 2020 from RMB 168.6 million in the prior quarter, representing a slight increase from RMB75.2 million in the prior year period, resulting mainly from revenue decline, increased finance costs, and increased depreciation expenses (inclusion of the full the depreciation expenses of the newly expanded PXU facility in the second quarter of 2020). |
| · | Tier 1 Operating Assets: revenue decreased by 19.8% yoy to RMB382.3 million from RMB476.5 million and increased by 26.6% qoq. Adjusted EBITDA (before IFRS 16 adoption) decreased by 27.4% yoy to RMB98.6 million from RMB135.8 million and increased by 331.0% qoq. The yoy declines in revenue and adjusted EBITDA were primarily due to a decline in patient volume as a result of the COVID-19 pandemic and the impact from the second wave of the outbreak in Beijing in June 2020. However, the strong revenue recovery from Q1 2020 was due to strong revenue recovery in Beijing and Shanghai prior to the second wave outbreak, easing of travel restrictions within China, and increased demand for non-emergency medical services. |
| Tier 2 Operating and Other Assets: revenue decreased by 6.6% yoy to RMB77.6 million from RMB83.0 million, and Adjusted EBITDA (before IFRS 16 adoption) increased to RMB3.6 million from RMB(3.5) million, primarily due to a recovery of revenue and implementation of cost controls. |
| · | Expansion Assets: revenue increased by 30.0% yoy to RMB89.1 million from RMB68.5 million due to the continued ramp-up of the new hospitals in Guangzhou and Pudong, Shanghai, despite the impact from the COVID-19 pandemic, and Adjusted EBITDA (before IFRS 16 adoption) increased by 52.3% yoy to RMB(19.5) million from RMB(40.8) million. |
| · | Outpatient visits decreased by 23.3% yoy to 125,723 from 164,010 and increased by 40.5% qoq. |
| · | Inpatient admissions decreased by 23.6% yoy to 2,059 from 2,695 and increased by 0.1% qoq. |
| · | Bed utilization rate* decreased to 32.1% yoy from 37.5%. |
| · | ASP: outpatient ASP increased by 10.8% yoy and inpatient ASP increased by 16.1% yoy due to an increase in the number of higher acuity services provided at the Company’s facilities. |
* Bed utilization is calculated based on the weighted average maximum bed capacity for the period.
_________________________
1 As a result of the adoption of International Financial Reporting Standard 16 (“IFRS 16”), effective January 1, 2019, related lease expenses have been reflected in depreciation and amortization expenses and finance costs. Segment revenue and Adjusted EBITDA (before IFRS 16 adoption) are presented for the purposes of comparison with prior years. The financial statements have been translated into United States dollars for convenience purposes at a rate of RMB7.0651 to US$1.00, the exchange rate on June 30, 2020, set forth in the H.10 statistical release of the Federal Reserve Board.
2 The Company acquired UFH in a business combination that closed on December 18, 2019. The financial results for the quarter ended June 30, 2019 presented herein are those of the Company’s wholly owned subsidiary, Healthy Harmony Holdings, L.P. (the “Predecessor”), while the financial results for the quarter ended June 30, 2020, presented herein are those of the combined Company (the “Successor”).
3 Adjusted EBITDA (before IFRS 16 adoption) is a non-IFRS performance measure. See “Non-IFRS Financial Measures” for a reconciliation of Adjusted EBITDA to its most comparable financial measure calculated in accordance with IFRS.
New Additions to Executive Management Team
The Board of Directors (the “Board”) of the Company appointed Mr. Carl Wu, a current member of the Board and Chairman of the Executive Committee of NFH, as President of NFH and appointed David Zeng, another current member of the Board, as Chief Operations Officer (“COO”) of NFH, effective August 1, 2020. Mr. Wu and Mr. Zeng together will form a new President and COO Office within NFH, which will replace the COO Office led by Jeffrey Staples, who has resigned from the Company for personal reasons. Mr. Wu will maintain his responsibility as Chairman of the Executive Committee. The President and COO Office will retain the same reporting lines as the previous COO Office.
Mr. Antony Leung, Chairman of NFH, commented, “Similar to many others in the industry, our business continued to be negatively affected by the COVID-19 pandemic during the quarter. However, the COVD-19 situation in China now seems to be under control. Although there is no assurance of the future path of the disease, we expect that any future outbreaks can be more easily controlled by effective public health measures. In the second quarter, we were glad to see a revenue recovery and operational ramp-up trend that led to quarter-over-quarter growth as well as improved profitability on the back of our previously announced efficiency initiatives. Our outpatient visits increased quarter-over-quarter, driving similar, sequential growth in revenues across all asset categories. We remain confident in our company and expect to continue to execute our operational and strategic plans.”
“We are also excited that Carl and David have formally joined the leadership team,” Mr. Leung continued. “They have been working closely with the executive team over the last several months and have been making significant progress in a number of strategic areas while improving the performance of the Company. I look forward to working closely with Roberta, Carl and David, and the management and medical teams to continue delivering world class healthcare to patients in China.”
Ms. Roberta Lipson, Chief Executive Officer of NFH and founder of UFH, added, “We are happy to see signs of recovery this quarter. Both outpatient visits and inpatient admissions across our network rebounded steadily in April and May, with an acceleration toward the end of May as the government eased COVID-19 related restrictions. Despite the second outbreak in Beijing in June, which was quickly contained, our outpatient volume achieved a 41% increase from the previous quarter. Meanwhile, we made progress on our strategic growth initiatives. For example, our hospital in Guangzhou, which first opened its doors in the fourth quarter of 2018, started to achieve monthly EBITDA breakeven in May 2020. Our Shanghai United Family Hospital launched its Center for Healthy Aging this quarter, providing health management services to patients aged 60 and older, reflecting the needs of Shanghai’s shifting demographic. In Beijing, both our Beijing United Family Hospital and our New Hope Oncology Center expanded their capabilities with investments in equipment upgrades. We also opened our Beijing United Family Tianchen Clinic in partnership with the Asia Infrastructure Investment Bank.”
“In addition to making progress in pursuit of our strategic growth, we are proud of our contributions to society’s needs during the outbreak. Many of our facilities have been approved to provide COVID-19 polymerase chain reaction (PCR) tests and antibody tests to patients on-site. In addition, our Beijing United Family Hospital was one of a select few private hospitals approved to carry out the supporting lab work, and we believe that both of these efforts will translate into business growth, as this testing brings more people through our doors to experience UFH’s environment and service for the first time. As our business continues its expected return to normal growth, we remain focused on network efficiency, expansion asset ramp-up, core market facilities, and service line development. Finally, I want to thank our team, which has made a significant effort to protect each other, our patients, and their families during this difficult time,” concluded Ms. Lipson.
Second Quarter 2020 Results
For management purposes, the Company is organized into business units based on the category and stage of development of the Company’s healthcare facilities and geographic locations. There are three reportable operating segments, as follows:
(a) Tier 1 Operating Assets: the existing general healthcare facilities located in tier 1 cities in China, such as Beijing United Family Hospital (“BJU”), Shanghai United Family Hospital (“PXU”), and their associated clinics.
(b) Tier 2 Operating and Other Assets: the existing general healthcare facilities located in tier 2 cities in China, such as Tianjin United Family Hospital (“TJU”), Qingdao United Family Hospital (“QDU”), and other assets, such as a Beijing United Family Rehabilitation Hospital (“Rehab”) and other clinic assets.
(c) Expansion Assets: the facilities recently opened or about to open including Shanghai Xincheng United Family Hospital (“PDU”), Guangzhou United Family Hospital (“GZU”), and Beijing Jingbei Women and Children’s United Family Hospital (“DTU”).
| Revenue (RMB mm) | 2 Q19 | 2 Q19 | Y-o-y Change % | Q-o-q Change % | ||||||||||||
| Tier 1 Operating Assets (1) | 476.5 | 382.3 | -19.8 | % | 26.6 | % | ||||||||||
| Tier 2 Operating and Other Assets (3) | 83.0 | 77.6 | -6.6 | % | 22.0 | % | ||||||||||
| Operating Assets(4) | 559.5 | 459.8 | -17.8 | % | 25.8 | % | ||||||||||
| Expansion Assets(5) | 68.5 | 89.1 | 30.0 | % | 36.2 | % | ||||||||||
| Total | 628.1 | 548.9 | -12.6 | % | 27.4 | % | ||||||||||
| (1) | Tier 1 Operating Assets: revenue from UFH’s tier 1 facilities and their associated clinics decreased by 19.8% yoy due to a decline in patient volume as a result of the impact from the second wave of COVID-19 in Beijing in June 2020. However, revenue increased by 26.6% from the prior quarter due to strong revenue recovery in Beijing prior to the second wave outbreak, easing of travel restrictions within China, and increased demand for non-emergency medical services. |
| (2) | Tier 2 Operating and Other Assets: revenue from UFH’s tier 2 facilities and other assets, as a group, decreased by 6.6% yoy due to a decline in patient volume as a result of COVID-19. However, revenue increased by 22.0% qoq due to the easing of travel restrictions within China and increased demand for non-emergency medical services. |
| (3) | Total Operating Assets as a group decreased by 17.8% yoy and increased by 25.8% qoq due to patient volume recovery, easing of travel restrictions within China, and increased demand for non-emergency medical services. However, our facilities in Beijing were still affected by the second wave of COVID-19 in Beijing in June 2020. |
| (4) | Expansion Assets: UFH’s GZU and PDU facilities were formally launched with complete practice licenses4 in the fourth quarter of 2018. As a result of a strong ramp-up, driven by increased brand recognition and new patient uptick at GZU and PDU, revenue for UFH’s expansion assets, as a group, increased to RMB89.1 million in the second quarter of 2020 from RMB68.5 million in the second quarter of 2019. GZU recorded revenue growth of 17.3% yoy and PDU 26.2% yoy. |
Adjusted EBITDA (before IFRS 16 adoption) (RMB mm)
| Revenue (RMB mm) | 2 Q19 | 2 Q19 | Y-o-y Change % | Q-o-q Change % | ||||||||||||
| Adjusted EBITDA (before IFRS 16 adoption) | ||||||||||||||||
| Tier 1 Operating Assets(1) | 135.8 | 98.6 | -27.4 | % | 331.0 | % | ||||||||||
| Tier 2 Operating and Other Assets(2) | -3.5 | 3.6 | 201.4 | % | 130.9 | % | ||||||||||
| Operating Assets(3) | 132.3 | 102.2 | -22.8 | % | 800.7 | % | ||||||||||
| Expansion Assets(4) | -40.8 | -19.5 | 52.3 | % | 54.4 | % | ||||||||||
| Unallocated Cost(5) | -38.7 | -28.7 | 25.8 | % | 21.0 | % | ||||||||||
| Total Adjusted EBITDA (before IFRS 16 adoption)(6) | 52.8 | 54.0 | 2.3 | % | 179.8 | % | ||||||||||
| (1) | Tier 1 Operating Assets: due to a decline in revenue as a result of COVID-19, BJU, PXU, and their associated clinics achieved Adjusted EBITDA (before IFRS 16 adoption) of RMB98.6 million in the second quarter of 2020, a decrease of 27.4% yoy. Adjusted EBITDA increased by 331.0% qoq due to strong revenue recovery and implementation of cost control measures. |
| (2) | Tier 2 Operating and Other Assets: TJU, Rehab, and QDU achieved Adjusted EBITDA (before IFRS 16 adoption) of RMB3.6 million in the second quarter of 2020 compared to RMB(3.5) million in the second quarter of 2019, primarily due to implementation of cost control measures. |
| (3) | Total Operating Assets: UFH’s operating assets, as a group, achieved Adjusted EBITDA (before IFRS 16 adoption) decrease of 22.8% yoy to RMB102.2 million in the second quarter of 2020, an increase of 800.7% qoq, primarily due to strong revenue recovery and implementation of cost control measures. |
| (4) | Expansion Assets: expansion assets, as a group, experienced an increase in total Adjusted EBITDA (before IFRS 16 adoption) to RMB(19.5) million in the second quarter of 2020, an improvement from RMB(40.8) million in the second quarter of 2019, due to both strong revenue ramp-up and cost control measures. Adjusted EBITDA (before IFRS 16 adoption) for GZU reached breakeven in May. |
| (5) | Unallocated Cost: Headquarter expenses decreased by 25.8% due to cost control measures implemented during the quarter. During this process, corporate headquarters reduced its administrative headcount by approximately 21.5%, or approximately 38 positions in total, through position elimination and attrition. In addition to headcount reductions, members of the Company’s senior management team took voluntary pay reductions ranging from 20% to more than 30% for the remainder of 2020. Further, SG&A expenses for corporate headquarters decreased by 33.9% yoy for 2020 as a result of headquarters cost reviews and reduced travel, communication, and other expenses. |
| (6) | Total Adjusted EBITDA (before IFRS 16 adoption) for the second quarter of 2020 was RMB54.0 million compared to RMB52.8 million in the prior year period, primarily due to the recovery of revenue, strong ramp-up of expansion assets, and cost control measures adopted in the second quarter. |
__________________________
4 Complete practicing licenses means after receiving the formal approval of practicing license for medical institutions and obstetrics operating license
Key Operating Metrics
| 2Q2019 | 2Q2020 | Y-o-Y Change % | Q-o-q Change % | |||||||||||||||||||||||||||||
| Outpatient Volume | Inpatient Admission | Outpatient Volume | Inpatient Admission | Outpatient Volume | Inpatient Admission | Outpatient Volume | Inpatient Admission | |||||||||||||||||||||||||
| Tier 1 Operating Assets | 123,801 | 1,789 | 89,415 | 1,204 | -27.8 | % | -32.7 | % | 40.4 | % | -3.2 | % | ||||||||||||||||||||
| Tier 2 Operating and Other Assets | 21,552 | 528 | 18,438 | 450 | -14.4 | % | -14.8 | % | 46.8 | % | -0.2 | % | ||||||||||||||||||||
| Operating Assets(1) | 145,353 | 2,317 | 107,853 | 1,654 | -25.8 | % | -28.6 | % | 41.4 | % | -2.4 | % | ||||||||||||||||||||
| Expansion Assets(2) | 18,657 | 378 | 17,870 | 405 | -4.2 | % | 7.1 | % | 35.3 | % | 12.2 | % | ||||||||||||||||||||
| Total UFH | 164,010 | 2,695 | 125,723 | 2,059 | -23.3 | % | -23.6 | % | 40.5 | % | 0.1 | % | ||||||||||||||||||||
| (1) | Operating Assets (Tier 1 and Tier 2): the yoy decline of both inpatient and outpatient volume was primarily due to the COVID-19 pandemic, as patients postponed or cancelled non-emergency medical services. In addition, the Chinese government implemented various preventive measures during the pandemic that affected the Company’s hospital and clinic operations. Such measures included: 1) the temporary closing of non-emergency departments, including dentistry and dermatology; 2) the temporary suspension of vaccine services; 3) daily limitations on volume for certain specialties to maintain social distancing practices; and 4) the closing of certain outpatient clinics in February. Inpatient volume was also affected as the Company was encouraged to delay non-emergency and elective procedures. With the easing of government policy as COVID-19 numbers decreased across China, most outpatient volumes began to recover gradually in May and June, although recovery in Beijing hospitals and clinics were further affected as Beijing experienced a second wave surge in cases in June 2020. The qoq decline in inpatient admission was due to lower admissions in the pediatrics department throughout UFH facilities, as schools stayed closed and enhanced personal hygiene and protective measures for school children were implemented. However, the Company experienced strong growth in other departments including internal medicine, surgery, orthopedics, which recorded over 32.4% qoq growth in terms of inpatient admissions in Q2 2020. |
| (2) | Expansion Assets: PDU and GZU saw continued ramp ups in inpatient volume, driven by OBGYN, postpartum care, internal medicine, orthopedics, surgeries, and other services. Outpatient volume declined yoy due to the COVID-19 pandemic outbreak in Guangzhou in April; however, there were strong recovery trends during the quarter as various restrictive measures were relaxed. Outpatient volume for PDU achieved 21.3% yoy growth during the period and GZU started to see an increase in outpatient volume yoy in June. |
FINANCIAL RESULTS
Unaudited Second Quarter 2020 Results
Revenue was RMB548.9 million ($77.7 million) in the second quarter, representing a decrease of 12.6% yoy from RMB628.1 million in the second quarter of 2019. The decrease primarily resulted from a decline in patient volume as patients postponed or cancelled non-emergency medical services due to the impact of COVID-19. However, revenue increased by 27.4% from the prior quarter due to strong recovery in patient volume and demand for premium healthcare service.
| · | Tier 1 Operating Assets: revenue decreased by 19.8% yoy to RMB382.3 million from RMB476.5 million and increased by 26.6% qoq. The decline in revenue and adjusted EBITDA was primarily due to a decline in patient volume as a result of the COVID-19 pandemic and the impact from the second wave outbreak in Beijing in June 2020. |
| Tier 2 Operating and Other Assets: revenue decreased by 6.6% yoy to RMB77.6 million from RMB83.0 million, and Adjusted EBITDA (before IFRS 16 adoption) increased to RMB3.6 million from RMB(3.5) million, primarily due to a recovery of revenue and implementation of cost controls. |
| · | Expansion Assets: revenue increased by 30.0% yoy to RMB89.1 million from RMB68.5 million due to the continued ramp-up of the new hospitals in Guangzhou and Pudong, Shanghai, despite the impact from the COVID-19 pandemic. Adjusted EBITDA (before IFRS 16 adoption) increased by 52.3% yoy to RMB(19.5) million from RMB(40.8) million. |
Operating expenses were RMB565.1 million ($80.0 million) in the second quarter, representing a decrease of 10.8% yoy from RMB633.7 million and a slight increase of 1.1% qoq.
| · | Salaries, wages and benefits expenses decreased by 20.0% yoy to RMB289.0 million from RMB361.3 million and decreased by 5.0% qoq, primarily due to the implementation of cost-saving initiatives, which included a 38 headcount reduction and voluntary pay reductions at headquarters, utilization of employee leave and limiting new hires, and reductions in contributions to social insurance and benefits expenses as a result of government policies during the pandemic. The Company incurred a severance cost of RMB11 million in the second quarter due to headcount reduction. |
| · | Supplies and purchased medical services expenses increased by 2.8% yoy to RMB103.4 million from RMB100.7 million and 37.0% qoq, mainly due to the enhancement of vaccination and postpartum services to drive recovery of patient volumes in the second quarter. |
| · | Depreciation and amortization expenses increased by 24.6% yoy to RMB106.2 million from RMB85.2 million and decreased by 1.8% qoq. The yoy increase was primarily due to fair value appreciation of plant and equipment, contracts with insurers related to the business combination, and full depreciation of the newly expanded PXU facility. |
| · | Lease and rental expense (benefit) was a benefit of RMB0.8 million in the second quarter, primarily due to a reduction in rental expenses as a result of government policies during the pandemic. |
| · | Bad debt benefit increased by 26.2% yoy to RMB1.8 million from RMB1.4 million compared to a bad debt expense of RMB4.0 million in the prior quarter, primarily due to better collection rates over the past year. |
| · | Other operating expenses decreased by 18.3% yoy to RMB69.1 million from RMB84.5 million, mainly due to cost-saving initiatives and the decrease in transaction costs and fees payable to certain Chinese partners of the Company. Other operating expenses increased by 6.1%, or RMB4.0 million, from the prior quarter, mainly representing an increase in fees payable to certain Chinese partners as a result of increased profitability due to the revenue recovery from the prior quarter. |
As a result of the above, loss from operations in the second quarter of 2020 was RMB16.2 million ($2.3 million) compared to loss from operations of RMB5.6 million ($0.8 million) in the prior year period. Loss before income taxes in the second quarter of 2020 was RMB72.4 million ($10.2 million), compared to loss before income taxes of RMB52.6 million ($7.4 million) in the prior year period. Net loss in the second quarter of 2020 was RMB79.3 million ($11.2 million) compared to net loss of RMB75.2 million ($10.6 million) in the prior year period. The increase in losses yoy mainly resulted from an expanded cost basis, reflecting full operations of the new PXU facility, the revenue decline caused by the pandemic, and increased finance costs due to the Company's Senior Secured Term Loan, and which were partially offset by cost-saving initiatives and cost reductions as a benefit of government policies in response to the COVID-19 pandemic.
As of June 30, 2020, the Company had RMB845.8 million ($119.7 million) in cash and cash equivalents. Cash generated from operating activities for the second quarter were RMB386.6 million ($54.7 million), cash used for investing activities were RMB112.6 million ($15.9 million), and cash used for financing activities were RMB476.8 million ($67.5 million) for repayment of IFC loans and increased interest from Senior Secured Term Loan.
RECONCILIATON OF NON-IFRS FINANCIAL MEASURES
| (RMB mm) | ||||||||
| For the three months ended June 30, | ||||||||
| 2019 | 2020 | |||||||
| Net loss | (75 | ) | (79 | ) | ||||
| Less: Finance income | (1 | ) | (1 | ) | ||||
| Add: Finance costs | 34 | 66 | ||||||
| Add: Foreign exchange loss/(gain) | 14 | - | ||||||
| Less: Gain on disposal of an associate | - | (3 | ) | |||||
| Less: Other income, net | (1 | ) | (6 | ) | ||||
| Add: Income tax expense | 23 | 7 | ||||||
| Operating loss | (6 | ) | (16 | ) | ||||
| Add: Share-based compensation | 19 | 1 | ||||||
| Add: Depreciation and amortization | 85 | 106 | ||||||
| Add: Discontinued monitoring fee payable to Fosun Pharma and TPG | 1 | - | ||||||
| Add: Transaction related costs | 4 | 1 | ||||||
| Add: Severance costs | - | 11 | ||||||
| Adjusted EBITDA | 103 | 103 | ||||||
| Less: Lease expense adjustments as a result of IFRS 16 adoption | (50 | ) | (49 | ) | ||||
| Adjusted EBITDA (before IFRS 16 adoption) | 53 | 54 | ||||||
| For the three months ended June 30, 2020 | ||||||||||||||||
| Operating assets Tier 1 | Operating assets - Tier 2 and other assets | Expansion assets | Total | |||||||||||||
| Segment results | 120 | 8 | - | 128 | ||||||||||||
| Less: Segment lease expense adjustment as a result of adoption of IFRS 16 | (22 | ) | (5 | ) | (19 | ) | (46 | ) | ||||||||
| Add: Severance costs | 1 | 1 | - | 2 | ||||||||||||
| Adjusted EBITDA (before IFRS 16 Adoption) | 99 | 4 | (19 | ) | 84 | |||||||||||
| Add: Unallocated costs – severance related | 9 | |||||||||||||||
| Less: Unallocated costs - others | (39 | ) | ||||||||||||||
| Total Adjusted EBITDA (before IFRS 16 Adoption) | 54 | |||||||||||||||
| Add: Lease expense adjustment as a result of adoption of IFRS 16 | 49 | |||||||||||||||
| Adjusted EBITDA | 103 | |||||||||||||||
| Less: Share-based compensation | (1 | ) | ||||||||||||||
| Less: Depreciation and amortization | (106 | ) | ||||||||||||||
| Less: Transaction related costs | (1 | ) | ||||||||||||||
| Less: Severance costs | (11 | ) | ||||||||||||||
| Operating loss | (16 | ) | ||||||||||||||
| Add: Finance income | 1 | |||||||||||||||
| Less: Finance costs | (66 | ) | ||||||||||||||
| Add: Other income, net | 6 | |||||||||||||||
| Add: Gain on disposal of an associate | 3 | |||||||||||||||
| Less: Income tax expense | (7 | ) | ||||||||||||||
| Net loss | (79 | ) | ||||||||||||||
RECENT DEVELOPMENTS
COVID-19 Recovery Trend & Operational Focus
Recovery prior to second outbreak in Beijing in June
The Company’s outpatient visits and inpatient admissions continued to be lower during the quarter compared to the prior year period. The Company’s facilities have been significantly affected by the government’s COVID-19 related restrictions, including: 1) closing borders to foreigners, which led to fewer expatriate patients in the Company’s facilities; 2) temporary suspension of multi-site practice for physicians; and 3) restrictions on types of services offered at medical facilities. Despite these restrictions, the Company’s facilities saw strong volume recovery month over month as China’s COVID-19 cases generally continued to decrease and restrictive regulations were relaxed or removed completely.
In April, May, and June, the Company saw a steady rebound in both outpatient visits and inpatient admissions across the UFH network. Then, beginning at the end of May when the government lowered its COVID-19 response level and reduced or removed many of the remaining restrictions, volumes rebounded at an even faster rate. This change was primarily driven by demand in family medicine, pediatrics, and emergency care as patients returned to UFH for their regular healthcare needs.
Second outbreak in Beijing in mid-June
On June 11, a new outbreak of COVID-19 cases was identified in Beijing’s FengTai district. In response to the new cases, the Beijing government raised its COVID-19 response level and mandated that many of the prior precautions be re-implemented across Beijing, including restrictions on doctors practicing at multiple sites, stricter protocols for providing care for fever patients, and limitations on the number of non-COVID patients that can be seen each day to maintain social distancing practices. As a result of these measures, the Company’s facilities in Beijing saw an immediate drop in patient volumes. From the start of this second outbreak until the end of June, outpatient visit volumes at BJU and associated clinics fell by approximately 25%, and inpatient admissions fell by approximately 7% from the level seen in the earlier part of June. The Company’s facilities in other cities were not negatively affected by the second outbreak in Beijing and continued to steadily recover during this time. Despite the impact of the June outbreak, group wide revenue in June continued to recover to 97% of prior year revenue. Beijing has since returned to its more open status as the outbreak was quickly contained by mid-July.
Although overall patient volumes for the second quarter were lower than in the same period of 2019, the Company saw a strong rebound compared to the first quarter of 2020. During the second quarter of 2020, outpatient volumes were 40.5% higher than the prior quarter. Every reporting asset category saw an improvement in outpatient volumes on a quarter-over-quarter basis. Outpatient volume growth has been particularly strong in dental, family medicine, pediatrics, and emergency medicine. Inpatient admissions did not increase quarter over quarter, primarily due to 1) second wave of COVID-19 outbreak in Beijing, 2) lower admissions in the pediatrics department, as schools stayed closed and enhanced personal hygiene and protective measures for school children were implemented. However, the Company experienced strong growth in other departments including internal medicine, surgery, orthopedics, which recorded over 20% qoq growth in terms of inpatient admissions in Q2 2020.
Lowered Response Level in Beijing after July 20
With the second outbreak brought under control, the Beijing government lowered its COVID-19 response level from Level 2 back to Level 3 on July 20, 2020. With this change, most of the restrictions were removed or significantly reduced. The Company’s Beijing facilities immediately saw an increase in volumes. Since then, UFH has seen continued growth, with weekly revenue consistently higher than it was during the same period a year ago.
Revenue and Volume Recovery from both Chinese and Expatriate Patients
With the closing of international borders and other travel restrictions within China since the start of the pandemic, the Company has seen a higher volume and revenue contribution from Chinese patients. During the recovery process, there has been strong growth in the Chinese patient population at all UFH facilities. Since the beginning of the second quarter, Chinese patient numbers not only returned to prior levels but also have achieved year-over-year increase, demonstrating the resilience and strong demand for premium private healthcare service from Chinese patients. Despite monthly improvements in foreign patient volumes during the same period, there is still a sizeable gap compared to pre-COVID-19 periods during second quarter. However, during July, the Company has seen the first year-over-year increase in terms of revenue from expatriate patients. With domestic travel restrictions already eased and international borders opening on a controlled basis, the Company expects foreign patient volumes to experience year over year growth in the near future.
Expansion of COVID-19 Testing Capabilities
As one of the most widely recognized premium private healthcare providers in China, many of the Company’s facilities have been approved to provide COVID-19 PCR tests and COVID-19 antibody tests to patients on site and for group testing for corporate and school partners at their work sites or campuses. During the second quarter, BJU was one of only a few private hospitals approved to carry out the supporting laboratory work. This ability to do the work in-house gives BJU the opportunity to provide patients high-quality testing with a higher turnaround time than waiting for over-burdened government and commercial labs to conduct the lab work.
The Company has provided more than 24,000 PCR tests and antibody tests as of the date of this release. The Company has been working with some of China’s top multi-national corporations, state-owned enterprises, schools, and embassies to tailor clinical arrangements to meet their testing needs. Under these arrangements, UFH provides COVID-19 testing to its partners’ employees and, in some cases, to their customers, which could potentially generate additional revenue and attract new patients to the Company’s network.
GZU Positive EBITDA starting in May
After only 21 months of operations, GZU reported positive EBITDA for the first time in May. June and July EBITDA continued to be positive as well. Even during the COVID-19 period, GZU has seen months of continuous strong volume and revenue growth, driven by OBGYN, postpartum care, dermatology, internal medicine, orthopedics, and surgeries, as well as other services.
BJM Opens Clinic in Asia Infrastructure Investment Bank China Headquarters
In April, the Company’s newest clinic, Beijing United Family Tianchen Clinic, opened on the west side of Beijing inside the China headquarters building of the Asia Infrastructure Investment Bank (“AIIB”). This new clinic, operated in partnership with AIIB, provides the bank’s employees with access to quality healthcare. Through the clinic, UFH will provide AIIB employees with basic family medicine services and access to a variety of specialty services at other UFH clinics and hospitals through tele-medicine as well as referrals to other sites for care as needed. Under the partnership agreement with AIIB, UFH will have minimal capital investment requirements and no rental cost while receiving a monthly health management fee from AIIB. This exciting new model is expected to give UFH the ability to directly support its long-term partner’s health needs, and the Company expects to replicate this model with other corporate partners.
NFH Agrees to be the Sole Medical Provider for the Beijing Universal Resort
At the end of June, NFH signed an agreement to be the sole medical provider for employees and guests at the upcoming Universal Beijing Resort. The 4.4 km2 destination park located to the southeast of Beijing is expected to feature a theme park, hotels, and iMax theater complex, as well as extensive dining and shopping attractions. NFH will begin to staff the on-site medical center starting in the fourth quarter of 2020. Under this agreement, the Company will provide frontline medical services, ambulance coordination, and health patrols on the property.
BJM Expands Its Capabilities with Investment in Equipment Upgrades
During the quarter, both Beijing United Family Hospital and New Hope Oncology Center invested in upgrading their technical capabilities. Of note, the New Hope Oncology Center in Beijing upgraded its Varian Linear Accelerator to include the latest Varian Eclipse Treatment Planning software, bringing the latest developments in radiation therapy to the center. This upgrade is expected to provide several key benefits, including: (i) the ability to create better clinical treatment plans for patients and move more quickly from assessment and diagnosis to starting treatment; (ii) a reduction in patients’ treatment time and the potential to produce better clinical outcomes; and (iii) the ability to connect with other specialty centers to collaborate more efficiently.
Related Party Transactions
On April 1, 2020, one affiliate of the Company entered into a definitive agreement for the sale of 80% equity interest in Beijing Youhujia Healthcare Management Co. Ltd. (“YHJ”) to one affiliate of New Frontier Group. This disposition was completed on April 28, 2020. YHJ will continue to support UFH’s postpartum rehabilitation business in the provision of postpartum nursing services while UFH will continue to provide YHJ with nursing training to help enhance service quality. YHJ was not profitable in either fiscal year 2019 or the first quarter of 2020.
BUSINESS OUTLOOK
Despite the challenges brought on by COVID-19, the Company expects to record 2-5% revenue growth in the third quarter of 2020 as compared to the third quarter of 2019, as patient volumes are expected to steadily recover.
Annual Report on Form 20-F
The Company’s Annual Report for the year ended December 31, 2019 (the “Annual Report”) was filed with the U.S> Securities and Exchange Commission (the “SEC”) on March 31, 2020. A copy of the report can be found under the Financials section of the Company’s investor relations website at www.nfh.com.cn or on the SEC’s website at www.sec.gov. Shareholders may request a hard copy of the Company’s audited financial statements for the year ended December 31, 2019, which were included in the Annual Report, free of charge by filling out the "Information Request Form" in the Resources section of the Company’s investor relations website.
CONFERENCE CALL
A conference call and webcast to discuss New Frontier Healthcare’s financial results and guidance will be held at 8:00 a.m. U.S. Eastern Time on Thursday, August 27, 2020 (or Thursday, August 27, 2020, at 8:00 pm Beijing Time). Interested parties may listen to the conference call by dialing numbers below:
United States: 1-877-407-0789
International: 1-201-689-8562
China Domestic: 86 400 120 2840
Hong Kong: 800 965 561
Conference ID: 13708749
Participants are encouraged to dial into the call at least 15 minutes in advance due to high call volume
The replay will be accessible through September 3, 2020, by dialing the following numbers:
United States: 1-844-512-2921
International: 1-412-317-6671
Replay PIN: 13708749
The webcast will be available on the Company’s investor relations website at www.nfh.com.cn and will be archived on the site shortly after the call has concluded. A presentation to accompany the call will also be available for download on the website.
About New Frontier Health Corporation
New Frontier Health Corporation (NYSE: NFH) is the operator of United Family Healthcare (UFH), a leading private healthcare provider offering comprehensive premium healthcare services in China through a network of private hospitals and affiliated ambulatory clinics. UFH currently has nine hospitals in operation or under construction in all four tier 1 cities and selected tier 2 cities. Additional information may be found at www.nfh.com.cn.
Forward-Looking Statements
Certain statements made in this release are "forward looking statements" within the meaning of the "safe harbor" provisions of the United States Private Securities Litigation Reform Act of 1995. When used in this press release, the words "estimates," "projected," "expects," "anticipates," "forecasts," "plans," "intends," "believes," "seeks," "may," "will," "should," "future," "propose" and variations of these words or similar expressions (or the negative versions of such words or expressions) are intended to identify forward-looking statements. These forward-looking statements include, without limitation, NFH’s ability to address the effects of the COVID-19 pandemic; NFH’s ability to manage patient inflows; and NFH’s ability to prevent the spread of COVID-19 within its facilities; NFH’s ability to grow its business manage its growth; the benefits and synergies of the business combination it completed in December 2019, including anticipated cost savings, results of operations, financial condition, liquidity, prospects, growth, strategies and the markets in which the Company operates. Such forward-looking statements are based on available current market material and management’s expectations, beliefs and forecasts concerning future events impacting NFH. These forward-looking statements are not guarantees of future results and involve a number of known and unknown risks, uncertainties, assumptions and other important factors, many of which are outside NFH’s control that could cause actual results or outcomes to differ materially from those discussed in the forward-looking statements. For a discussion of such risks, please refer to NFH’s Annual Report on Form 20-F, filed with the SEC on March 31, 2020 and NFH’s subsequent filings with the SEC. NFH undertakes no obligation to update or revise any forward-looking statements, whether as a result of new information, future events or otherwise, except as required by law.
Non-IFRS Measures
The discussion and analysis includes certain measures, including Adjusted EBITDA (before IFRS 16 adoption), which have not been prepared in accordance with IFRS. This measure does not have any standardized meaning prescribed by IFRS and are therefore unlikely to be comparable to similar measures presented by other companies. This measure should be considered as supplemental in nature and not as a substitute for the related financial information prepared in accordance with IFRS. We use this measure to evaluate our operating results and for financial and operational decision-making purposes. We believe that Adjusted EBITDA is helpful in comparing our performance over various reporting periods on a consistent basis by removing from operating results the impact of items that do not reflect core operating performance, and in identifying underlying operating results and trends.
Adjusted EBITDA (before IFRS 16 adoption), is calculated as net loss plus (i) depreciation and amortization, (ii) finance costs/(income), (iii) other gains or losses, (iv) other expenses (such as share based compensation), (v) provision for income taxes, as further adjusted for (vi) certain monitoring fees paid to certain shareholders prior to the Business Combination, (vii) lease expense adjustments as a result of adoption of IFRS 16, (viii) transaction related costs (such as insurance amortization), and (ix) severance costs as a result of the restructuring process mainly in corporate headquarters since the second quarter of 2020. UFH adopted IFRS 16 on January 1, 2019, and recognized lease liabilities and corresponding “right-of-use” assets for all applicable leases, and recognized interest expense accrued on the outstanding balance of the lease liabilities and depreciation of right-of-use assets. As a result, the adoption of IFRS 16 caused depreciation and amortization and finance costs to increase in 2019, and excluded all applicable lease expenses in Adjusted EBITDA. For ease of comparison to prior periods, the Company eliminated the impact of IFRS 16 on Adjusted EBITDA.
Please see the table captioned “Reconciliations of non-IFRS Financial Measures.”
Exchange Rate Information
The translations from Renminbi to U.S. dollars included in the financial statements and elsewhere in this press release have been included for purposes of convenience were made at a rate of RMB7.0651 to US$1.00, the exchange rate set forth in the H.10 statistical release of the Federal Reserve Board on June 30, 2020.
Contacts
Investors
Harry Chang
Tel: +852-9822-1806
Email: [email protected]
ICR, LLC
William Zima
Tel: +1-203-682-8200
Email: [email protected]/[email protected]
Media
Wenjing Liu
Tel: +86-186-1151-5796
Email: [email protected]
Source: New Frontier Health Corporation
NEW FRONTIER HEALTH CORPORATION
UNAUDITED CONSOLIDATED STATEMENTS OF COMPREHENSIVE INCOME (LOSS)
(All amounts in thousands)
| Predecessor | Successor | Predecessor | Successor | |||||||||||||||||||||
For the three months ended June 30, 2019 | For the three months ended June 30, 2020 | For the six months ended June 30, 2019 | For the six months ended June 30, 2020 | |||||||||||||||||||||
| RMB | RMB | US$ | RMB | RMB | US$ | |||||||||||||||||||
| Revenues | 628,089 | 548,948 | 77,699 | 1,205,533 | 979,891 | 138,695 | ||||||||||||||||||
| Operating expenses | ||||||||||||||||||||||||
| Salaries, wages and benefits | (361,312 | ) | (289,011 | ) | (40,907 | ) | (687,896 | ) | (593,203 | ) | (83,962 | ) | ||||||||||||
| Supplies and purchased medical services | (100,656 | ) | (103,441 | ) | (14,641 | ) | (193,624 | ) | (178,934 | ) | (25,326 | ) | ||||||||||||
| Depreciation and amortization expense | (85,218 | ) | (106,158 | ) | (15,026 | ) | (168,853 | ) | (214,244 | ) | (30,324 | ) | ||||||||||||
| Lease and rental (expense)/benefit | (3,359 | ) | 778 | 110 | (6,742 | ) | (1,483 | ) | (210 | ) | ||||||||||||||
| Bad debt benefit (expense) | 1,410 | 1,780 | 252 | (3,216 | ) | (2,249 | ) | (318 | ) | |||||||||||||||
| Other operating expenses | (84,529 | ) | (69,090 | ) | (9,779 | ) | (156,121 | ) | (134,223 | ) | (18,998 | ) | ||||||||||||
| Expense total | (633,664 | ) | (565,142 | ) | (79,991 | ) | (1,216,452 | ) | (1,124,336 | ) | (159,138 | ) | ||||||||||||
| Operating loss | (5,575 | ) | (16,194 | ) | (2,292 | ) | (10,919 | ) | (144,445 | ) | (20,443 | ) | ||||||||||||
| Finance income | 663 | 605 | 86 | 1,191 | 1,023 | 145 | ||||||||||||||||||
| Finance costs | (34,802 | ) | (65,697 | ) | (9,299 | ) | (69,420 | ) | (138,064 | ) | (19,542 | ) | ||||||||||||
| Foreign exchange (losses)/gains | (13,656 | ) | 179 | 25 | (1,826 | ) | 17,532 | 2,481 | ||||||||||||||||
| Gain on disposal of an associate | - | 2,762 | 391 | - | 2,762 | 391 | ||||||||||||||||||
| Other income, net | 752 | 5,945 | 841 | 796 | 13,011 | 1,842 | ||||||||||||||||||
| Loss before income taxes | (52,618 | ) | (72,400 | ) | (10,248 | ) | (80,178 | ) | (248,181 | ) | (35,126 | ) | ||||||||||||
| Income tax (expense)/benefits | (22,545 | ) | (6,943 | ) | (983 | ) | (40,690 | ) | 266 | 38 | ||||||||||||||
| Loss for the period | (75,163 | ) | (79,343 | ) | (11,231 | ) | (120,868 | ) | (247,915 | ) | (35,088 | ) | ||||||||||||
| Attributable to | ||||||||||||||||||||||||
| Equity holders of the parent | (67,907 | ) | (73,808 | ) | (10,448 | ) | (105,869 | ) | (233,978 | ) | (33,115 | ) | ||||||||||||
| Non-controlling interests | (7,256 | ) | (5,535 | ) | (783 | ) | (14,999 | ) | (13,937 | ) | (1,973 | ) | ||||||||||||
| Loss per share attributed to ordinary equity holders of the parent | ||||||||||||||||||||||||
| Basic | (0.56 | ) | (0.08 | ) | (1.78 | ) | (0.25 | ) | ||||||||||||||||
| Diluted | (0.56 | ) | (0.08 | ) | (1.78 | ) | (0.25 | ) | ||||||||||||||||
| Other comprehensive loss | ||||||||||||||||||||||||
| Items to be reclassified to profit or loss in subsequent periods (net of tax): | ||||||||||||||||||||||||
| Currency translation differences | 9,614 | 372 | 53 | 440 | (9,623 | ) | (1,362 | ) | ||||||||||||||||
| Other comprehensive loss | 9,614 | 372 | 53 | 440 | (9,623 | ) | (1,362 | ) | ||||||||||||||||
| Comprehensive loss for the period | (65,549 | ) | (78,971 | ) | (11,178 | ) | (120,428 | ) | (257,538 | ) | (36,450 | ) | ||||||||||||
| Comprehensive loss attributable to | ||||||||||||||||||||||||
| Equity holders of the parent | (58,293 | ) | (73,436 | ) | (10,395 | ) | (105,429 | ) | (243,601 | ) | (34,477 | ) | ||||||||||||
| Non-controlling interests | (7,256 | ) | (5,535 | ) | (783 | ) | (14,999 | ) | (13,937 | ) | (1,973 | ) | ||||||||||||
NEW FRONTIER HEALTH CORPORATION
UNAUDITED CONSOLIDATED STATEMENTS OF FINANCIAL POSITION
(All amounts in thousands)
| December 31, 2019 (Audited) | June 30,
2020 | |||||||||||
| RMB | RMB | US$ | ||||||||||
| Non-current assets | ||||||||||||
| Plant and equipment | 1,962,781 | 1,875,413 | 265,447 | |||||||||
| Goodwill | 6,056,253 | 6,052,861 | 856,727 | |||||||||
| Intangible assets | 2,584,893 | 2,555,037 | 361,642 | |||||||||
| Right-of-use assets | 1,773,007 | 1,680,860 | 237,910 | |||||||||
| Deferred tax assets | 59,001 | 50,144 | 7,097 | |||||||||
| Restricted cash | 350 | 350 | 50 | |||||||||
| Investment in an associate | - | 1,000 | 142 | |||||||||
| Other non-current assets | 106,121 | 101,651 | 14,388 | |||||||||
| Total non-current assets | 12,542,406 | 12,317,316 | 1,743,403 | |||||||||
| Current assets | ||||||||||||
| Inventories | 56,592 | 65,487 | 9,269 | |||||||||
| Trade receivable | 215,376 | 184,332 | 26,091 | |||||||||
| Due from related parties | 66,923 | 8,896 | 1,259 | |||||||||
| Prepayments and other current assets | 38,323 | 44,311 | 6,272 | |||||||||
| Restricted cash | 376,715 | - | - | |||||||||
| Cash and cash equivalents | 1,353,300 | 845,779 | 119,712 | |||||||||
| Total current assets | 2,107,229 | 1,148,805 | 162,603 | |||||||||
| TOTAL ASSETS | 14,649,635 | 13,466,121 | 1,906,006 | |||||||||
| Current liabilities | ||||||||||||
| Trade payables | 99,082 | 110,777 | 15,679 | |||||||||
| Contract liabilities | 270,196 | 301,429 | 42,665 | |||||||||
| Accrued expenses and other current liabilities | 882,158 | 391,543 | 55,419 | |||||||||
| Due to related parties | 4,045 | 4,530 | 641 | |||||||||
| Tax payable | 15,278 | 3,180 | 450 | |||||||||
| Long-term borrowings | 400,325 | 6,256 | 885 | |||||||||
| Lease liabilities | 90,521 | 83,372 | 11,801 | |||||||||
| Total current liabilities | 1,761,605 | 901,087 | 127,540 | |||||||||
| NET CURRENT ASSETS | 345,624 | 247,718 | 35,063 | |||||||||
| TOTAL ASSETS LESS CURRENT LIABILITIES | 12,888,030 | 12,565,034 | 1,778,466 | |||||||||
| Non-current liabilities | ||||||||||||
| Long-term borrowings | 2,060,933 | 2,062,994 | 291,998 | |||||||||
| Contract liabilities | 67,873 | 68,307 | 9,668 | |||||||||
| Deferred tax liabilities | 681,715 | 673,425 | 95,317 | |||||||||
| Lease liabilities | 1,661,182 | 1,597,757 | 226,148 | |||||||||
| Other long-term liabilities | 9,358 | 9,274 | 1,313 | |||||||||
| Total non-current liabilities | 4,481,061 | 4,411,757 | 624,444 | |||||||||
| Net assets | 8,406,969 | 8,153,277 | 1,154,022 | |||||||||
| EQUITY | ||||||||||||
| Equity attributable to the equity holders of the Company | ||||||||||||
| Ordinary shares | 91 | 91 | 13 | |||||||||
| Capital surplus | 8,430,405 | 8,434,251 | 1,193,791 | |||||||||
| Translation reserves | 6,302 | (3,321 | ) | (470 | ) | |||||||
| Accumulated deficit | (265,618 | ) | (499,596 | ) | (70,713 | ) | ||||||
| 8,171,180 | 7,931,425 | 1,122,621 | ||||||||||
| Non-controlling interests | 235,789 | 221,852 | 31,401 | |||||||||
| Total equity | 8,406,969 | 8,153,277 | 1,154,022 | |||||||||
NEW FRONTIER HEALTH CORPORATION
UNAUDITED CONDENSED CONSOLIDATED STATEMENTS OF CASH FLOWS
(All amounts in thousands)
| Predecessor | Successor | Predecessor | Successor | |||||||||||||||||||||
| For the three months ended June 30, 2019 | For the three months ended June 30, 2020 | For the six months ended June 30, 2019 | For the six months ended June 30, 2020 | |||||||||||||||||||||
| Cash generated from (used for): | RMB | RMB | US$ | RMB | RMB | US$ | ||||||||||||||||||
| Operating activities | 74,168 | 386,555 | 54,713 | 178,085 | 149,539 | 21,166 | ||||||||||||||||||
| Investing activities | (29,161 | ) | (112,606 | ) | (15,938 | ) | (179,916 | ) | (127,236 | ) | (18,009 | ) | ||||||||||||
| Financing activities | (44,614 | ) | (476,769 | ) | (67,482 | ) | (102,609 | ) | (529,864 | ) | (74,997 | ) | ||||||||||||
| Net increase/(decrease) in cash and cash equivalents | 393 | (202,820 | ) | (28,707 | ) | (104,440 | ) | (507,561 | ) | (71,840 | ) | |||||||||||||
Exhibit 99.2

1 1 New Frontier Health Q2 2020 Results Aug 27, 2020

2 2 Disclaimer Forward - Looking Statements This presentation includes “forward - looking statements” within the meaning of the “safe harbor” provisions of the Private Securi ties Litigation Reform Act of 1995. The actual results of New Frontier Health Corporation (the “Company”) may differ from the Company’s expectations, estimates and projections and consequently, you should not rely on these forward - loo king statements as predictions of future events. Words such as “expect”, “estimate”, “project”, “budget”, “forecast”, “anticipate”, “intend”, “plan”, “may”, “will”, “could”, “should”, “believes”, “predicts”, “potential”, “continue” , a nd similar expressions are intended to identify such forward - looking statements. These forward - looking statements involve significant risks and uncertainties that could cause the actual results to differ materially from the expected result s, including, but not limited to, the Company’s ability to manage growth; the Company’s ability to execute its business plan, including its planned expansions, and meet its projections; rising costs adversely affecting the Company’s pro fit ability; potential litigation involving the Company; general economic and market conditions impacting demand for the Company’s services, and in particular the effects of COVID - 19 on the Company's business and financial condition a s well as other economic and market conditions in the Chinese healthcare industry and changes in the rules and regulations that apply to such business, including as it relates to foreign investments in such businesses; and oth er risks and uncertainties indicated from time to time in the Company’s filings with the U.S. Securities and Exchange Commission (the “SEC”). Most of these factors are outside of the Company’s control and are difficult to predict. The Co mpany cautions readers not to place undue reliance upon any forward - looking statements, which speak only as of the date made. The Company does not undertake or accept any obligation or undertaking to release publicly any upda tes or revisions to any forward - looking statements to reflect any change in its expectations or any change in events, conditions or circumstances on which any such statement is based, except as required by law. Financial Information The Company acquired UFH in a business combination that closed on December 18, 2019. The financial results for the years ende d D ecember 31, 2018 and 2019, and for the quarter ended June 30, 2019 presented herein are those of the Company’s wholly owned subsidiary, Healthy Harmony Holdings, L.P. (the “Predecessor”), while the financial results for th e quarter ended June 30, 2020, presented herein are those of the combined Company (the “Successor”). Industry and Market Data In this presentation, we rely on and refer to information and statistics regarding market participants in the sectors in whic h t he Company competes and other industry data. The Company obtained this information and statistics from third - party sources, including reports by market research firms and company filings. Use of Non - IFRS Financial Matters The discussion and analysis includes certain measures, including Adjusted EBITDA (before IFRS 16 adoption), Adjusted EBITDA M arg in, Free Cash Flow and Pro - forma Adjusted EBITDA, and Pro - forma Adjusted EBITDA Margin, which have not been prepared in accordance with IFRS. These measures do not have any standardized meaning prescribed by IFRS and are therefore unlikely to be comparable to similar measures presented by other companies. These measures should be considered as supplemental in nature and not as a substitute for the related financial information p rep ared in accordance with IFRS. We use these measures to evaluate our operating results and for financial and operational decision - making purposes. We believe that Adjusted EBITDA and Pro - forma Adjusted EBITDA helps compare our perfor mance over various reporting periods on a consistent basis by removing from operating results the impact of items that do not reflect core operating performance and helps identify underlying operating results and trends. Adjusted EBITDA (before IFRS 16 adoption), is calculated as net loss plus ( i ) depreciation and amortization, (ii) finance expense/(income), (iii) other gains or losses, (iv) other expenses (such as sha re based compensation), (v) provision for income taxes, as further adjusted for (vi) certain monitoring fees paid to certain shareholders prior to the Bu sin ess Combination, (vii) lease expense adjustments as a result of adoption of IFRS 16, (viii) transaction related costs, (ix) Gain on disposal of an associate and (x) Severance costs as a result of the restructuring process mainly in corporate he adq uarters since the second quarter of 2020. UFH adopted IFRS 16 on January 1, 2019, and recognized lease liabilities and corresponding “right - of - use” assets for all applicable leases, and recognized interest expense accrued on the outstanding balance of the lease liabilities and depreciation of right - of - use assets. As a result, the adoption of IFRS 16 caused depreciation and amortization and finance costs to increase in 2019 and excluded all applicabl e l ease expenses in Adjusted EBITDA. For ease of comparison to prior periods, the Company eliminated the impact of IFRS 16 on Adjusted EBITDA. Pro - forma Adjusted EBITDA, is calculated as net loss plus ( i ) depreciation and amortization, (ii) finance expense/(income), (iii) other gains or losses, (iv) other expenses (such as sha re based compensation), (v) provision for income taxes, as further adjusted for (vi) certain monitoring fees paid to certain shareholders prior to the Business Combination, ( vii ) lease expense adjustment as a result of adoption of IFRS 16, (viii) transaction related costs, (ix) Gain on disposal of an associate, (x) Severance costs as a result of the restructuring process mainly in corporate headquarters since th e second quarter of 2020 and (xi) Pro - forma adjustments in PXU. See slide 46 for further information on these pro - forma adjustments. Adjusted EBITDA margin is calculated by dividing Adjusted EBITDA (before IFRS 16 adoption), by total revenue and Pro - forma Adjus ted EBITDA margin is calculated by dividing Pro - forma Adjusted EBITDA by total revenue. Free cash flow is calculated as 1) cash flow generated from operating activities 2) minus release of restricted cash, 3) minu s c apital lease payments, 4) add interest expense paid, 5) add one - off transaction expense related to the business combination, 6) minus capital expenditure on existing operations of the facilities. A reconciliation of non - IFRS forward looking information to their corresponding IFRS measures are not included in this presentat ion as they cannot be provided without unreasonable effort because of the inherent difficulty of accurately forecasting the occurrence and financial impact of the various adjusting items necessary for such reconciliation that have no t y et occurred, are out of our control, or cannot be reasonably predicted.

3 3 Overview Q2 2020 Business Highlights Q2 2020 Financial R esults Growth Initiatives Appendix A - I ndustry Overview Appendix B - Additional Materials Table of Contents

4 4 Beijing United Family Hospital North ( 2020 ) OVERVIEW

5 5 Leading Private Healthcare Service Provider in China COMPREHENSIVE SERVICE OFFERING covering 30+ specialties 9 hospitals 1 14 clinics 1 1,000+ licensed beds 800+ physician staff 1000+ physician consultants 2019 A outpatient visits: ~ 6 33 ,000 2019 A inpatient visits: ~ 11, 000 Operating Assets 2 2019A Pro - Forma Adjusted EBITDA: RMB 483mm 2015A - 201 9 A CAGR: 30 .4 % Source: Company; As of Dec 31, 2019 1 . I ncludes 2 hospitals under construction, 14 directly operated clinics 2 . Operating assets include Beijing, Shanghai Puxi , Tianjin, Qingdao and Beijing Rehab Hospitals as well as B o’Ao and Hangzhou Clinics and post - partum care worker business 3 . All hospital and clinics with at least 3 years of operating experience are accredited or re - accredited on a 3 - year cycle . The newest Qingdao and Shanghai Pudong hospitals were not yet eligible in the 2017 audit, but Qingdao will be included in the 2020 audit and Pudong will be eligible in the next cycle . One of the LARGEST private healthcare service providers in China by revenue 2019 A total revenue : RMB ~ 2. 45 bn 2015A - 201 9 A CAGR: 1 5.1 % 1 1 TOP - RANKED brand among high - end private hospitals ALL 3 JCI accredited Beijing United Family ONLY JCI and CAP accredited hospital FIRST da Vinci and MAKO in private hospital GCP certification from CFDA for conducting clinical drug trials

6 6 5 Hospitals Hub Spoke 8 Clinics Hub - and - Spoke Model 2 Hospitals Hub Spoke 4 Clinics Hub - and - Spoke Model 2 Hospitals Hub Spoke 2 Clinics Hub - and - Spoke Model Beijing Tianjin Qingdao Guangzhou Hangzhou Hainan Shenzhen 2 Shanghai Source: Company ; As of Dec 31, 2019 1. 5 hospitals in Beijing Cluster including Qingdao United Family and Tianjin United Family 2. UFH is expected to be given the exclusive right to manage New Frontier Group’s 64,000 sq. meter flagship Shenzhen city cen ter hospital as part of the transaction Broad geographic coverage across all four Tier 1 cities Strategic opportunity for expansion into Tier 2 cities GREATER BAY CLUSTER SHANGHAI CLUSTER + EAST CHINA BEIJING CLUSTER + NORTH CHINA 1 Nationwide Geographic Footprint

7 7 Expat 46% Local 54% BROADER ADDRESSABLE MARKET WITH MORE LOCAL PATIENTS 3 Commercial Insurance 37% Self - pay 63% Diversified Foundation for Future Growth Expat 29% Local 71% MULTI - SPECIALTY SERVICE OFFERING 1 2019A Source: Company 1. OB/GYN: Obstetrics and Gynecology; Peds: Pediatrics; Ortho: Orthopaedics; FM: Family Medicine; IM: Internal Medicine; ER: Eme rgency Room; PPR: Post - Partum Rehab 2. Split by revenue from insurance / self - pay patients 3. Split by volume of expat and local Chinese patients REVENUE MIX BETWEEN SERVICE & PHARMACY 2019A OB/GYN 22% Peds 14% Surgery 7% Ortho 7% FM 10% IM 8% ER 7% PPR 5% Others 19% 2014 2019A DIVERSIFIED PAYER STRUCTURE 2 Pharmacy 10% Service 90% 2019A

8 8 Revenue driven by high acuity departments including Orthopedics & Surgery High Acuity 163 351 2014 2019A Surgery Orthopedics Potential for Dermatology, ENT 1 , Ophthalmology & New Hope Oncology Centre New Specialties 51 138 2014 2019A Ophthalmology ENT Dermatology Comprehensive Provider with Entire “Lifecycle" Coverage Hub - and - spoke model creates comprehensive healthcare services platform with multiple patient touchpoints Clinics Home Health Attracting traffic with OB/GYN and Pediatrics 483 902 2014 2019A Pediatrics OB/GYN Revenue (RMB mm) Prenatal Care Pediatrics OB/ GYN 1 Expanding differentiated services complemented by Rehabilitation and PPR PPR 1 Rehabilitation 35 2014 2019A PPR Rehabilitation Broader patient base built up by Family Medicine 112 252 2014 2019A Family Medicine Family Medicine Dental Source: Company 1. OB/GYN: Obstetrics and Gynecology; ENT: Ear, Nose and Throat; PPR: Post - Partum Rehabilitation Hospitals 169

9 9 UFH A B C D E 1.85 1.55 1.53 1.50 1.08 1.48 UFH A B C D E 1.75 1.64 1.55 1.38 1.30 1.38 One of the Most Reputable Private Healthcare Brands in China Ranks top for medical quality among high - end private hospitals by patients, doctors and government regulators Source: Company, Company Analysis 1. Survey Question 4: Please rank the following private hospital brands’ medical quality. Screening criteria: Have had any ki nd of medical treatment in private hospital in past 36 months 2. Scoring methods: a) Score 5 for brand ranked 1 st ; Score 3 for brand ranked 2 nd ; Score 1 for brand ranked 3 rd ; b) Divide summed score by the number of respondents 3. Sample size for Beijing, Shanghai and Guangzhou were 105, 110 and 62 respondents, respectively Ranking score of private brands among monthly households income >RMB 27K 1,2,3 BEIJING UFH A B C D E SHANGHAI GUANGZHOU 1.64 1.37 1.30 1.28 1.03 1.25 2003 – The designated healthcare institution for foreigners during the SARS period 2010 – Official designated medical institutions for the Shanghai World Expo 2015 - Named as Most Investment - Worthy Healthcare Company 2016 – Ranked No.1 in China Top 100 Private Hospitals 2016 – Ranked No.2 in China Private Hospital Valuable Brands 2016 – Ranked No.18 in China Private Hospital Conglomerates Top 50 League 2018 – The designated Well - Known Trademark 2018 - Ranked No.1 repeatedly as The Best Employer among all private hospitals
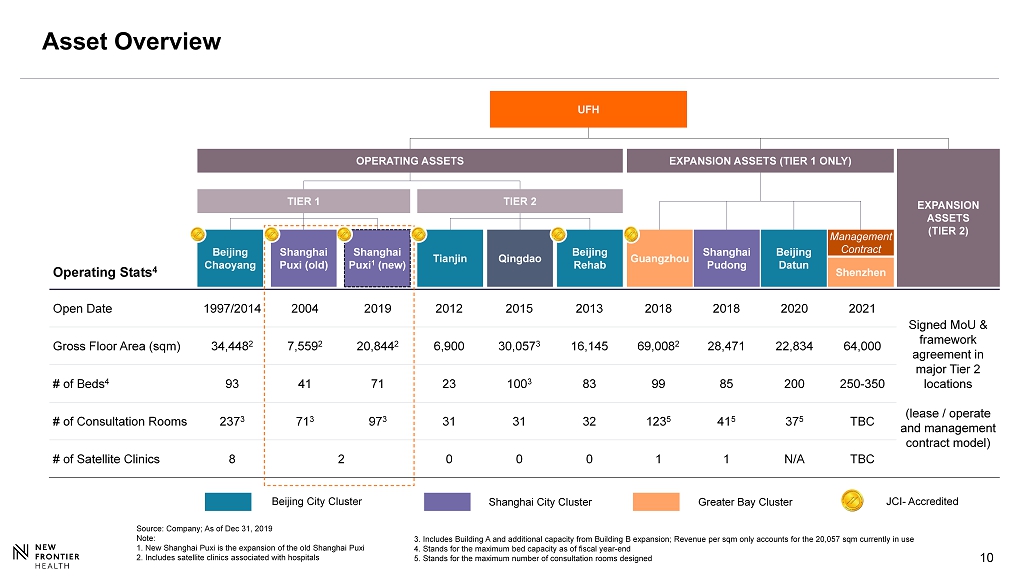
10 10 Operating Stats 4 Open Date 1997/2014 2004 2019 2012 2015 2013 2018 2018 2020 2021 Signed MoU & framework agreement in major Tier 2 locations (lease / operate and management contract model) Gross Floor Area (sqm) 34,448 2 7,559 2 20,844 2 6,900 30,057 3 16,145 69,008 2 28,471 22,834 64,000 # of Beds 4 93 41 71 23 100 3 83 99 85 200 250 - 350 # of Consultation Rooms 237 3 71 3 97 3 31 31 32 123 5 41 5 37 5 TBC # of Satellite Clinics 8 2 0 0 0 1 1 N/A TBC TIER 1 Shanghai Puxi 1 (new) Shanghai Puxi (old) Asset Overview Source: Company ; As of Dec 31, 2019 Note: 1. New Shanghai Puxi is the expansion of the old Shanghai Puxi 2. Includes satellite clinics associated with hospitals UFH Beijing City Cluster Shanghai City Cluster Greater Bay Cluster OPERATING ASSETS EXPANSION ASSETS (TIER 1 ONLY) JCI - Accredited Beijing Chaoyang Shanghai Pudong Beijing Datun Shenzhen Management Contract Guangzhou Qingdao Beijing Rehab Tianjin TIER 2 EXPANSION ASSETS (TIER 2) 3. Includes Building A and additional capacity from Building B expansion; Revenue per sqm only accounts for the 20,057 sqm cu rre ntly in use 4. Stands for the maximum bed capacity as of fiscal year - end 5. Stands for the maximum number of consultation rooms designed

11 FY2019 Revenue (in million RMB) FY2019 Pro - forma Adjusted EBITDA (in million RMB) 2019 Revenue / Pro - forma Adjusted EBITDA 1 Summary 483 163 161 159 Tier 1 Operating Assets Total 0 HQ Tier 2 Operating & Other Assets Expansion Assets 1,811 359 280 Tier 1 Operating Assets Total Tier 2 Operating & Other Assets Expansion Assets 2,449 9% Y - o - y Growth 19% 21% 170% Pro - Forma Adjusted EBITDA Margin % 27% n.m. 0% - 58% 7% Revenue per Bed 2 Notes: 1. See slide 46 for a reconciliation of net loss to Pro - forma Adjusted EBITDA 2.Revenue per bed is calculated based on the weighted average maximum bed capacity of the fiscal year 3.Refferring to Beijing United Family Hospital in Chaoyang as its associated clinics 4.Referring to Shanghai Puxi United Family Hospital and its associated clinics. Maximum bed capacity for Shanghai Puxi United Family Hospital increased with the relocation to new site in Q4 2019 Beijing 3 14.0 1.7 1.5 4.6 Shanghai 4 10.8

12 12 Hospitals: Long Term Maturity Cycle 0 50 100 150 200 250 300 350 400 450 500 550 600 650 700 750 800 850 900 950 1,000 1,050 1,100 1997 1998 1999 2000 2001 2002 2003 2004 2005 2006 2007 2008 2009 2010 2011 2012 2013 2014 2015 2016 2017 2018 2019 QDU (20,057 sqm 3 ) BJU (24,959 sqm) PXU (previously 7,559 sqm; 20,844 sqm after relocation) TJU (6,900 sqm) Rehab (16,145 sqm) Hospital Revenue (mm RMB) Due to capacity bottleneck with only 5,886 sqm, Shanghai hospital struggled to take on additional patient volume and develop higher acuity services. Capacity issue was solved in October 2019 when Shanghai hospital moved to a new site with 19,172 sqm of facility size GZM (69,008 sqm) Dec - 19 (Month 15 1 ) Run Rate Revenue 2 (RMB 200mm) PDU (28,471 sqm) Dec - 19 (Month 13 1 ) Run Rate Revenue 2 (RMB 131mm) Source: Company ( Unaudited); As of Dec 31, 2019 1. Since the hospital obtained its OB license 2. Run - rate revenue is defined as monthly revenue * 12 3. Only 20,057 sqm Building A is currently in use and contributes revenue for now; total GFA is 30,057 sqm which includes Bui ldi ng A and additional capacity from Building B expansion

13 Significant White Space for Growth in Tier 1 Cities 1 Tier 1 Cities # of UFH Patients 2 ~200,000 Tier 1 Cities Target Addressable Market 3 ~4.1 million Tier 1 Cities Total Resident Population 4 ~ 74 million ~5% ~0.3% Significant white space within Tier 1 Cities for future growth Source: Company Analysis, National Bureau of Statistics 1. Tier 1 Cities include Beijing, Shanghai, Guangzhou and Shenzhen 2. Number of unique UFH patients in Tier 1 cities in 2019 3. Addressable market includes target expatriate population, local population with out - of - pocket payment and local population with premium hea lthcare insurance coverage as of 2018 4. Number of residents in Beijing, Shanghai, Guangzhou and Shenzhen as of 2018

14 14 Shanghai United Family Pudong Hospital Q2 2020 BUSINESS HIGHLIGHTS

15 15 Financial Snapshot Outpatient Visit - 23.3 % YoY 40.5 % QoQ 125,723 Visits Inpatient Admission - 23.6 % YoY 0.1 % QoQ Utilization Rate Compared to 37.5 % in 2Q19 32.1 % Operational Snapshot Adjusted EBITDA (before IFRS 16 Adoption) 1 RMB 54.0 mn Total Revenue - 12.6 % YoY 27.4 % QoQ RMB 548.9 mn 2,059 Admissions Q2 2020 Operational and Financial Snapshot Notes: 1. See slide 46 for a reconciliation of net loss to Adjusted EBITDA (before IFRS 16 Adoption) Outpatient ASP 10.8 % YoY RMB 2,640 Inpatient ASP 16.1 % YoY RMB 101,024 2.3 % YoY

16 16 Revenue Outperformed 2019 for Consecutive Four Weeks Since Mid July 1/18 2/2 2/17 3/3 3/18 4/2 4/17 5/2 5/17 6/1 6/16 7/1 7/16 7/31 8/15 (1) (1) (0) (0) (0) (0) - 0 0 Last Day of the Week Y - o - y % of 2020 Weekly Revenue Q1 Chinese New Year 2019 Chinese New Year & Wuhan Lock down 1/23 Wuhan Lift lock down 4 / 8 B eijing lowered COVID - 19 emergency response to Level 2 4/30 Outperform 2019 for Consecutive 4 Weeks Q2 “ Xinfadi ” Cases Beijing raised COVID - 19 emergency response to Level 2 again 6/16 Beijing adjusted to Response Level 3 7/20 - 51% Turning Point (Y - o - y%) - 42% - 25% 0% Stage 1: COVID - 19 Outbreak to Turning Point Stage 2: Markets Recovery (except for Beijing) Stage 3: All Markets Recovery Notes: 1. QTD by the end of the Week of Aug 15 th 2. Above this line indicates y - o - y growth and below the line means y - o - y decline due to COVID - 19 Q3 QTD 11 .6% Stage 4: Beijing 2 nd Wave Outbreak Stage 5 : YoY Revenue Growth 0% 2

17 17 Strong Recovery for Both Local and Expat Patient Base 0 % 1 - 62% Feb - 36% - 26% Jan Mar Jul 6% Apr May Jun 6% 10% - 14% 14% Y - o - y % of 2020 Monthly Revenue UFH has reported positive YoY growth for both local and expat population in July 2020 Local (excl. BJM) Local Expat Total Strong local demand contributed to the rapid recovery since April despite a temporary reimposition of restrictions in Beijing, demonstrating high resilience of our local customer base Despite continued restrictions on inbound travel to China, revenue from expat patients also recovered strongly in the quarter, with continued growth expected as restrictions begin to ease Notes: 1. Above this line indicates y - o - y growth while below the line means y - o - y decline due to COVID - 19.

18 18 GZU Broke Even in May and Recorded Positive EBITDA for Three Consecutive Months After only 21 months of Operations 1 - 2.6% 22.3% Jan 8.9% Feb 3.7% Mar Apr 22.5% May 31.7% Jun 43.5% Jul GZU 2020 Monthly Revenue (Y - o - y%) 2020 Positive EBITDA Notes: 1. Since the hospital obtained its OB license

19 19 Specialty Development: 500 Da Vinci Surgeries & Various Notable Surgeries BJU celebrated its 500 Da Vinci surgeries in May Over 10 physicians in BJU have extensive robotic surgery experience in various specialties such as u rology , thyroid, gastrointestinal and gynecology The first capsule pacemaker was implanted in BJU, j oining the ranks of top hospitals such as Anzhen Hospital and Beijing Fuwai Hospital with this service PXU’s first 2 interventional cardiac surgeries completed in the brand new hybrid operating room

20 20 Fight Against COVID - 19 Volunteers in the Mass Testing after the “ Xinfadi ” Cases PCR Lab Approved for COVID Testing Actively participating in the sample collection for over 40K people in Chaoyang district Providing group testing for Fortune 500 Companies UFH is enabled to deliver testing results itself after commencement of COVID RNA testing in our Beijing PCR lab We have performed testing for 24K+ people across the nation 1 1. As of the date of Earnings Release

21 21 2020 “618” E - commerce Campaign >5x Total GMV Y - o - y 5k Products Sold Total 1 .8m Live Audience 1.5k Products Sold Live No.1 1 No.1 Live GMV 2 in Healthcare Sector 3 No.1 1 618 Healthcare Live Hour List Partnered with Taobao from this successful event and pushed forward strategic initiatives with Ali Health Notes: 1. Ranking provided by Taobao 2. GMV = Gross Merchandise Volume 3. In self - operating Tmall store 6 / 16 CEO live broadcasting : 2 - hour live show with Roberta Lipson, Carl Wu, Janice Man and 6 doctors Promoting healthy lifestyle and various UFH health products Successful in attracting new patients and building brand awareness Event result snapshots :
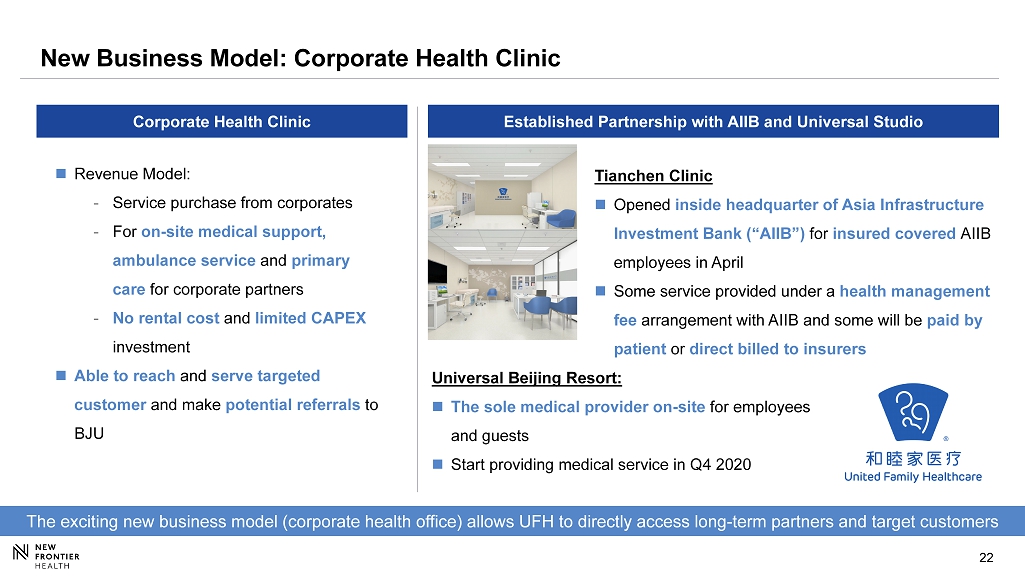
22 22 New Business Model: Corporate Health Clinic Tianchen Clinic Opened inside headquarter of Asia Infrastructure Investment Bank (“AIIB”) for insured covered AIIB employees in April Some service provided under a health management fee arrangement with AIIB and some will be paid by patient or direct billed to insurers Universal Beijing Resort: The sole medical provider on - site for employees and guests Start providing medical service in Q4 2020 Corporate Health Clinic Established Partnership with AIIB and Universal Studio The exciting new business model (corporate health office) allows UFH to directly access long - term partners and target customers Revenue Model: - Service purchase from corporates - For on - site medical support, ambulance service and primary care for corporate partners - No rental cost and limited CAPEX investment Able to reach and serve targeted customer and make potential referrals to BJU

23 Strategic Priorities for 2H 2020 Market Level Organizational Consolidation and Optimization Ramp - up of Newly Opened Facilities (Shanghai Puxi , Shanghai Pudong and Guangzhou) Invest in Core Markets and Expand Capabilities in Selected Specialties Invest in Digital Patient Experience and Online Capabilities Expand Tier 1 City Outpatient Network Continue with Cost and Cash Control / Business Recovery Post Coronavirus Prepare for the Launch of Beijing Datun Hospital and Shenzhen Hospital

24 24 Shanghai United Family Hospital Q2 2020 FINANCIAL RESULTS

25 Q2 Revenue Recovered from Q1 23 43 55 69 74 82 65 89 61 71 79 84 87 83 93 96 64 78 391 429 405 434 435 477 437 462 302 382 507 18 19Q1 18Q1 520 20 18Q2 18Q4 18Q3 19Q2 431 19Q3 604 19Q4 20Q1 20Q2 470 562 577 628 640 549 Operating Tier 1 Operating Tier 2 & Other Assets Expansion Revenue (in million RMB) - 25% 19% 14% Y - o - y Growth - 20% - 7% 30% Y - o - y Growth - 13% 27% Q - o - q Recovery

26 Outpatient and Inpatient Volume by Segment Outpatient Volume Inpatient Admission 521 291 378 392 446 361 405 1,575 561 514 581 616 528 614 616 451 450 1,612 1,597 1,686 1,687 1,789 1,598 1,850 1,244 1,204 19Q2 37 18Q2 2 18Q1 18Q3 18Q4 19Q1 19Q3 19Q4 20Q1 20Q2 2,096 2,695 2,175 2,148 2,430 2,604 2,594 2,912 2,056 2,059 163 9,030 9,753 9,837 13,384 15,499 18,657 17,259 20,267 13,203 17,870 16,425 18,431 20,770 21,533 21,139 21,552 21,782 23,038 12,564 18,438 109,084 115,687 109,632 112,771 114,913 123,801 114,626 120,131 63,696 89,415 18Q1 20Q2 19Q2 18Q3 18Q2 18Q4 19Q1 19Q3 19Q4 20Q1 125,723 140,239 134,539 143,871 147,688 151,551 164,010 163,436 153,667 89,463 - 41% 10% 11% - 28% - 14% - 4% - 33% - 15% 7% Y - o - y Growth Y - o - y Growth Operating Tier 1 Operating Tier 2 & Other Assets Expansion - 23% - 21% 21% 20% - 24% Y - o - y Growth 41% 0% Q - o - q Recovery Q - o - q Recovery Notes: 1. Due to lower admissions in the pediatrics department throughout UFH facilities, as schools stayed closed and enhanced pers ona l hygiene and protective measures for school children were implemented (Excl. Beijing) 7% 1

27 ASP 1 Increased in Q2 Due to Higher Acuity Procedures Outpatient ASP Inpatient ASP 19Q2 92,964 18Q3 18Q1 86,379 87,019 81,965 19Q3 89,755 18Q4 83,932 101,024 18Q2 20Q2 19Q1 86,847 20Q1 79,807 89,969 19Q4 2,390 18Q2 2,226 19Q1 2,267 19Q4 2,240 19Q2 18Q4 2,341 2,383 2,358 18Q1 19Q3 2,640 2,377 2,608 18Q3 20Q1 20Q2 9% 2% 4% Y - o - y Growth Y - o - y Growth Notes: 1. Average selling price 11% 13% - 3% 4% Y - o - y Growth 16%
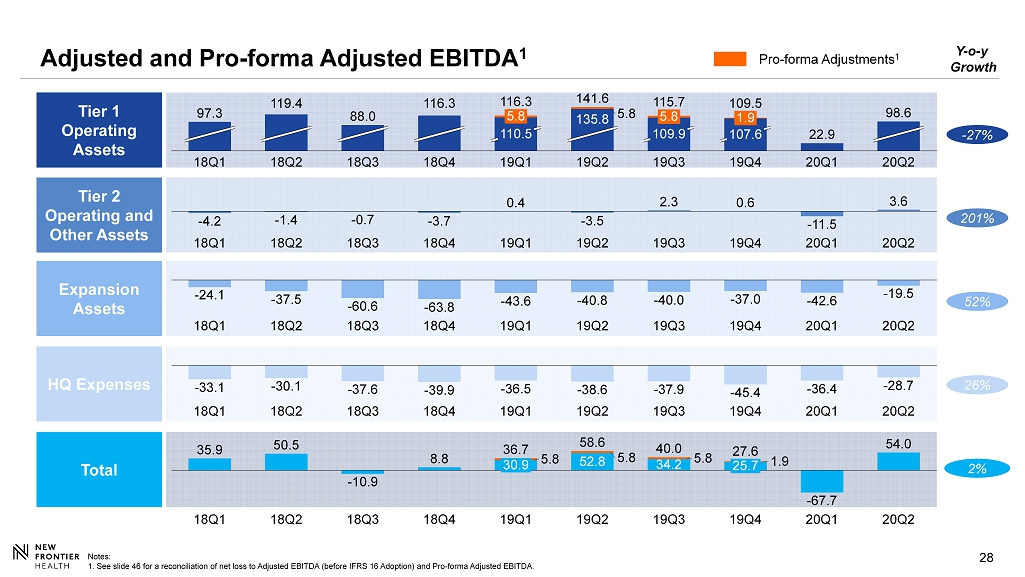
28 Adjusted and Pro - forma Adjusted EBITDA 1 Tier 1 Operating Assets Tier 2 Operating and Other Assets Expansion Assets Total 52.8 34.2 5.8 5.8 5.8 1.9 18Q3 18Q2 18Q1 18Q4 50.5 30.9 19Q1 19Q2 - 10.9 54.0 19Q3 25.7 19Q4 20Q1 20Q2 35.9 8.8 36.7 58.6 40.0 27.6 - 67.7 - 24.1 - 37.5 - 60.6 - 63.8 - 43.6 - 40.8 - 40.0 - 37.0 - 42.6 - 19.5 19Q1 18Q1 18Q3 18Q2 18Q4 19Q3 19Q2 19Q4 20Q1 20Q2 - 4.2 - 1.4 - 0.7 - 3.7 0.4 - 3.5 2.3 0.6 - 11.5 3.6 18Q3 18Q1 19Q1 19Q2 18Q2 18Q4 19Q3 19Q4 20Q1 20Q2 5.8 18Q1 1.9 18Q4 20Q1 109.9 98.6 88.0 18Q3 5.8 18Q2 110.5 19Q1 19Q3 20Q2 119.4 135.8 141.6 19Q2 116.3 5.8 107.6 19Q4 97.3 116.3 115.7 109.5 22.9 - 27% 201% 52% 2% Y - o - y Growth Pro - forma Adjustments 1 Notes: 1. See slide 46 for a reconciliation of net loss to Adjusted EBITDA (before IFRS 16 Adoption) and Pro - forma Adjusted EBITDA. HQ Expenses - 33.1 - 30.1 - 37.6 - 39.9 - 36.5 - 38.6 - 37.9 - 45.4 - 36.4 - 28.7 19Q2 18Q2 18Q1 18Q3 19Q3 18Q4 19Q1 19Q4 20Q1 20Q2 26%

29 29 Operating Expenses L owered Cost Structure Due to Cost Saving Initiatives 361.3 289.0 20Q2 19Q2 SWB 58% As % of Revenue 53 % Salary, Wages & Benefits (in million RMB) 84.5 69.1 106.2 85.2 103.4 100.7 3.4 - 1.4 19Q2 276.1 - 0.8 20Q2 - 1.8 272.4 Depreciation and Amortization 2 Supplies & Purchased Medical Service Lease & Rental 3 Bad debt benefit 1 Others 43% As % of Revenue 50% Other SG&A (in million RMB) Notes: 1. 2020 Q2 increases due to better collection rates over the past year. 2. 2020 Q2 decreases due to fair value appreciation of plant and equipment, contracts with insurers related to the business c omb ination, and full depreciation of the newly expanded PXU facility. 3. 2020 Q2 is a benefit of RMB0.8 million primarily due to a reduction in rental expenses as a result of government policies dur ing the pandemic.

30 Strong Balance Sheet and Positive Free Cash Flow in Q2 2020 Notes: 1. Adjusted operating cash flow is defined as cash generated for operating activities less capital lease payments, adding back i nte rest expense and one - off transaction related costs. See slide 45 for detailed reconciliation 2. Free cash flow is defined as operating cash flow less maintenance CAPEX Adj. Operating Cash Flow 1 Apr to Jun, 2020 10 RMB million Cash and Cash Equivalents As of June 30 th , 2020 846 RMB million Free Cash Flow 2 Apr to Jun, 2020 3 RMB million

31 31 Qingdao United Family Hospital GROWTH INITIATIVES

32 32 Managed Care Patient is paired with a Primary Care Provider Incentivizes pro - active prevention Aligns the interests of payer, provider and patient I ncentivizes chronic disease management I ncentivizes cost saving with no compromise on quality 1 2 3 4 5 Provider Patient Payer Shared Risk Model Partnering with patients to use pro - active approaches to keep them healthy Patients stay healthy and we have healthy margins Giving patients transparency and predictability in their healthcare expenditures Risk shared by UFH and insurer

33 33 Enhance Clinic Networks in Existing Markets Integrated Healthcare Services Model Generating Significant Synergies. Continue to Replicate Outpatient Networks in Existing Mar kets Significant Referral Revenue from Beijing Clinics (RMB mm) SUCCESSFUL HUB & SPOKE BUSINESS MODEL Source: Company; As of Dec 31, 2019 Hospitals Clinic Clinic Clinic Clinic Clinic Clinic 79 88 93 89 9.4% 9.7% 9.2% 8.4% 2019 2016 2017 2018 Beijing Hospital referral revenue from clinics C ontribution to hospital revenue

34 34 Upside Catalysts Delivering Additional Value CLEAR SPECIALTY FOCUS Continue deep specialization in select areas but maintain a comprehensive suite of services Grow IVF from Tianjin to nationwide New centers of excellence: oncology, orthopedics, ENT, sleep center, geriatric center, gynecology, advanced surgical , etc. TECHNOLOGY UPGRADES M&A OPPORTUNITIES Strategic acquisitions of specialty hospitals, outpatient and services network to further complement our existing portfolio Management contracts include a right to acquire managed hospitals Focus on increasing acuity services (robotics, oncology, advance imaging) to drive ASP / margin and create higher barriers to competitors Develop internet hospital and online portal to further engage with patients Continued investment in the AI and mobile technology for data analytics, online consultation, risk underwriting, preventive care

35 35 Investment Highlights Well - established nationwide platform with scale and an experienced management platform 4 Attractive valuation on a sum - of - the - parts basis 5 Multi - dimensional growth opportunities 6 The leading comprehensive healthcare services provider with the most reputable brand in China 2 Robust outlook of the Chinese private healthcare industry supported by favorable long term secular drivers 1 Unique hospital + clinic hub & spoke network; “entire lifecycle” coverage 3

36 APPENDIX A - INDUSTRY OVERVIEW

37 37 REVENUE FOR HEALTHCARE SERVICES IN CHINA - HOSPITALS & PRIMARY CARE (US$ bn) 1 CAGR 13 - 18 (%) CAGR 18 - 23 (%) 22% 11% 21% 9% (US$ bn) 1 42% 58% 59% 59% 59% 60% 62% 41% 41% 41% 40% 38% Rapid Growth in Demand for Healthcare Services 23% 25% CAGR 17 - 23 (%) 20% 22% CAGR 13 - 17 (%) Source: NHFPC, Company Analysis 1. Exchange rate at USD:RMB = 1.00 : 6.80 2. Annual high - end medical spending by residents (Expatriate, Local out of Pocket, Local Insured Patients) in Tier 1 & Tier 2 ci ties of China Local out of Pocket is defined as affluent households with annual income > RMB 324K Assumed addressable population all live in Tier 1 and Tier 2 cities; Tier 1 cities: Beijing, Shanghai, Guangzhou and Shenzhen ; Tier 2 cities: 46 cities incl. Tianjin, Nanjing, Hangzhou, Chongqing, Chengdu, Ningbo and etc. PREMIUM HEALTHCARE EXPENDITURE 2 IN CHINA 2023E 488 2013A 8% 389 340 2014A 92% 2015A 91% 2016A 88% 434 1,009 90% 2017A 89% 12% 544 2018A 609 10% 8% 9% 19% 11% 92% 81% Private Public 41% 59% 42% 58% 41% 2013A 2014A 59% 62% 2015A 41% 59% 2016A 40% 60% 2017A 38% 2023E 5 7 8 10 13 40 1st tier 2nd tier

38 38 China is Under - penetrated in Private Healthcare 0 5 10 15 20 25 30 35 40 45 50 55 60 65 70 75 80 85 300 700 500 600 900 1,000 1,100 400 1,300 1,200 800 5,300 0 Germany SOUTH AFRICA Spain Private healthcare spending per capita (US$) Taiwan South Korea GDP per capita (US$ ‘000) Canada Japan United States Singapore China France Switzerland BRAZIL Australia Asia NA EU LatAm & Africa AU South Africa and Brazil have lower/comparable income but higher spending than China China Tier 1 1 Source: EIU, Euromonitor, BMI, Hong Kong Food and Health Bureau; A s of 2017 1. Tier 1 cities include Beijing, Shanghai, Guangzhou and Shenzhen. Private healthcare spending per capita assumed to mirror pri vate vs. public hospital revenue trends in China Countries and Regions

39 39 (2,300) ( RMB bn ) Top Trends in the Chinese Public and Private Hospital Sectors Source: Frost & Sullivan, PwC survey on urban middle class Chinese, National Health and Family Planning Commission, Company A nal ysis; As of 2016 SCARCITY AND UNEVEN DISTRIBUTION OF QUALITY MEDICAL RESOURCES IMMENSE PRESSURE ON PUBLIC HEALTHCARE SYSTEM 3+ hours Average time to visit a physician 90+% Average bed occupancy rate in public hospitals <5 mins Actual time spent in a physician consultation Class III: 2,232 (8%) Class II: 7,944 (27%) Class I: 9,282 (32%) Unrated: 9,682 (33%) # of Annual Hospital Outpatient Visits (mm) Class III: 1,628 (50%) Class II: 1,217 (37%) Class I: 218 (7%) Unrated: 207 (6%) # of Hospitals in China EXPECTED DEFICIT OF THE BASIC SOCIAL MEDICAL INSURANCE 2020E 2026E Deficit is expected to arise TOP TRENDS IN THE PRIVATE HOSPITAL SECTOR Private hospitals in China are facing challenges that present unique opportunities for a branded comprehensive player like UFH Lack of a Comprehensive Service Provider − Most private hospital systems are focused on a single specialty / low acuity situations Highly Fragmented Market − Limited scaled players provide opportunity for a large, branded player like UFH Willingness to Pay − >80% of patients are willing to pay a premium to visit a private hospital − Huge under supply of premium hospitals Brand Recognition and Reputational Issues − Scarcity value as few players have both a strong brand and reputation TOP TRENDS IN THE PUBLIC HOSPITAL SECTOR

40 40 25 40 64 103 314 106 139 183 240 483 131 179 247 343 797 90 109 155 212 303 7% 8% 11% 15% 22% 0 200 400 2000A 2010A 2020E 2030E 2040E Population Aged 65+ as % of Total Population Aging Population and Commercial Healthcare Insurance are Key Long - Term Growth Drivers of Healthcare Services 15% 28% CAGR 18 - 23 (%) 15% 25% CAGR 12 - 18 (%) RAPIDLY AGING POPULATION China population aged 65+ (Persons mm) HIGH - END PHI 2 ADDRESSABLE POPULATION ('000) COMMERCIAL HEALTH INSURANCE GWP 1 (US$ bn) 2 China Population Aged 65+ (Persons mm) 2012A 2014A 2016A 2018E 2023E Source: United Nations, China Insurance Yearbook, CIRC, McKinsey Global Institute, Company Analysis 1. Include all local and foreign players. Health insurance GWP (gross written premium) includes premium sold by both life and P& C insurers 2. PHI = Private Health Insurance 3. Exchange rate at USD:RMB = 1.00 : 6.80 Tier 1 cities Tier 2 cities 2023E 2012A 13 2016A 2014A 2018E 23 59 94 294
41 41 APPENDIX B – ADDITIONAL MATERIALS

42 42 Summary Shareholder Structure 1,2 of NFH 7% 11% 7% 4% 10% 61% New Frontier Group Other Public Investors Vivo Capital Capital Group Fosun UFH Management Free Float (%) ~90 Note : 1 . 131 mm s hares outstanding before accounting for roll - over NFH ESOP from UFH management and SPAC warrants (currently out - of - the - money) . 2 . As a result of the execution of the Fosun Director Nomination Agreement, Vivo Director Nomination Agreement, Irrevocable Proxies, and Director Support Letter Agreements, each Reporting Person may be deemed to be members of a “group” within the meaning of Section 13 (d)( 3 ) of the Exchange Act with NFPH, Vivo LP and Fosun with respect to the election of directors of the Issuer as described in Item 4 of this Amendment No . 1 . As a result, the group may be deemed to have acquired beneficial ownership of all the Ordinary Shares beneficially owned by each member of the “group” and each Reporting Person may be deemed to beneficially own all of the Ordinary Shares beneficially owned by the group . As such, the group may be deemed to beneficially own in the aggregate 81 , 096 , 625 Ordinary Shares, which represents approximately 55 . 5 % of the total outstanding Ordinary Shares .
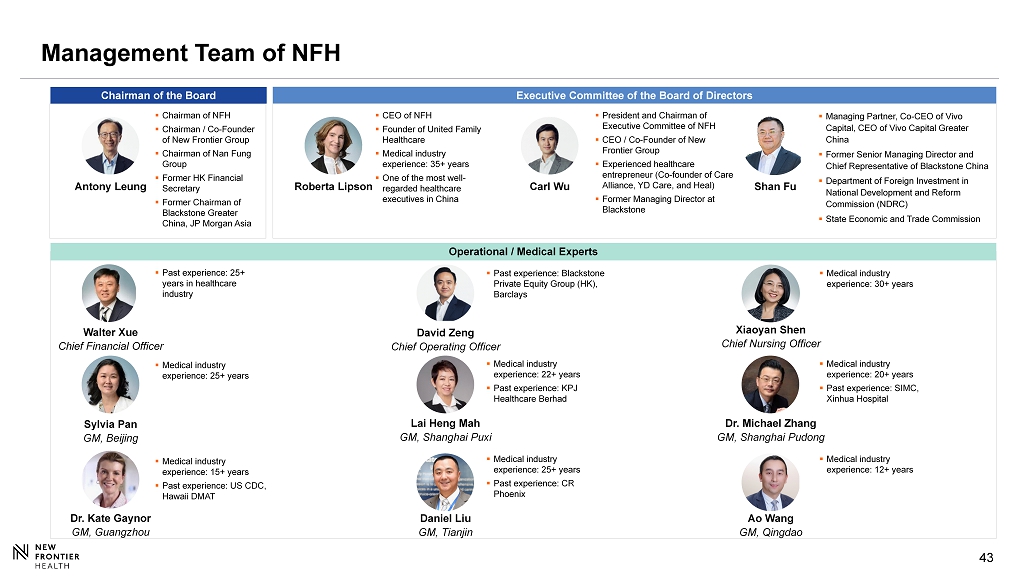
43 43 Management Team of NFH Roberta Lipson Antony Leung Carl Wu Executive Committee of the Board of Directors ▪ CEO of NFH ▪ Founder of United Family Healthcare ▪ Medical industry experience: 35+ years ▪ One of the most well - regarded healthcare executives in China ▪ Chairman of NFH ▪ Chairman / Co - Founder of New Frontier Group ▪ Chairman of Nan Fung Group ▪ Former HK Financial Secretary ▪ Former Chairman of Blackstone Greater China, JP Morgan Asia ▪ President and C hairman of Executive Committee of NFH ▪ CEO / Co - Founder of New Frontier Group ▪ Experienced healthcare entrepreneur (Co - founder of Care Alliance, YD Care, and Heal) ▪ Former Managing Director at Blackstone Operational / Medical Experts Sylvia Pan GM, Beijing ▪ Medical industry experience: 25+ years ▪ Medical industry experience: 15+ years ▪ Past experience: US CDC, Hawaii DMAT Dr. Kate Gaynor GM, Guangzhou ▪ Past experience: 25+ years in healthcare industry Walter Xue Chief Financial Officer David Zeng Chief Operating Officer ▪ Past experience: Blackstone Private Equity Group (HK), Barclays ▪ Medical industry experience: 22+ years ▪ Past experience: KPJ Healthcare Berhad Lai Heng Mah GM, Shanghai Puxi Daniel Liu GM, Tianjin ▪ Medical industry experience: 25+ years ▪ Past experience: CR Phoenix ▪ Medical industry experience: 20+ years ▪ Past experience: SIMC, Xinhua Hospital Dr. Michael Zhang GM, Shanghai Pudong Xiaoyan Shen Chief Nursing Officer ▪ Medical industry experience: 30+ years ▪ Medical industry experience: 12+ years Ao Wang GM, Qingdao Chairman of the Board Shan Fu ▪ Managing Partner, Co - CEO of Vivo Capital, CEO of Vivo Capital Greater China ▪ Former Senior Managing Director and Chief Representative of Blackstone China ▪ Department of Foreign Investment in National Development and Reform Commission (NDRC) ▪ State Economic and Trade Commission

44 44 Experienced Board of Directors Independent Non - executive Directors Antony Leung Carl Wu Non - Independent Directors ▪ COO of NFH ▪ Managing Director of New Frontier Group ▪ Blackstone Private Equity Group (HK) ▪ Barclays David Zeng ▪ Chairman of NFH ▪ Chairman / Co - Founder of New Frontier Group ▪ Former Financial Secretary of Hong Kong ▪ Nan Fung Group Chairman and CEO ▪ Blackstone Chairman of Greater China ▪ J.P. Morgan Chairman of Asia ▪ Citibank Head of China & Hong Kong and Private Bank for Asia ▪ President and Chairman of Executive Committee of NFH ▪ CEO / Co - Founder of New Frontier Group ▪ Experienced healthcare entrepreneur (Co - founder of Care Alliance, YD Care, and Heal) ▪ Founding member of Blackstone Asia Pacific and Blackstone China Roberta Lipson Shan Fu Qiyu Chen ▪ CEO of NFH ▪ Founder of UFH ▪ Medical industry experience: 35+ years ▪ One of the most well regarded healthcare executives in China ▪ Managing Partner, Co - CEO and CEO of Vivo Capital in Greater China ▪ Senior Managing Director and Chief Representative of Blackstone ▪ Department of Foreign Investment in National Development and Reform Commission (NDRC) ▪ State Economic and Trade Commission ▪ Executive Director and the Co - CEO of Fosun International ▪ Executive Director and the Chairman of Fosun Pharma ▪ Non - executive director and Vice Chairman of Sinopharm Group Dr. C H Leong Frederick Ma ▪ Senior Advisor of New Frontier Group ▪ Hong Kong University Council Chairman ▪ Non - official member of the Executive Council of HKSAR ▪ Hong Kong Hospital Authority Chairman ▪ Member of Hong Kong Legislative Council ▪ Senior Advisor of New Frontier Group ▪ Independent Non - Executive Director of Guangshen Railway ▪ Non - executive Chairman of MTR ▪ Secretary for Commerce & Economic Development of HKSAR ▪ Secretary for Financial Services and the Treasury for HKSAR ▪ CFO of PCCW ▪ CEO of the Samling Group ▪ Former CEO of Deloitte China ▪ Former Executive Committee of Deloitte Touche Tohmatsu Limited ▪ Independent Non - Executive Director of BC Technology Group ▪ Over 30 years of experience in financial advisory and corporate finance in Greater China Lawrence Chia

45 Strong Cash Flow and Balance Sheet Notes: 1. Due to IFRS 16 adoption, capital lease payments is categorized as cash used for financing activities. 2. Maintenance capex is defined as all capex spent for existing operations of the facilities. 3. Expansionary capex is defined as capex spent for building new facilities including the new site of Shanghai Puxi Hospital, Sh ang hai Pudong Hospital, Guangzhou Hospital and Beijing Datun Hospital. (RMB million) 1Q20 Operating Cash Flow & Free Cash Flow: Cash Flow Generated from Operating Activities 387 Less: Release of Restricted Cash (383) Less: Capital Lease Payments 1 (72) Add: Interest Expense Paid 61 Add: One - off Transaction Expense Paid 18 Adjusted Operating Cash Flow 10 Less: Maintenance CAPEX (7) Free Cash Flow 3 CAPEX: Maintenance CAPEX 2 7 Expansionary CAPEX 3 108 Total CAPEX 115

46 46 Reconciliation of Non - IFRS Financial Measures Notes: 1. Monitoring fee payable to TPG and Fosun is not related to business operation and is discontinued from 2020 onwards . 2. The adjustments include ( i ) giving a pro forma effect to annual rent reimbursement of approximately RMB15 million which took effect in November 2019 as if such reimbursement commenced on January 1, 2019, (ii) adding back RMB 3.7 million for additional rental expenses incurred prior to the PXU relocation due to space constraints, and (iii) RMB 3.7 million of on goi ng net savings on fees payable to our business partner for this property in accordance with the rental reimbursement. For the quarter ended 31 December For the year ended 31 December For the quarter ended 30 June 2019 2019 2019 2020 Net loss (223) (430) (75) (79) Less: Finance income (1) (2) (1) (1) Add: Finance costs 54 157 34 66 Add: Other losses (gains) (13) 9 14 - Less: Gain on disposal of an associate - (3) Less: Other income, net 13 6 (1) (6) Add: Income tax expense/(benefit) 7 63 23 7 Operating loss (163) (198) (6) (16) Add: Share-based compensation 2 34 19 1 Add: Depreciation and amortization 88 342 85 106 Add: Discontinued monitoring fee payable to Fosun Pharma and TPG 1 1 4 1 - Add: One-off transaction costs 147 160 4 1 Add: Relocation costs of New Puxi Hospital 3 6 Add: Severance costs 11 Adjusted EBITDA 79 349 103 103 Less: Lease expense adjustments as a result of IFRS 16 adoption (53) (205) (50) (49) Adjusted EBITDA (before IFRS 16 adoption) 26 144 53 54 Add: PXU Pro-forma Adjustments 2 2 19 Pro-forma Adjusted EBITDA 28 163 53 54 (in RMB million)
Serious News for Serious Traders! Try StreetInsider.com Premium Free!
You May Also Be Interested In
- Quilt Raises $33M to Launch the Smartest Way to Heat and Cool Your Home
- DR. BARBARA SHARIEF RECEIVES FLORIDA EDUCATION ASSOCIATION ENDORSEMENT
- Square One Finds Bidets Are Responsible for Over $20,000 in Water Damage Per Claim
Create E-mail Alert Related Categories
SEC FilingsSign up for StreetInsider Free!
Receive full access to all new and archived articles, unlimited portfolio tracking, e-mail alerts, custom newswires and RSS feeds - and more!
