Form 8-K CTS CORP For: Jul 31

Investor Presentation July 2020

Forward Looking Statements This presentation contains statements that are, or may be deemed to be, forward-looking statements within the meaning of the Private Securities Litigation Reform Act of 1995. These forward-looking statements include, but are not limited to, any financial or other guidance, statements that reflect our current expectations concerning future results and events, and any other statements that are not based solely on historical fact. Forward-looking statements are based on management's expectations, certain assumptions and currently available information. Readers are cautioned not to place undue reliance on these forward-looking statements, which speak only as of the date hereof and are based on various assumptions as to future events, the occurrence of which necessarily are subject to uncertainties. These forward-looking statements are made subject to certain risks, uncertainties and other factors, which could cause our actual results, performance or achievements to differ materially from those presented in the forward-looking statements. Examples of factors that may affect future operating results and financial condition include, but are not limited to: changes in the economy generally and in respect to the businesses in which CTS operates; unanticipated issues in integrating acquisitions; the results of actions to reposition our businesses; rapid technological change; general market conditions in the automotive, communications, and computer industries, as well as conditions in the industrial, defense and aerospace, and medical markets; reliance on key customers; unanticipated natural disasters, pandemics, or other events; the ability to protect our intellectual property; pricing pressures and demand for our products; unanticipated developments that could occur with respect to contingencies such as litigation and environmental matters as well as any product liability claims; and risks associated with our international operations, including trade and tariff barriers, exchange rates and political and geopolitical risks. Many of these, and other, risks and uncertainties are discussed in further detail in Item 1A. of CTS’ Annual Report on Form 10-K. We undertake no obligation to publicly update our forward-looking statements to reflect new information or events or circumstances that arise after the date hereof, including market or industry changes. The information provided in this presentation includes certain non-GAAP financial measures. These non-GAAP financial measures should not be considered in isolation or a substitute for the comparable GAAP financial measures. A reconciliation of these non-GAAP financial measures to the most directly comparable GAAP financial measures is included in the Appendix of this presentation. 2
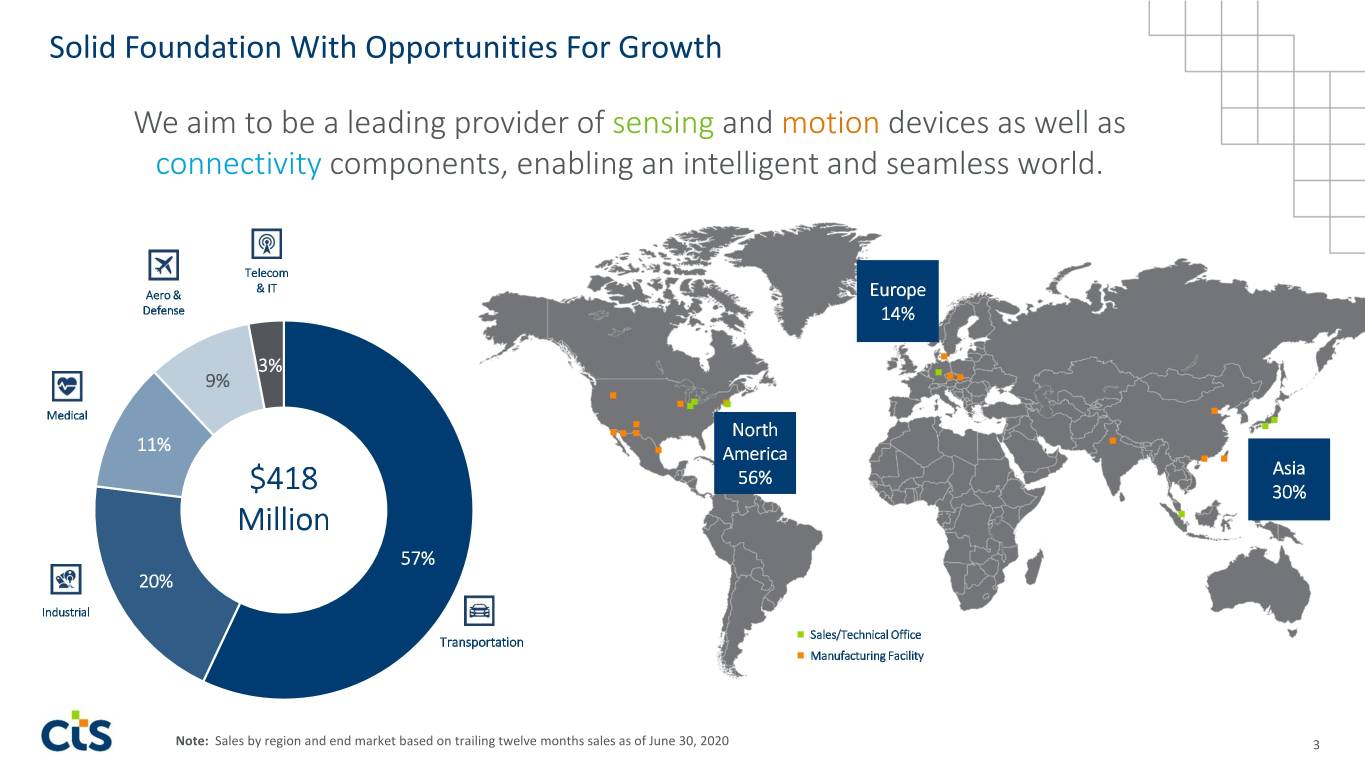
Solid Foundation With Opportunities For Growth We aim to be a leading provider of sensing and motion devices as well as connectivity components, enabling an intelligent and seamless world. Telecom & IT Aero & Europe Defense 14% 3% 9% Medical North 11% America 56% Asia $418 30% Million 57% 20% Industrial Sales/Technical Office Transportation Manufacturing Facility Note: Sales by region and end market based on trailing twelve months sales as of June 30, 2020 3
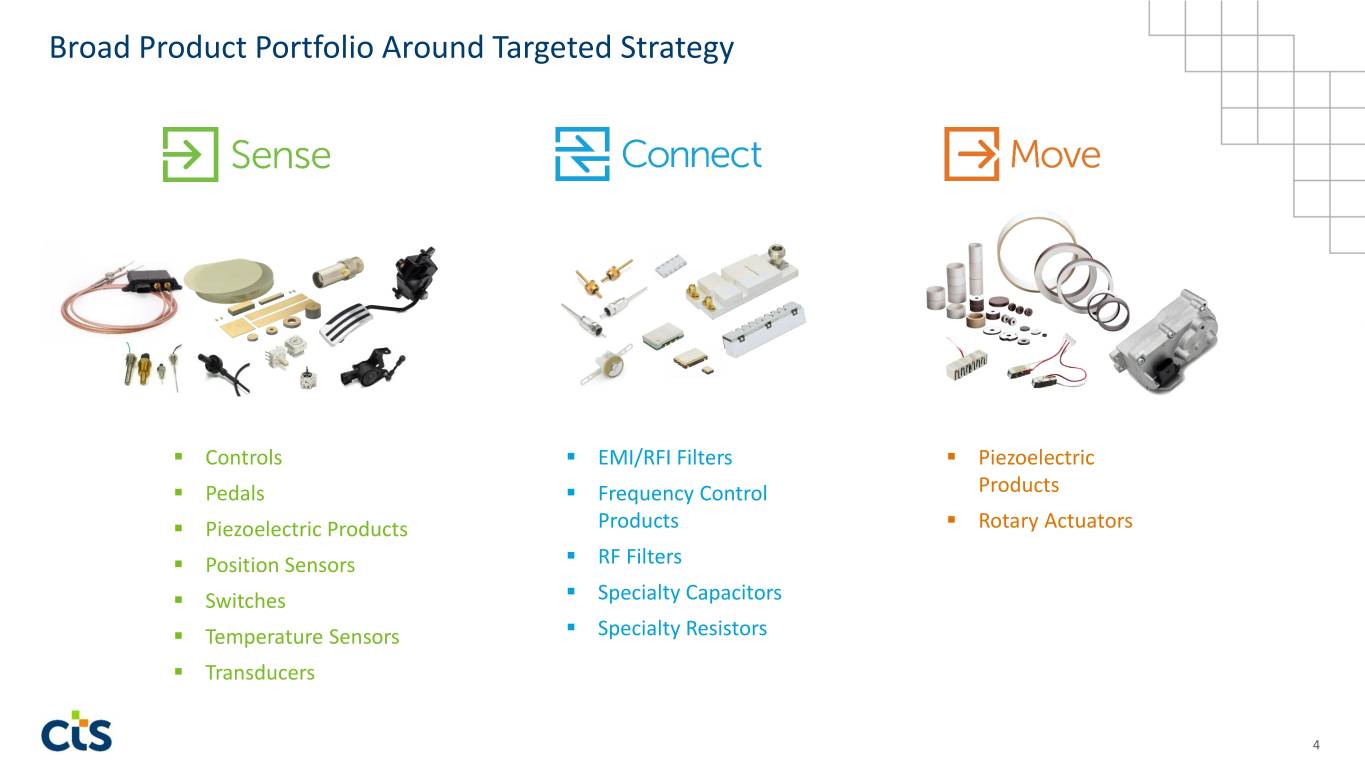
Broad Product Portfolio Around Targeted Strategy ▪ Controls ▪ EMI/RFI Filters ▪ Piezoelectric ▪ Pedals ▪ Frequency Control Products ▪ Piezoelectric Products Products ▪ Rotary Actuators ▪ Position Sensors ▪ RF Filters ▪ Switches ▪ Specialty Capacitors ▪ Temperature Sensors ▪ Specialty Resistors ▪ Transducers 4

Transportation Market Sectors Electric/Hybrid Commercial Light Vehicles Motorcycles Relevant Products Vehicles Vehicles/Off-Road Key Customers ▪ Accelerator Pedals ▪ Position Sensors ▪ Temperature Sensors ▪ DPF RF Sensors ▪ Smart Actuator 5
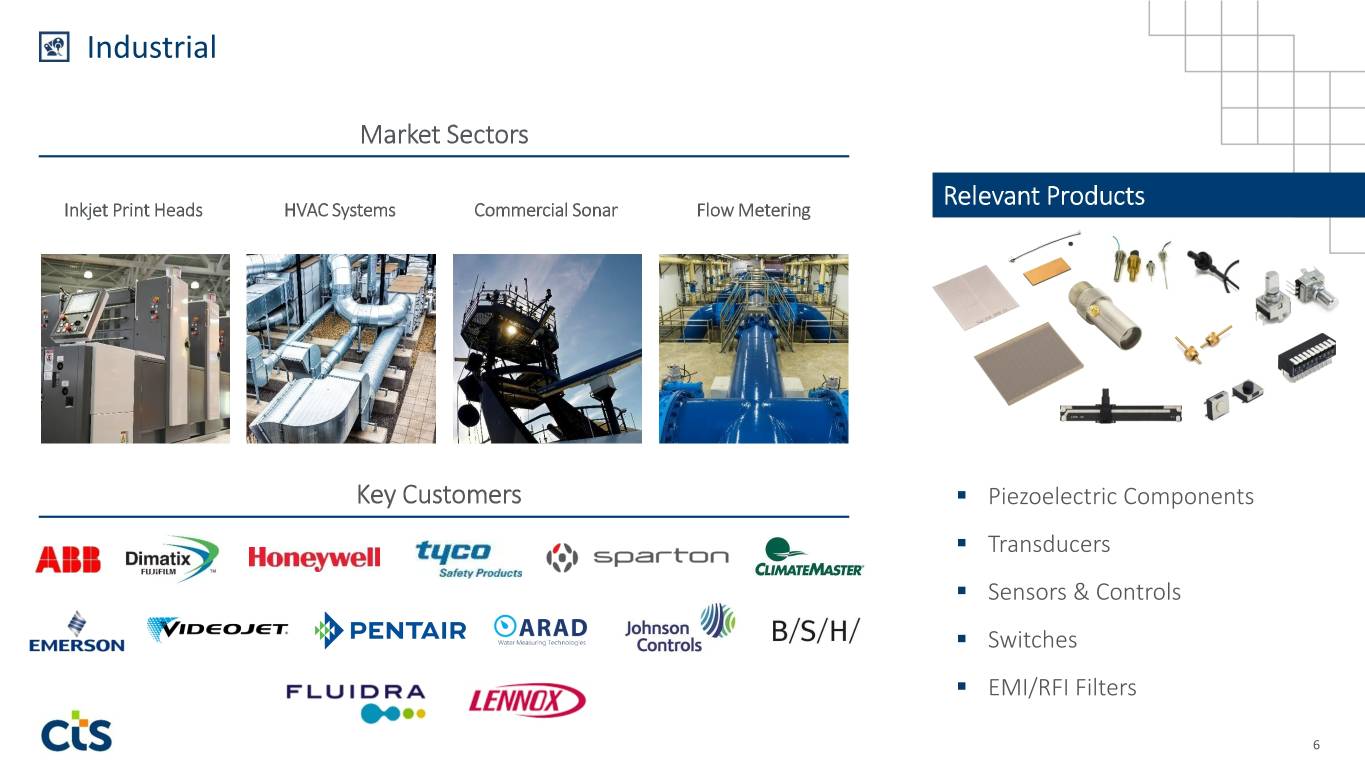
Industrial Market Sectors Inkjet Print Heads HVAC Systems Commercial Sonar Flow Metering Relevant Products Key Customers ▪ Piezoelectric Components ▪ Transducers ▪ Sensors & Controls ▪ Switches ▪ EMI/RFI Filters 6
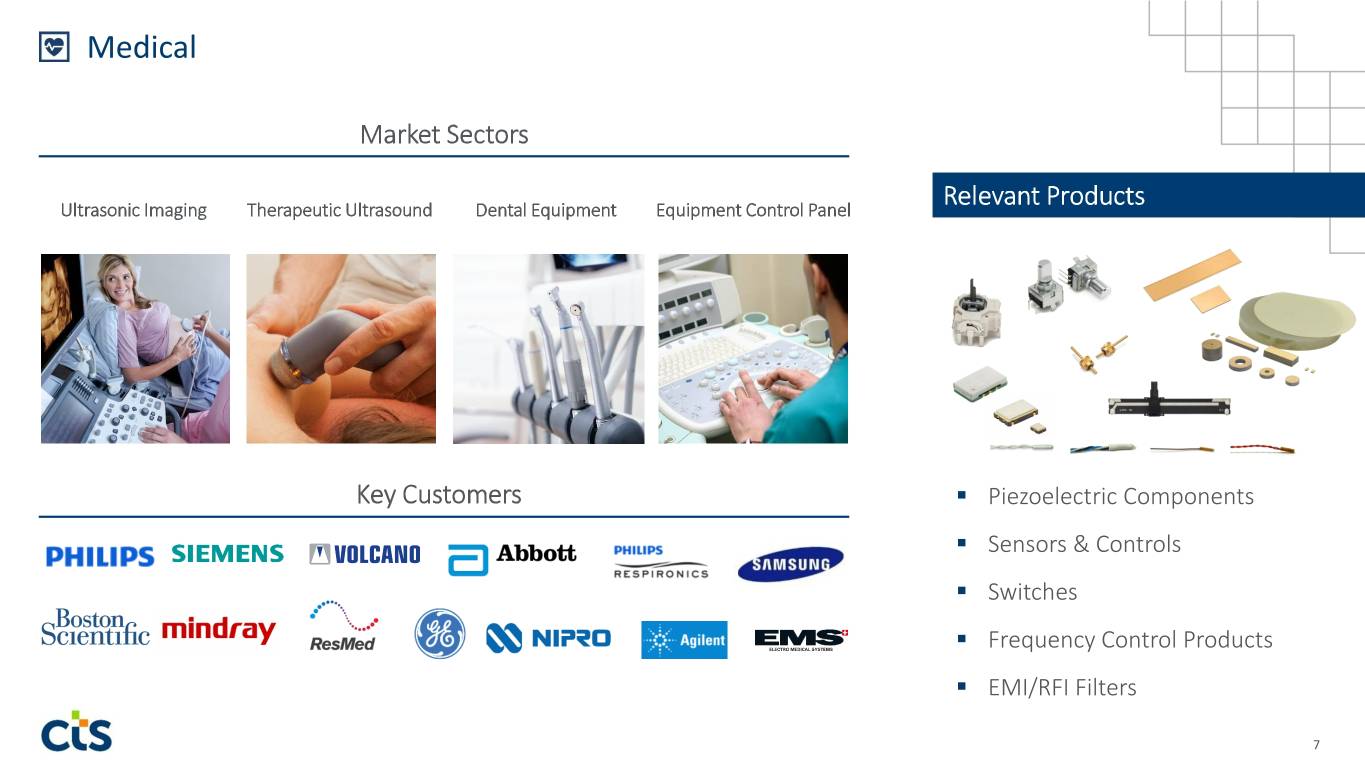
Medical Market Sectors Ultrasonic Imaging Therapeutic Ultrasound Dental Equipment Equipment Control Panel Relevant Products Key Customers ▪ Piezoelectric Components ▪ Sensors & Controls ▪ Switches ▪ Frequency Control Products ▪ EMI/RFI Filters 7

Aero & Defense Market Sectors Torpedo/Missile Airplane Sonobuoys Hydrophones Relevant Products Control Communications Key Customers ▪ Piezoelectric Components ▪ Transducers ▪ RF Filters ▪ Temperature Sensors ▪ Frequency Control Products 8

Telecom & IT Market Sectors Macro Cell Small Cell Satellite Wireline/ Relevant Products Base Stations Base Stations Communication Network Switching Key Customers ▪ Piezoelectric Components ▪ RF Filters ▪ EMI/RFI Filters ▪ Frequency Control Products ▪ Temperature Sensors 9

End Markets Growing Mid-Single Digits Transportation Industrial Medical Aero & Defense Telecom & IT 9% 3% 11% 57% 20% Goal LV 30-50% 20-30% 10-20% 5-15% 10-20% CV 10-20% SAM $3.4B $2.2B $0.4B $0.9B $1.9B ▪ Booked Business, Share Gains ▪ 3D and textile printing ▪ Medical 3D/4D ultrasound ▪ Hydrophones for sonar ▪ 5G infrastructure build out – applications massive MIMO and small cell ▪ Actuators – Asia/EU customers ▪ Applications in flow, level and ▪ HMI control for medical devices deployment temperature sensing ▪ Military communication ▪ RF Sensing for particulate filters ▪ Wireless pacing and ultrasound- ▪ High-speed wireline networks ▪ Up-integration into sensors based drug delivery ▪ Up-integration into sensors ▪ Increased Sensor Content and transducers and transducers ▪ Advanced fingerprint security, ▪ Increased temperature sensor haptics for mobile device ▪ Industrial automation and IOT needs ▪ Penetration into European applications defense market ▪ Dental and therapeutic ultrasound applications ▪ Textured piezo material Enhancing Sales And Product Management For Organic Growth 10

Strategic M&A Approach Expand Enhance Broaden Strengthen Product Technology Geographic Customer Range Portfolio Reach Relationships Case Study: Successfully Built Broad Piezoelectric Ceramic Growth Platform Pre 2016 2016 2017 2018+ Bulk Technology Single Crystal Technology Tape Cast Technology Robust Double-Digit Single-Digit Growth Double-Digit Growth Single-Digit Growth Growth Platform SAM : $714M SAM : $968M $1.7B (>2x SAM ) 11

QTI Sensing Solutions Acquisition Company Overview Acquisition Rationale ▪ Founded in 1977, facilities in Boise, ID and Tecate, Mexico ▪ Provides CTS a new core temperature sensing technology ▪ QTI Sensing Solutions is a leading designer and manufacturer ▪ Increases presence in growing industrial, aerospace, of high quality, high performance temperature sensors defense and medical end markets ▪ QTI has a broad product portfolio to measure temperature in ▪ Expands OEM customer base and enables cross-selling gas, liquid or solid mass to ensure equipment performance and reliability ▪ Potential to build a temperature sensing platform ▪ Portfolio includes thermistor and RTD based products with ▪ Global market opportunity of >$1.1 billion temperature sensing capabilities currently range from -200C to +450C Products Applications Customers HVAC & Aerospace & Medical & Precision Refrigeration Defense Instrumentation Pool & Spa Food Service Boilers & Water Heating 12
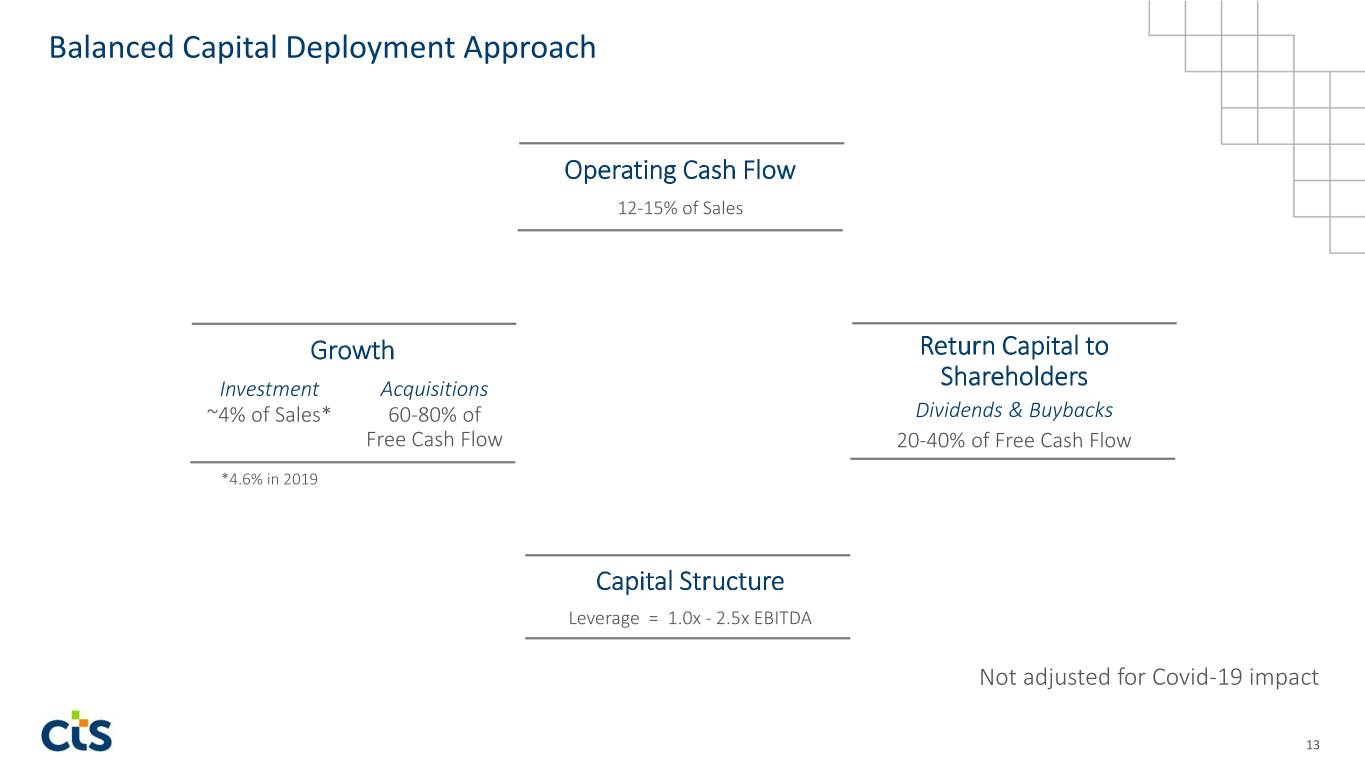
Balanced Capital Deployment Approach Operating Cash Flow 12-15% of Sales Growth Return Capital to Investment Acquisitions Shareholders ~4% of Sales* 60-80% of Dividends & Buybacks Free Cash Flow 20-40% of Free Cash Flow *4.6% in 2019 Capital Structure Leverage = 1.0x - 2.5x EBITDA Not adjusted for Covid-19 impact 13

Financial Performance Trend Sales Adjusted Earnings Per Share ($ Millions) $470 $469 $1.53 $423 $1.45 $1.23 $187 $0.35 2017 2018 2019 Q2 YTD 2020 2017 2018 2019 Q2 YTD 2020 Due to ongoing market uncertainties, management has withdrawn its guidance for 2020 14

Financial Framework Long-Term 2012 2019 Target Range Gross Margin 30.0% 33.6% 34-37% SG&A Expense 20.7% 15.0% 13-15% R&D Expense 6.9% 5.5% 5-7% CapEx 2.6% 4.6% ~4% Not adjusted for Covid-19 impact Targeting 10% Annual Growth (Organic + Inorganic) 15

Adjusting In Response To Impact Of COVID-19 Actions Adequate Liquidity ▪ Prioritize employee safety at operating sites ▪ Strong cash & debt availability ($ Millions) ▪ Strive to serve customer needs $300 Total Facility ▪ Cost actions to decrease cash burn ‐ Temporary pay reductions, furloughs ‐ Temporary suspension of 401K match $146 ‐ Tightening on all discretionary spend ‐ Board cash compensation reduction $141 Borrowed ▪ Restructuring plan ‐ Consolidate sites, optimize operating costs Cash Debt ‐ Cost – $10-$12 million ‐ Savings – $0.22-$0.26/year in EPS by 2H 2022 ▪ Borrowed $50 million in Q1 2020 to build ▪ Carefully manage inventory, receivables cash buffer ▪ ▪ Pursue and win revenue opportunities Well within debt covenant limits ▪ ▪ Continue strengthening M&A pipeline Continued covenant compliance expected 16

Appendix 17

CTS Core Values 18
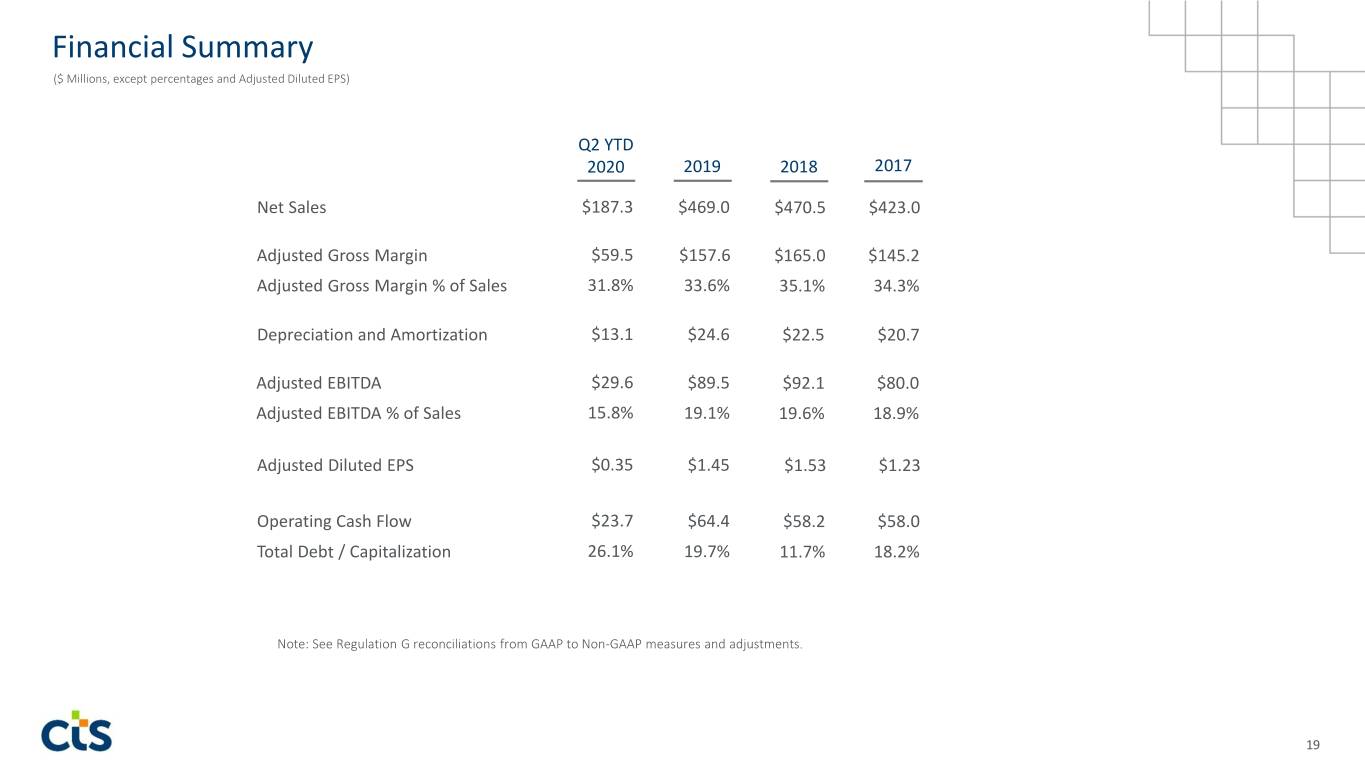
Financial Summary ($ Millions, except percentages and Adjusted Diluted EPS) Q2 YTD 2020 2019 2018 2017 Net Sales $187.3 $469.0 $470.5 $423.0 Adjusted Gross Margin $59.5 $157.6 $165.0 $145.2 Adjusted Gross Margin % of Sales 31.8% 33.6% 35.1% 34.3% Depreciation and Amortization $13.1 $24.6 $22.5 $20.7 Adjusted EBITDA $29.6 $89.5 $92.1 $80.0 Adjusted EBITDA % of Sales 15.8% 19.1% 19.6% 18.9% Adjusted Diluted EPS $0.35 $1.45 $1.53 $1.23 Operating Cash Flow $23.7 $64.4 $58.2 $58.0 Total Debt / Capitalization 26.1% 19.7% 11.7% 18.2% Note: See Regulation G reconciliations from GAAP to Non-GAAP measures and adjustments. 19
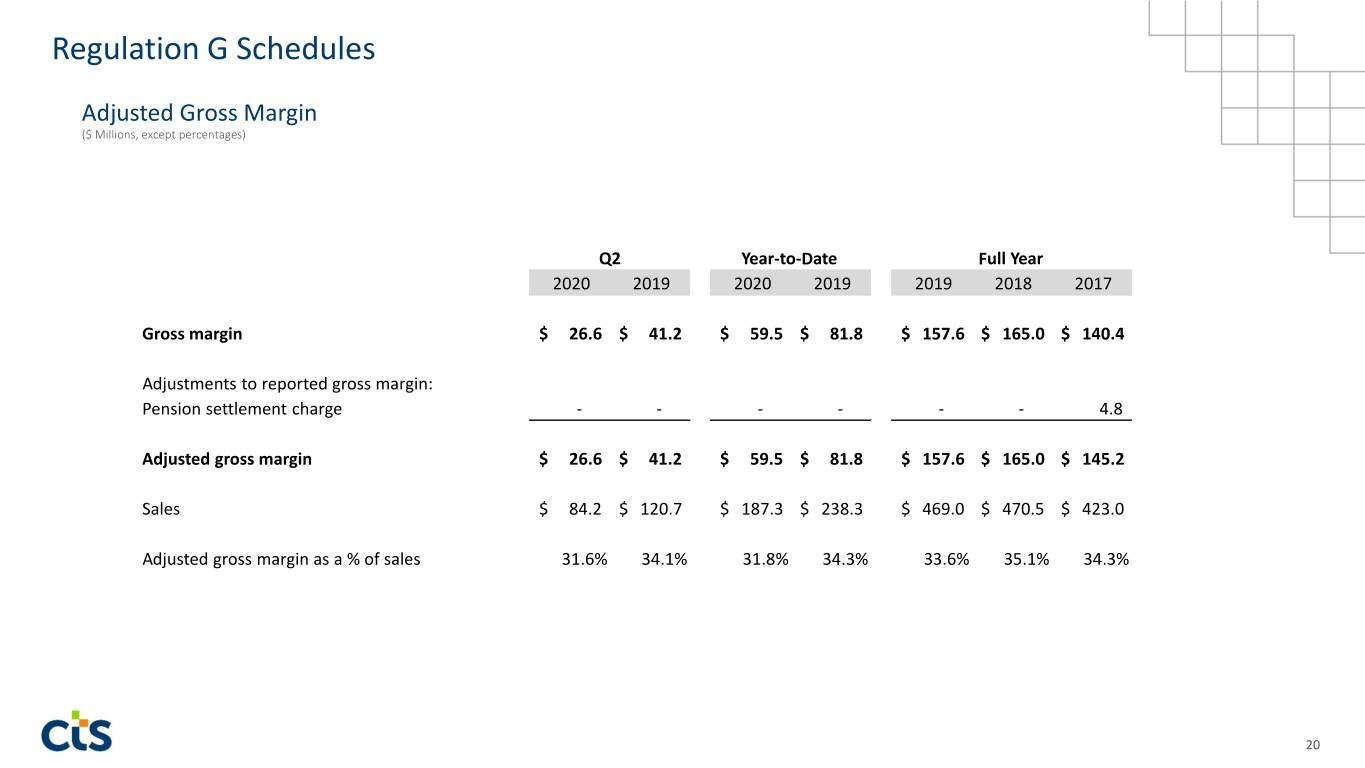
Regulation G Schedules Adjusted Gross Margin ($ Millions, except percentages) Q2 Year-to-Date Full Year 2020 2019 2020 2019 2019 2018 2017 Gross margin $ 26.6 $ 41.2 $ 59.5 $ 81.8 $ 157.6 $ 165.0 $ 140.4 Adjustments to reported gross margin: Pension settlement charge - - - - - - 4.8 Adjusted gross margin $ 26.6 $ 41.2 $ 59.5 $ 81.8 $ 157.6 $ 165.0 $ 145.2 Sales $ 84.2 $ 120.7 $ 187.3 $ 238.3 $ 469.0 $ 470.5 $ 423.0 Adjusted gross margin as a % of sales 31.6% 34.1% 31.8% 34.3% 33.6% 35.1% 34.3% 20

Regulation G Schedules Adjusted EBITDA Q2 Year-to-Date Full Year ($ Millions, except percentages) 2020 2019 2020 2019 2019 2018 2017 Net earnings $ 4.9 $ 11.9 $ 8.7 $ 23.4 $ 36.1 $ 46.5 $ 14.4 Depreciation and amortization expense 6.6 6.0 13.1 11.9 24.6 22.5 20.7 Interest expense 0.9 0.5 1.8 0.9 2.6 2.1 3.3 Tax expense 1.0 4.0 3.2 6.9 14.1 11.6 25.8 EBITDA 13.4 22.4 26.8 43.1 77.5 82.7 64.2 Adjustments to EBITDA: Restructuring charges 0.1 0.9 0.4 3.0 6.9 4.6 4.1 Loss on sale of facilities, net of expenses - - - - - - 0.7 Environmental charges 0.8 - 0.8 - 2.3 - - Legal settlement - - - - (0.5) - - Transaction costs - - - - 0.7 - 0.3 Lease termination charge - - - - - - 0.1 Costs of tax improvement initiatives - - - - 0.1 1.2 0.2 Pension settlement charge - - - - - 1.0 13.4 Non-cash pension expense 0.6 0.2 1.2 0.4 0.8 - - Foreign currency (gain) loss (0.9) 0.8 0.4 0.4 1.8 2.6 (3.0) Total adjustments to EBITDA 0.7 1.9 2.8 3.8 12.0 9.4 15.8 Adjusted EBITDA $ 14.1 $ 24.3 $ 29.6 $ 46.9 $ 89.5 $ 92.1 $ 80.0 Sales $ 84.2 $ 120.7 $ 187.3 $ 238.3 $ 469.0 $ 470.5 $ 423.0 Adjusted EBITDA as a % of sales 16.7% 20.2% 15.8% 19.7% 19.1% 19.6% 18.9% 21
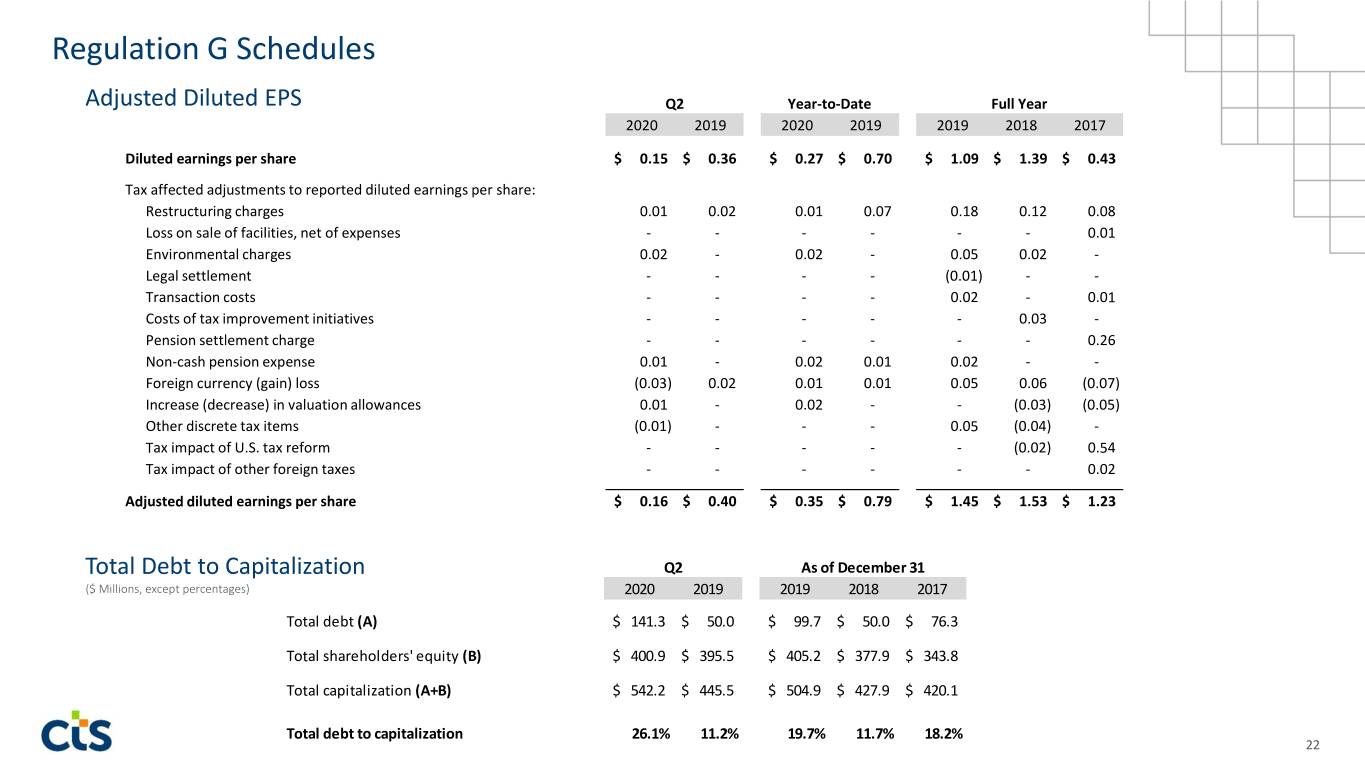
Regulation G Schedules Adjusted Diluted EPS Q2 Year-to-Date Full Year 2020 2019 2020 2019 2019 2018 2017 Diluted earnings per share $ 0.15 $ 0.36 $ 0.27 $ 0.70 $ 1.09 $ 1.39 $ 0.43 Tax affected adjustments to reported diluted earnings per share: Restructuring charges 0.01 0.02 0.01 0.07 0.18 0.12 0.08 Loss on sale of facilities, net of expenses - - - - - - 0.01 Environmental charges 0.02 - 0.02 - 0.05 0.02 - Legal settlement - - - - (0.01) - - Transaction costs - - - - 0.02 - 0.01 Costs of tax improvement initiatives - - - - - 0.03 - Pension settlement charge - - - - - - 0.26 Non-cash pension expense 0.01 - 0.02 0.01 0.02 - - Foreign currency (gain) loss (0.03) 0.02 0.01 0.01 0.05 0.06 (0.07) Increase (decrease) in valuation allowances 0.01 - 0.02 - - (0.03) (0.05) Other discrete tax items (0.01) - - - 0.05 (0.04) - Tax impact of U.S. tax reform - - - - - (0.02) 0.54 Tax impact of other foreign taxes - - - - - - 0.02 Adjusted diluted earnings per share $ 0.16 $ 0.40 $ 0.35 $ 0.79 $ 1.45 $ 1.53 $ 1.23 Total Debt to Capitalization Q2 As of December 31 ($ Millions, except percentages) 2020 2019 2019 2018 2017 Total debt (A) $ 141.3 $ 50.0 $ 99.7 $ 50.0 $ 76.3 Total shareholders' equity (B) $ 400.9 $ 395.5 $ 405.2 $ 377.9 $ 343.8 Total capitalization (A+B) $ 542.2 $ 445.5 $ 504.9 $ 427.9 $ 420.1 Total debt to capitalization 26.1% 11.2% 19.7% 11.7% 18.2% 22
Serious News for Serious Traders! Try StreetInsider.com Premium Free!
You May Also Be Interested In
- CTS Corporation Announces Date for First Quarter 2024 Earnings Release and Conference Call
- Four ONDA Partners Earn Placement on D Magazine’s Best Lawyers List
- Port Houston Regular Commission Meeting
Create E-mail Alert Related Categories
SEC FilingsSign up for StreetInsider Free!
Receive full access to all new and archived articles, unlimited portfolio tracking, e-mail alerts, custom newswires and RSS feeds - and more!


 Tweet
Tweet Share
Share