

Form 424B3 New Frontier Health Corp
 Tweet
Tweet Share
Share| Filed pursuant to rule 424(b)(3) | |
| Registration No. 333-236079 |
Prospectus Supplement No. 1
(to Prospectus dated April 8, 2020)
NEW FRONTIER HEALTH CORPORATION
Primary Offering of
26,875,000 Ordinary Shares
Secondary Offering of
127,341,048 Ordinary Shares
12,500,000 Warrants
This Prospectus Supplement No. 1 supplements our Prospectus dated April 8, 2020 (the “Prospectus”) that forms a part of our Registration Statement on Form F-1 (File No. 333-236079). This Prospectus Supplement No. 1 is being filed to update and supplement certain information contained in the Prospectus with the information contained in our Current Report on Form 6-K, filed with the U.S. Securities and Exchange Commission on May 27, 2020 (the “Current Report”). Accordingly, we have attached the Current Report to this Prospectus Supplement.
This Prospectus Supplement No. 1 should be read in conjunction with the Prospectus, which is required to be delivered with this Prospectus Supplement. If there is any inconsistency between the information in the Prospectus and this Prospectus Supplement, you should rely on the information in this Prospectus Supplement.
These securities involve a high degree of risk. You should carefully consider the risks identified under the caption “Risk Factors” beginning on Page 12 of the Prospectus and under similar headings in any amendments or supplements to the Prospectus.
Neither the Securities and Exchange Commission nor any state securities commission has approved or disapproved of any of these securities or passed upon the adequacy or accuracy of the Prospectus or this Prospectus Supplement. Any representation to the contrary is a criminal offense.
The date of this Prospectus Supplement is May 27, 2020
FORM 6-K
SECURITIES AND EXCHANGE COMMISSION
Washington, D.C. 20549
Report of Foreign Private Issuer
Pursuant to Rule 13a-16 or 15d-16 of
the Securities Exchange Act of 1934
For the month of May, 2020
Commission File Number: 001-38562
NEW FRONTIER
HEALTH CORPORATION
(Translation of Registrant’s Name into English)
10 Jiuxianqiao Road,
Hengtong Business Park
B7 Building, 1/F
Chaoyang District, 100015,
Beijing, China
(Address of principal executive office)
Indicate by check mark whether the registrant
files or will file
annual reports under cover of Form 20-F or Form 40-F:
Form 20-F x Form 40-F ¨
Indicate by check mark if the registrant
is submitting the Form 6-K
in paper as permitted by Regulation S-T Rule 101(b)(1):
Yes ¨ No x
Indicate by check mark if the registrant
is submitting the Form 6-K
in paper as permitted by Regulation S-T Rule 101(b)(7):
Yes ¨ No x
INFORMATION CONTAINED IN THIS FORM 6-K REPORT
Attached as Exhibits 99.1 and 99.2 hereto are the earnings release issued by New Frontier Health Corporation (the “Company”) announcing its financial results for the first quarter ended March 31, 2020, and associated investor presentation, respectively.
EXHIBIT INDEX
| Exhibit | Description of Exhibit |
| 99.1 | Earnings Release. |
| 99.2 | Investor Presentation. |
SIGNATURES
Pursuant to the requirements of the Securities Exchange Act of 1934, as amended, the registrant has duly caused this report to be signed on its behalf by the undersigned, thereunto duly authorized.
| New Frontier Health Corporation | ||
| By: | /s/ Roberta Lipson | |
| Name: Roberta Lipson | ||
| Title: Chief Executive Officer | ||
Date: May 27, 2020
Exhibit 99.1
New Frontier Health Corporation Announces First Quarter 2020 Financial Results
New Frontier Health Corporation (“NFH” or the “Company”) (NYSE: NFH), operator of the premium healthcare services provider United Family Healthcare (“UFH"), today announced its unaudited financial results for the first quarter ended March 31, 2020.
Financial and Operating Highlights1
All comparisons made on a year-over-year (“yoy”) basis.2
For the Quarter Ended March 31, 2020:
| · | Revenue decreased by 25.4% to RMB430.9 million from RMB577.4 million due to decreased patient volume, as non-emergency services were postponed or cancelled a result of the COVID-19 pandemic. |
| · | Net loss increased to RMB168.6 million from RMB45.7 million, resulting mainly from the revenue decline and increased finance costs. |
| · | Adjusted EBITDA (before IFRS 16 adoption)3 decreased to RMB(67.7) million from RMB30.9 million primarily due to the impact on revenue from COVID-19. |
| · | Tier 1 Operating Assets: revenue decreased by 30.6% yoy to RMB301.9 million from RMB435.1 million, and Adjusted EBITDA (before IFRS 16 adoption) decreased by 79.3% to RMB22.9 million from RMB110.5 million, due to a decline in patient volume due to the COVID-19 pandemic. |
| · | Tier 2 Operating and Other Assets: revenue decreased by 26.9% yoy to RMB63.6 million from RMB87.0 million, and Adjusted EBITDA (before IFRS 16 adoption) decreased to RMB(11.5) million from RMB0.4 million, due to a decrease in patient volume as a result of the COVID-19 epidemic. |
| · | Expansion Assets: Revenue increased by 18.1% yoy to RMB65.4 million from RMB55.4 million due to the continued ramp-up of the new hospitals in Guangzhou and Pudong, Shanghai despite the impacts of the COVID-19 pandemic, and Adjusted EBITDA (before IFRS 16 adoption) increased by 2.2% yoy to RMB(42.6) million from RMB(43.6) million. |
| · | Outpatient visits decreased by 41.0% yoy to 89,463 from 151,551. |
| · | Inpatient admissions decreased by 20.7% yoy to 2,056 from 2,594. |
| · | Bed utilization rate* decreased to 32.7% from 36.1%. |
| · | ASP: outpatient ASP increased by 9% and inpatient ASP increased by 13% yoy as a result of an increase in the number of higher acuity services provided at our facilities, as less urgent services were postponed due to the pandemic. |
* Bed utilization is calculated based on the weighted average maximum bed capacity for the period.
Mr. Antony Leung, Chairman of NFH, commented, “The first quarter of 2020 was challenging for many due to the effects of the COVID-19 pandemic. Our business was negatively impacted as a result of a decrease in our patient volume, but we continued to make progress in pursuing our strategic growth. We have seen sustained week to week revenue recovery starting in the end of February and expect our business to return to normal soon. In the meantime, our team has been working tirelessly to manage our corporate overhead and cash flow in order to drive operational efficiencies in light of the challenging environment and, at the same time, to ensure that our frontline staff and facilities continue to have the resources to protect our patients and to pursue new growth initiatives. We remain optimistic about the progress and direction of the Company and that we will emerge from this pandemic as a stronger platform.”
Ms. Roberta Lipson, Chief Executive Officer of NFH and founder of UFH, added, “Despite the impact of COVID-19, we saw a new category of first time patients entering our network who we expect to retain as loyal customers. Some of these patients entered through our new on-line consultation platforms and subsequently converted to hospital appointments, and others came for treatment of serious diseases including stroke and cancer, having not achieved access at their traditional public providers. Despite the COVID-19 interruptions, we were also able to continue to execute on our long-term growth strategy by resuming construction work in our new Beijing hospital, and progressing in the design and licensing for our new Shenzhen hospital.
1 As a result of the adoption of International Financial Reporting Standard 16 (“IFRS 16”), effective January 1, 2019, related lease expenses have been reflected in depreciation and amortization expenses and finance costs. Segment revenue and Adjusted EBITDA (before IFRS 16 adoption) are presented for the purposes of comparison with prior years. The financial statements have been translated into United States dollars for convenience purposes at a rate of RMB7.0808 to US$1.00, the exchange rate on March 31, 2020, set forth in the H.10 statistical release of the Federal Reserve Board.
2 The Company acquired UFH in a business combination that closed on December 18, 2019. The financial results for the quarter ended March 31, 2019 presented herein are those of the Company’s wholly owned subsidiary, Healthy Harmony Holdings, L.P. (the “Predecessor”), while the financial results for the quarter ended March 31, 2020, presented herein are those of the combined Company (the “Successor”).
3 Adjusted EBITDA (before IFRS 16 adoption) is a non-IFRS performance measure. See “Non-IFRS Financial Measures” for a reconciliation of Adjusted EBITDA to its most comparable financial measure calculated in accordance with IFRS.
“During the quarter, we initiated some changes at our corporate headquarters with the goal of reducing costs related to salary and benefits, as well as those related to general administrative expenses, which we expect will result in future and ongoing cost savings. We also received some relief and incentives from local governments. Starting in the end of February, we began to see sustained recovery of our patient volumes, and as our business continues to return to normal growth, we remain focused on network efficiency, expansion asset ramp-up, and core market facility and service development. We are committed to delivering long-term value through growth in patient volume, service offerings, and our network.”
Key Operating Metrics
For management purposes, the Company is organized into business units based on the category and stage of development of the Company’s healthcare facilities and geographic locations, and has three reportable operating segments as follows:
(a) Tier 1 Operating Assets: the existing general healthcare facilities located in tier 1 cities in China, such as Beijing United Family Hospital (“BJU”) and Shanghai United Family Hospital (“PXU”), and their associated clinics.
(b) Tier 2 Operating and Other Assets: the existing general healthcare facilities located in tier 2 cities in China, such as Tianjin United Family Hospital (“TJU”), Qingdao United Family Hospital (“QDU”), and other assets, such as a Beijing United Family Rehabilitation Hospital (“Rehab”) and other clinic assets.
(c) Expansion Assets: the facilities recently opened or about to open including Shanghai Xincheng United Family Hospital (“PDU”), Guangzhou United Family Hospital (“GZU”), and Beijing Jingbei Women and Children’s United Family Hospital (“DTU”).
| 1Q19 | 1Q20 | Y-o-Y Change % | |||||||||
| Outpatient Volume | Inpatient Admission | Outpatient Volume | Inpatient Admission | Outpatient Volume | Inpatient Admission | ||||||
| Tier 1 Operating Assets | 114,913 | 1,687 | 63,696 | 1,244 | -44.6% | -26.3% | |||||
| Tier 2 Operating and Other Assets | 21,139 | 616 | 12,564 | 451 | -40.6% | -26.8% | |||||
| Operating Assets(1) | 136,052 | 2,303 | 76,260 | 1,695 | -43.9% | -26.4% | |||||
| Expansion Assets(2) | 15,499 | 291 | 13,203 | 361 | -14.8% | 24.1% | |||||
| Total UFH | 151,551 | 2,594 | 89,463 | 2,056 | -41.0% | -20.7% | |||||
| (1) | Operating Assets (Tier 1 and Tier 2): The decline of outpatient volume was primarily due to the COVID-19 pandemic, as patients postponed or cancelled non-emergency medical services. In addition, the Chinese Government implemented various preventive measures during the pandemic that impacted the Company’s hospital and clinic operations. Such measures included: 1) the temporary closing of non-emergency departments, including dentistry and dermatology; 2) the temporary suspension of vaccine services; 3) daily limitations on volume for certain specialties to ensure social distancing; and 4) the closing of certain of the Company’s and outpatient clinics in February. Inpatient volume was also impacted as the Company was encouraged to delay non-emergency/elective procedures. |
| (2) | Expansion Assets: PDU and GZU saw continued ramp-up in inpatient volume driven by their OBGYN, postpartum care, pediatric, family medicine, surgeries, and other services. Outpatient volume declined yoy due to the COVID-19 pandemic. |
| First Quarter 2020 Results (RMB mm) | ||||||
| Revenue | 1Q19 | 1Q20 | Y-o-y Change % | |||
| Tier 1 Operating Assets (1) | 435.1 | 301.9 | -30.6% | |||
| Tier 2 Operating and Other Assets (3) | 87.0 | 63.6 | -26.9% | |||
| Operating Assets(4) | 522.0 | 365.5 | -30.0% | |||
| Expansion Assets(5) | 55.4 | 65.4 | 18.1% | |||
| Total | 577.4 | 430.9 | -25.4% | |||
| (1) | Tier 1 Operating Assets: Revenue of UFH’s tier 1 facilities and their associated clinics decreased by 30.6% yoy due to a decline in patient volume because of COVID-19. However, the Company’s oncology services revenue grew 40% yoy because its facilities were viewed by patients as safer and more accessible than public hospitals for their treatments. |
| (2) | Tier 2 operating and other assets: Revenue from UFH’s tier 2 facilities and other assets, as a group, declined 26.9% yoy due to a drop in patient volume as a result of COVID-19. |
| (3) | Total Operating Assets as a group declined 30.0% yoy. |
| (4) | Expansion Assets: UFH’s GZU and PDU were formally launched, with complete practicing licenses4, in the fourth quarter of 2018. As a result of a strong ramp-up, driven by increased brand recognition and new patient uptake at GZU and PDU, revenue for UFH’s expansion assets, as a group, increased from RMB55.4 million in the first quarter of 2019 to RMB65.4 million in the first quarter of 2020. GZU recorded revenue growth of 11.9% yoy and PDU 20.1% yoy. |
| First Quarter 2020 Results (RMB mm) | ||||||
| Adjusted EBITDA (before IFRS 16 adoption) | ||||||
| 1Q19 | 1Q20 | Y-o-Y Change % | ||||
| Adjusted EBITDA (before IFRS 16 adoption) | ||||||
| Tier 1 Operating Assets(1) | 110.5 | 22.9 | -79.3% | |||
| Tier 2 Operating and Other Assets(2) | 0.4 | -11.5 | -2964.8% | |||
| Operating Assets(3) | 110.9 | 11.3 | -89.8% | |||
| Expansion Assets(4) | -43.6 | -42.6 | 2.2% | |||
| Unallocated costs(5) | -36.4 | -36.4 | 0.2% | |||
| Total Adjusted EBITDA (before IFRS 16 adoption)(5) | 30.9 | -67.7 | -319.0% | |||
| (1) | Tier 1 Operating Assets: As a result of the impacts of COVID-19, BJU, PXU, and their associated clinics (together, “Tier 1 operating assets”) achieved Adjusted EBITDA (before IFRS 16 adoption) decrease of 79.3% yoy in the first quarter of 2020. |
| (2) | Tier 2 Operating and Other Assets: TJU, Rehab, QDU, and other clinics in Tier 2 cities achieved Adjusted EBITDA of RMB(11.5) million in the first quarter of 2020, compared to RMB0.4 million in the first quarter of 2019, due to the decrease in patient volume. |
| (3) | Total Operating Assets: UFH’s operating assets, as a group, achieved Adjusted EBITDA (before IFRS 16 adoption) decrease of 89.8% yoy as of March 31, 2020, to RMB11.3 million. |
| (4) | Expansion Assets: Expansion assets, as a group, experienced an increase in total Adjusted EBITDA (before IFRS 16 adoption) from RMB(43.6) million in the first quarter of 2019 to RMB(42.6) million in the same period of 2020. UFH is currently overseeing the planning and renovation of the Shenzhen hospital, and is in return receiving a branding/management fee. |
| (5) | Total Adjusted EBITDA (before IFRS 16 adoption) for the first quarter of 2020 was RMB(67.7) million compared to RMB30.9 million in the prior year period. |
4 Complete practicing licenses means after receiving the formal approval of practicing license for medical institutions and obstetrics operating license.
5 Unallocated costs are related to corporate headquarter expenses including C-level Executives, shared services including IT, central purchasing, HR, etc.
FINANCIAL RESULTS
Unaudited First Quarter 2020 Results
Revenue was RMB430.9 million ($60.9 million) in the first quarter, representing a decrease of 25.4% yoy from RMB577.4 million in the first quarter of 2019. The decrease primarily resulted from a decline in patient volume as patients postponed or cancelled non-emergency medical services due to the impact of COVID-19.
| · | Tier 1 Operating Assets: revenue decreased by 30.6% yoy to RMB301.9 million from RMB435.1 million, and Adjusted EBITDA (before IFRS 16 adoption) decreased by 79.3% to RMB22.9 million from RMB110.5 million, due to the decline in patient volume caused by the COVID-19 outbreak. |
| · | Tier 2 Operating and Other Assets: revenue decreased by 26.9% yoy to RMB63.6 million from RMB87.0 million and Adjusted EBITDA (before IFRS 16 adoption) decreased to RMB(11.5) million from RMB0.4 million due to impact of COVID-19. |
| · | Expansion Assets: revenue increased by 18.1% yoy to RMB65.4 million from RMB55.4 million due to the continued ramp-up of expansion assets, and Adjusted EBITDA (before IFRS 16 adoption) increased by 2.2% yoy to RMB(42.6) million from RMB(43.6) million. |
Operating expenses were RMB559.2 million ($79.0 million) in the first quarter, representing a decrease of 4.0% yoy from RMB582.8 million.
| · | Salaries, wages and benefits expenses decreased 6.9% yoy to RMB304.2 million from RMB326.6 million due to the reduction in social insurance and benefits expenses as a result of government policy changes during the pandemic. The majority of the cost cutting initiatives were conducted during the second quarter of 2020 and will be reflected in the financials of the coming quarters. |
| · | Supplies and purchased medical services expenses decreased 18.8% yoy to RMB75.5 million from RMB93.0 million, mainly attributable to decreased usage due to the decline in patient volume, and was partially offset by increased purchases of personal protective equipment and implementation of new infection control measures during the pandemic. |
| · | Depreciation and amortization expenses increased 29.2% yoy to RMB108.1 million from RMB83.6 million primarily due to fair value appreciation of plant and equipment, contracts with insurers related to the business combination, and full depreciation of the newly expanded PXU facility in the first quarter of 2020. |
| · | Lease and rental expenses decreased 33.2% yoy to RMB2.3 million from RMB3.4 million primarily due to the termination of certain office rentals for the old PXU facility. |
| · | Impairment of trade receivables decreased 12.9% yoy to RMB4.0 million from RMB4.6 million primarily due to better collection rates over the past year. |
| · | Other operating expenses decreased 9.0% yoy to RMB65.1 million from RMB71.6 million mainly due to the decrease in fees payable to certain of the Company’s Chinese partners, which resulted from a recognized loss in the first quarter of fiscal 2020. |
As a result of the above, loss from operations in the first quarter of fiscal 2020 was RMB128.3 million ($18.1 million) compared to loss from operations of RMB5.3 million ($0.8 million) in the prior year period. Loss before income taxes in the first quarter of fiscal 2020 was RMB175.8 million ($24.8 million) compared to loss before income taxes of RMB27.6 million ($3.9 million) in the prior year period. Net loss in the first quarter of 2020 was RMB168.6 million ($23.8 million) compared to net loss of RMB45.7 million ($6.4 million) in the prior year period. Increased losses in the first quarter of fiscal 2020 mainly resulted from the revenue decline caused by the epidemic and increased finance costs as a result of the Company's new Senior Secured Term Loan in an aggregate principal amount of RMB2,094.6 million (i.e., the RMB equivalent of US$300 million).
As of March 31, 2020, the Company had RMB1,438.3 million ($203.1 million) in cash and cash equivalents and restricted cash. Cash used for operating activities were RMB237.0 million ($33.5 million), cash used for investing activities were RMB14.6 million ($2.1 million), and cash used for financing activities were RMB53.1 million ($7.5 million).
RECONCILIATON OF NON-IFRS FINANCIAL MEASURES
(RMB mm)
| For the three months ended March 31, | ||||||||
| 2019 | 2020 | |||||||
| Net loss | (46 | ) | (169 | ) | ||||
| Less: Finance income | (1 | ) | - | |||||
| Add: Finance costs | 35 | 72 | ||||||
| Less: Other gains | (12 | ) | (17 | ) | ||||
| Less: Other income,net | - | (7 | ) | |||||
| Add: Income tax expense/(benefit) | 18 | (7 | ) | |||||
| Operating loss | (6 | ) | (128 | ) | ||||
| Add: Share-based compensation | 3 | 3 | ||||||
| Add: Depreciation and amortization | 84 | 108 | ||||||
| Add: Discontinued monitoring fee payable to Fosun Pharma and TPG | 1 | - | ||||||
| Add: Transaction costs-insurance amortization | - | 1 | ||||||
| Adjusted EBITDA | 82 | (16 | ) | |||||
| Less: Lease expense adjustments as a result of IFRS 16 adoption | (51 | ) | (52 | ) | ||||
| Adjusted EBITDA (before IFRS 16 adoption)6 | 31 | (68 | ) | |||||
| For the three months ended March 31, 2020 | ||||||||||||||||
| Operating assets Tier 1 | Operating assets - Tier 2 and other assets | Expansion assets | Total | |||||||||||||
| Segment results | 44 | (6 | ) | (20 | ) | 18 | ||||||||||
| Less: Segment lease expense adjustment as a result of adoption of IFRS 16 | (21 | ) | (5 | ) | (23 | ) | (49 | ) | ||||||||
| Less: Unallocated costs | (37 | ) | ||||||||||||||
| Adjusted EBITDA (before IFRS 16 Adoption) | 23 | (11 | ) | (43 | ) | (68 | ) | |||||||||
| Add: Lease expense adjustment as a result of adoption of IFRS 16 | 52 | |||||||||||||||
| Adjusted EBITDA | (16 | ) | ||||||||||||||
| Less: Share-based compensation | (3 | ) | ||||||||||||||
| Less: Depreciation and amortization | (108 | ) | ||||||||||||||
| Less: Transaction costs - insurance amortization | (1 | ) | ||||||||||||||
| Operating loss | (128 | ) | ||||||||||||||
| Add: Finance income | - | |||||||||||||||
| Less: Finance expense | (72 | ) | ||||||||||||||
| Add: Other gains | 17 | |||||||||||||||
| Add: Other income | 7 | |||||||||||||||
| Add: Income tax benefit | 7 | |||||||||||||||
| Net loss | (169 | ) | ||||||||||||||
RECENT DEVELOPMENTS
COVID-19 Impacts
Pre COVID-19 Status: In the first 20 days of January 2020, the Company was performing in line with expectations on both a revenue and EBITDA basis, supported by strong growth in inpatient services. The total number of inpatient days during this period increased by 20% yoy, and each of the Company’s business segments achieved double-digit growth. The total number of surgical procedures completed during this period also increased significantly by 43% yoy with over 320 procedures performed, including a significant number of high acuity complex cases.
COVID-19 Impacts: As discussed above, the Company’s business has been significantly impacted by the COVID-19 pandemic, with outpatient volume and inpatient admissions dropping 58% yoy and 19% yoy, respectively, in February. The decrease in volume was largely a result of the countrywide shutdown of businesses and movement across China due to the pandemic. In addition, various government preventive measures also had negative impacts on the Company’s business, including 1) temporary suspensions of certain non-emergency services such as dentistry and temporary closure of a number of outpatient clinics, 2) increased border controls, which resulted in fewer expatriate patients, and 3) temporary suspension of multi-site practice for physicians in a number of cities. As of the date of this release, most of these restrictions, with the exception of the border control measures, have begun to be lifted or have been removed altogether.
6 Adjusted EBITDA loss (before IFRS 16 adoption) was approximately RMB67.7 million when restoring rent expense under IAS 17 with the amount of RMB52.3 million for the first quarter of fiscal 2020 and Adjusted EBITDA (before IFRS 16 adoption) was RMB30.9 million when restoring rent expense under IAS 17 with the amount of RMB51.3 million for the first quarter of fiscal 2019.
Recovery Status: Despite the challenges experienced in the first quarter of 2020, the Company has seen positive signs of increasing patient confidence as demand for its services return. This is evidenced by a steady week-over-week increase in outpatient visits and inpatient admissions in the Company’s hospitals and clinics since the third week of February. Most of China’s largest cities (except for Beijing) began lifting most of their restrictive measures starting in March. Excluding the Company’s facilities in Beijing, by the last week of April, the Company had achieved 87% of revenue as compared to the same week in 2019. The Beijing city government had lowered its emergency response levels and released most of its corresponding travel restrictions by the end of April. As a result, by the third week of May, the Company, including its Beijing operations, had achieved over 93% of revenue as compared to the same week in 2019. Despite slower recovery in the number of its expatriate patients, the Company has seen healthy recovery and growth from Chinese patients.
The Company expects the recovery trend to continue and to resume year-over-year revenue growth in the coming months, barring reemergence of widespread contagion of COVID-19 in China.
Online Consultations
During the pandemic, the Company launched a new online and telephone consultation service covering 30 specialties to the general public. Since the launch of the services in February, a total of nearly 5,000 online consultations were conducted, out of which approximately 30% of the patients were new patients following their on line consultation, and approximately 8% of these online patients have already made in-person follow up appointments to visit UFH physician. In addition, the offline revisit rate for those returning patients have reached approximately 185% in May. The Company intends to continue to expand its online consultation services and expects that this service will enable it to provide seamless online-offline medical services to its patients.
Since February, the Company has given more than 300 online public health talks through live-broadcasting video platforms hosted by various facilities covering topics from COVID-19 impact on mental health to cancer care. The public health talks have cumulatively reached approximately 17 million people. Through these online and telephone programs and consultations, the Company has remained engaged with its current patients while introducing a broader array of customers to its high quality services.
Significant Development in Oncology and Other Higher Acuity Specialties
During the pandemic, the government imposed strict measures on public hospitals, which have since reduced the number of available appointments, suspended elective surgeries, and reduced bed capacity at such facilities. Due to concerns of potential COVID-19 infection risks and reduced capacity at public hospitals, new patients have been drawn to the Company’s facilities, particularly for its higher acuity specialties. Revenue at its Beijing oncology center grew significantly during the COVID-19 outbreak with net revenue increasing by 39% yoy and volume of new treatment patients (including both chemo and radiotherapy) increasing by 92% yoy. External physicians from various other hospitals and clinics have increasingly referred patients to our facilities for procedures and treatment, resulting in a 106% yoy increase in terms of patient referrals, demonstrating the reputation and technical capability of our facilities.
COVID-19 PCR and Antibody Testing Capabilities
As one of the most recognized private premium healthcare providers in China, many of our facilities have been approved to provide COVID-19 polymerase chain reaction (“PCR”) tests and COVID-19 antibody tests to patients on site and for group testing for corporate and school partners at their work sites or campuses. The Company has provided PCR tests and antibody tests to more than 5,000 patients as of the date of this release and has generated roughly RMB1 million in revenue from these tests. The Company is currently in discussions with a number of Fortune 500 companies with operations in China to provide COVID-19 testing to their employees and, in some cases, to their customers, which could potentially generate additional revenue and attract new patients to the Company’s network.
Cost Saving Initiatives
Corporate Headquarters: Starting in the second quarter, the Company’s corporate headquarters has begun a restructuring process aimed at increasing administrative and operating efficiencies, which is expected to result in run rate cost savings through permanent headcount reductions. In this process, the Company expects to reduce administrative headcount by approximately 28% at corporate headquarters, or approximately 50 positions in total, through position elimination and attrition. Through headcount reduction, our corporate headquarters is expected to have a run-rate cost savings of approximately RMB26 million per annum.
In addition to headcount reductions, the senior management team of the Company took a voluntary pay reduction ranging from 20% to more than 30% for the remainder of 2020.
Further, SG&A expenses have also been reduced by approximately RMB9 million, or 24%, for 2020 compared to 2019 as a result of headquarters cost reviews and reduced travel, communication and other expenses.
Factoring in the headcount reduction, salary reduction, and SG&A reduction, our corporate headquarters is expected to save approximately RMB29 million for the 2020 fiscal year compared to 2019 after taking into consideration one-time severance costs and partial-year impacts from cost initiatives conducted during the year.
Going forward, management is expected to manage and review corporate overhead annually with a zero based budgeting approach.
Hospital Facilities: Starting in February, the Company has taken various measures to reduce overall costs for the 2020 fiscal year, including Company-wide hiring and salary freezes (except for front-line revenue generating clinicians), strict travel and training policies, and detailed review of outsourced services, supplies, utilities, and other expenses. However, the Company has refrained from headcount reduction at its hospital facilities considering the volume recovery trend and future growth roadmap.
The Chinese government has also offered support to businesses that were affected by COVID-19 in the form of incentives from the government social insurance program. NFH availed itself of these incentives where available and appropriate. In addition, the Company has been able to negotiate preferential fees and reduced rental terms with some of its long-established vendors
Factoring all the cost saving initiatives at the market level (in addition to the cost savings at the corporate headquarters), the Company is expected to save RMB80-120 million at the facility level in 2020 compared to 2019.
Appointment of New Member of the Board and Chairman of Audit Committee
The Board of Directors (the “Board”) of the Company appointed Mr. Lawrence Chia as an independent director and as the Chairman of the Audit Committee, effective March 31, 2020.
Mr. Lawrence Chia is currently the chief executive officer of the Samling Group of Companies, which has businesses in automobiles, properties, timber, infrastructure, oil palm, oil, and gas, with operations in a number of countries globally. Prior to joining Samling, Lawrence was previously the chief executive officer of Deloitte China, and was on the Deloitte Touche Tohmatsu Limited (DTTL) Executive Committee based in New York and the DTTL Asia Pacific Executive Committee based in Hong Kong. He also serves as an Independent Non-Executive Director of BC Technology Group Limited, a publicly listed company on the Hong Kong Stock Exchange. Mr. Lawrence is a Chartered Accountant of the Institute of Chartered Accountants in England and Wales and a member of the Hong Kong Institute of Certified Public Accountants.
The appointment of Mr. Chia reflects the Company’s commitment to ensuring that the Board has a broad mix of skills and perspectives. The Company looks forward to benefiting from Mr. Chia’s expertise as it continues to make progress on its long-term strategic growth.
Other Initiatives
Protecting Staff and Patients: Protecting its staff and patients has always been the top priority of the Company. In the wake of the COVID-19 pandemic, the Company has utilized its global supply chain network to source over RMB6 million for Q1 in personal protective equipment (“PPE”) for its front line medical staff. As a result, the Company has ensured that all of its frontline staff had — and will continue to have — adequate PPE throughout the pandemic. In addition, the Company anticipates that its efforts will ensure that it has adequate PPE reserves for the foreseeable future. The Company has also taken various initiatives to safeguard the safety of its staff and patients, including mandatory 14-day quarantines for all staff (including physicians and nurses) returning to work from other cities, establishing flexible work arrangements, requiring temperature checks and taking travel histories before entering any of its facilities, and providing epidemic control education and training to all staff members.
As of the date of this press release, the Company has had no confirmed cases of COVID-19 among its staff or patients, and its quarantine and hygiene policies have enabled it to maintain adequate levels of staffing throughout its facilities while ensuring safety.
Charity: In the first quarter of 2020, NFH raised funds from New Frontier Group, the investment group that sponsored the entity that created NFH, as well as from several strategic partners, and leveraged its global supply chain network to send urgently needed medical supplies to Leishenshan Hospital, Zhongnan Hospital of Wuhan University, and other institutions at the front lines of the fight against COVID-19 in Wuhan. The donation of medical equipment and consumables included 39 ICU ventilators with 750 breathing circuits and 32 breathing masks, 155,000 pairs of medical examination gloves, 50,000 N95 masks, 40,000 surgical masks, 3,960 goggles, and 185 reusable face shields. These medical supplies were sourced from across China and around the globe by the Company’s experienced supply chain team and were shipped directly to the recipient hospitals.
BUSINESS OUTLOOK
The beginning of 2020 was challenging for all industries in China due to the outbreak of the novel coronavirus. As a result of the impact of the coronavirus outbreak, the Company has lowered its expectations for growth in the second quarter of 2020. Based on current market and operating conditions, the Company expects revenues to decrease by 15% to 18% as compared to the second quarter of 2019. As the restrictions imposed as a result of COVID-19 continue to be lifted, including opening of domestic travel and possibility of limited open borders, the Company has experienced positive patient volume trends in April and May, which it believes may continue. As the overall epidemic situation continues to improve in China, the Company hopes to return to more normalized growth volumes by the summer. This forecast reflects the Company’s current and preliminary views, which are subject to change.
CONFERENCE CALL
A conference call and webcast to discuss New Frontier Healthcare’s financial results and guidance will be held at 8:00 a.m. U.S. Eastern Time on Wednesday, May 27, 2020 (or Wednesday, May 27, 2020, at 8:00 pm Beijing Time). Interested parties may listen to the conference call by dialing numbers below:
United States: 1-877-407-0789
International: 1-201-689-8562
China Domestic: 86 400 120 2840
Hong Kong: 800 965 561
Conference ID: 13704117
Participants are encouraged to dial into the call at least 15 minutes in advance due to high call volume
The replay will be accessible through June 3, 2020, by dialing the following numbers:
United States: 1-844-512-2921
International: 1-412-317-6671
Replay PIN: 13704117
The webcast will be available on the Company’s investor relations website at www.nfh.com.cn and will be archived on the site shortly after the call has concluded. A presentation to accompany the call will also be available for download on the website.
About New Frontier Health Corporation
New Frontier Health Corporation (NYSE: NFH) is the operator of United Family Healthcare (UFH), a leading private healthcare provider offering comprehensive premium healthcare services in China through a network of private hospitals and affiliated ambulatory clinics. UFH currently has nine hospitals in operation or under construction in all four tier 1 cities and selected tier 2 cities. Additional information may be found at www.nfh.com.cn.
Forward-Looking Statements
Certain statements made in this release are "forward looking statements" within the meaning of the "safe harbor" provisions of the United States Private Securities Litigation Reform Act of 1995. When used in this press release, the words "estimates," "projected," "expects," "anticipates," "forecasts," "plans," "intends," "believes," "seeks," "may," "will," "should," "future," "propose" and variations of these words or similar expressions (or the negative versions of such words or expressions) are intended to identify forward-looking statements. These forward-looking statements include, without limitation, NFH’s ability to address the effects of the COVID-19 pandemic; NFH’s ability to manage patient inflows; and NFH’s ability to prevent the spread of COVID-19 within its facilities; NFH’s ability to grow its business manage its growth; the benefits and synergies of the business combination it completed in December 2019, including anticipated cost savings, results of operations, financial condition, liquidity, prospects, growth, strategies and the markets in which the Company operates. Such forward-looking statements are based on available current market material and management’s expectations, beliefs and forecasts concerning future events impacting NFH. These forward-looking statements are not guarantees of future results and involve a number of known and unknown risks, uncertainties, assumptions and other important factors, many of which are outside NFH’s control that could cause actual results or outcomes to differ materially from those discussed in the forward-looking statements. For a discussion of such risks, please refer to NFH’s Annual Report on Form 20-F, filed with the U.S. Securities and Exchange Commission (the “SEC”) on March 31, 2020 and NFH’s subsequent filings with the SEC. NFH undertakes no obligation to update or revise any forward-looking statements, whether as a result of new information, future events or otherwise, except as required by law.
Non-IFRS Measures
The discussion and analysis includes certain measures, including Adjusted EBITDA (before IFRS 16 adoption), which have not been prepared in accordance with IFRS. This measure does not have any standardized meaning prescribed by IFRS and are therefore unlikely to be comparable to similar measures presented by other companies. This measure should be considered as supplemental in nature and not as a substitute for the related financial information prepared in accordance with IFRS. We use this measure to evaluate our operating results and for financial and operational decision-making purposes. We believe that Adjusted EBITDA is helpful in comparing our performance over various reporting periods on a consistent basis by removing from operating results the impact of items that do not reflect core operating performance, and in identifying underlying operating results and trends.
Adjusted EBITDA (before IFRS 16 adoption), is calculated as net loss plus (i) depreciation and amortization, (ii) finance expense/(income), (iii) other gains or losses, (iv) other expenses (such as share based compensation), (v) provision for income taxes, as further adjusted for (vi) certain monitoring fees paid to certain shareholders prior to the Business Combination, (vii) lease expense adjustments as a result of adoption of IFRS 16, and (viii) transaction costs (such as insurance amortization). UFH adopted IFRS 16 on January 1, 2019, and recognized lease liabilities and corresponding “right-of-use” assets for all applicable leases, and recognized interest expense accrued on the outstanding balance of the lease liabilities and depreciation of right-of-use assets. As a result, the adoption of IFRS 16 caused depreciation and amortization and finance costs to increase in 2019, and excluded all applicable lease expenses in Adjusted EBITDA. For ease of comparison to prior periods, the Company eliminated the impact of IFRS 16 on Adjusted EBITDA.
Please see the table captioned “Reconciliations of non-IFRS Financial Measures.”
Exchange Rate Information
The translations from Renminbi to U.S. dollars included in the financial statements and elsewhere in this press release have been included for purposes of convenience were made at a rate of RMB7.0808 to US$1.00, the exchange rate set forth in the H.10 statistical release of the Federal Reserve Board on March 31, 2020.
Contacts
Media
Wenjing Liu
Tel: +86-186-1151-5796
Email: [email protected]
Investors
Harry Chang
Tel: +852-9822-1806
Email: [email protected]
ICR, LLC
William Zima/Rose Zu
Tel: +1-203-682-8200
Email: [email protected]/[email protected]
Source: New Frontier Health Corporation
NEW FRONTIER HEALTH CORPORATION
UNAUDITED CONSOLIDATED STATEMENTS OF COMPREHENSIVE INCOME (LOSS)
(All amounts in thousands)
| Predecessor | Successor | |||||||||||
For the three months ended March 31, 2019 | For the three months ended March 31, 2020 | |||||||||||
| RMB | RMB | US$ | ||||||||||
| Revenues | 577,444 | 430,943 | 60,861 | |||||||||
| Operating expenses | ||||||||||||
| Salaries, wages and benefits | (326,584 | ) | (304,192 | ) | (42,960 | ) | ||||||
| Supplies and purchased medical services | (92,968 | ) | (75,493 | ) | (10,662 | ) | ||||||
| Depreciation and amortization expense | (83,635 | ) | (108,086 | ) | (15,265 | ) | ||||||
| Lease and rental expenses | (3,383 | ) | (2,261 | ) | (319 | ) | ||||||
| Bad debt expense | (4,626 | ) | (4,029 | ) | (569 | ) | ||||||
| Other operating expenses | (71,592 | ) | (65,133 | ) | (9,199 | ) | ||||||
| Expense total | (582,788 | ) | (559,194 | ) | (78,974 | ) | ||||||
| Operating loss | (5,344 | ) | (128,251 | ) | (18,113 | ) | ||||||
| Finance income | 528 | 418 | 59 | |||||||||
| Finance costs | (34,618 | ) | (72,367 | ) | (10,220 | ) | ||||||
| Foreign currency gain | 11,830 | 17,353 | 2,451 | |||||||||
| Other income, net | 44 | 7,066 | 998 | |||||||||
| Loss before income taxes | (27,560 | ) | (175,781 | ) | (24,825 | ) | ||||||
| Income tax (expense)/benefit | (18,145 | ) | 7,209 | 1,018 | ||||||||
| Loss for the period | (45,705 | ) | (168,572 | ) | (23,807 | ) | ||||||
| Attributable to | ||||||||||||
| Equity holders of the parent | (37,962 | ) | (160,170 | ) | (22,620 | ) | ||||||
| Non-controlling interests | (7,743 | ) | (8,402 | ) | (1,187 | ) | ||||||
| Loss per share attributed to ordinary equity holders of the parent | ||||||||||||
| Basic | (1.22 | ) | (0.17 | ) | ||||||||
| Diluted | (1.22 | ) | (0.17 | ) | ||||||||
| Other comprehensive loss | ||||||||||||
| Items to be reclassified to profit or loss in subsequent periods (net of tax): | ||||||||||||
| Currency translation differences | (9,174 | ) | (9,995 | ) | (1,412 | ) | ||||||
| Other comprehensive loss | (9,174 | ) | (9,995 | ) | (1,412 | ) | ||||||
| Comprehensive loss for the period | (54,879 | ) | (178,567 | ) | (25,219 | ) | ||||||
| Comprehensive loss attributable to | ||||||||||||
| Equity holders of the parent | (47,136 | ) | (170,165 | ) | (24,032 | ) | ||||||
| Non-controlling interests | (7,743 | ) | (8,402 | ) | (1,187 | ) | ||||||
NEW FRONTIER HEALTH CORPORATION
UNAUDITED CONSOLIDATED STATEMENTS OF FINANCIAL POSITION
(All amounts in thousands)
| December
31, | March 31, 2020 | ||||||||||
| RMB | RMB | US$ | ||||||||||
| Non-current assets | ||||||||||||
| Plant and equipment | 1,962,781 | 1,915,406 | 270,507 | |||||||||
| Goodwill | 6,056,253 | 6,056,253 | 855,306 | |||||||||
| Intangible assets | 2,584,893 | 2,570,034 | 362,958 | |||||||||
| Right-of-use assets | 1,773,007 | 1,751,052 | 247,296 | |||||||||
| Deferred tax assets | 59,001 | 64,581 | 9,121 | |||||||||
| Restricted cash | 350 | 350 | 49 | |||||||||
| Other non-current assets | 106,121 | 103,551 | 14,624 | |||||||||
| Total non-current assets | 12,542,406 | 12,461,227 | 1,759,861 | |||||||||
| Current assets | ||||||||||||
| Inventories | 56,592 | 63,221 | 8,929 | |||||||||
| Trade receivable | 215,376 | 179,465 | 25,345 | |||||||||
| Due from related parties | 66,923 | 5,237 | 740 | |||||||||
| Prepayments and other current assets | 38,323 | 41,173 | 5,815 | |||||||||
| Restricted cash | 376,715 | 382,659 | 54,042 | |||||||||
| Cash and cash equivalents | 1,353,300 | 1,055,301 | 149,037 | |||||||||
| Total current assets | 2,107,229 | 1,727,056 | 243,908 | |||||||||
| TOTAL ASSETS | 14,649,635 | 14,188,283 | 2,003,769 | |||||||||
| Current liabilities | ||||||||||||
| Trade payables | 99,082 | 104,606 | 14,773 | |||||||||
| Contract liabilities | 270,196 | 273,569 | 38,635 | |||||||||
| Accrued expenses and other current liabilities | 882,158 | 608,846 | 85,985 | |||||||||
| Due to related parties | 4,045 | 3,923 | 554 | |||||||||
| Tax payable | 15,278 | 13,927 | 1,967 | |||||||||
| Long-term borrowings | 400,325 | 410,365 | 57,955 | |||||||||
| Lease liabilities | 90,521 | 90,452 | 12,774 | |||||||||
| Total current liabilities | 1,761,605 | 1,505,688 | 212,643 | |||||||||
| NET CURRENT ASSETS | 345,624 | 221,368 | 31,265 | |||||||||
| TOTAL ASSETS LESS CURRENT LIABILITIES | 12,888,030 | 12,682,595 | 1,791,126 | |||||||||
| Non-current liabilities | ||||||||||||
| Long-term borrowings | 2,060,933 | 2,061,763 | 291,177 | |||||||||
| Contract liabilities | 67,873 | 53,019 | 7,488 | |||||||||
| Deferred tax liabilities | 681,715 | 677,446 | 95,674 | |||||||||
| Lease liabilities | 1,661,182 | 1,650,193 | 233,052 | |||||||||
| Other long-term liabilities | 9,358 | 9,253 | 1,307 | |||||||||
| Total non-current liabilities | 4,481,061 | 4,451,674 | 628,698 | |||||||||
| Net assets | 8,406,969 | 8,230,921 | 1,162,428 | |||||||||
| EQUITY | ||||||||||||
| Equity attributable to the equity holders of the Company | ||||||||||||
| Ordinary shares | 91 | 91 | 13 | |||||||||
| Capital surplus | 8,430,405 | 8,432,925 | 1,190,957 | |||||||||
| Translation reserves | 6,302 | (3,693 | ) | (522 | ) | |||||||
| Accumulated deficit | (265,618 | ) | (425,788 | ) | (60,133 | ) | ||||||
| 8,171,180 | 8,003,535 | 1,130,315 | ||||||||||
| Non-controlling interests | 235,789 | 227,386 | 32,113 | |||||||||
| Total equity | 8,406,969 | 8,230,921 | 1,162,428 | |||||||||
NEW FRONTIER HEALTH CORPORATION
UNAUDITED CONDENSED CONSOLIDATED STATEMENTS OF CASH FLOWS
(All amounts in thousands)
| Predecessor | Successor | |||||||||||
| For
the | For the three months ended March 31, 2020 | ||||||||||
| Cash generated from (used for): | RMB | RMB | US$ | |||||||||
| Operating activities | 103,917 | (237,016 | ) | (33,473 | ) | |||||||
| Investing activities | (150,755 | ) | (14,630 | ) | (2,066 | ) | ||||||
| Financing activities | (57,995 | ) | (53,095 | ) | (7,498 | ) | ||||||
| Net decrease in cash and cash equivalents | (104,833 | ) | (304,741 | ) | (43,037 | ) | ||||||
Exhibit 99.2

1 1 New Frontier Health Q1 2020 Results May 27, 2020

2 2 Disclaimer Forward - Looking Statements This presentation includes “forward - looking statements” within the meaning of the “safe harbor” provisions of the Private Securi ties Litigation Reform Act of 1995. The actual results of New Frontier Health Corporation (the “Company”) may differ from the Company’s expectations, estimates and projections and consequently, you should not rely on the se forward - looking statements as predictions of future events. Words such as “expect”, “estimate”, “project”, “budget”, “forecast”, “anticipate”, “intend”, “plan”, “may”, “will”, “could”, “should”, “believes”, “predicts”, “p ote ntial”, “continue”, and similar expressions are intended to identify such forward - looking statements. These forward - looking statements involve significant risks and uncertainties that could cause the actual results to differ materially from the expected results, including, but not limited to, the Company’s ability to manage growth; the Company’s ability to execute its business plan, including its planned expansions, and meet its projections; rising costs adve rse ly affecting the Company’s profitability; potential litigation involving the Company; general economic and market conditions impacting demand for the Company’s services, and in particular economic and market conditions in the Chines e h ealthcare industry and changes in the rules and regulations that apply to such business, including as it relates to foreign investments in such businesses; and other risks and uncertainties indicated from time to time in the Co mpany’s filings with the U.S. Securities and Exchange Commission (the “SEC”). Most of these factors are outside of the Company’s control and are difficult to predict. The Company cautions readers not to place undue reliance upon any forward - looking statements, which speak only as of the date made. The Company does not undertake or accept any obligation or undertaking to release publicly any updates or revisions to any forward - looking statements to reflect any change in its expectations or any change in events, conditions or circumstances on which any such statement is based, except as required by law. Financial Information The Company acquired UFH in a business combination that closed on December 18, 2019. The financial results for the years ende d D ecember 31, 2018 and 2019, and for the quarter ended March 31, 2019 presented herein are those of the Company’s wholly owned subsidiary, Healthy Harmony Holdings, L.P. (the “Predecessor”), while the financial resul ts for the quarter ended March 31, 2020, presented herein are those of the combined Company (the “Successor”). Industry and Market Data In this presentation, we rely on and refer to information and statistics regarding market participants in the sectors in whic h t he Company competes and other industry data. The Company obtained this information and statistics from third - party sources, including reports by market research firms and company filings. Use of Non - IFRS Financial Matters The discussion and analysis includes certain measures, including Adjusted EBITDA (before IFRS 16 adoption), Adjusted EBITDA M arg in, Free Cash Flow and Pro - forma Adjusted EBITDA, and Pro - forma Adjusted EBITDA Margin, which have not been prepared in accordance with IFRS. These measures do not have any standardized meaning prescribed by IFRS and are therefore unlikely to be comparable to similar measures presented by other companies. These measures should be considered as supplemental in nature and not as a substitute for the related financial information p rep ared in accordance with IFRS. We use these measures to evaluate our operating results and for financial and operational decision - making purposes. We believe that Adjusted EBITDA and Pro - forma Adjusted EBITDA helps compare our performance over various reporting periods on a consistent basis by removing from operating results the impact of items that do not reflect core operating performance and helps identify underlying operating res ults and trends. Adjusted EBITDA (before IFRS 16 adoption), is calculated as net loss plus ( i ) depreciation and amortization, (ii) finance expense/(income), (iii) other gains or losses, (iv) other expenses (such as sha re based compensation), (v) provision for income taxes, as further adjusted for (vi) certain monitoring fees paid to certain shareholders prior to the Bu sin ess Combination, (vii) lease expense adjustments as a result of adoption of IFRS 16, and (viii) transaction related costs. UFH adopted IFRS 16 on January 1, 2019, and recognized lease liabilities and corresponding “right - of - use” assets for all applicable leases, and recognized interest expense accrued on the outstanding balance of the lease liabilities and depreciation of right - of - use assets. As a result, the adoption of IFRS 16 caused depreciation and amortiza tion and finance costs to increase in 2019 and excluded all applicable lease expenses in Adjusted EBITDA . For ease of comparison to prior periods, the Company eliminated the impact of IFRS 16 on Adjusted EBITDA. Pro - forma Adjusted EBITDA, is calculated as net loss plus ( i ) depreciation and amortization, (ii) finance expense/(income), (iii) other gains or losses, (iv) other expenses (such as sha re based compensation), (v) provision for income taxes, as further adjusted for (vi) certain monitoring fees paid to certain shareholders prior to the Business Combination, ( vii ) lease expense adjustment as a result of adoption of IFRS 16, (viii) transaction related costs, and (ix) Pro - forma adjustments in PXU. See slide 42 for further information on these pro - forma adjustments. Adjusted EBITDA margin is calculated by dividing Adjusted EBITDA (before IFRS 16 adoption), by total revenue and Pro - forma Adjus ted EBITDA margin is calculated by dividing Pro - forma Adjusted EBITDA by total revenue. Free cash flow is calculated as 1) operating cash flow 2) minus capital lease payments, 3) add interest expense paid, 4) add one - off transaction expense related to the business combination, 5) minus capital expenditure on existing operations of the facilities A reconciliation of non - IFRS forward looking information to their corresponding IFRS measures are not included in this presentat ion as they cannot be provided without unreasonable effort because of the inherent difficulty of accurately forecasting the occurrence and financial impact of the various adjusting items necessary for such reconciliation t hat have not yet occurred, are out of our control, or cannot be reasonably predicted.

3 3 Overview Q1 2020 Business Highlights Q1 2020 Financial R esults Growth Initiatives Appendix A - I ndustry Overview Appendix B - Additional Materials Table of Contents

4 4 Beijing United Family Hospital North ( 2020 ) OVERVIEW
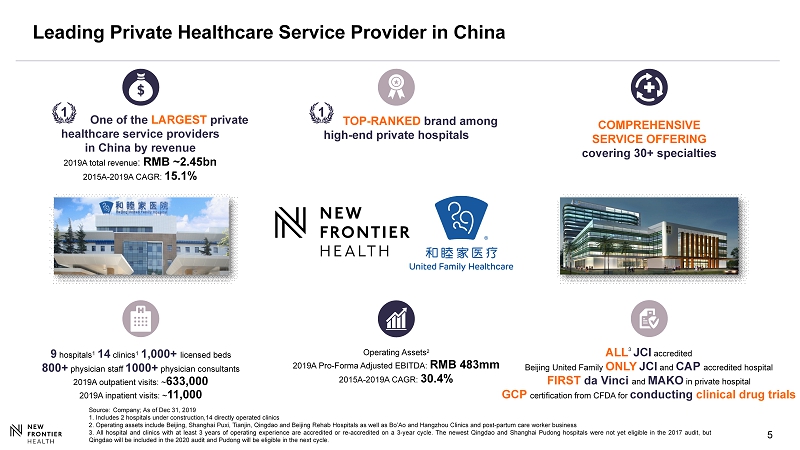
5 5 Leading Private Healthcare Service Provider in China COMPREHENSIVE SERVICE OFFERING covering 30+ specialties 9 hospitals 1 14 clinics 1 1,000+ licensed beds 800+ physician staff 1000+ physician consultants 2019 A outpatient visits: ~ 6 33 ,000 2019 A inpatient visits: ~ 11, 000 Operating Assets 2 2019A Pro - Forma Adjusted EBITDA: RMB 483mm 2015A - 201 9 A CAGR: 30 .4 % Source: Company; As of Dec 31, 2019 1 . I ncludes 2 hospitals under construction, 14 directly operated clinics 2 . Operating assets include Beijing, Shanghai Puxi , Tianjin, Qingdao and Beijing Rehab Hospitals as well as B o’Ao and Hangzhou Clinics and post - partum care worker business 3 . All hospital and clinics with at least 3 years of operating experience are accredited or re - accredited on a 3 - year cycle . The newest Qingdao and Shanghai Pudong hospitals were not yet eligible in the 2017 audit, but Qingdao will be included in the 2020 audit and Pudong will be eligible in the next cycle . One of the LARGEST private healthcare service providers in China by revenue 2019 A total revenue : RMB ~ 2. 45 bn 2015A - 201 9 A CAGR: 1 5.1 % 1 1 TOP - RANKED brand among high - end private hospitals ALL 3 JCI accredited Beijing United Family ONLY JCI and CAP accredited hospital FIRST da Vinci and MAKO in private hospital GCP certification from CFDA for conducting clinical drug trials

6 6 5 Hospitals Hub Spoke 8 Clinics Hub - and - Spoke Model 2 Hospitals Hub Spoke 4 Clinics Hub - and - Spoke Model 2 Hospitals Hub Spoke 2 Clinics Hub - and - Spoke Model Beijing Tianjin Qingdao Guangzhou Hangzhou Hainan Shenzhen 2 Shanghai Source: Company ; As of Dec 31, 2019 1. 5 hospitals in Beijing Cluster including Qingdao United Family and Tianjin United Family 2. UFH is expected to be given the exclusive right to manage New Frontier Group’s 64,000 sq. meter flagship Shenzhen city cen ter hospital as part of the transaction Broad geographic coverage across all four Tier 1 cities Strategic opportunity for expansion into Tier 2 cities GREATER BAY CLUSTER SHANGHAI CLUSTER + EAST CHINA BEIJING CLUSTER + NORTH CHINA 1 Nationwide Geographic Footprint

7 7 Expat 46% Local 54% BROADER ADDRESSABLE MARKET WITH MORE LOCAL PATIENTS 3 Commercial Insurance 37% Self - pay 63% Diversified Foundation for Future Growth Expat 29% Local 71% MULTI - SPECIALTY SERVICE OFFERING 1 2019A Source: Company 1. OB/GYN: Obstetrics and Gynecology; Peds: Pediatrics; Ortho: Orthopaedics; FM: Family Medicine; IM: Internal Medicine; ER: Eme rgency Room; PPR: Post - Partum Rehab 2. Split by revenue from insurance / self - pay patients 3. Split by volume of expat and local Chinese patients REVENUE MIX BETWEEN SERVICE & PHARMACY 2019A OB/GYN 22% Peds 14% Surgery 7% Ortho 7% FM 10% IM 8% ER 7% PPR 5% Others 19% 2014 2019A DIVERSIFIED PAYER STRUCTURE 2 Pharmacy 10% Service 90% 2019A

8 8 Revenue driven by high acuity departments including Orthopedics & Surgery High Acuity 163 351 2014 2019A Surgery Orthopedics Potential for Dermatology, ENT 1 , Ophthalmology & New Hope Oncology Centre New Specialties 51 138 2014 2019A Ophthalmology ENT Dermatology Comprehensive Provider with Entire “Lifecycle" Coverage Hub - and - spoke model creates comprehensive healthcare services platform with multiple patient touchpoints Clinics Home Health Attracting traffic with OB/GYN and Pediatrics 483 902 2014 2019A Pediatrics OB/GYN Revenue (RMB mm) Prenatal Care Pediatrics OB/ GYN 1 Expanding differentiated services complemented by Rehabilitation and PPR PPR 1 Rehabilitation 35 2014 2019A PPR Rehabilitation Broader patient base built up by Family Medicine 112 252 2014 2019A Family Medicine Family Medicine Dental Source: Company 1. OB/GYN: Obstetrics and Gynecology; ENT: Ear, Nose and Throat; PPR: Post - Partum Rehabilitation Hospitals 169

9 9 UFH A B C D E 1.85 1.55 1.53 1.50 1.08 1.48 UFH A B C D E 1.75 1.64 1.55 1.38 1.30 1.38 One of the Most Reputable Private Healthcare Brands in China Ranks top for medical quality among high - end private hospitals by patients, doctors and government regulators Source: Company, Company Analysis 1. Survey Question 4: Please rank the following private hospital brands’ medical quality. Screening criteria: Have had any ki nd of medical treatment in private hospital in past 36 months 2. Scoring methods: a) Score 5 for brand ranked 1 st ; Score 3 for brand ranked 2 nd ; Score 1 for brand ranked 3 rd ; b) Divide summed score by the number of respondents 3. Sample size for Beijing, Shanghai and Guangzhou were 105, 110 and 62 respondents, respectively Ranking score of private brands among monthly households income >RMB 27K 1,2,3 BEIJING UFH A B C D E SHANGHAI GUANGZHOU 1.64 1.37 1.30 1.28 1.03 1.25 2003 – The designated healthcare institution for foreigners during the SARS period 2010 – Official designated medical institutions for the Shanghai World Expo 2015 - Named as Most Investment - Worthy Healthcare Company 2016 – Ranked No.1 in China Top 100 Private Hospitals 2016 – Ranked No.2 in China Private Hospital Valuable Brands 2016 – Ranked No.18 in China Private Hospital Conglomerates Top 50 League 2018 – The designated Well - Known Trademark 2018 - Ranked No.1 repeatedly as The Best Employer among all private hospitals

10 10 Operating Stats 4 Open Date 1997/2014 2004 2019 2012 2015 2013 2018 2018 2020 2021 Signed MoU & framework agreement in major Tier 2 locations (lease / operate and management contract model) Gross Floor Area (sqm) 34,448 2 7,559 2 20,844 2 6,900 30,057 3 16,145 69,008 2 28,471 22,834 64,000 # of Beds 4 93 41 71 23 100 3 83 99 85 200 250 - 350 # of Consultation Rooms 237 3 71 3 97 3 31 31 32 123 5 41 5 37 5 TBC # of Satellite Clinics 8 2 0 0 0 1 1 N/A TBC TIER 1 Shanghai Puxi 1 (new) Shanghai Puxi (old) Asset Overview Source: Company ; As of Dec 31, 2019 Note: 1. New Shanghai Puxi is the expansion of the old Shanghai Puxi 2. Includes satellite clinics associated with hospitals UFH Beijing City Cluster Shanghai City Cluster Greater Bay Cluster OPERATING ASSETS EXPANSION ASSETS (TIER 1 ONLY) JCI - Accredited Beijing Chaoyang Shanghai Pudong Beijing Datun Shenzhen Management Contract Guangzhou Qingdao Beijing Rehab Tianjin TIER 2 EXPANSION ASSETS (TIER 2) 3. Includes Building A and additional capacity from Building B expansion; Revenue per sqm only accounts for the 20,057 sqm cu rre ntly in use 4. Stands for the maximum bed capacity as of fiscal year - end 5. Stands for the maximum number of consultation rooms designed

11 FY2019 Revenue (in million RMB) FY2019 Pro - forma Adjusted EBITDA (in million RMB) 2019 Revenue / Pro - forma Adjusted EBITDA 1 Summary 483 163 161 159 Tier 1 Operating Assets Total 0 HQ Tier 2 Operating & Other Assets Expansion Assets 1,811 359 280 Tier 1 Operating Assets Total Tier 2 Operating & Other Assets Expansion Assets 2,449 9% Y - o - y Growth 19% 21% 170% Pro - Forma Adjusted EBITDA Margin % 27% n.m. 0% - 58% 7% Revenue per Bed 2 Notes: 1. See slide 51 for a reconciliation of net loss to Pro - forma Adjusted EBITDA 2.Revenue per bed is calculated based on the weighted average maximum bed capacity of the fiscal year 3.Refferring to Beijing United Family Hospital in Chaoyang as its associated clinics 4.Referring to Shanghai Puxi United Family Hospital and its associated clinics. Maximum bed capacity for Shanghai Puxi United Family Hospital increased with the relocation to new site in Q4 2019 Beijing 3 14.0 1.7 1.5 4.6 Shanghai 4 10.8

12 12 Hospitals: Long Term Maturity Cycle 0 50 100 150 200 250 300 350 400 450 500 550 600 650 700 750 800 850 900 950 1,000 1,050 1,100 1997 1998 1999 2000 2001 2002 2003 2004 2005 2006 2007 2008 2009 2010 2011 2012 2013 2014 2015 2016 2017 2018 2019 QDU (20,057 sqm 3 ) BJU (24,959 sqm) PXU (previously 7,559 sqm; 20,844 sqm after relocation) TJU (6,900 sqm) Rehab (16,145 sqm) Hospital Revenue (mm RMB) Due to capacity bottleneck with only 5,886 sqm, Shanghai hospital struggled to take on additional patient volume and develop higher acuity services. Capacity issue was solved in October 2019 when Shanghai hospital moved to a new site with 19,172 sqm of facility size GZM (69,008 sqm) Dec - 19 (Month 15 1 ) Run Rate Revenue 2 (RMB 200mm) PDU (28,471 sqm) Dec - 19 (Month 13 1 ) Run Rate Revenue 2 (RMB 131mm) Source: Company ( Unaudited); As of Dec 31, 2019 1. Since the hospital obtained its OB license 2. Run - rate revenue is defined as monthly revenue * 12 3. Only 20,057 sqm Building A is currently in use and contributes revenue for now; total GFA is 30,057 sqm which includes Bui ldi ng A and additional capacity from Building B expansion

13 Significant White Space for Growth in Tier 1 Cities 1 Tier 1 Cities # of UFH Patients 2 ~200,000 Tier 1 Cities Target Addressable Market 3 ~4.1 million Tier 1 Cities Total Resident Population 4 ~ 74 million ~5% ~0.3% Significant white space within Tier 1 Cities for future growth Source: Company Analysis, National Bureau of Statistics 1. Tier 1 Cities include Beijing, Shanghai, Guangzhou and Shenzhen 2. Number of unique UFH patients in Tier 1 cities in 2019 3. Addressable market includes target expatriate population, local population with out - of - pocket payment and local population with premium hea lthcare insurance coverage as of 2018 4. Number of residents in Beijing, Shanghai, Guangzhou and Shenzhen as of 2018

14 14 Shanghai United Family Pudong Hospital Q1 2020 BUSINESS HIGHLIGHTS

15 15 Financial Snapshot Outpatient Visit - 41.0 % YoY 89,463 Visits Inpatient Admission - 20.7 % YoY Utilization Rate Compared to 36.1 % of 1Q19 32.7 % Operational Snapshot Adjusted EBITDA (before IFRS 16 Adoption) 1 RMB - 67.7 mn Total Revenue - 25.4 % YoY RMB 430.9 mn 2,056 Admissions Q1 2020 Operational and Financial Snapshot Notes: 1.See slide 51 for a reconciliation of net loss to Adjusted EBITDA (before IFRS 16 Adoption) Outpatient ASP 9.1 % YoY RMB 2,608 Inpatient ASP 13.4 % YoY RMB 92,964

16 January 2020 Pre COVID - 19 Status Up to Jan 20 th , we had recorded favorable growth trends compared with 2019 Notes: 1.Tier 1 Operating Assets mainly include Beijing United Family Hospital, Shanghai Puxi United Family Hospital and associated clinics 2.Tier 2 Operating & Other Assets mainly include Tianjin United Family Hospital, Beijing United Family Rehabilitation Hospita l, Qingdao United Family Hospital and other clinics in tier 2 cities 3.Expansion Assets mainly include Guangzhou United Family Hospital, Shanghai Pudong United Family Hospital and associated cli nic s as well as Beijing Datun United Family Hospital (under construction) and Shenzhen United Family Hospitl (Management contract) Pre - COVID - 19 Performance Total revenue and EBITDA performance in line with expectation up until Jan 20 th Strong performance especially for inpatient services : - Total number of inpatient days increase by 20 % y - o - y - Both operating assets 1 , 2 and expansion assets 3 have achieved double digit growth Outpatient volume remain stable Total number of surgical procedures completed increased significantly by 43 %
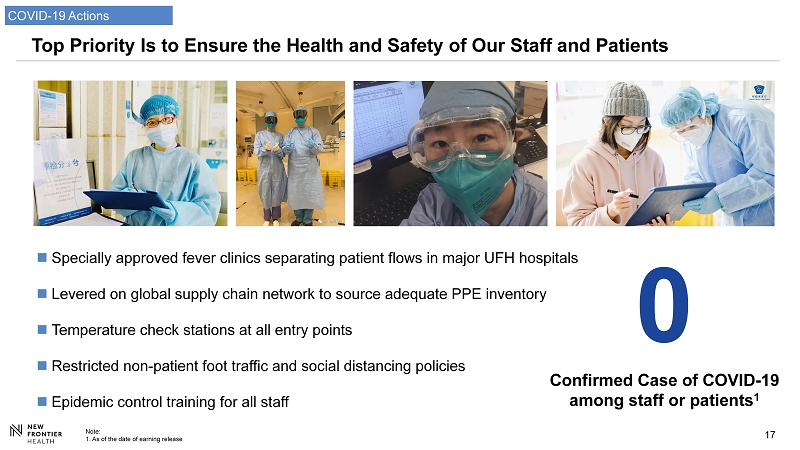
17 Top Priority Is to Ensure the Health and Safety of Our Staff and Patients Specially approved fever clinics separating patient flows in major UFH hospitals Levered on global supply chain network to source adequate PPE inventory Temperature check stations at all entry points Restricted non - patient foot traffic and social distancing policies Epidemic control training for all staff Confirmed Case of COVID - 19 among staff or patients 1 Note: 1. As of the date of earning release COVID - 19 Actions

18 Zhongnan Hospital of Wuhan University 武汉大学中南医院 Supporting the Frontline Medical Staff Across China In partnership with New Frontier Group and several strategic investors / partners Leveraged our global supply chain network to source urgently needed medical supplies Donated essential supplies to various hospitals and institutions at the front lines including 29 ICU ventilators with 750 breathing circuits and 32 breathing masks, 155 , 000 pairs of medical examination gloves, 50 , 000 N 95 masks, 3 , 960 goggles, and 185 reusable face shields : Leishenshan Hospital 雷神山医院 RenMin Hospital of Wuhan University 武汉大学人民医院 COVID - 19 Actions

19 Significant Development in Oncology and Other Higher Acuity Services We have been able to attract high acuity patients since the beginning of the pandemic, demonstrating the reputation and technical capabilities of UFH system Multiple high acuity surgical and ICU patients referred by external physicians from public hospitals treated at UFH hospitals since February New Hope Oncology Center grew significantly during COVID - 19 : COVID - 19 Actions New Hope Oncology Center +40% y - o - y +92% y - o - y Oncology Revenue Volume of New Oncology Patients 1 Note: 1. Including both chemo and radiotherapy
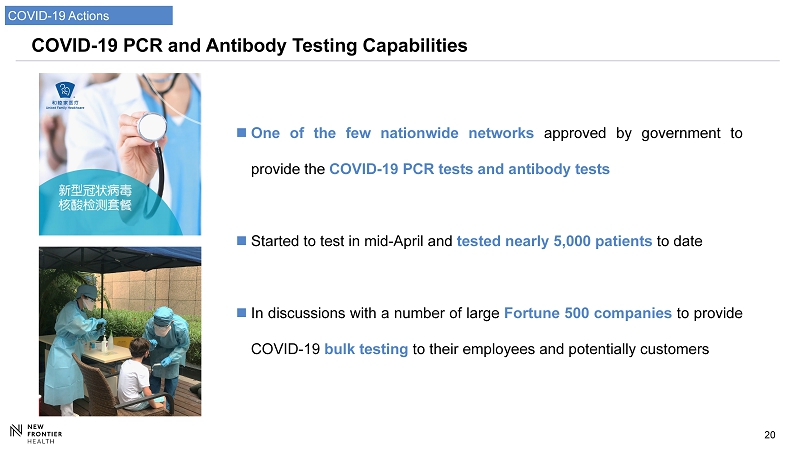
20 COVID - 19 PCR and Antibody Testing Capabilities One of the few nationwide networks approved by government to provide the COVID - 19 PCR tests and antibody tests Started to test in mid - April and tested nearly 5 , 000 patients to date In discussions with a number of large Fortune 500 companies to provide COVID - 19 bulk testing to their employees and potentially customers COVID - 19 Actions

21 Launched Online Consultation Service during the Pandemic Launched online consultations in February and covered more than 30 specialties In total ~5,000 online consultation s to date 1 - ~30% patients are new to UFH, and ~8% patients covert from online to offline - Existing patient offline re - visit rate over ~185% in May Online appointment increase by 265% in 2019 Number of Wechat followers has increased from 379.3K in 2019 to 639.6K by Q1 2020 Physician Selection Consultation Interface COVID - 19 Actions Note: 1. As of the date of earning release Aim to provide seamless online - offline medical experiences

22 22 Revenue is Recovering and Has Reached >93% of 2019 By Last Week in May 2019 2020 Q1 Wuhan Lift lock down 4 / 8 Chinese New Year 2019 Chinese New Year & Wuhan Lock down 1/23 B eijing lowered COVID - 19 emergency response to 2 nd level 4/30 - 42% - 25% - 7 % - 51% Post COVID - 19 Recovery Stage 1: COVID - 19 Impact Stage 2: Markets Recovery (except for Beijing) Stage 3: All Markets Recovery Turning Point Weekly Revenue (Y - o - y%) 1/18 1/25 2/1 2/8 2/15 2/22 2/29 3/7 3/14 3/21 3/28 4/4 4/11 4/18 4/25 5/2 5/9 5/16 5/24 Last Day of the Week

23 23 0 50 100 150 200 250 300 350 400 450 500 550 600 650 2000 2001 2002 2003 2004 2005 2006 2007 2008 2009 2010 Strong Recovery Post SARS in 2003 R evenue Picked Up Meaningfully Post SARS Outbreak Due to Higher Willingness to Spend on Premium Healthcare SARS epidemic Willingness to spend increased as people care more about health, are willing to pay for high quality healthcare services and to avoid overcrowded public hospitals Commercial healthcare insurance premium growth caused by the epidemic also supported the private healthcare service growth UFH’s reputation of providing quality of care , as well as government endorsement (designated clinics for fever treatment, approval to continue service provision, etc ) benefited UFH General awareness of the importance of healthcare and hygiene increased because of the epidemic General avoidance of overcrowded public hospitals Growth rate increase compared to pre SARS period A Number of Factors Drove Accelerated Growth UFH Revenue Doubled 2 Years Post SARS Revenue Pre/Post SARs (In million RMB ) Source: Company (Unaudited); China Insurance Regulatory Commission Post COVID - 19 Recovery
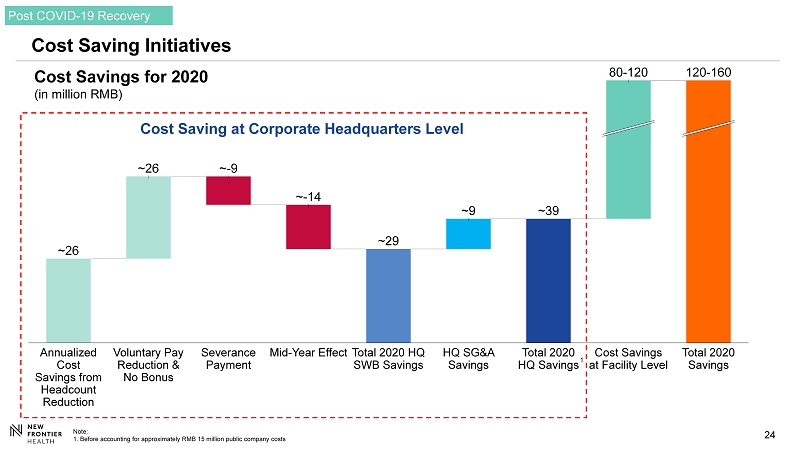
24 24 C ost Saving Initiatives Note: 1. Before accounting for approximately RMB 15 million public company costs Post COVID - 19 Recovery Cost Savings at Facility Level Total 2020 HQ SWB Savings ~ - 14 Voluntary Pay Reduction & No Bonus Annualized Cost Savings from Headcount Reduction 120 - 160 ~ - 9 80 - 120 ~ 29 Total 2020 HQ Savings HQ SG&A Savings Mid - Year Effect Total 2020 Savings Severance Payment ~ 9 ~ 26 ~ 26 ~ 39 Cost Savings for 2020 (in million RMB) Cost Saving at Corporate Headquarters Level 1

25 25 C ost Saving Initiatives (Cont’d) Note: 1. Excluding relocation of CCC from headquarter to Beijing market Corporate Headquarters Facility - Level Reduced HQ headcount by ~ 50 or ~ 28 % of total headcount 1 from April through June Estimated to achieve run - rate cost savings of ~ 26 million RMB going forward Additional voluntary salary reductions ranging between 20 - 30 % for senior management Went through “Zero - based budgeting” process and reduced SG&A by ~ 9 million RMB or by ~ 24 % comparing to 2019 Went through austerity drive process to review cost structure and SG&A spending Estimated to achieve cost savings of approximately RMB 80 - 120 million from social benefits waiver, rent reduction, vendor fee savings, as well as SG&A savings for 2020 Minimal headcount reduction at the UFH facilities considering the volume recovery trend and future growth roadmap Post COVID - 19 Recovery

26 26 Meaningful Synergy Created Through Beijing Market Restructuring Starting in March, Consolidated 3 Hospitals and 8 Clinics in Beijing Under a Unified Leadership Revenue Synergy Cost Savings Removed the redundant administrative roles and streamlined the reporting structure Optimized approximately 40 positions within BJM due to restructuring, with run - rate annual SWB saving of RMB 11 . 4 million Cross referral across different facilities . E . g . referring surgery, ortho or stroke patients from BJU to Rehab hospital . Centralized staffing arrangement to increase utilization rate of physician Post COVID - 19 Recovery

27 New Member of the Board and Chairman of Audit Committee The board of directors has appointed Lawrence Chia as an independent director and the chairman of audit committee, effective March 31, 2020 CEO of the Samling Group of Companies , which has businesses in automobiles, properties, timber, infrastructure, oil palm, oil, and gas, with operations in a number of countries globally Former CEO of Deloitte China : - Deloitte Touche Tohmatsu Limited (DTTL) Executive Committee based in New York - DTTL Asia Pacific Executive Committee based in Hong Kong Independent Non - Executive Director of BC Technology Group Limited, a publicly listed company on the Hong Kong Stock Exchange Chartered Accountant of the Institute of Chartered Accountants in England and Wales Member of the Hong Kong Institute of Certified Public Accountants Mr. Lawrence Chia Chairman of Audit Committee

28 Strategic Priorities in 2020 Geographic Market Reorganization and Consolidation Ramp - up of Newly Opened Facilities (Shanghai Puxi , Shanghai Pudong and Guangzhou) Invest in Core Markets and Expand Capabilities in Selected Specialties Invest in Digital Capabilities Expand Tier 1 City Outpatient Network Implement Cost Control / Business Recovery Post Coronavirus Prepare for the Launch of Beijing Datun Hospital and Shenzhen Hospital

29 29 Shanghai United Family Hospital Q1 2020 FINANCIAL RESULTS

30 Q1 Revenue Impacted by COVID - 10 Outbreak 23 43 55 69 74 82 65 61 71 79 84 87 83 93 96 64 391 429 405 434 435 477 437 462 302 18Q3 577 470 20Q1 18Q1 640 18 18Q2 18Q4 19Q1 562 19Q2 628 19Q3 19Q4 520 507 604 431 20 Operating Tier 1 Operating Tier 2 & Other Assets Expansion Revenue (in million RMB) - 25% 21% 19% 14% Y - o - y Growth - 31% - 27% 18% Y - o - y Growth
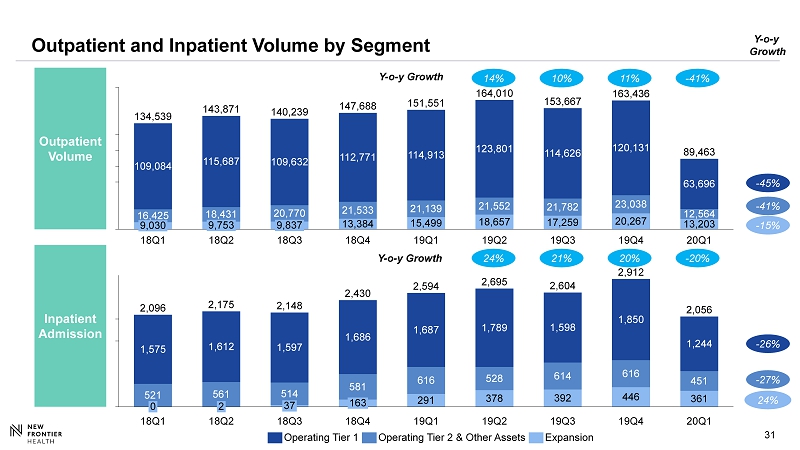
31 Outpatient and Inpatient Volume by Segment Outpatient Volume Inpatient Admission 521 291 378 392 446 361 1,575 561 514 581 616 528 614 616 451 1,612 1,597 1,686 1,687 1,789 1,598 1,850 1,244 2,096 37 2,175 18Q3 2,604 18Q1 2,912 18Q2 0 2 18Q4 19Q1 2,695 19Q2 19Q3 19Q4 2,148 2,430 2,594 20Q1 2,056 163 13,384 15,499 18,657 17,259 20,267 13,203 16,425 18,431 20,770 21,533 21,139 21,552 21,782 23,038 12,564 109,084 115,687 109,632 112,771 114,913 123,801 114,626 120,131 63,696 134,539 19Q2 140,239 18Q3 18Q4 164,010 18Q1 18Q2 19Q1 143,871 19Q3 19Q4 20Q1 147,688 151,551 153,667 163,436 89,463 9,030 9,753 9,837 - 41% 14% 10% 11% - 20% 24% 21% 20% - 45% - 41% - 15% Y - o - y Growth - 26% - 27% 24% Y - o - y Growth Y - o - y Growth Operating Tier 2 & Other Assets Operating Tier 1 Expansion

32 ASP 1 Increased in Q1 Due to Higher Acuity Procedures Outpatient ASP Inpatient ASP 83,932 89,969 19Q1 19Q3 20Q1 79,807 18Q3 19Q2 86,379 81,965 18Q1 89,755 92,964 19Q4 86,847 18Q4 18Q2 87,019 2,240 2,226 19Q2 2,608 18Q3 18Q2 2,358 18Q1 19Q1 2,267 19Q3 2,341 2,390 18Q4 2,383 20Q1 2,377 19Q4 9% 6% 4% 2% Y - o - y Growth 13% - 3% 4% - 3% Y - o - y Growth Y - o - y Growth Notes: 1.Average selling price
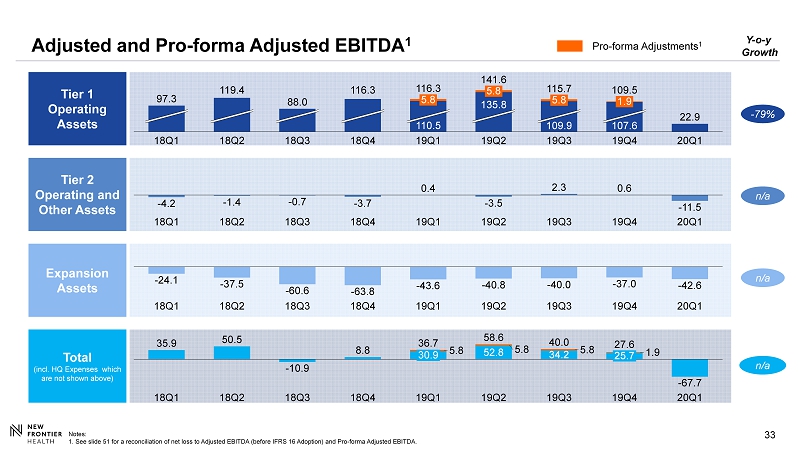
33 Adjusted and Pro - forma Adjusted EBITDA 1 Tier 1 Operating Assets Tier 2 Operating and Other Assets Expansion Assets Total (incl. HQ Expenses which are not shown above) 52.8 34.2 5.8 5.8 5.8 1.9 - 67.7 18Q2 18Q1 18Q3 18Q4 30.9 19Q1 19Q2 27.6 19Q3 25.7 19Q4 20Q1 35.9 50.5 - 10.9 8.8 36.7 58.6 40.0 - 24.1 - 37.5 - 60.6 - 63.8 - 43.6 - 40.8 - 40.0 - 37.0 - 42.6 18Q1 18Q2 19Q4 18Q3 18Q4 19Q3 19Q1 19Q2 20Q1 - 4.2 - 1.4 - 0.7 - 3.7 0.4 - 3.5 2.3 0.6 - 11.5 19Q4 18Q1 18Q2 19Q3 18Q4 18Q3 19Q1 19Q2 20Q1 116.3 19Q3 141.6 19Q4 18Q4 97.3 119.4 18Q3 18Q1 18Q2 109.5 5.8 19Q1 110.5 22.9 5.8 135.8 19Q2 5.8 1.9 109.9 107.6 20Q1 88.0 116.3 115.7 - 79% n/a n/a n/a Y - o - y Growth Pro - forma Adjustments 1 Notes: 1. See slide 51 for a reconciliation of net loss to Adjusted EBITDA (before IFRS 16 Adoption) and Pro - forma Adjusted EBITDA.
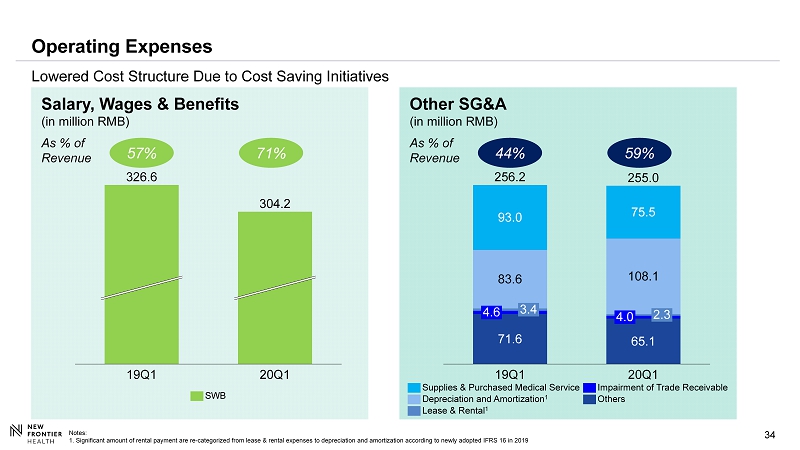
34 34 Operating Expenses L owered Cost Structure Due to Cost Saving Initiatives 19Q1 326.6 20Q1 304.2 SWB 57% As % of Revenue 71% Salary, Wages & Benefits (in million RMB) 71.6 65.1 83.6 108.1 93.0 75.5 19Q1 2.3 255.0 4.0 3.4 4.6 256.2 20Q1 Impairment of Trade Receivable Supplies & Purchased Medical Service Lease & Rental 1 Depreciation and Amortization 1 Others 44% As % of Revenue 59% Other SG&A (in million RMB) Notes: 1. Significant amount of rental payment are re - categorized from lease & rental expenses to depreciation and amortization according to newly adopted IFRS 16 in 2019

35 Strong Balance Sheet and Limited Cash Outflow in Q1 2020 Notes: 1. Adjusted cash spent for operating activities is defined as cash spent for operating activities less capital lease payments, a ddi ng back interest expense and one - off transaction related costs. See slide 50 for detailed reconciliation 2. Free cash flow is defined as operating cash flow less maintenance CAPEX Adj. Cash Spent for Operating Activities 1 Jan to Mar, 2020 - 61 RMB million Cash and Cash Equivalents As of Mar 31 st , 2020 1,438 RMB million Free Cash Flow 2 Jan to Mar, 2020 - 71 RMB million

36 36 Qingdao United Family Hospital GROWTH INITIATIVES

37 37 Managed Care Patient is paired with a Primary Care Provider Incentivizes pro - active prevention Aligns the interests of payer, provider and patient I ncentivizes chronic disease management I ncentivizes cost saving with no compromise on quality 1 2 3 4 5 Provider Patient Payer Shared Risk Model Partnering with patients to use pro - active approaches to keep them healthy Patients stay healthy and we have healthy margins Giving patients transparency and predictability in their healthcare expenditures Risk shared by UFH and insurer
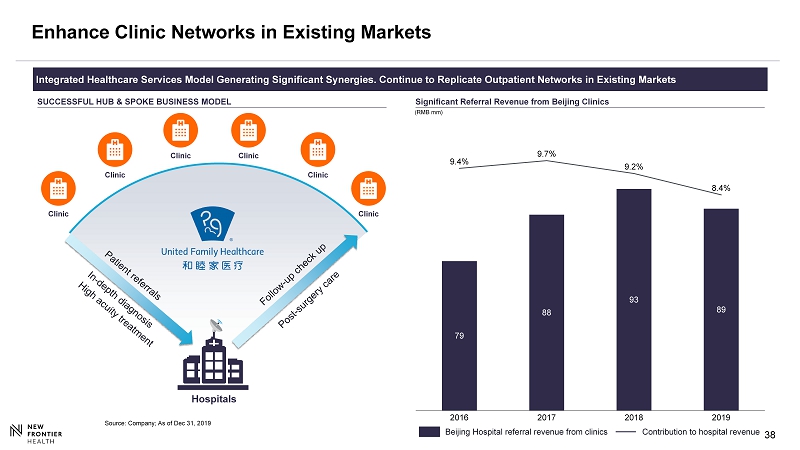
38 38 Enhance Clinic Networks in Existing Markets Integrated Healthcare Services Model Generating Significant Synergies. Continue to Replicate Outpatient Networks in Existing Mar kets Significant Referral Revenue from Beijing Clinics (RMB mm) SUCCESSFUL HUB & SPOKE BUSINESS MODEL Source: Company; As of Dec 31, 2019 Hospitals Clinic Clinic Clinic Clinic Clinic Clinic 79 88 93 89 9.4% 9.7% 9.2% 8.4% 2019 2016 2017 2018 Beijing Hospital referral revenue from clinics C ontribution to hospital revenue

39 39 Upside Catalysts Delivering Additional Value CLEAR SPECIALTY FOCUS Continue deep specialization in select areas but maintain a comprehensive suite of services Grow IVF from Tianjin to nationwide New centers of excellence: oncology, orthopedics, ENT, sleep center, geriatric center, gynecology, advanced surgical , etc. TECHNOLOGY UPGRADES M&A OPPORTUNITIES Strategic acquisitions of specialty hospitals, outpatient and services network to further complement our existing portfolio Management contracts include a right to acquire managed hospitals Focus on increasing acuity services (robotics, oncology, advance imaging) to drive ASP / margin and create higher barriers to competitors Develop internet hospital and online portal to further engage with patients Continued investment in the AI and mobile technology for data analytics, online consultation, risk underwriting, preventive care

40 40 Investment Highlights Well - established nationwide platform with scale and an experienced management platform 4 Attractive valuation on a sum - of - the - parts basis 5 Multi - dimensional growth opportunities 6 The leading comprehensive healthcare services provider with the most reputable brand in China 2 Robust outlook of the Chinese private healthcare industry supported by favorable long term secular drivers 1 Unique hospital + clinic hub & spoke network; “entire lifecycle” coverage 3

41 APPENDIX A - INDUSTRY OVERVIEW

42 42 REVENUE FOR HEALTHCARE SERVICES IN CHINA - HOSPITALS & PRIMARY CARE (US$ bn) 1 CAGR 13 - 18 (%) CAGR 18 - 23 (%) 22% 11% 21% 9% (US$ bn) 1 42% 58% 59% 59% 59% 60% 62% 41% 41% 41% 40% 38% Rapid Growth in Demand for Healthcare Services 23% 25% CAGR 17 - 23 (%) 20% 22% CAGR 13 - 17 (%) Source: NHFPC, Company Analysis 1. Exchange rate at USD:RMB = 1.00 : 6.80 2. Annual high - end medical spending by residents (Expatriate, Local out of Pocket, Local Insured Patients) in Tier 1 & Tier 2 ci ties of China Local out of Pocket is defined as affluent households with annual income > RMB 324K Assumed addressable population all live in Tier 1 and Tier 2 cities; Tier 1 cities: Beijing, Shanghai, Guangzhou and Shenzhen ; Tier 2 cities: 46 cities incl. Tianjin, Nanjing, Hangzhou, Chongqing, Chengdu, Ningbo and etc. PREMIUM HEALTHCARE EXPENDITURE 2 IN CHINA 2023E 488 2013A 8% 389 340 2014A 92% 2015A 91% 2016A 88% 434 1,009 90% 2017A 89% 12% 544 2018A 609 10% 8% 9% 19% 11% 92% 81% Private Public 41% 59% 42% 58% 41% 2013A 2014A 59% 62% 2015A 41% 59% 2016A 40% 60% 2017A 38% 2023E 5 7 8 10 13 40 1st tier 2nd tier

43 43 China is Under - penetrated in Private Healthcare 0 5 10 15 20 25 30 35 40 45 50 55 60 65 70 75 80 85 300 700 500 600 900 1,000 1,100 400 1,300 1,200 800 5,300 0 Germany SOUTH AFRICA Spain Private healthcare spending per capita (US$) Taiwan South Korea GDP per capita (US$ ‘000) Canada Japan United States Singapore China France Switzerland BRAZIL Australia Asia NA EU LatAm & Africa AU South Africa and Brazil have lower/comparable income but higher spending than China China Tier 1 1 Source: EIU, Euromonitor, BMI, Hong Kong Food and Health Bureau; A s of 2017 1. Tier 1 cities include Beijing, Shanghai, Guangzhou and Shenzhen. Private healthcare spending per capita assumed to mirror pri vate vs. public hospital revenue trends in China Countries and Regions
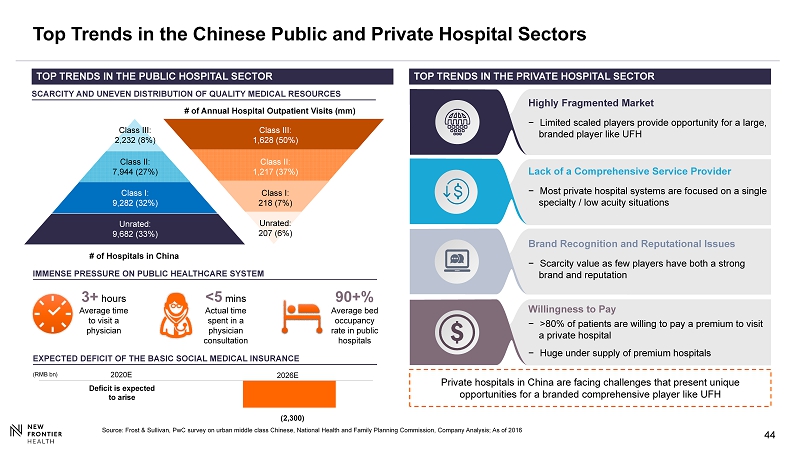
44 44 (2,300) ( RMB bn ) Top Trends in the Chinese Public and Private Hospital Sectors Source: Frost & Sullivan, PwC survey on urban middle class Chinese, National Health and Family Planning Commission, Company A nal ysis; As of 2016 SCARCITY AND UNEVEN DISTRIBUTION OF QUALITY MEDICAL RESOURCES IMMENSE PRESSURE ON PUBLIC HEALTHCARE SYSTEM 3+ hours Average time to visit a physician 90+% Average bed occupancy rate in public hospitals <5 mins Actual time spent in a physician consultation Class III: 2,232 (8%) Class II: 7,944 (27%) Class I: 9,282 (32%) Unrated: 9,682 (33%) # of Annual Hospital Outpatient Visits (mm) Class III: 1,628 (50%) Class II: 1,217 (37%) Class I: 218 (7%) Unrated: 207 (6%) # of Hospitals in China EXPECTED DEFICIT OF THE BASIC SOCIAL MEDICAL INSURANCE 2020E 2026E Deficit is expected to arise TOP TRENDS IN THE PRIVATE HOSPITAL SECTOR Private hospitals in China are facing challenges that present unique opportunities for a branded comprehensive player like UFH Lack of a Comprehensive Service Provider − Most private hospital systems are focused on a single specialty / low acuity situations Highly Fragmented Market − Limited scaled players provide opportunity for a large, branded player like UFH Willingness to Pay − >80% of patients are willing to pay a premium to visit a private hospital − Huge under supply of premium hospitals Brand Recognition and Reputational Issues − Scarcity value as few players have both a strong brand and reputation TOP TRENDS IN THE PUBLIC HOSPITAL SECTOR

45 45 25 40 64 103 314 106 139 183 240 483 131 179 247 343 797 90 109 155 212 303 7% 8% 11% 15% 22% 0 200 400 2000A 2010A 2020E 2030E 2040E Population Aged 65+ as % of Total Population Aging Population and Commercial Healthcare Insurance are Key Long - Term Growth Drivers of Healthcare Services 15% 28% CAGR 18 - 23 (%) 15% 25% CAGR 12 - 18 (%) RAPIDLY AGING POPULATION China population aged 65+ (Persons mm) HIGH - END PHI 2 ADDRESSABLE POPULATION ('000) COMMERCIAL HEALTH INSURANCE GWP 1 (US$ bn) 2 China Population Aged 65+ (Persons mm) 2012A 2014A 2016A 2018E 2023E Source: United Nations, China Insurance Yearbook, CIRC, McKinsey Global Institute, Company Analysis 1. Include all local and foreign players. Health insurance GWP (gross written premium) includes premium sold by both life and P& C insurers 2. PHI = Private Health Insurance 3. Exchange rate at USD:RMB = 1.00 : 6.80 Tier 1 cities Tier 2 cities 2023E 2012A 13 2016A 2014A 2018E 23 59 94 294
46 46 APPENDIX B – ADDITIONAL MATERIALS

47 47 Summary Shareholder Structure 1,2 of NFH 7% 11% 7% 4% 10% 61% New Frontier Group Other Public Investors Vivo Capital Capital Group Fosun UFH Management Free Float (%) ~90 Note : 1 . 131 mm s hares outstanding before accounting for roll - over NFH ESOP from UFH management and SPAC warrants (currently out - of - the - money) 2 . As a result of the execution of the Fosun Director Nomination Agreement, Vivo Director Nomination Agreement, Irrevocable Proxies, and Director Support Letter Agreements, each Reporting Person may be deemed to be members of a “group” within the meaning of Section 13 (d)( 3 ) of the Exchange Act with NFPH, Vivo LP and Fosun with respect to the election of directors of the Issuer as described in Item 4 of this Amendment No . 1 . As a result, the group may be deemed to have acquired beneficial ownership of all the Ordinary Shares beneficially owned by each member of the “group” and each Reporting Person may be deemed to beneficially own all of the Ordinary Shares beneficially owned by the group . As such, the group may be deemed to beneficially own in the aggregate 81 , 096 , 625 Ordinary Shares, which represents approximately 55 . 5 % of the total outstanding Ordinary Shares .
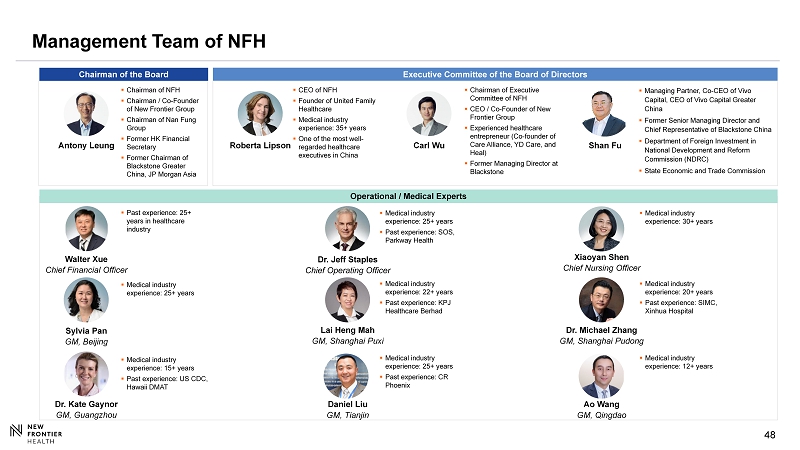
48 48 Management Team of NFH Roberta Lipson Antony Leung Carl Wu Executive Committee of the Board of Directors ▪ CEO of NFH ▪ Founder of United Family Healthcare ▪ Medical industry experience: 35+ years ▪ One of the most well - regarded healthcare executives in China ▪ Chairman of NFH ▪ Chairman / Co - Founder of New Frontier Group ▪ Chairman of Nan Fung Group ▪ Former HK Financial Secretary ▪ Former Chairman of Blackstone Greater China, JP Morgan Asia ▪ C hairman of Executive Committee of NFH ▪ CEO / Co - Founder of New Frontier Group ▪ Experienced healthcare entrepreneur (Co - founder of Care Alliance, YD Care, and Heal) ▪ Former Managing Director at Blackstone Operational / Medical Experts Sylvia Pan GM, Beijing ▪ Medical industry experience: 25+ years ▪ Medical industry experience: 15+ years ▪ Past experience: US CDC, Hawaii DMAT Dr. Kate Gaynor GM, Guangzhou ▪ Past experience: 25+ years in healthcare industry Walter Xue Chief Financial Officer Dr. Jeff Staples Chief Operating Officer ▪ Medical industry experience: 25+ years ▪ Past experience: SOS, Parkway Health ▪ Medical industry experience: 22+ years ▪ Past experience: KPJ Healthcare Berhad Lai Heng Mah GM, Shanghai Puxi Daniel Liu GM, Tianjin ▪ Medical industry experience: 25+ years ▪ Past experience: CR Phoenix ▪ Medical industry experience: 20+ years ▪ Past experience: SIMC, Xinhua Hospital Dr. Michael Zhang GM, Shanghai Pudong Xiaoyan Shen Chief Nursing Officer ▪ Medical industry experience: 30+ years ▪ Medical industry experience: 12+ years Ao Wang GM, Qingdao Chairman of the Board Shan Fu ▪ Managing Partner, Co - CEO of Vivo Capital, CEO of Vivo Capital Greater China ▪ Former Senior Managing Director and Chief Representative of Blackstone China ▪ Department of Foreign Investment in National Development and Reform Commission (NDRC) ▪ State Economic and Trade Commission
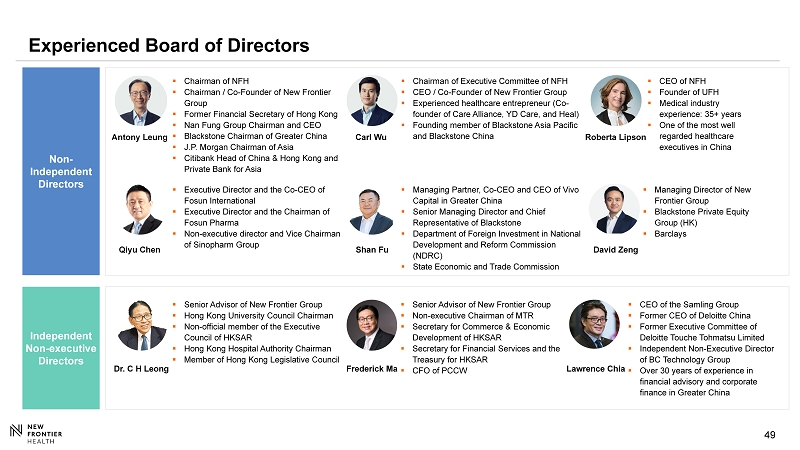
49 49 Experienced Board of Directors Independent Non - executive Directors Antony Leung Carl Wu Non - Independent Directors ▪ Managing Director of New Frontier Group ▪ Blackstone Private Equity Group (HK) ▪ Barclays David Zeng ▪ Chairman of NFH ▪ Chairman / Co - Founder of New Frontier Group ▪ Former Financial Secretary of Hong Kong ▪ Nan Fung Group Chairman and CEO ▪ Blackstone Chairman of Greater China ▪ J.P. Morgan Chairman of Asia ▪ Citibank Head of China & Hong Kong and Private Bank for Asia ▪ Chairman of Executive Committee of NFH ▪ CEO / Co - Founder of New Frontier Group ▪ Experienced healthcare entrepreneur (Co - founder of Care Alliance, YD Care, and Heal) ▪ Founding member of Blackstone Asia Pacific and Blackstone China Roberta Lipson Shan Fu Qiyu Chen ▪ CEO of NFH ▪ Founder of UFH ▪ Medical industry experience: 35+ years ▪ One of the most well regarded healthcare executives in China ▪ Managing Partner, Co - CEO and CEO of Vivo Capital in Greater China ▪ Senior Managing Director and Chief Representative of Blackstone ▪ Department of Foreign Investment in National Development and Reform Commission (NDRC) ▪ State Economic and Trade Commission ▪ Executive Director and the Co - CEO of Fosun International ▪ Executive Director and the Chairman of Fosun Pharma ▪ Non - executive director and Vice Chairman of Sinopharm Group Dr. C H Leong Frederick Ma ▪ Senior Advisor of New Frontier Group ▪ Hong Kong University Council Chairman ▪ Non - official member of the Executive Council of HKSAR ▪ Hong Kong Hospital Authority Chairman ▪ Member of Hong Kong Legislative Council ▪ Senior Advisor of New Frontier Group ▪ Non - executive Chairman of MTR ▪ Secretary for Commerce & Economic Development of HKSAR ▪ Secretary for Financial Services and the Treasury for HKSAR ▪ CFO of PCCW ▪ CEO of the Samling Group ▪ Former CEO of Deloitte China ▪ Former Executive Committee of Deloitte Touche Tohmatsu Limited ▪ Independent Non - Executive Director of BC Technology Group ▪ Over 30 years of experience in financial advisory and corporate finance in Greater China Lawrence Chia

50 Reconciliation of Operating Cash Flow to Free Cash Flow (RMB million) 1Q20 Operating Cash Flow & Free Cash Flow: Operating Cash Flow (237) Less: Capital Lease Payments (3) (53) Add: Interest Expense 49 Add: One - off Transaction Expense 180 Adjusted Operating Cash Flow (61) Less: Maintenance CAPEX (10) Free Cash Flow (71) CAPEX: Maintenance CAPEX (1) 10 Expansionary CAPEX (2) 5 Total CAPEX 15 Notes: (1) Expansionary capex is defined as capex spent for building new facilities including the new site of Shanghai Puxi Hospital, Shanghai Pudong Hospital, Guangzhou Hospital and Beijing Datun Hospital. (2) Maintenance capex is defined as all capex spent for existing operations of the facilities. (3) Due to IFRS 16 adoption, capital lease payments is categorized as cash used for financing activities.

51 51 Reconciliation of Non - IFRS Financial Measures Notes: 1. Monitoring fee payable to TPG and Fosun is not related to business operation and is discontinued from 2020 onwards 2. The adjustments include ( i ) giving a pro forma effect to annual rent reimbursement of approximately RMB15 million which took effect in November 2019 as if such reimbursement commenced on January 1, 2019, (ii) adding back RMB 3.7 million for additional rental expenses incurred prior to the PXU relocation due to space constraints, and (iii) RMB 3.7 milli on of ongoing net savings on fees payable to our business partner for this property in accordance with the rental reimbursement. For the quarter ended 31 December For the year ended 31 December For the quarter ended 31 March 2019 2019 2019 2020 Net loss (223.0) (430.0) (46) (169) Less: Finance income (1.0) (2.0) (1) - Add: Finance costs 54.0 157.0 35 72 Add: Other losses (gains) (13.0) 9.0 (12) (17) Add: Other expense (income), net 13.0 6.0 - (7) Add: Income tax expense 7.0 63.0 18 (7) Operating loss (163.0) (198.0) (6) (128) Add: Share-based compensation 2.0 34.0 3 3 Add: Depreciation and amortization 88.0 342.0 84 108 Add: Discontinued monitoring fee payable to Fosun Pharma and TPG 1 1.0 4.0 1 - Add: One-off transaction costs 147.0 160.0 - 1 Add: Relocation costs of New Puxi Hospital 3.0 6.0 - - Adjusted EBITDA 79.0 349.0 82 (16) Less: Lease expense adjustments as a result of IFRS 16 adoption (53.0) (205.0) (51) (52) Adjusted EBITDA (before IFRS 16 adoption) 26.0 144.0 31 (68) Add: PXU Pro-forma Adjustments 2 2.0 19.0 Pro-forma Adjusted EBITDA 28.0 163.0 31 (68) (in RMB million)
Serious News for Serious Traders! Try StreetInsider.com Premium Free!
You May Also Be Interested In
- Canadian Pink Floyd Tribute Band Floydium Performance At Summer Venues Announced
- Pre-Investor Call Presentation available to shareholders
- Sobi Q1 2024 report: Strong sales reflecting the strength of the portfolio
Create E-mail Alert Related Categories
SEC FilingsSign up for StreetInsider Free!
Receive full access to all new and archived articles, unlimited portfolio tracking, e-mail alerts, custom newswires and RSS feeds - and more!
