

Form 6-K New Frontier Health Corp For: Feb 19
 Tweet
Tweet Share
Share
FORM 6-K
SECURITIES AND EXCHANGE COMMISSION
Washington, D.C. 20549
Report of Foreign Private Issuer
Pursuant to Rule 13a-16 or 15d-16 of
the Securities Exchange Act of 1934
For the month of February, 2020
Commission File Number: 001-38562
NEW FRONTIER
HEALTH CORPORATION
(Translation of Registrant’s Name into English)
10 Jiuxianqiao Road,
Hengtong Business Park
B7 Building, 1/F
Chaoyang District, 100015,
Beijing, China
(Address of principal executive office)
Indicate by check mark whether the registrant
files or will file
annual reports under cover of Form 20-F or Form 40-F:
Form 20-F x Form 40-F ¨
Indicate by check mark if the registrant
is submitting the Form 6-K
in paper as permitted by Regulation S-T Rule 101(b)(1):
Yes ¨ No x
Indicate by check mark if the registrant
is submitting the Form 6-K
in paper as permitted by Regulation S-T Rule 101(b)(7):
Yes ¨ No x
INFORMATION CONTAINED IN THIS FORM 6-K REPORT
Attached as Exhibit 99.1 hereto is a presentation that representatives of New Frontier Health Corporation plan to use with investors.
EXHIBIT INDEX
| Exhibit | Description of Exhibit |
| 99.1 | Investor Presentation. |
SIGNATURES
Pursuant to the requirements of the Securities Exchange Act of 1934, as amended, the registrant has duly caused this report to be signed on its behalf by the undersigned, thereunto duly authorized.
| New Frontier Health Corporation | |||
| By: | /s/ Roberta Lipson | ||
| Name: | Roberta Lipson | ||
| Title: | Chief Executive Officer | ||
Date: February 19, 2020
Exhibit 99.1

1 1 Introduction to New Frontier Health Corp. (NYSE: NFH) Jan 2020

2 2 DISCLAIMER Forward - Looking Statements This presentation includes “forward - looking statements” within the meaning of the “safe harbor” provisions of the Private Securi ties Litigation Reform Act of 1995. The actual results of New Frontier Health Corporation (the “Company”) may differ from the Company’s expectations, estimates and projections and consequently, yo u s hould not rely on these forward - looking statements as predictions of future events. Words such as “expect”, “estimate”, “project”, “budget”, “forecast”, “anticipate”, “intend”, “p lan ”, “may”, “will”, “could”, “should”, “believes”, “predicts”, “potential”, “continue”, and similar expressions are intended to identify such forward - looking statements. These forward - looking statements involve signi ficant risks and uncertainties that could cause the actual results to differ materially from the expected results, including, but not limited to, the Company’s ability to manage growth; the Compa ny’ s ability to execute its business plan, including its planned expansions, and meet its projections; rising costs adversely affecting the Company’s profitability; potential litigation involving the Co mpa ny; general economic and market conditions impacting demand for the Company’s services, and in particular economic and market conditions in the Chinese healthcare industry and changes in the ru les and regulations that apply to such business, including as it relates to foreign investments in such businesses; and other risks and uncertainties indicated from time to time in the Compa ny’ s filings with the U.S. Securities and Exchange Commission (the “SEC”). Most of these factors are outside of the Company’s control and are difficult to predict. The Company cautions readers no t to place undue reliance upon any forward - looking statements, which speak only as of the date made. The Company does not undertake or accept any obligation or undertaking to release publi cly any updates or revisions to any forward - looking statements to reflect any change in its expectations or any change in events, conditions or circumstances on which any such statement is ba sed , except as required by law. Use of Projections This presentation contains financial projections that were prepared on or about October 24, 2019 and do not take into account an y circumstances or events occurring after such date. The projections are included herein for illustrative purposes and should not be relied upon as being necessarily indicative of fu tur e results. The projections were not prepared in conformity with accounting principles generally accepted in the United States or the International Financial Reporting Standards as adopted b y t he International Accounting Standards Board (“IFRS”). The Company’s independent auditor has not studied, reviewed, compiled or performed any procedures with respect to the projections fo r the purpose of their inclusion in this presentation, and accordingly, they have not expressed an opinion or provided any other form of assurance with respect thereto for the purpose of this presentation. The assumptions and estimates underlying the prospective financial information are inherently uncertain and are subject to a wide variety of significant business, economi c a nd competitive risks and uncertainties, many of which are outside of the Company’s control, that could cause actual results to differ materially from those contained in the prospective financial in formation. Projections are inherently uncertain due to a number of factors. Accordingly, there can be no assurance that the prospective results are indicative of the Company’s future performan ce or that actual results will not differ materially from those presented in the prospective financial information. Inclusion of the prospective financial information in this presentation should not be reg arded as a representation by any person that the results contained in the prospective financial information will be achieved. The Company disclaims any intention or obligation to update or otherwise rev ise or reconcile any financial projections whether as a result of new information, future events or otherwise. Industry and Market Data In this presentation, we rely on and refer to information and statistics regarding market participants in the sectors in whic h t he Company competes and other industry data. The Company obtained this information and statistics from third - party sources, including reports by market research firms and company filings.

3 3 DISCLAIMER (CONT'D) Use of Non - IFRS Financial Matters This presentation includes certain financial measures, including Adjusted EBITDA, that were not calculated in accordance with IF RS. Adjusted EBITDA is defined as net income (loss) plus ( i ) depreciation and amortization, (ii) finance expense/(income), (iii) other gains or losses, (iv) other expenses (such as share - ba sed compensation), and (v) provision for income taxes, as further adjusted for (vi) certain monitoring fees paid to certain shareholders, and (vii) lease expense adjustment as a result of ado pti on of IFRS 16, and (viii) transaction costs. The Company believes that these non - IFRS financial measures to be useful to investors for two principal reasons. First, the Company believes these measure s may assist investors in comparing performance over various reporting periods on a consistent basis by removing from operating results the impact of items that do not reflect core opera tin g performance. Second, this measure is used by the Company’s management to assess its performance and may (subject to the limitations described below) enable investors to compare the per for mance of the Company to its competition. The Company believes that the use of these measures provides an additional tool for investors to use in evaluating ongoing operating resu lts and trends. Non - IFRS measures should not be considered in isolation from, or as an alternative to, financial measures determined in accordance with IFRS. Other companies may calculate Adjusted EBI TDA and other non - IFRS financial measures differently, and therefore the Company’s non - IFRS financial measures may not be directly comparable to similarly titled measures of other compani es. For additional information and a reconciliation of these non - IFRS financial measures to the nearest comparable IFRS financial measures, see the section entitled “EBITDA Reconciliation” i n t he Appendix at the end of this presentation. A reconciliation of non - IFRS forward looking information to their corresponding IFRS measures cannot be provided without unreaso nable effort because of the inherent difficulty of accurately forecasting the occurrence and financial impact of the various adjusting items necessary for such reconciliation that have no t y et occurred, are out of our control, or cannot be reasonably predicted.

4 4 COMPANY OVERVIEW INDUSTRY OVERVIEW VALUATION AND VALUE CREATION APPENDIX TABLE OF CONTENTS
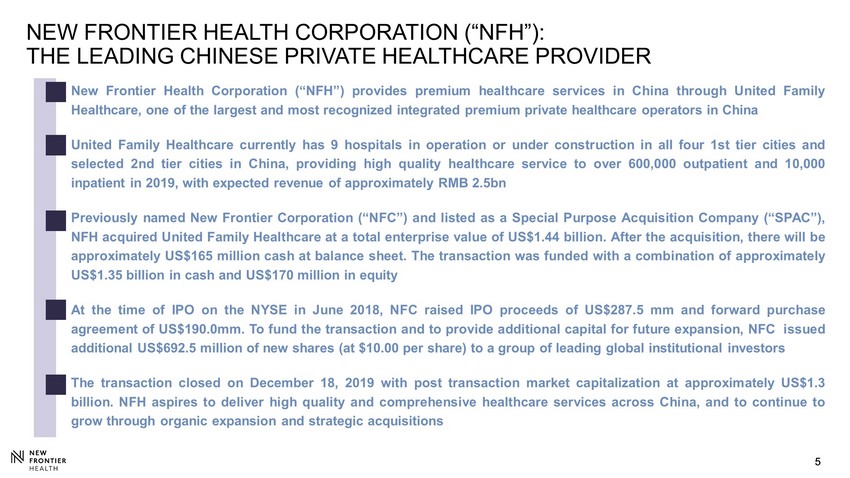
5 5 NEW FRONTIER HEALTH CORPORATION (“NFH”): THE LEADING CHINESE PRIVATE HEALTHCARE PROVIDER ▪ New Frontier Health Corporation (“NFH”) provides premium healthcare service s in China through United Family Healthcare, one of the largest and most recognized integrated premium private healthcare operators in China ▪ United Family Healthcare currently has 9 hospitals in operation or under construction in all four 1 st tier cities and selected 2 nd tier cities in China, providing high quality healthcare service to over 600 , 000 outpatient and 10 , 000 inpatient in 2019 , with expected revenue of approximately RMB 2 . 5 bn ▪ Previously named New Frontier Corporation (“NFC”) and listed as a Special Purpose Acquisition Company (“SPAC”), NFH acquired United Family Healthcare at a total enterprise value of US $ 1 . 44 billion . After the acquisition, there will be approximately US $ 165 million cash at balance sheet . The transaction was funded with a combination of approximately US $ 1 . 35 billion in cash and US $ 170 million in equity ▪ At the time of IPO on the NYSE in June 2018 , NFC raised IPO proceeds of US $ 287 . 5 mm and forward purchase agreement of US $ 190 . 0 mm . To fund the transaction and to provide additional capital for future expansion, NFC issued additional US $ 692 . 5 million of new shares (at $ 10 . 00 per share) to a group of leading global institutional investors ▪ The transaction closed on December 18 , 2019 with post transaction market capitalization at approximately US $ 1 . 3 billion . NFH aspires to deliver high quality and comprehensive healthcare services across China, and to continue to grow through organic expansion and strategic acquisitions

6 6 Beijing United Family Hospital North ( 2020 ) COMPANY OVERVIEW

7 7 THE LEADING PRIVATE HEALTHCARE SERVICES PROVIDER IN CHINA COMPREHENSIVE SERVICE OFFERING covering 30+ specialties 9 hospitals 1 18 clinics 1 1,000+ licensed beds 600+ physician staff 1000+ physician consultants 2019E outpatient visits: ~ 670,000 2019E inpatient visits: ~ 12,000 Operating Assets 2 2019E Adjusted EBITDA: RMB 469mm 2015A - 2018A CAGR: 34.9% Source: Company; As of Dec 31, 2018 1 . I ncludes 2 hospitals under construction, 14 directly operated clinics and 4 clinics located in the central business districts of Shanghai, Guangzhou, Shenzhen and Hong Kong that are currently operated by the private vehicle of New Frontier Group . New Frontier and UFH expect that NFH will acquire or manage (under management contract) these 4 clinics following the closing of the business combination ; acquisition will be done at valuation that approximates cumulative investment cost of these clinics 2 . Operating assets include Beijing, Shanghai Puxi , Tianjin, Qingdao and Beijing Rehab Hospitals as well as B o’Ao and Hangzhou Clinics and post - partum care worker business 3 . All hospital and clinics with at least 3 years of operating experience are accredited or re - accredited on a 3 - year cycle . The newest Qingdao and Shanghai Pudong hospitals were not yet eligible in the 2017 audit, but Qingdao will be included in the 2020 audit and Pudong will be eligible in the next cycle . One of the LARGEST private healthcare services providers in China by revenue 2019E total revenue : RMB ~ 2.5bn 2015A - 2018A CAGR: 13.8% 1 1 TOP - RANKED brand among high - end private hospitals ALL 3 JCI accredited Beijing United Family ONLY JCI and CAP accredited hospital FIRST da Vinci and MAKO in private hospital GCP certification from CFDA for conducting clinical drug trials

8 8 5 Hospitals Hub Spoke 8 Clinics Hub - and - Spoke Model 2 Hospitals Hub Spoke 5 Clinics 3 Hub - and - Spoke Model 2 Hospitals Hub Spoke 5 Clinics 3 Hub - and - Spoke Model Beijing Tianjin Qingdao Guangzhou Hangzhou Hainan Shenzhen 2 Shanghai Hong Kong 3 Source: Company 1. 5 hospitals in Beijing Cluster including Qingdao United Family 2. UFH is expected to be given the exclusive right to manage New Frontier Group’s 64,000 sq. meter flagship Shenzhen city cen ter hospital as part of the transaction 3. Includes 4 clinics located in the central business districts of Shanghai, Guangzhou, Shenzhen and Hong Kong that are curre ntl y operated by the private vehicle of New Frontier Group. New Frontier and UFH expect that NFH will acquire or manage (under management contract) these 4 clinics following the closing of the business combination; acquisition will be done at va lua tion that approximates cumulative investment cost of these clinics Broad geographic coverage across all four Tier 1 cities Strategic opportunity for expansion into Tier 2 cities GREATER BAY CLUSTER SHANGHAI CLUSTER + EAST CHINA BEIJING CLUSTER + NORTH CHINA 1 Disciplines Across Centers: Dental, Dermatology, Emergency Care, Family Medicine, Internal Medicine, OB/GYN, Pediatrics, Rehab, Postpartum Rehab, Radiology, Surgery, Orthopedics, Urology, and others NATIONWIDE GEOGRAPHIC FOOTPRINT

9 9 Expat 46% Local 54% BROADER ADDRESSABLE MARKET WITH MORE LOCAL PATIENTS 3 Commercial Insurance 39% Self - pay 61% DIVERSIFIED FOUNDATION FOR FUTURE GROWTH Expat 31% Local 69% MULTI - SPECIALTY SERVICE OFFERING 1 2018A Source: Company 1. OB/GYN: Obstetrics and Gynecology; Peds: Pediatrics; Ortho: Orthopaedics; FM: Family Medicine; IM: Internal Medicine; ER: Eme rgency Room; PPR: Post - Partum Rehab 2. Split by revenue from insurance / self - pay patients 3. Split by volume of expat and local Chinese patients REVENUE MIX BETWEEN SERVICE & PHARMACY 2018A OB/GYN 23% Peds 16% Surgery 8% Ortho 7% FM 9% IM 8% ER 7% PPR 3% Others 19% 2014 2018A DIVERSIFIED PAYER STRUCTURE 2 Pharmacy 13.0% Service 87.0% 2018A

10 10 Potential for Dermatology, ENT 1 , Ophthalmology & New Hope Oncology Centre New Specialties Revenue driven by high acuity departments including Orthopedics & Surgery High Acuity COMPREHENSIVE PROVIDER WITH ENTIRE "LIFECYCLE" COVERAGE 162 299 2014 2018A Surgery Orthopedics HUB - AND - SPOKE MODEL CREATES COMPREHENSIVE HEALTHCARE SERVICES PLATFORM WITH MULTIPLE PATIENT TOUCHPOINTS Clinics 51 89 2014 2018A Ophthalmology ENT Dermatology Home Health Attracting traffic with OB/GYN and Pediatrics 483 783 2014 2018A Pediatrics OB/GYN Revenue (RMB mm) Prenatal Care Pediatrics OB/ GYN 1 Expanding differentiated services complemented by Rehabilitation and PPR PPR 1 Rehabilitation 14 88 2014 2018A PPR Rehabilitation Broader patient base built up by Family Medicine 112 176 2014 2018A Family Medicine Family Medicine Dental Source: Company 1. OB/GYN: Obstetrics and Gynecology; ENT: Ear, Nose and Throat; PPR: Post - Partum Rehabilitation Hospitals

11 11 UFH Clifford Distinct Healthcare iBorn Elisabeth Bupa 1.85 1.55 1.53 1.50 1.08 1.48 UFH American- Sino Landseed St. Michael Jiahui Parkway 1.75 1.64 1.55 1.38 1.30 1.38 THE MOST REPUTABLE PRIVATE HEALTHCARE BRAND IN CHINA RANKS TOP FOR MEDICAL QUALITY AMONG HIGH - END PRIVATE HOSPITALS BY PATIENTS, DOCTORS AND GOVERNMENT REGULATORS Source: Company, Company Analysis 1. Survey Question 4: Please force rank the following private hospital brands’ medical quality? Screening criteria: Have had any kind of medical treatment in private hospital in past 36 months 2. Scoring methods: a) Score 5 for brand ranked 1 st ; Score 3 for brand ranked 2 nd ; Score 1 for brand ranked 3 rd ; b) Divide summed score by the number of respondents 3. Sample size for Beijing, Shanghai and Guangzhou were 105, 110 and 62 respectively RANKING SCORE OF PRIVATE BRANDS AMONG MONTHLY HOUSEHOLDS INCOME >RMB 27K 1,2,3 BEIJING UFH AmCare Parkway New Century HarMoniCare Oasis SHANGHAI GUANGZHOU 1.64 1.37 1.30 1.28 1.03 1.25 UFH UFH Landseed ; 2003 – The designated healthcare institution for foreigners during the SARS period ; 2010 – Official designated medical institutions for the Shanghai World Expo ; 2015 - Named as Most Investment - Worthy Healthcare Company ; 2016 – Ranked No.1 in China Top 100 Private Hospitals UFH American - Sino ; 2016 – Ranked No.2 in China Private Hospital Valuable Brands ; 2016 – Ranked No.18 in China Private Hospital Conglomerates Top 50 League ; 2018 – The designated Well - Known Trademark ; 2018 - Ranked No.1 repeatedly as The Best Employer among all private hospitals

12 12 Ranking AmCare Beijing 4 Peking University Intl. Hospital 10 New Century Healthcare 24 Beijing UFH 1 BEST SALARY PACKAGE MOST REPUTABLE BRAND PLATFORM FOR HIGHEST CALIBER MEDICAL TALENT SALARY PACKAGE, BRAND NAME AND WORKING ENVIRONMENT ARE THREE MOST IMPORTANT FACTORS FOR CAREER CONSIDERATIONS BY PHYSICIANS Source: China Private Healthcare Branding Value Ranked by DXY.com, Company, Company Analysis 1. Sample size of 274 2. A private (mid market) specialty brain hospital 3. Also first to have Da Vinci and MAKO among all private hospitals in China 4. By the end of first half in 2019 TOP - RANKED AMONG PRIVATE HEALTHCARE PROVIDERS 1 1 35 6 6 UFH Sanbo AmCare Beijing 19 9 4 UFH Parkway Int'l SOS Shanghai UFH UFH TOP - RANKED AMONG PHYSICIANS 2 1 ECONOMICS, BRAND AND CAREER OPPORTUNITIES ARE THE KEY FACTORS FOR ATTRACTING THE BEST PHYSICIANS BEST WORKING ENVIRONMENT ; Equipped with advanced facilities – One of only 2 da Vinci in private hospitals 3 in China – One of only 3 MAKO in China 3 ; UFH physicians spend an average of ~20 min per outpatient appointment , as opposed to the average less than 5 min consultation available in public hospitals ; Substantially low physician churn rate 4 , 3%, 5%, 4% and 0% for UFH Beijing, Shanghai Puxi , Shanghai Pudong and Guangzhou hospitals respectively STRONG MEDICAL NETWORK WITH REPUTABLE PARTNERS (% of response) A 2 Shanghai UFH 3 Guangzhou UFH 14 S hanghai Pudong UFH 31 B C D ~1.5 - 1.6x x UFH Public Hospitals ANNUAL INCOME OF CHIEF PHYSICIAN (PRE - TAX) Other Income ~1.2 - 1.3x x UFH Public Hospitals ANNUAL INCOME OF CHIEF PHYSICIAN (POST - TAX) Other Income

13 13 2018 Operating Stats 4 Open Date 1997/2014 2004 2019 2012 2015 2013 2018 2018 2020 2021 Signed MoU & framework agreement in major Tier 2 locations (lease / operate and management contract model) Gross Floor Area (sqm) 34,448 3 7,559 3 20,844 3 6,900 30,057 8 16,145 69,008 3 28,471 22,834 64,000 # of Licensed Beds 120 50 100 30 200 8 101 105 100 200 250 - 350 # of Consultation Rooms 239 3 71 3 106 3 26 29 32 135 3 83 5 82 5 TBC # of Satellite Clinics 8 4 0 0 0 1 0 N/A TBC 2019E Financials (RMB mm) Revenue 1 ,304 3 492 3 531 3 136 86 93 176 3 109 0 5 Revenue Contribution 52% 3 24% 3 21% 3 5% 3% 4% 7% 3 4% 0% 0% Revenue / Bed 6 14.0 3 12.0 3 7.5 3 5.9 1.8 1.1 1.7 3 1.3 N/A N/A Revenue / Sqm (RMB k) 37.9 3 65.1 3 25.5 3 19.7 4.3 8 5.8 2.6 3 3.8 N/A N/A Adjusted EBITDA 345 3 110 3 130 3,7 22 (22) (1) (43) 3 (79) (45) 5 Initial Investments 9 318 10 78 10 296 11 105 10 348 206 10 727 561 447 N/A 12 TIER 1 Shanghai Puxi 2 (new) Shanghai Puxi 1 (old) ASSET OVERVIEW Source: Company 1. All financials for old Shanghai Puxi are 2018A figures 2. New Shanghai Puxi is the expansion of the old Shanghai Puxi 3. Includes satellite clinics associated with hospitals 4. As of Dec 31, 2018 5. Stands for consultation rooms available at stabilization UFH Beijing City Cluster Shanghai City Cluster Greater Bay Cluster 6. Revenue / bed is calculated based on bed in use for each year 7. Adjusted EBITDA of Shanghai Puxi in 2019 has been adjusted for one - off rent and relocation expenses in New Puxi Hospital, UFH is currently in the final stages of negotiation with its joint venture partner of Shanghai Puxi Hospital regarding an annual rental reimbursement, which amount would constitute an add - back of a non - recurring expense in 2018 OPERATING ASSETS EXPANSION ASSETS (TIER 1 ONLY) JCI - Accredited Beijing Chaoyang Shanghai Pudong Beijing Datun Shenzhen Management Contract Guangzhou Qingdao Beijing Rehab Tianjin 8. Includes Building A and additional capacity from Building B expansion; Revenue per sqm only accounts for the 20,057 sqm currently in use 9. Initial Capex plus historical or expected loss and pre - opening expenses during ramp - up period 10. Only includes initial Capex as losses are not traceable 11. Expects no loss to be incurred as it is considered as an expansion of the old Puxi site (~1km from the existing site) , which already has mature and stable patient base 12. Management contract: CAPEX paid for by the project company TIER 2 EXPANSION ASSETS (TIER 2)

14 14 HOSPITALS: LONG TERM MATURITY CYCLE 0 50 100 150 200 250 300 350 400 450 500 550 600 650 700 750 800 850 900 950 1,000 1997 1998 1999 2000 2001 2002 2003 2004 2005 2006 2007 2008 2009 2010 2011 2012 2013 2014 2015 2016 2017 2018 Rehab (16,145 sqm) BJU (24,959 sqm) SHM (previously 7,559 sqm; 20,844 sqm after relocation) TJU (6,900 sqm) QDU (20,057 sqm 3 ) Hospital Revenue (mm RMB) Due to capacity bottleneck with only 5,886 sqm, Shanghai hospital struggled to take on additional patient volume and develop higher acuity services. Capacity issue was solved in October 2019 when Shanghai hospital moved to a new site with 19,172 sqm of facility size GZM (69,008 sqm) May - 19 (Month 8 1 ) Run Rate Revenue 2 (RMB 173mm) PDU (28,471 sqm) May - 19 (Month 6 1 ) Run Rate Revenue 2 (RMB 111mm) Source: Company ( Unaudited) 1. Since the hospital obtained its OB license 2. Run - rate revenue is defined as monthly revenue * 12 3. Only 20,057 sqm Building A is currently in use and contributes revenue for now; total GFA is 30,057 sqm which includes Bui ldi ng A and additional capacity from Building B expansion

15 15 MANAGEMENT TEAM OF NFH Roberta Lipson Antony Leung Carl Wu EXECUTIVE COMMITTEE ▪ CEO of NFH ▪ Founder of United Family Healthcare ▪ Medical industry experience: 35+ years ▪ One of the most well - regarded healthcare executives in China ▪ Chairman of NFH ▪ Chairman / Co - Founder of New Frontier Group ▪ Chairman of Nan Fung Group ▪ Former HK Financial Secretary ▪ Former Chairman of Blackstone China, JP Morgan Asia ▪ C hairman of Executive Committee of NFH ▪ CEO / Co - Founder of New Frontier Group ▪ Experienced healthcare entrepreneur (Co - founder of Care Alliance, YD Care, and Heal) ▪ Founding member of Blackstone Asia Pacific and Blackstone China Dr. Jeff Staples COO - UFH Dr. DJ Hamblin - Brown CMO - UFH Sylvia Pan GM, Beijing ▪ Medical industry experience: 25+ years ▪ Past experience: SOS, Parkway Health ▪ Medical industry experience: 20+ years ▪ Past experience: NHS, Aspen Medical ▪ Medical industry experience: 25+ years ▪ Medical industry experience: 15+ years ▪ Past experience: US CDC, Hawaii DMAT Dr. Kate Gaynor GM, Guangzhou ▪ Medical industry experience: 22+ years ▪ Past experience: KPJ Healthcare Berhad Lai Heng Mah GM, Shanghai Puxi ▪ Medical industry experience: 20+ years ▪ Past experience: SIMC, Xinhua Hospital Dr. Michael Zhang GM, Shanghai Pudong Xiaoyan Shen CNO - UFH ▪ Medical industry experience: 30+ years OPERATIONAL / MEDICAL EXPERTS ▪ Past experience: 25+ years in healthcare industry Walter Xue CFO - UFH ▪ Medical industry experience: 30+ years ▪ Past experience: Beijing Children’s Hospital, Tan Tock Seng Hospital Sharon Hu GM, Beijing Rehab Daniel Liu GM, Tianjin ▪ Medical industry experience: 25+ years ▪ Past experience: CR Phoenix ▪ Medical industry experience: 12+ years Ao Wang GM, Qingdao

16 16 EXPERIENCED BOARD OF DIRECTORS Independent Non - executive Directors Antony Leung Carl Wu Non - Independent Directors ▪ Managing Director of New Frontier Group ▪ Blackstone Private Equity Group (HK) ▪ Barclays David Zeng ▪ Chairman of NFH ▪ Chairman / Co - Founder of New Frontier Group ▪ Former Financial Secretary of Hong Kong ▪ Nan Fung Group Chairman and CEO ▪ Blackstone Chairman of Greater China ▪ J.P. Morgan Chairman of Asia ▪ Citibank Head of China & Hong Kong and Private Bank for Asia ▪ Chairman of Executive Committee of NFH ▪ CEO / Co - Founder of New Frontier Group ▪ Experienced healthcare entrepreneur (Co - founder of Care Alliance, YD Care, and Heal) ▪ Founding member of Blackstone Asia Pacific and Blackstone China Roberta Lipson Shan Fu Qiyu Chen ▪ CEO of NFH ▪ Founder of UFH ▪ Medical industry experience: 35+ years ▪ One of the most well regarded healthcare executives in China ▪ Managing Partner, Co - CEO and CEO of Vivo Capital in Greater China ▪ Senior Managing Director and Chief Representative of Blackstone ▪ Department of Foreign Investment in National Development and Reform Commission (NDRC) ▪ State Economic and Trade Commission ▪ Executive Director and the Co - President of Fosun International ▪ Executive Director and the Chairman of Fosun Pharma ▪ Non - executive director and Vice Chairman of Sinopharm Group Dr. C H Leong Frederick Ma ▪ Senior Advisor of New Frontier Group ▪ Hong Kong University Council Chairman ▪ Non - official member of the Executive Council of HKSAR ▪ Hong Kong Hospital Authority Chairman ▪ Member of Hong Kong Legislative Council ▪ Senior Advisor of New Frontier Group ▪ Non - executive Chairman of MTR ▪ Secretary for Commerce & Economic Development of HKSAR ▪ Secretary for Financial Services and the Treasury for HKSAR ▪ CFO of PCCW ▪ To be nominated
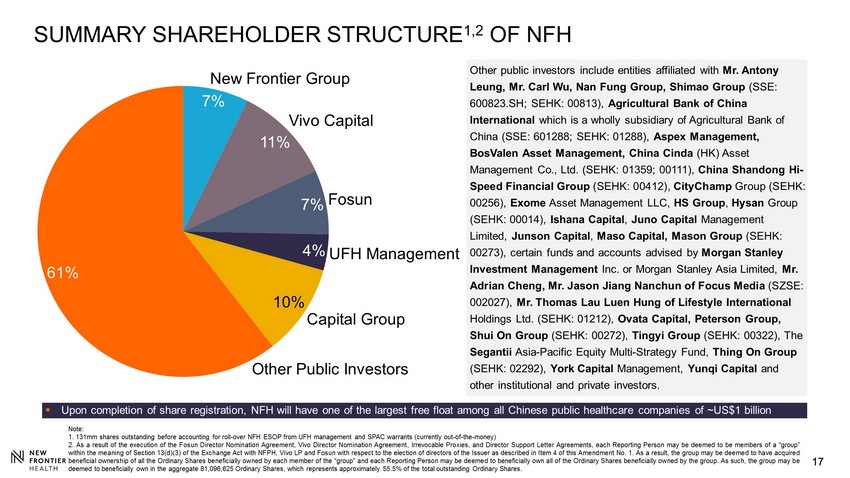
17 17 ▪ Upon completion of share registration, NFH will have one of the largest free float among all Chinese public healthcare compan ies of ~US$1 billion SUMMARY SHAREHOLDER STRUCTURE 1,2 OF NFH 7% 11% 7% 4% 10% 61% Fosun New Frontier Group Vivo Capital UFH Management Capital Group Other Public Investors Other public investors include entities affiliated with Mr. Antony Leung, Mr. Carl Wu, Nan Fung Group, Shimao Group (SSE: 600823.SH; SEHK: 00813), Agricultural Bank of China International which is a wholly subsidiary of Agricultural Bank of China (SSE: 601288; SEHK: 01288), Aspex Management, BosValen Asset Management, China Cinda (HK) Asset Management Co., Ltd. (SEHK: 01359; 00111), China Shandong Hi - Speed Financial Group (SEHK: 00412), CityChamp Group (SEHK: 00256), Exome Asset Management LLC, HS Group , Hysan Group (SEHK: 00014), Ishana Capital , Juno Capital Management Limited, Junson Capital , Maso Capital, Mason Group (SEHK: 00273), certain funds and accounts advised by Morgan Stanley Investment Management Inc. or Morgan Stanley Asia Limited, Mr. Adrian Cheng, Mr. Jason Jiang Nanchun of Focus Media (SZSE: 002027), Mr. Thomas Lau Luen Hung of Lifestyle International Holdings Ltd. (SEHK: 01212), Ovata Capital, Peterson Group, Shui On Group (SEHK: 00272), Tingyi Group (SEHK: 00322), The Segantii Asia - Pacific Equity Multi - Strategy Fund, Thing On Group (SEHK: 02292), York Capital Management, Yunqi Capital and other institutional and private investors. Note : 1 . 131 mm s hares outstanding before accounting for roll - over NFH ESOP from UFH management and SPAC warrants (currently out - of - the - money) 2 . As a result of the execution of the Fosun Director Nomination Agreement, Vivo Director Nomination Agreement, Irrevocable Proxies, and Director Support Letter Agreements, each Reporting Person may be deemed to be members of a “group” within the meaning of Section 13 (d)( 3 ) of the Exchange Act with NFPH, Vivo LP and Fosun with respect to the election of directors of the Issuer as described in Item 4 of this Amendment No . 1 . As a result, the group may be deemed to have acquired beneficial ownership of all the Ordinary Shares beneficially owned by each member of the “group” and each Reporting Person may be deemed to beneficially own all of the Ordinary Shares beneficially owned by the group . As such, the group may be deemed to beneficially own in the aggregate 81 , 096 , 625 Ordinary Shares, which represents approximately 55 . 5 % of the total outstanding Ordinary Shares .

18 INDUSTRY OVERVIEW
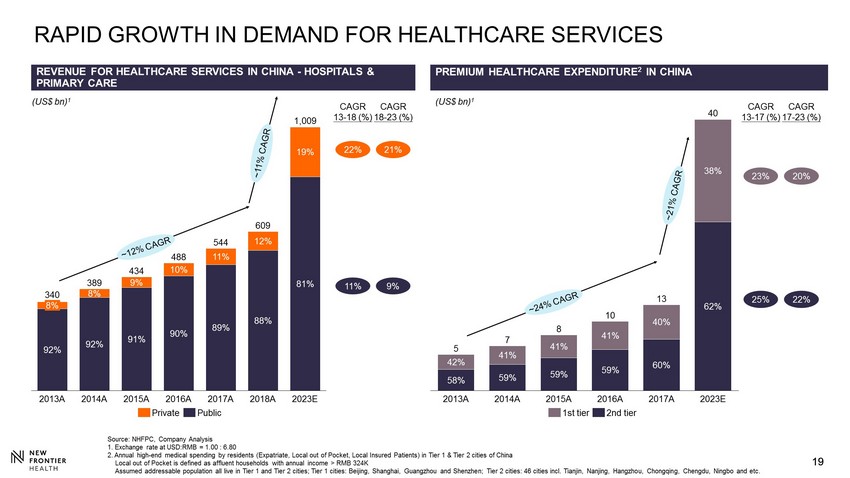
19 19 REVENUE FOR HEALTHCARE SERVICES IN CHINA - HOSPITALS & PRIMARY CARE (US$ bn) 1 CAGR 13 - 18 (%) CAGR 18 - 23 (%) 22% 11% 21% 9% (US$ bn) 1 42% 58% 59% 59% 59% 60% 62% 41% 41% 41% 40% 38% RAPID GROWTH IN DEMAND FOR HEALTHCARE SERVICES 23% 25% CAGR 17 - 23 (%) 20% 22% CAGR 13 - 17 (%) Source: NHFPC, Company Analysis 1. Exchange rate at USD:RMB = 1.00 : 6.80 2. Annual high - end medical spending by residents (Expatriate, Local out of Pocket, Local Insured Patients) in Tier 1 & Tier 2 ci ties of China Local out of Pocket is defined as affluent households with annual income > RMB 324K Assumed addressable population all live in Tier 1 and Tier 2 cities; Tier 1 cities: Beijing, Shanghai, Guangzhou and Shenzhen ; Tier 2 cities: 46 cities incl. Tianjin, Nanjing, Hangzhou, Chongqing, Chengdu, Ningbo and etc. PREMIUM HEALTHCARE EXPENDITURE 2 IN CHINA 2023E 488 2013A 8% 389 340 2014A 92% 2015A 91% 2016A 88% 434 1,009 90% 2017A 89% 12% 544 2018A 609 10% 8% 9% 19% 11% 92% 81% Private Public 41% 59% 42% 58% 41% 2013A 2014A 59% 62% 2015A 41% 59% 2016A 40% 60% 2017A 38% 2023E 5 7 8 10 13 40 1st tier 2nd tier

20 20 CHINA IS UNDER - PENETRATED IN PRIVATE HEALTHCARE 0 5 10 15 20 25 30 35 40 45 50 55 60 65 70 75 80 85 300 700 500 600 900 1,000 1,100 400 1,300 1,200 800 5,300 0 Germany SOUTH AFRICA Spain Private healthcare spending per capita (US$) Taiwan South Korea GDP per capita (US$ ‘000) Canada Japan United States Singapore China France Switzerland BRAZIL Australia Asia NA EU LatAm & Africa AU South Africa and Brazil have lower/comparable income but higher spending than China China Tier 1 1 Source: EIU, Euromonitor, BMI, Hong Kong Food and Health Bureau; A s of 2017 1. Tier 1 cities include Beijing, Shanghai, Guangzhou and Shenzhen. Private healthcare spending per capita assumed to mirror pri vate vs. public hospital revenue trends in China Countries and Regions

21 21 (2,300) ( RMB bn ) TOP TRENDS IN THE CHINESE PUBLIC AND PRIVATE HOSPITAL SECTORS Source: Frost & Sullivan, PwC survey on urban middle class Chinese, National Health and Family Planning Commission, Company A nal ysis; As of 2016 SCARCITY AND UNEVEN DISTRIBUTION OF QUALITY MEDICAL RESOURCES IMMENSE PRESSURE ON PUBLIC HEALTHCARE SYSTEM 3+ hours Average time to visit a physician 90+% Average bed occupancy rate in public hospitals <5 mins Actual time spent in a physician consultation Class III: 2,232 (8%) Class II: 7,944 (27%) Class I: 9,282 (32%) Unrated: 9,682 (33%) # of Annual Hospital Outpatient Visits (mm) Class III: 1,628 (50%) Class II: 1,217 (37%) Class I: 218 (7%) Unrated: 207 (6%) # of Hospitals in China EXPECTED DEFICIT OF THE BASIC SOCIAL MEDICAL INSURANCE 2020E 2026E Deficit is expected to arise TOP TRENDS IN THE PRIVATE HOSPITAL SECTOR Private hospitals in China are facing challenges that present unique opportunities for a branded comprehensive player like UFH Lack of a Comprehensive Service Provider − Most private hospital systems are focused on a single specialty / low acuity situations Highly Fragmented Market − Limited scaled players provide opportunity for a large, branded player like UFH Willingness to Pay − >80% of patients are willing to pay a premium to visit a private hospital − Huge under supply of premium hospitals Brand Recognition and Reputational Issues − Scarcity value as few players have both a strong brand and reputation TOP TRENDS IN THE PUBLIC HOSPITAL SECTOR

22 22 25 40 64 103 314 106 139 183 240 483 131 179 247 343 797 90 109 155 212 303 7% 8% 11% 15% 22% 0 200 400 2000A 2010A 2020E 2030E 2040E Population Aged 65+ as % of Total Population AGING POPULATION AND COMMERCIAL HEALTHCARE INSURANCE ARE KEY LONG TERM GROWTH DRIVERS OF HEALTHCARE SERVICES 15% 28% CAGR 18 - 23 (%) 15% 25% CAGR 12 - 18 (%) RAPIDLY AGING POPULATION China population aged 65+ (Persons mm) HIGH - END PHI 2 ADDRESSABLE POPULATION ('000) COMMERCIAL HEALTH INSURANCE GWP 1 (US$ bn) 2 China Population Aged 65+ (Persons mm) 2012A 2014A 2016A 2018E 2023E Source: United Nations, China Insurance Yearbook, CIRC, McKinsey Global Institute, Company Analysis 1. Include all local and foreign players. Health insurance GWP (gross written premium) includes premium sold by both life and P& C insurers 2. PHI = Private Health Insurance 3. Exchange rate at USD:RMB = 1.00 : 6.80 Tier 1 cities Tier 2 cities 2023E 2012A 13 2016A 2014A 2018E 23 59 94 294

23 23 THE LEADING COMPREHENSIVE HEALTHCARE SERVICES PROVIDER IN CHINA 2018 A REVENUE 2 MOST COMPREHENSIVE HEALTHCARE SERVICES OFFERING ; Covering over 30+ specialties while major peers 1 only have 10 - 15 specialties ; High entry barriers Source: Company, Company Analysis 1. Major peers include Parkway Health, AmCare, HarMoniCare, American - Sino and New Century Healthcare 2. Revenue and breakdown based on 2018A except for Company A (2018 annual report not released) 3. Other Specialties include Medical Aesthetic, Oncology, Dental, Neurology, and Emergency Medicine 4. Refers to Beijing, Shanghai, Guangzhou and Shenzhen 5. Includes Shanghai hospital revenue only 6. As of Ju l 29, 2019 except for Company A; Company A entered into stock suspension since Apr 1, 2019 General Surgery OB/GYN Internal Medicine Peds Ortho Other Specialties 3 Estimated revenue contributions from new facilities with pre - spent Capex (~4 - 5x the size of the existing mature hospitals) Existing facilities 2018A: 2,059 4.8% 77.7% 17.5% 32.2% 16.6% 23.2% 15.6% 5.5% 924 7.7% 7.1% 615 # of Tier 1 cities 4 2 1 4 (RMB mm) OB/GYN focus P eds focus Largest comprehensive group ; All 4 Tier 1 cities in China ; Complementary strategic coverage in selective Tier 2 cities BROADEST GEOGRAPHIC COVERAGE ; One of the largest multi - specialty healthcare services group ONE OF THE LARGEST BY REVENUE PRIVATE PUBLICLY LISTED OB/GYN and Peds OB/GYN and Peds F amily Medicine 2 2 1 8.7% Family Medicine ~90% ~10% 1,000 490 (5) ~10% 350 83.4% ~90% Company A Company B UFH Company C 5 Company D Company E M arket Capitalization (US$ mm) 6 198 6 212 N/A N/A N/A N/A

24 24 Shanghai United Family Hospital VALUATION AND VALUE CREATION

25 25 SUM - OF - THE - PARTS VALUATION: TODAY 1,197 2,090 1,436 825 68 Operating Assets Expansion Assets (Tier 1) 1 PFMA Enterprise Value of NFH Operating Assets (BJ, SH Puxi, Tianjin, Rehab, Qingdao) • Valued at 16x 2020E Adjusted EBITDA of US$ 75mm (RMB 589mm less 50% of HQ cost allocation) vs. 15 - 21x 2020E Adjusted EBITDA for regional healthcare service leaders with similar growth profile (reflecting 1 year of ramp - up in new SH Puxi and no contribution from Qingdao) Expansion Assets (Tier 1 only) • Valued at 5 .8x Stabilized EBITDA of US$ 142mm (based off discounted cash flow of Guangzhou, Pudong, BJ Datun and 50% of HQ cost allocation since 2019 with 13% WACC and 16x terminal multiple) • Expansion assets will generate RMB 11mm revenue per bed at stabilization, comparing with RMB 13mm for BJ and RMB12 mm for SH Puxi in 2018 SZ Mgmt Contract • Valued at US$ 68mm (based off discounted cash flow of Shenzhen management contract since 2019 with 13% WACC and 16x terminal multiple) 1 2 3 1 3 2 Notes: 1. DCF includes approximately 100mm outstanding investments in stabilized assets 2 . 131 mm shares outstanding before accounting for roll - over NFH ESOPs from UFH management and SPAC warrants (currently out - of - the - money) 3. Stock price as of Dec 27, 2019 (in US$ mm unless otherwise noted) SZ Mgmt. Contract SOTP Valuation ($10.0/share 3 ) ($15.1/share 2 ) ($8.7/share 2 ) ($6.0/share 2 ) ($0.5/share 2 ) Sum of the parts valuation of NFH post acquisition of UFH Acquisition Cost of UFH Beijing, Shanghai Puxi Tier 2

26 26 POTENTIAL TRANSACTION VALUE CREATION $10.0/Share 1 $39.4 - $45.2/Share 1 $9.0 - $9.5 1 $3.5 - $4.0 1 $3.0 - $3.5 1 $3.5 - $4.0 1 $0.4 - $0.7 1 $6.0 - $6.5 1 $4.0 - $7.0 1 Expansion Asset Organic Growth 2 Operating Asset Organic Growth 2 Call Option on Shenzhen Opco 5 NFH 1 2 3 4 Bolt - on Acquisitions 6 Multiple Re - Rating 5 Immediate Near - Term Medium - Term 6 • Organic growth from Tier 1 and Tier 2 existing assets in line with historical growth rate • Current at roughly 50% of stabilized state 1 • Ramp - up of Tier 1 new assets (GZU, PDU and DTU) to <50% the efficiency and productivity of BJU and SHU 2 • Management contract model which charges a fixed brand fee and a variable fee with a call option • Lease and operate model in key 2nd tier cities such as Hangzhou and Chengdu 3 • US$300 - 400 mm of acquisitions done at 10x LTM EBITDA (approximately US$ 150 - 200mm of which is currently in preliminary term sheet discussion) • Leverage extensive experience of NFH Management 6 • Assume re - rating to regional leader multiple of 20x NTM EBITDA 7 Tier 2 City Expansion 3 7 NFH Status Quo Other Initiatives 4 • Other Initiatives include continued expansion of managed care business, opening of IVF centers in select cities, additional outpatient networks in Beijing, Shanghai, Guangzhou and Shenzhen and selected 2nd tier cities 4 • Call option exercised on the Shenzhen Opco at fair market value 5 Notes: 1. 131mm shares outstanding before accounting for roll - over NFH ESOPs from UFH management and SPAC warrants (currently out - of - the - money); Stock price as of Dec 27, 2019 2. US$ 1.70 - 1.75 bn of incremental equity value from organic growth of existing facilities and facilities under construction 3. US$ 400 - 450mm of incremental equity value from 2 nd tier cities expansion with additional management contracts and launch of Hangzhou / Chengdu Hospitals 4. US$ 500 - 550mm of incremental equity value from additional IVF centers, outpatient clinics and managed care program 5. ~US$50mm of incremental equity value from exercising the call option of Shenzhen hospital 6. Range reflects acquisition of US$300 - 400mm of assets; assumes target acquired at 10.0x LTM EBITDA, reflecting valuation of single - asset hospitals and clinics

27 27 UPSIDE CATALYSTS DELIVERING ADDITIONAL VALUE ; Scale more capital efficiently by using a combination of lease/operated and managed contract model in Tier 2 cities ; Grow from 4 Tier 1 to 46 Tier 2 cities (in partnership with strategic real estate developers) ; Establishing sub - brands to further broaden UFH’s outreach within the local population and enhance UFH's brand equity FULLY EXPLORE POTENTIAL IN TIER 2 CITIES CLEAR SPECIALTY FOCUS ENHANCED OUTPATIENT NETWORK MANAGED CARE AND OTHER INITIATIVES M&A OPPORTUNITIES TECHNOLOGY UPGRADES ; Continue deep specialization in select areas but maintain a comprehensive suite of services ; Grow IVF from Tianjin to nationwide ; New centers of excellence: oncology, orthopedics, ENT, sleep center, geriatric center, gynecology, advanced surgical , etc. ; Continue to replicate the successful hub & spoke model from Beijing to nationwide ; Maximize clustering effects by setting up additional complementary services ; Broaden our service suite though clinics and pharmaceutical services ; Focus on increasing acuity services (robotics, oncology, advance imaging) to drive ASP / margin and create higher barriers to competitors ; Continued investment in the AI and mobile technology for data analytics, online consultation, risk underwriting, preventive care ; Roll out managed care network on the back of the largest private provider system in China ; Further spin - off of procurement, staffing and IT service verticals as standalone businesses that service 3 rd parties ; Strategic acquisitions of specialty hospitals, outpatient and services network to further complement our existing portfolio ; Management contracts include a right to acquire managed hospitals

28 28 Source: National Bureau of Statistics, Oxford Economics, McKinsey Global Institute, Company Analysis ; As of 2017 1. Tier 2 cities are defined as cities with 2016 GDP (latest available consistent historical data in McKinsey Global Institut e) from RMB 200 - 1500bn, in 2010 price 2. Tier 1 coverage includes 7 hospitals in Beijing (3) /Shanghai (2) /Guangzhou (1) /Shenzhen (1) and 12 clinics in Beijing ( 8), Shanghai (3), and Guangzhou (1) 3. Tier 2 coverage includes 2 hospitals in Tianjin (1) /Qingdao (1) and 2 clinics in Hangzhou (1) / Bo’Ao (1). Current Pipeline Limited competition More competition POTENTIAL ON TIER 2 CITY EXPANSION Tier 1 ; 4 MOU signed Tier 2 # of cities 4 46 1 Population 72mm 339mm GDP per Capita RMB 149k RMB 99k High - End Hospital Presence Current UFH Coverage 2019E Rev: RMB 2,218mm 2 15 - 19E CAGR: 13.8% 2 2019E Rev: RMB 257mm 3 15 - 19E CAGR: 40.7% 3

29 29 INVESTMENT HIGHLIGHTS Well - established nationwide platform with scale and an experienced management platform 4 Attractive valuation on a sum - of - the - parts basis 5 Multi - dimensional growth opportunities 6 The leading comprehensive healthcare services provider with the most reputable brand in China 2 Robust outlook of the Chinese private healthcare industry supported by favorable long term secular drivers 1 Unique hospital + clinic hub & spoke network; “entire lifecycle” coverage 3 Substantial platform synergies with New Frontier led by a proven management team 7

30 30 Shanghai United Family Pudong Hospital APPENDIX A – FINANCIAL PROJECTIONS

31 31 Area Bed in Use GFA (sqm) 2015A 2016A 2017A 2018A 2019E 2020E 2021E 2022E 2023E 2024E Beijing (incl. Clinics) 1 34,448 78 83 84 91 93 93 95 95 97 97 Shanghai Puxi (incl. Clinics) 2 20,844 36 39 41 41 71 71 80 80 90 90 Tier 2 (TJ, QD, Rehab) 3 53,102 99 120 130 142 156 167 194 194 214 214 Sub-total 108,394 213 241 255 274 320 331 369 369 401 401 Guangzhou (incl. Clinics) 4 69,008 - - - 105 105 105 120 120 140 140 Shanghai Pudong 28,471 - - - 85 85 85 100 100 100 100 Beijing Datun 22,834 - - - - - 62 62 80 90 100 Shenzhen (mgmt. contract) 5 64,000 - - - - - - 100 150 150 150 Sub-total 184,313 - - - 190 190 252 382 450 480 490 292,707 213 241 255 464 510 583 751 819 881 891 Operating Assets Expansion Assets (Tier 1) Total SUBSTANTIAL INVESTMENTS HAVE BEEN MADE FOR FUTURE EXPANSION Notes: 1. Includes 24,959 sqm from Beijing Hospital and 9,489 sqm from Beijing Clinics. Beijing Clinics expanded from 8,403 sqm to 9 ,48 9 sqm in 2015 with the opening of 2 new clinics 2. Total GFA of Shanghai Puxi (incl. clinics) was 7,559 sqm until 2019. Shanghai Puxi (incl. clinics) underwent an expansion to reach a total GFA of 20,844 sqm in 2019. Total GFA does not include the Shanghai clinic that is currently operated under New Frontier Group’s private vehicle 3. Consists of Tianjin with a total GFA of 6,900 sqm, Beijing Rehab with a total GFA of 16,145 sqm and Qingdao (opened in 201 5) with a total GFA of 20,057 sqm (with 10,000 sqm more capacity in building B) 4. Guangzhou expanded its total GFA from 971 sqm in 2017 (consisting only of Guangzhou Clinic) to 69,008 sqm in 2018 followi ng the opening of its Guangzhou Hospital 5. Shenzhen facility is currently estimated to have approximately 250 - 350 beds and will initially be operated under a management contract model

32 32 Revenue Breakdown (RMB mm) 2015A 2016A 2017A 2018A 2019E 2020E 2021E 2022E 2023E 2024E 15-18A CAGR 18-20E CAGR 18-24E CAGR Beijing (incl. clinics) 751 962 1,064 1,168 1,304 1,423 1,542 1,656 1,773 1,899 15.8% 10.4% 8.4% Shanghai Puxi (incl. clinics) 1 496 508 495 492 531 682 792 882 976 1,076 (0.2%) 17.7% 13.9% Tier 2 (TJ, QD, Rehab) & Other Assets 2 102 150 207 305 374 461 539 612 684 753 44.2% 23.0% 16.3% Sub-total 1,348 1,620 1,766 1,965 2,209 2,566 2,873 3,150 3,433 3,727 13.4% 14.3% 11.3% Expansion (GZ 3 , SH Pudong, BJ Datun) 42 50 59 97 285 526 786 1,053 1,340 1,641 32.1% 133.3% 60.3% Shenzhen (mgmt. contract) - - - - 5 9 14 12 24 40 Sub-total 42 50 59 97 290 535 800 1,065 1,364 1,681 32.1% 135.2% 61.0% Expansion Assets (Tier 2) 4 5 6 3 (3) 2 15 30 47 67 88 1,395 1,675 1,828 2,059 2,501 3,116 3,704 4,262 4,863 5,496 13.8% 23.0% 17.8% Revenue per Bed (RMB mm) Beijing (incl. clinics) 9.6 11.6 12.7 12.8 14.0 15.3 16.2 17.4 18.3 19.6 10.0% 9.2% 7.3% Shanghai Puxi (incl. clinics) 13.8 13.2 12.1 12.0 7.5 9.6 9.9 11.0 10.8 12.0 (4.5%) (10.5%) (0.1%) Tier 2 (TJ, QD, Rehab) & Other Assets 1.0 1.3 1.6 2.1 2.4 2.8 2.8 3.2 3.2 3.5 27.8% 13.4% 8.6% Sub-total 6.3 6.7 6.9 7.2 6.9 7.8 7.8 8.5 8.6 9.3 4.2% 4.0% 4.4% Expansion Assets (Tier 1) 5 - - - 0.5 1.5 2.1 2.8 3.5 4.1 4.8 45.5% Expansion Assets (Tier 1) Operating Assets Expansion Assets (Tier 1) Others Total Operating Assets REVENUE SUMMARY (EXCL. M&A) Notes: 1. Shanghai Puxi's historical revenue growth was limited by capacity constraints and out of date infrastructure (only 7 ,559 sqm GFA incl. clinics ). Shanghai Puxi , which relocated in Q4, operates in a new, expanded complex (~1km from our old complex) 2. Other Assets include Bo’Ao Clinic, Hangzhou Clinic and Yuesao (post partum care worker) business but does not include the 4 clinics currently operated by the private vehicle of New Frontier Group 3. Prior to Guangzhou Hospital's opening in 2018, Guangzhou consisted of 1 clinic with a total GFA of 971 sqm 4. Expansion assets (Tier 2) include HQ 5. Expansion Assets' Revenue Per Bed excludes Shenzhen (mgmt. contract). Shenzhen (mgmt. contract) revenues are derived from fix ed branding and management fees as a % of hospital revenues 6. Represent asset performance once it reaches a level of revenue per bed similar to Beijing and Shanghai in 2018 See Appendix P40 for back - up Expected 10 - 12mm RMB revenue per bed at stabilization 6

33 33 Adjusted EBITDA 1 Breakdown (RMB mm) 2015A 2016A 2017A 2018A 2019E 2020E 2021E 2022E 2023E 2024E 15-18A CAGR 18-20E CAGR 18-24E CAGR Beijing (incl. clinics) 117 257 282 310 345 371 402 430 461 494 38.4% 9.5% 8.1% Shanghai Puxi (incl. clinics) 2 141 155 138 110 130 176 212 238 263 288 (7.9%) 26.1% 17.3% Tier 2 (TJ, QD, Rehab) & Other Assets 3 (91) (48) (36) (9) (6) 42 79 103 126 147 Sub-total 167 365 385 411 469 589 694 771 851 928 34.9% 19.8% 14.6% Expansion (GZ, SH Pudong, BJ Datun) 4 5 8 (52) (185) (167) (55) 57 164 271 384 Shenzhen (mgmt. contract) - - - - 5 9 14 12 24 40 Sub-total 5 8 (52) (185) (162) (46) 71 177 295 425 Expansion Assets (Tier 2) 5 - - - - - 9 20 32 45 60 HQ 6 (116) (132) (146) (141) (168) (160) (160) (168) (176) (185) 6.8% 6.6% 4.7% 57 241 186 84 140 392 625 812 1,014 1,227 14.2% 115.5% 56.2% Adjusted EBITDA Margin (%) Beijing (incl. clinics) 15.5% 26.8% 26.5% 26.5% 26.5% 26.1% 26.1% 26.0% 26.0% 26.0% Beijing (hospital only excl. clinics) 14.0% 27.3% 28.7% 30.2% 30.0% 29.2% 29.0% 28.6% 28.6% 28.4% Shanghai Puxi (incl. clinics) 28.5% 30.6% 28.0% 22.4% 24.5% 25.7% 26.8% 27.0% 27.0% 26.8% Tier 2 (TJ, QD, Rehab) & Other Assets (89.2%) (32.2%) (17.3%) (3.1%) (1.6%) 9.2% 14.7% 16.9% 18.5% 19.5% Sub-total 12.4% 22.5% 21.8% 20.9% 21.2% 22.9% 24.2% 24.5% 24.8% 24.9% Expansion (GZ, SH Pudong, BJ Datun) 7 12.5% 15.7% (88.7%) (234.8%) (58.6%) (10.4%) 7.2% 15.6% 20.2% 23.4% 4.1% 14.4% 10.2% 4.1% 5.6% 12.6% 16.9% 19.0% 20.9% 22.3% Overall Operating Assets Expansion Assets (Tier 1) Others Total Operating Assets Expansion Assets (Tier 1) ADJUSTED EBITDA SUMMARY (EXCL. M&A) Notes: 1. Reconciliation of historical Adjusted EBITDA to net income / (loss) can be referred in Appendix E 2. Shanghai Puxi's historical Adj. EBITDA growth was limited by capacity constraints (only 7,559 sqm GFA incl. clinics) and infrastructure limit at ions relative to patient volumes. UFH is currently in the negotiation with its joint venture partner of Shanghai Puxi hospital regarding a rental reimbursement of of RMB 15 million per year. Such rental rebate and one - off relocation expenses are added - back in 2019 full year projected Adjusted EBITDA 3. Other Assets include Bo’Ao Clinic, Hangzhou Clinic and Yuesao (post partum care worker) business but does not include the 4 clinics currently operated by the private vehicle New Frontier Gr oup 4. Prior to Guangzhou Hospital's opening in 2018, Guangzhou consisted of 1 family health clinic 5. Expansion assets (Tier 2) doesn’t include HQ 6. HQ loss is evenly allocated between operating assets and expansion assets 7. Expansion Assets Adjusted EBITDA margin excludes Shenzhen (mgmt. contract). Shenzhen (mgmt. contract) revenues are derived fr om fixed branding and management fees as a % of hospital revenues 8. Represent asset performance once it reaches a level of revenue per bed similar to Beijing and Shanghai in 2018 US$ 75mm Adjusted EBITDA for Operating Assets after allocating 50% HQ expense Expected 25 - 30% adj. EBITDA margin at stabilization 8 Reflected double rental payment in Shanghai Puxi hospital (for both old and new sites) during 2018 and 2019. UFH is currently in negotiation with JV partner regarding an annual rental reimbursement of certain amount Adjusted EBITDA margin impacted by double rent for Shanghai Puxi Hospital (for both old and new sites) during 2018 and 2019
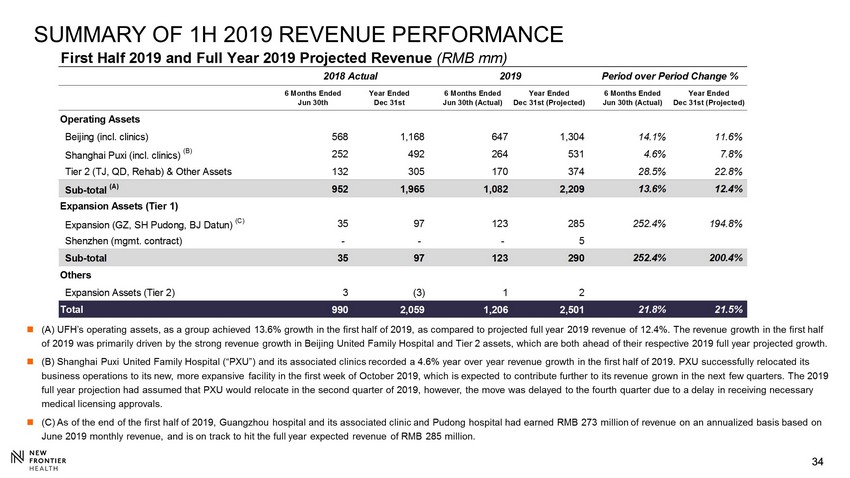
34 34 SUMMARY OF 1H 2019 REVENUE PERFORMANCE ; (A) UFH’s operating assets, as a group achieved 13.6% growth in the first half of 2019, as compared to projected full year 20 19 revenue of 12.4%. The revenue growth in the first half of 2019 was primarily driven by the strong revenue growth in Beijing United Family Hospital and Tier 2 assets, which are both ah ead of their respective 2019 full year projected growth. ; (B) Shanghai Puxi United Family Hospital (“PXU”) and its associated clinics recorded a 4.6% year over year revenue growth in the first half of 20 19. PXU successfully relocated its business operations to its new, more expansive facility in the first week of October 2019, which is expected to contribute fu rth er to its revenue grown in the next few quarters. The 2019 full year projection had assumed that PXU would relocate in the second quarter of 2019, however, the move was delayed to the fou rth quarter due to a delay in receiving necessary medical licensing approvals. ; (C) As of the end of the first half of 2019, Guangzhou hospital and its associated clinic and Pudong hospital had earned RMB 273 million of revenue on an annualized basis based on June 2019 monthly revenue, and is on track to hit the full year expected revenue of RMB 285 million. First Half 2019 and Full Year 2019 Projected Revenue (RMB mm) 2018 Actual 2019 Period over Period Change % 6 Months Ended Jun 30th Year Ended Dec 31st 6 Months Ended Jun 30th (Actual) Year Ended Dec 31st (Projected) 6 Months Ended Jun 30th (Actual) Year Ended Dec 31st (Projected) Beijing (incl. clinics) 568 1,168 647 1,304 14.1% 11.6% Shanghai Puxi (incl. clinics) (B) 252 492 264 531 4.6% 7.8% Tier 2 (TJ, QD, Rehab) & Other Assets 132 305 170 374 28.5% 22.8% Sub-total (A) 952 1,965 1,082 2,209 13.6% 12.4% Expansion (GZ, SH Pudong, BJ Datun) (C) 35 97 123 285 252.4% 194.8% Shenzhen (mgmt. contract) - - - 5 Sub-total 35 97 123 290 252.4% 200.4% Expansion Assets (Tier 2) 3 (3) 1 2 990 2,059 1,206 2,501 21.8% 21.5% Operating Assets Expansion Assets (Tier 1) Others Total

35 35 SUMMARY OF 1H ADJUSTED EBITDA (1) PERFORMANCE ; (A) UFH’s Operating Assets, as a group, achieved Adjusted EBITDA growth of 14 . 2 % year over year in the first half of 2019 , even without the expected contribution from PXU’s expansion and relocation that was expected to occur in the first half of 2019 . By the end of the first half of 2019 , UFH’s Operating Assets achieved 50 . 8 % of their total Adjusted EBITDA projections for the full year ended 2019 . ; (B) PXU has achieved 3 . 9 % year over year Adjusted EBITDA growth in the first half of 2019 . PXU’s Adjusted EBITDA includes additional rental expenses of RMB 13 million in the first half of 2018 and RMB 16 million in the first half of 2019 as a result of having leases on two properties simultaneously due to its pending move to the new site . UFH is currently in negotiation with its joint venture partner of PXU regarding an annual rental reimbursement of RMB 15 million per year . Such rental rebate and one - off relocation expenses are added - back in the full year projected Adjusted EBITDA . Despite the delay in its relocation from the second quarter to the fourth quarter of 2019 , by the end of the second quarter of 2019 , PXU had achieved 50 . 2 % of its expected full year Adjusted EBITDA . ; (C) UFH’s total Adjusted EBITDA for the second half of 2018 was impacted by additional expenses and initial operating losses related to its newly opened GZU and PDU facilities . UFH had projected RMB 140 million of Adjusted EBITDA for the full year 2019 , 59 . 9 % of which was already achieved by the end of the first half of 2019 . Notes: (1) Reconciliation of historical Adjusted EBITDA to net income / (loss) can be found in Appendix E of this presentation. 1. The 2019 full year projection had assumed that PXU would relocate in the second quarter of 2019, however, the move was delaye d t o the fourth quarter due to a delay in receiving necessary medical licensing approvals. 2. UFH is currently in negotiation with its joint venture partner regarding an annual rental reimbursement of RMB 15 million per ye ar. Such rental rebate and one - off relocation expenses are added - back in the full year projected Adjusted EBITDA. First Half 2019 Adjusted EBITDA and Full Year 2019 Projected Adjusted EBITDA (RMB mm) 2018 Actual 2019 Period over Period Change % 6 Months Ended Jun 30th Year Ended Dec 31st 6 Months Ended Jun 30th (Actual) Year Ended Dec 31st (Projected) 6 Months Ended Jun 30th (Actual) Year Ended Dec 31st (Projected) Beijing (incl. clinics) 154 310 181 345 17.3% 11.5% Shanghai Puxi (incl. clinics) (B), 1, 2 63 110 65 130 3.9% 18.0% Tier 2 (TJ, QD, Rehab) & Other Assets (8) (9) (8) (6) Sub-total (A) 209 411 239 469 14.2% 14.3% Expansion (GZ, SH Pudong, BJ Datun) (59) (185) (80) (167) Shenzhen (mgmt. contract) - - - 5 Sub-total (59) (185) (80) (162) Expansion Assets (Tier 2) - - - - HQ (64) (141) (75) (168) 86 84 84 140 Beijing (incl. clinics) 27.2% 26.5% 27.9% 26.5% Shanghai Puxi (incl. clinics) 24.9% 22.4% 24.7% 24.5% Tier 2 (TJ, QD, Rehab) & Other Assets (6.3%) (3.1%) (4.5%) (1.6%) Sub-total 21.9% 20.9% 22.1% 21.2% Expansion (GZ, SH Pudong, BJ Datun) (167.9%) (191.7%) (64.7%) (56.7%) 8.7% 4.1% 6.9% 5.6% Operating Assets Expansion Assets (Tier 1) Overall Operating Assets Expansion Assets (Tier 1) Others Total (C) Adjusted EBITDA Margin (%)

36 MAINTENANCE CAPEX AND NET WORKING CAPITAL Summary of M aintenance CAPEX by Facility ; Maintenance CAPEX needs is projected to be ~RMB 95 million in 2019 . ; Ongoing maintenance capex needs is projected to be around similar level as in 2019 , as majority of the facilities (including Guangzhou, Shanghai Pudong, new Shanghai Puxi facilities) are recently opened and require minimal maintenance capex . Summary of Net Working Capit a l BJU BJC SHM TJU Rehab QDU GZM PDU Total 2019 Projected Maintenance CAPEX (55) (5) (12) (6) (11) (6) - - (95) ; UFH has been recording growing negative net working capital for historical periods, as the company generally received prepayment and deposits from customers for various medical packages sold (incl . OB, PPR, dental, etc . ) ; Net working capital is calculated as total current assets (excluding cash) minus total current liability (excluding payable for purchases of property and equipment) 2017A 2018A Inventories 40 57 Trade receivables 162 181 Prepayments and other current assets 36 36 Total Current Assets 238 274 Trade payables 45 76 Contract liabilities 170 263 Accrued expenses and other current liabilities 269 750 Minus: Payables for purchases of property and equipment (26) (458) Tax payable 17 21 Total Current Liabilities 476 652 Net Working Capital (238) (378) Change in Net Working Capital 140

37 37 SOURCES & USES OF FUNDS Note : 1 . Exchange rate at USD : RMB = 1 . 00 : 6 . 80 2 . 133 mm shares under fully diluted basis (including 131 mm shares outstanding and 2 mm shares assuming exercise of management roll over ESOPs) before accounting for SPAC warrants (currently out - of - the - money) 3 . Under fully diluted basis assuming exercise of management roll over ESOPs 4 . Amounts based on cash held in NFH’s trust account after redemption 5 . FPA : Forward Purchase Agreement 6 . Value of management shares at US $ 10 . 0 less estimated income tax of ESOP vesting less repayment of company loan to executives Management roll - over estimated ~85% of net value 6 held pre - transaction Illustrative Pro Forma Valuation Ownership Post-Transaction RMB 1 USD Stake % NFC IPO 12% NFH Share Price 68.00 10.00 NFC FPA 14% (x) Pro Forma Shares Outstanding (mm) 2 133 133 NFC New Issuance 52% Fully Distributed Equity Value 9,075 1,335 NFC SPAC Founders 9% Plus: Pro Forma Net Debt 687 101 Management 3 6% Fully Distributed Enterprise Value 9,762 1,436 Fosun 7% Total 100% Uses of Funds Sources of Funds Quantum Quantum % of RMB 1 USD RMB 1 USD Total Cash Proceeds to Vendors 7,845 1,154 Term Loan A 2,040 300 20% Cash to the Balance Sheet 1,121 165 NFC IPO 4 1,158 170 11% Transaction Fees 232 34 NFC FPA 5 1,292 190 12% Total Cash Uses 9,198 1,353 NFC New Issuance 4,709 692 46% Roll-over Equity 1,139 168 Roll-over Equity 1,139 168 11% Total Uses 10,338 1,520 Total Sources 10,338 1,520 100%

38 38 Qingdao United Family Hospital APPENDIX B – ADDITIONAL MATERIALS
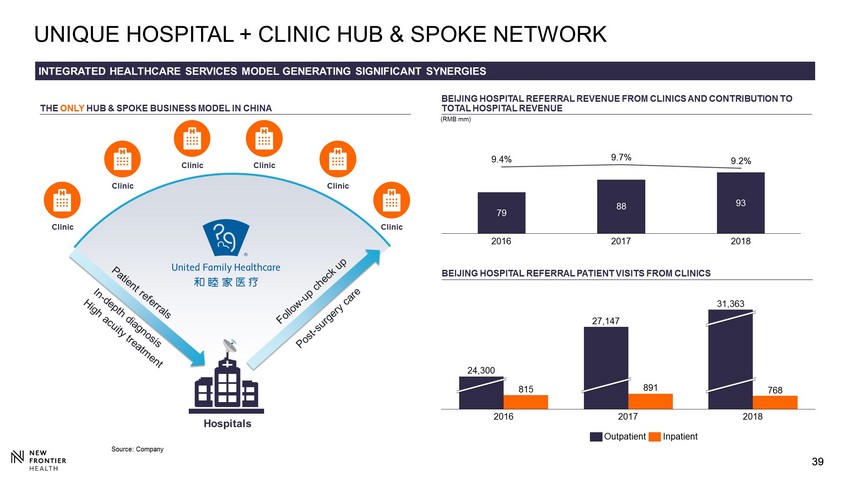
39 39 UNIQUE HOSPITAL + CLINIC HUB & SPOKE NETWORK INTEGRATED HEALTHCARE SERVICES MODEL GENERATING SIGNIFICANT SYNERGIES BEIJING HOSPITAL REFERRAL REVENUE FROM CLINICS AND CONTRIBUTION TO TOTAL HOSPITAL REVENUE (RMB mm) BEIJING HOSPITAL REFERRAL PATIENT VISITS FROM CLINICS THE ONLY HUB & SPOKE BUSINESS MODEL IN CHINA Source: Company Hospitals Clinic Clinic Clinic Clinic Clinic Clinic 79 88 93 9.4% 9.7% 9.2% 2016 2017 2018 815 891 768 27,147 2016 2017 2018 24,300 31,363 Outpatient Inpatient

40 40 OPERATING ASSET – HOSPITAL EXPANSION COMPARISON BJU EXPANSION PROJECTS ; Projected performance of SHU similar to that of BJU from 2012 to 2014 where the size of facility increased ~ 134 % . Revenue in the same period increased by 38 % ; Despite the facility size of SHU increased by more than 2 . 2 x, current case conservatively assumes revenue increase by 39 % SHANGHAI PUXI EXPANSION PROJECTS Pre-Expansion (2012) Post Expansion (2014) % Change 12-14 CAGR Pre-Expansion (2018) Post Expansion (2020E) % Change 18-20 CAGR Area (sqm) 8,351 19,563 134.3% 5,887 19,172 225.7% Bed Number 46 73 58.7% 41 71 73.2% Total Revenue 483 665 37.6% 17.3% 492 682 38.6% 17.7%

41 41 APPENDIX C – BENCHMARKING Guangzhou United Family Hospital

42 42 23.0% 14.3% 29.0% 52.5% 16.8% 5.8% 12.1% 1.4% 13.0% UFH All UFH Operating Assets Aier Eye Hospital Jinxin Fertility IHH Bangkok Dusit Medical Raffles Medical Group Bumrungrad Hospital Apollo Hospitals Average: 40.8% 13.8% 13.4% 36.3% 63.1% 8.4% 7.6% 6.0% 1.5% 17.0% UFH All UFH Operating Assets Aier Eye Hospital Jinxin Fertility IHH Bangkok Dusit Medical Raffles Medical Group Bumrungrad Hospital Apollo Hospitals China Leaders Ex - China Regional Leaders Source: FactSet and company disclosures as of Nov 13, 2019 1. UFH's historical growth has all been derived from organic growth from its own hospitals 2. Operating asset Revenue includes other assets (i.e. Bo’Ao clinic, Hangzhou Clinic, Y uesao (post partum care worker) business and asset light business) 3. Estimated breakout of organic growth and M&A growth 4. Historical revenue CAGR represents 2016 - 2018 CAGR as previous financial data is not available 5. Adjusted to exclude IHH's acquisition of Global Hospitals in 2015 6. Apollo Hospitals underwent a large capacity expansion project between 2015 and 2018 and also acquired Nova Specialty Hospi tal s (11 hospitals in total) in Jan 2015 3 5 Average: 13.6% Average: 49.7% Average: 8.1% 2018A - 2020E REVENUE CAGR (%) 1 1,2 3 1 1,2 Average: 9.8% China Leaders Ex - China Regional Leaders Average: 18.7% Est. Organic growth Est. M&A 3 2015A - 2018A REVENUE CAGR (%) 6 Est. Organic growth Est. M&A 3 BENCHMARKING ANALYSIS 4

43 43 115.5% 19.8% 25.2% 56.2% 19.3% 7.4% 0.8% nm 24.2% UFH All UFH Operating Assets Aier Eye Hospital Jinxin Fertility IHH Bangkok Dusit Medical Raffles Medical Group Bumrungrad Hospital Apollo Hospitals 14.2% 34.9% 38.4% 69.5% 5.0% 6.5% 3.1% 5.5% 8.0% UFH All UFH Operating Assets Aier Eye Hospital Jinxin Fertility IHH Bangkok Dusit Medical Raffles Medical Group Bumrungrad Hospital Apollo Hospitals 2015A - 2018A Adjusted EBITDA CAGR (%) Source: FactSet and company disclosures as of Nov 13, 2019 1. UFH's historical growth has all been derived from organic growth from its own hospitals 2. Operating asset EBITDA includes other assets (i.e. Bo’Ao clinic, Hangzhou Clinic, Yuesao (post partum care worker) business and asset light business) 3. Breakout of organic growth and M&A growth based on company estimates 4. Historical adjusted EBITDA CAGR represents 2016 - 2018 CAGR as previous financial data is not available 5. Adjusted to exclude IHH's acquisition of Global Hospitals in 2015 Average: 24.6% 2018A - 2020E Adjusted EBITDA CAGR (%) Average: 5.6% Average: 67.7% 1 1,2 Average: 12.9% Average: 54.0% 3 5 1 1,2 3 3 Est. Organic growth Est. M&A Est. Organic growth Est. M&A China Leaders Ex - China Regional Leaders China Leaders Ex - China Regional Leaders Average: 40.7% BENCHMARKING ANALYSIS (CONT’D) 4 3
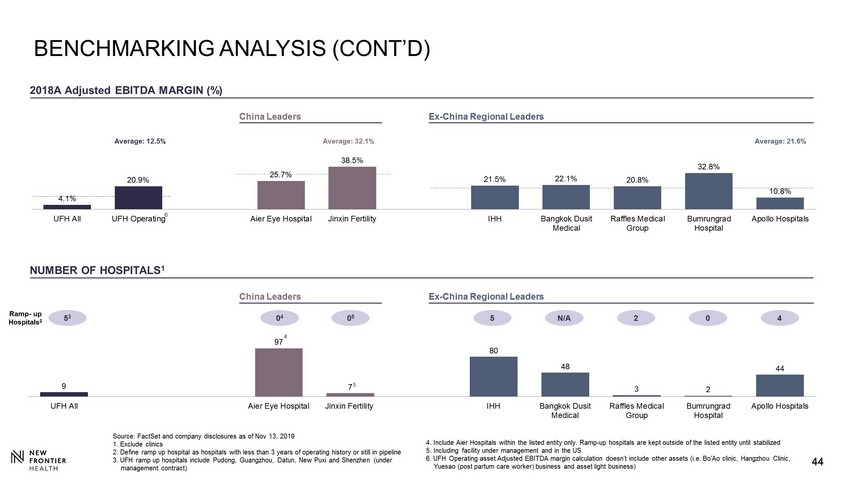
44 44 4.1% 20.9% 25.7% 38.5% 21.5% 22.1% 20.8% 32.8% 10.8% UFH All UFH Operating Aier Eye Hospital Jinxin Fertility IHH Bangkok Dusit Medical Raffles Medical Group Bumrungrad Hospital Apollo Hospitals 2018A Adjusted EBITDA MARGIN (%) China Leaders Ex - China Regional Leaders Source: FactSet and company disclosures as of Nov 13, 2019 1. Exclude clinics 2. Define ramp up hospital as hospitals with less than 3 years of operating history or still in pipeline 3. UFH ramp up hospitals include Pudong, Guangzhou, Datun, New Puxi and Shenzhen (under management contract) NUMBER OF HOSPITALS 1 Average: 12.5% Average: 32.1% Average: 21.6% 4. Include Aier Hospitals within the listed entity only. Ramp - up hospitals are kept outside of the listed entity until stabilize d 5. Including facility under management and in the US 6. UFH Operating asset Adjusted EBITDA margin calculation doesn’t include other assets (i.e. Bo’Ao clinic, Hangzhou Clinic, Yuesao (post partum care worker) business and asset light business) 6 9 97 7 80 48 3 2 44 UFH All Aier Eye Hospital Jinxin Fertility IHH Bangkok Dusit Medical Raffles Medical Group Bumrungrad Hospital Apollo Hospitals China Leaders Ex - China Regional Leaders 4 Ramp - up Hospitals 2 5 3 0 4 0 5 5 N/A 2 0 4 BENCHMARKING ANALYSIS (CONT’D) 5

45 45 3.9x 13.6x 14.7x 4.2x 4.9x 3.5x 4.9x 2.1x 3.1x 10.5x 12.2x 3.8x 4.6x 3.0x 4.7x 1.9x 2.6x 7.5x 9.9x 3.5x 4.2x 2.7x 4.6x 1.7x UFH All Aier Eye Hospital Jinxin Fertility IHH Bangkok Dusit Medical Raffles Medical Group Bumrungrad Hospital Apollo Hospitals 2019E 2020E 2021E 70.0x 25.0x 56.3x 40.2x 18.8x 22.0x 19.0x 15.5x 17.3x 24.9x 18.4x 43.6x 30.3x 16.9x 20.5x 18.0x 14.8x 14.8x 15.6x 13.3x 33.0x 23.7x 15.3x 18.9x 15.8x 14.2x 13.0x UFH All UFH (excl. Losses from Expansion Assets) Aier Eye Hospital Jinxin Fertility IHH Bangkok Dusit Medical Raffles Medical Group Bumrungrad Hospital Apollo Hospitals 2019E 2020E 2021E EV/REVENUE EV/A djusted EBITDA 2019E Average: 14.2x 2020E Average: 11.4x 2021E Average: 8.7x 2019E Average: 3.9x 2020E Average: 3.6x 2021E Average: 3.3x 2019E Average: 48.3x 2020E Average: 37.0x 2021E Average: 28.4x 2019E Average: 18.5x 2020E Average: 17.0x 2021E Average: 15.4x Source: FactSet consensus estimates as of Nov 13, 2019 1. UFH (excl. losses from new assets)'s multiples are calculated based on Adjusted EBITDA of UFH excluding losses from expans ion assets (i.e. excludes Guangzhou / Pudong / Datun in 2019; excludes Pudong / Datun in 2020; and excludes Datun only in 2021) with allocation of 50% HQ cost China Leaders Ex - China Regional Leaders TEV = US$ 1.44bn China Leaders Ex - China Regional Leaders TEV = US$ 1.44bn BENCHMARKING ANALYSIS (CONT’D)

46 46 Source: FactSet consensus estimates as of Nov 13, 2019 1. Expected book value calculated based on net asset as of Mar 31, 2019 excluding 2019 estimated net loss with capital inject ion in 2019 for CAPEX added BENCHMARKING ANALYSIS (CONT’D) 2.3x 20.0x 4.0x 1.9x 4.7x 2.2x 4.6x 5.2x n.a. 16.7x 3.7x 1.8x 4.4x 2.2x 4.2x 4.7x n.a. 12.7x 2.5x 1.8x 4.1x 2.1x 3.9x 4.2x UFH All Aier Eye Hospital Jinxin Fertility IHH Bangkok Dusit Medical Raffles Medical Group Bumrungrad Hospital Apollo Hospitals 2019E 2020E 2021E P/B 1 China Leaders Ex - China Regional Leaders Equity value = US$1.32bn 2019E Average: 3.7x 2020E Average: 3.5x 2021E Average: 3.2x 2019E Average: 12.0x 2020E Average: 10.2x 2021E Average: 7.6x

47 47 APPENDIX D – DIVISIONAL DEEP DIVE Shenzhen United Family Hospital (2021)

48 48 1,390 1,909 2,150 2,210 5,535 10,943 0 4,000 8,000 12,000 2013A 2018E 2023E 744 829 646 1,080 1,280 434 200 BEIJING MARKET OVERVIEW 13 27 55 115 298 608 33 35 40 161 360 703 0 200 400 600 800 2013A 2018E 2023E Local Insurance Coverage Local Out of Pocket Expat Supply Demand Mid - to High - End Inpatient Supply and Demand Disparity 2,4 (No. of Beds) Beijing Market Size - Total No. of Addressable Households 1 (000's) Beijing Market Size - By Specialty (US$ mm) 3 Total No. of Mid - to High - End Hospital Beds Supply 4 (No. of Beds) 1.6x 2.9x 5.1x 2018E 2018E 2018E 2018E 2023E 2023E 2023E 2023E Source: NHFPC, Company Analysis 1. Total addressable households are calculated using the sum of expats, affluent households and local insurance coverage Addressable households defined as households with annual income more than 324K RMB 2. Demand is calculated through addressable market size (# households 2018 in model x household size) and bed per population whi ch is assumed to be 4.57 beds per thousand people in 2013 and 5.06 beds per thousand people in 2018 - 2023, according to CEIC stats; supply is based on # of beds for public hospital VIP wards and private premium hospitals in 2 018 3. Exchange rate at USD:RMB = 1.00 : 6.80 4. Exclude AmCare / Beijing Children’s Hospital in Daxing Huangcun (estimated opening in 2020) and PKUIH new international hospital (2014/2016) 2014A - 2018E New Hospitals 2018E 2019E - 2023E New Hospitals 2013A Public Private 85 519 1,390 1,909 241 2,150 41 870 2023E All 200 new private hospital beds are from UFH 37% 13% % increase of new mid - to - high - end hospital beds 159 121 149 163 315 305 319 495 OB/GYN Pediatrics GP Orthopedics

49 医者仁心 一路相随 With You All The Way Beijing United Family Hospital Beijing Rehabilitation Hospital UFH Beijing – Hub And Spoke Model 49 High - tech cluster Financial District Embassy area CBD University cluster SOE headquarters Expats cluster Airport Wealthy local community
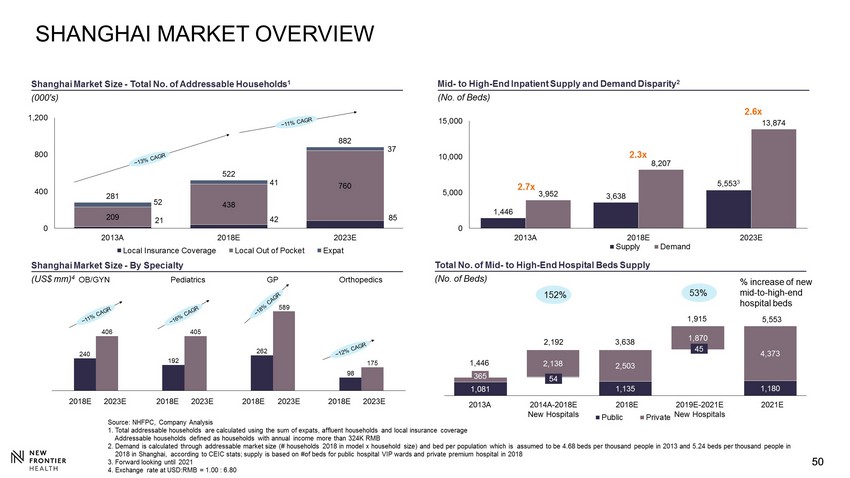
50 50 1,081 1,135 1,180 2,503 4,373 2,138 1,870 1,446 3,638 5,553 3 3,952 8,207 13,874 0 5,000 10,000 15,000 2013A 2018E 2023E SHANGHAI MARKET OVERVIEW Mid - to High - End Inpatient Supply and Demand Disparity 2 (No. of Beds) Shanghai Market Size - By Specialty (US$ mm) 4 Total No. of Mid - to High - End Hospital Beds Supply (No. of Beds) 21 42 85 209 438 760 52 41 37 281 522 882 0 400 800 1,200 2013A 2018E 2023E 2018E 2018E 2018E 2018E 2023E 2023E 2023E 2023E Source: NHFPC, Company Analysis 1. Total addressable households are calculated using the sum of expats, affluent households and local insurance coverage Addressable households defined as households with annual income more than 324K RMB 2. Demand is calculated through addressable market size (# households 2018 in model x household size) and bed per population whi ch is assumed to be 4.68 beds per thousand people in 2013 and 5.24 beds per thousand people in 2018 in Shanghai, according to CEIC stats; supply is based on #of beds for public hospital VIP wards and private premium hos pital in 2018 3. Forward looking until 2021 4. Exchange rate at USD:RMB = 1.00 : 6.80 54 3,638 45 1,446 2,192 1,915 Shanghai Market Size - Total No. of Addressable Households 1 (000's) Public Private 2.7x 2.3x 2.6x 2014A - 2018E New Hospitals 2018E 2019E - 2021E New Hospitals 2021E 2013A 5,553 Supply Demand 152% 53% % increase of new mid - to - high - end hospital beds 365 Local Insurance Coverage Local Out of Pocket Expat 240 192 262 98 406 405 589 175 OB/GYN Pediatrics GP Orthopedics
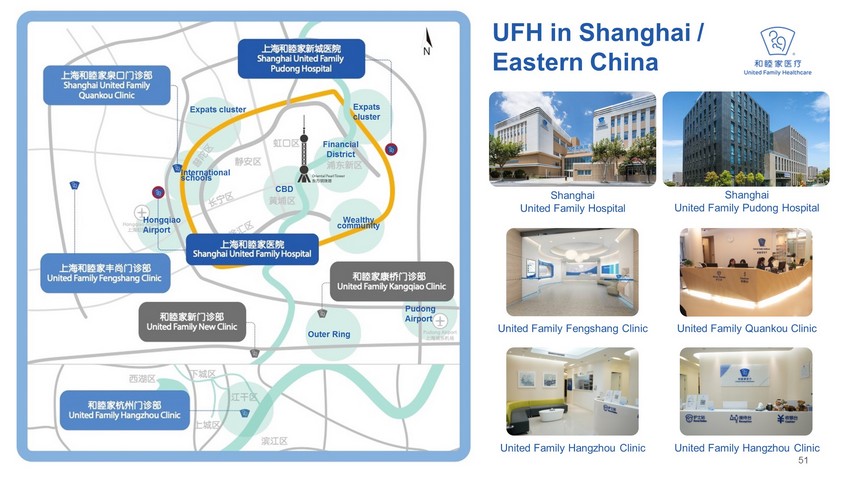
51 医者仁心 一路相随 With You All The Way UFH in Shanghai / Eastern China 51 Shanghai United Family Hospital Shanghai United Family Pudong Hospital United Family Fengshang Clinic United Family Quankou Clinic United Family Hangzhou Clinic United Family Hangzhou Clinic Financial District CBD Expats cluster Wealthy community International schools Expats cluster Outer Ring Hongqiao Airport Pudong Airport

52 52 % increase of new mid - to - high - end hospital beds 386 425 264 614 914 350 300 615 1,000 1,339 4 1,409 3,539 8,433 0 3,000 6,000 9,000 2013A 2018E 2023E GUANGZHOU MARKET OVERVIEW Mid - to High - End Inpatient Supply and Demand Disparity 2 (No. of Beds) Total No. of Mid - to High - End Hospital Beds Supply (No. of Beds) Supply Demand 4 6 12 87 208 512 10 11 12 100 225 536 0 200 400 600 800 2013A 2018E 2023E Guangzhou Market Size - By Specialty (US$ mm) 3 2018E 2018E 2018E 2018E 2023E 2023E 2023E 2023E Source: NHFPC, Company Analysis 1. Total addressable households are calculated using the sum of expats, affluent households and local insurance coverage Addressable households defined as households with annual income more than 324K RMB 2. Bed demand calculated by addressable market size (number of households x average household size) and bed per population (4 .68 in 2013 and 5.24 in 2018 - 2023) 3. Exchange rate at USD:RMB = 1.00 : 6.80 4. Forward looking until 2020 1,339 351 35 39 615 385 1,000 339 Guangzhou Market Size - Total No. of Addressable Households 1 (000's) Public Private 2.3x 3.5x 6.3x 2014A - 2018E New Hospitals 2018E 2019E - 2023E New Hospitals 2013A 2023E 63% 34% 100 from UFH Local Insurance Coverage Local Out of Pocket Expat OB/GYN Pediatrics GP Orthopedics 84 27 18 42 231 71 46 139

53 医者仁心 一路相随 With You All The Way UFH in Guangzhou / Greater - Bay - Area United Family Guangzhou Clinic Guangzhou United Family Hospital 53 Bo’ao United Family Medical Center Shenzhen Foshan 博鳌和睦家医疗中心 Bo’ao United Family Medical Center University District Financial District International schools UFH Guangzhou Clinic Guangzhou High - Speed Rail Station 2
54 54 High Net Worth Population (000's) GDP per capita RMB Average number Beds per 1,000 citizens # Beds SHENZHEN MARKET OVERVIEW Source: National Bureau of Statistics, Provincial Bureau of Statistics, Health Planning Commission, Hurun, Fudan University H osp ital Management Institute; as of 2018 183,127 150,678 134,607 124,606 84,666 63,412 128,994 119,441 Chengdu Guangzhou Hangzhou Shenzhen Shanghai Chongqing Beijing Tianjin 3.18 5.64 7.41 4.55 7.92 4.89 5.25 4.13 3 4 5 15 18 44 64 71 230 263 0 50 100 150 200 250 300 Hangzhou Guangzhou Shenzhen Shanghai Beijing Net worth >RMB10mn Net worth >RMB1bn 4 9 0 20 21 0 5 10 15 20 25 Hangzhou Guangzhou Shenzhen Shanghai Beijing # hospitals No. of Hospitals in the Top 100 Rankings
55 55 Timetable Business Model Overview Planned UFH Hospital ; A total of 10 new hospitals are expected to open in Shenzhen by 2021 ; Most of these hospitals will be located in the outskirts of Shenzhen (none in Inner Shenzhen) OVERVIEW OF UFH IN SHENZHEN UFH in Shenzhen ; Management contract model which reduces investment risk while providing quicker returns on capital (New Frontier majority owns the Propco (land and building) and will invest an additional ~US$ 100mm to build up the hospital) Shenzhen Hospital Landscape Commercial Centre ; New Frontier completed Propco acquisition in Jan 19 ; Construction will commence in Q1 19 with operations commencing in 2021 ; Strategically located in Shenzhen CBD (above downtown metro station). 5 minutes drive from Hong Kong border and high speed rail ; The only large - scale private hospital in Shenzhen CBD (no new supply of large private hospital in downtown Shenzhen planned in the next 5 years) ; 64,000 sqm; ~250 - 300 planned licensed bed count ; High - end specialty services focused, offering services such as high - end OB/GYN, orthopaedics, pediatrics , oncology, dermatology / cosmetology and more Hong Kong Border Shenzhen Baoan Airport Futian Port Tencent HQ Tech Center Inner Shenzhen Outer Shenzhen High End Residential Area High - Speed Railway Station Source: Company

56 56 APPENDIX E - EBITDA RECONCILIATION Beijing United Family Rehabilitation Hospital

57 57 RECONCILIATION OF HISTORICAL ADJ. EBITDA TO NET INCOME / (LOSS) Notes: 1. Miscellaneous income, net are other income and expense not attributable to operating expenses and finance expenses, such a s g ains on disposal of held - to - sale assets 2. Monitoring fee payable to TPG and Fosun each year are not related to business operation (RMB mm) 2015A 2016A 2017A 2018A 2018 H1A 2019 H1A Revenue 1,395 1,675 1,828 2,059 990 1,206 Net income / (loss) (129) (2) 2 (154) (30) (121) Adjustments A1) Depreciation and amortization 110 112 116 139 61 169 A2) Share-based compensation 39 33 23 18 9 21 A3) Income tax expense 3 62 67 60 30 41 A4) Finance expenses, net 27 29 (1) 51 4 68 A5) Miscellaneous income, net 1 3 3 (23) (33) 12 1 A6) Lease expense adj. as a result of adoption of IFRS 16 - - - - - (101) B1) Monitoring fee payable to TPG and Fosun 2 3 4 4 4 2 2 B2) One-off transaction fees - - - - - 5 Subtotal of adjustments 185 243 185 238 117 205 Adjusted EBITDA 57 241 186 84 86 84
Serious News for Serious Traders! Try StreetInsider.com Premium Free!
You May Also Be Interested In
- Middlefield Canadian Income PCC: Net Asset Value(s)
- Audience Intelligence Company Tunnl Announces Reach & Frequency, Linear TV Measurement Solution
- Lido Advisors' Greg Kushner, Alexandra Browne, and Michael Karsa Recognized Among Forbes' Top Wealth Advisors
Create E-mail Alert Related Categories
SEC FilingsSign up for StreetInsider Free!
Receive full access to all new and archived articles, unlimited portfolio tracking, e-mail alerts, custom newswires and RSS feeds - and more!
