

Form 10-Q TECH DATA CORP For: Oct 31
 Tweet
Tweet Share
ShareUNITED STATES
SECURITIES AND EXCHANGE COMMISSION
Washington, D.C. 20549
FORM 10-Q
(Mark One)
x | QUARTERLY REPORT PURSUANT TO SECTION 13 OR 15(d) OF THE SECURITIES EXCHANGE ACT OF 1934 |
For the quarterly period ended October 31, 2018
OR
¨ | TRANSITION REPORT PURSUANT TO SECTION 13 or 15(d) OF THE SECURITIES EXCHANGE ACT OF 1934 |
For the transition period from to .
Commission File Number 0-14625

TECH DATA CORPORATION
(Exact name of Registrant as specified in its charter)
Florida | No. 59-1578329 |
(State or other jurisdiction of incorporation or organization) | (I.R.S. Employer Identification Number) |
5350 Tech Data Drive Clearwater, Florida | 33760 |
(Address of principal executive offices) | (Zip Code) |
(Registrant’s Telephone Number, including Area Code): (727) 539-7429
Indicate by check mark whether the registrant (1) has filed all reports required to be filed by Section 13 or 15(d) of the Securities Exchange Act of 1934 during the preceding 12 months (or shorter period that the registrant was required to file such reports), and (2) has been subject to such filing requirements for the past 90 days. Yes x No ¨
Indicate by check mark whether the registrant has submitted electronically every Interactive Data File required to be submitted pursuant to Rule 405 of Regulation S-T (§232.405 of this chapter) during the preceding 12 months (or for such shorter period that the registrant was required to submit such files). Yes x No ¨
Indicate by check mark whether the registrant is a large accelerated filer, an accelerated filer, a non-accelerated filer, a smaller reporting company or an emerging growth company. See the definitions of “accelerated filer”, “large accelerated filer”, “smaller reporting company” and "emerging growth company" in Rule 12b-2 of the Exchange Act. (Check one):
Large accelerated Filer | x | Accelerated Filer | ¨ |
Non-accelerated Filer | ¨ | Smaller Reporting Company Filer | ¨ |
Emerging Growth Company | ¨ | ||
If an emerging growth company, indicate by check mark if the registrant has elected not to use the extended transition period for complying with any new or revised financial accounting standards provided pursuant to Section 13(a) of the Exchange Act. ¨
Indicate by check mark whether the registrant is a shell company (as defined in Rule 12b-2 of the Act). Yes ¨ No x
Indicate the number of shares outstanding of each of the registrant’s classes of common stock, as of the latest practicable date.
Class | Outstanding at November 29, 2018 |
Common stock, par value $.0015 per share | 37,317,756 |
1
TECH DATA CORPORATION AND SUBSIDIARIES
Form 10-Q for the Three and Nine Months Ended October 31, 2018
INDEX
PAGE | ||
PART I. | ||
ITEM 1. | ||
ITEM 2. | ||
ITEM 3. | ||
ITEM 4. | ||
PART II. | ||
ITEM 1. | ||
ITEM 1A. | ||
ITEM 2 | ||
ITEM 3. | ||
ITEM 4. | ||
ITEM 5. | ||
ITEM 6. | ||
2
PART I. FINANCIAL INFORMATION
ITEM 1. | Financial Statements |
TECH DATA CORPORATION AND SUBSIDIARIES
CONSOLIDATED BALANCE SHEET
(In thousands, except par value and share amounts)
(Unaudited)
October 31, 2018 | January 31, 2018 | ||||||
(As Adjusted) | |||||||
ASSETS | |||||||
Current assets: | |||||||
Cash and cash equivalents | $ | 646,479 | $ | 955,628 | |||
Accounts receivable, net | 5,995,247 | 6,035,716 | |||||
Inventories | 3,201,213 | 2,965,521 | |||||
Prepaid expenses and other assets | 342,328 | 403,548 | |||||
Total current assets | 10,185,267 | 10,360,413 | |||||
Property and equipment, net | 268,304 | 279,091 | |||||
Goodwill | 932,409 | 969,168 | |||||
Intangible assets, net | 973,300 | 1,086,772 | |||||
Other assets, net | 200,323 | 224,915 | |||||
Total assets | $ | 12,559,603 | $ | 12,920,359 | |||
LIABILITIES AND SHAREHOLDERS' EQUITY | |||||||
Current liabilities: | |||||||
Accounts payable | $ | 7,073,089 | $ | 6,962,193 | |||
Accrued expenses and other liabilities | 1,054,585 | 1,169,986 | |||||
Revolving credit loans and current maturities of long-term debt, net | 110,330 | 132,661 | |||||
Total current liabilities | 8,238,004 | 8,264,840 | |||||
Long-term debt, less current maturities | 1,301,559 | 1,505,248 | |||||
Other long-term liabilities | 182,251 | 228,779 | |||||
Total liabilities | 9,721,814 | 9,998,867 | |||||
Commitments and contingencies (Note 13) | |||||||
Shareholders’ equity: | |||||||
Common stock, par value $.0015; 200,000,000 shares authorized; 59,245,585 shares issued at October 31, 2018 and January 31, 2018 | 89 | 89 | |||||
Additional paid-in capital | 836,520 | 827,301 | |||||
Treasury stock, at cost (21,507,391 and 21,083,972 shares at October 31, 2018 and January 31, 2018) | (975,090 | ) | (940,124 | ) | |||
Retained earnings | 2,969,715 | 2,745,934 | |||||
Accumulated other comprehensive income | 6,555 | 288,292 | |||||
Total shareholders' equity | 2,837,789 | 2,921,492 | |||||
Total liabilities and shareholders' equity | $ | 12,559,603 | $ | 12,920,359 | |||
The accompanying Notes to Consolidated Financial Statements are an integral part of these financial statements.
3
TECH DATA CORPORATION AND SUBSIDIARIES
CONSOLIDATED STATEMENT OF INCOME
(In thousands, except per share amounts)
(Unaudited)
Three months ended October 31, | Nine months ended October 31, | ||||||||||||||
2018 | 2017 | 2018 | 2017 | ||||||||||||
(As Adjusted) | (As Adjusted) | ||||||||||||||
Net sales | $ | 9,340,029 | $ | 8,448,471 | $ | 26,774,449 | $ | 23,564,444 | |||||||
Cost of products sold | 8,783,425 | 7,922,390 | 25,167,698 | 22,065,684 | |||||||||||
Gross profit | 556,604 | 526,081 | 1,606,751 | 1,498,760 | |||||||||||
Operating expenses: | |||||||||||||||
Selling, general and administrative expenses | 396,675 | 416,766 | 1,234,355 | 1,179,996 | |||||||||||
Acquisition, integration and restructuring expenses | 20,277 | 29,748 | 66,799 | 101,931 | |||||||||||
Legal settlements and other, net | (7,207 | ) | — | (15,406 | ) | (41,343 | ) | ||||||||
Gain on disposal of subsidiary | (29 | ) | — | (6,746 | ) | — | |||||||||
409,716 | 446,514 | 1,279,002 | 1,240,584 | ||||||||||||
Operating income | 146,888 | 79,567 | 327,749 | 258,176 | |||||||||||
Interest expense | 25,405 | 25,925 | 79,380 | 85,205 | |||||||||||
Other expense (income), net | 4,961 | (1,243 | ) | 7,779 | (1,374 | ) | |||||||||
Income before income taxes | 116,522 | 54,885 | 240,590 | 174,345 | |||||||||||
Provision for income taxes | 2,306 | 17,617 | 16,809 | 58,964 | |||||||||||
Net income | $ | 114,216 | $ | 37,268 | $ | 223,781 | $ | 115,381 | |||||||
Earnings per share: | |||||||||||||||
Basic | $ | 2.98 | $ | 0.98 | $ | 5.83 | $ | 3.05 | |||||||
Diluted | $ | 2.96 | $ | 0.97 | $ | 5.80 | $ | 3.03 | |||||||
Weighted average common shares outstanding: | |||||||||||||||
Basic | 38,358 | 38,186 | 38,357 | 37,877 | |||||||||||
Diluted | 38,526 | 38,433 | 38,559 | 38,105 | |||||||||||
The accompanying Notes to Consolidated Financial Statements are an integral part of these financial statements.
4
TECH DATA CORPORATION AND SUBSIDIARIES
CONSOLIDATED STATEMENT OF COMPREHENSIVE INCOME (LOSS)
(In thousands)
(Unaudited)
Three months ended October 31, | Nine months ended October 31, | ||||||||||||||
2018 | 2017 | 2018 | 2017 | ||||||||||||
Net income | $ | 114,216 | $ | 37,268 | $ | 223,781 | $ | 115,381 | |||||||
Other comprehensive (loss) income: | |||||||||||||||
Foreign currency translation adjustment | (91,430 | ) | (54,159 | ) | (281,737 | ) | 174,942 | ||||||||
Total comprehensive income (loss) | $ | 22,786 | $ | (16,891 | ) | $ | (57,956 | ) | $ | 290,323 | |||||
The accompanying Notes to Consolidated Financial Statements are an integral part of these financial statements.
5
TECH DATA CORPORATION AND SUBSIDIARIES
CONSOLIDATED STATEMENT OF CASH FLOWS
(In thousands)
(Unaudited)
Nine months ended October 31, | |||||||
2018 | 2017 | ||||||
(As Adjusted) | |||||||
Cash flows from operating activities: | |||||||
Cash received from customers | $ | 34,190,821 | $ | 30,645,389 | |||
Cash paid to vendors and employees | (33,891,567 | ) | (30,030,519 | ) | |||
Interest paid, net | (82,829 | ) | (73,180 | ) | |||
Income taxes paid | (67,107 | ) | (100,615 | ) | |||
Net cash provided by operating activities | 149,318 | 441,075 | |||||
Cash flows from investing activities: | |||||||
Proceeds from sale of business, net of cash divested | 8,985 | — | |||||
Acquisition of businesses, net of cash acquired | (124,223 | ) | (2,249,642 | ) | |||
Expenditures for property and equipment | (24,830 | ) | (179,114 | ) | |||
Software and software development costs | (15,323 | ) | (34,865 | ) | |||
Other | 1,105 | (662 | ) | ||||
Net cash used in investing activities | (154,286 | ) | (2,464,283 | ) | |||
Cash flows from financing activities: | |||||||
Borrowings on long-term debt | — | 1,008,148 | |||||
Principal payments on long-term debt | (207,854 | ) | (565,952 | ) | |||
Cash paid for debt issuance costs | — | (5,871 | ) | ||||
Net repayments on revolving credit loans | (9,274 | ) | (24,851 | ) | |||
Payments for employee tax withholdings on equity awards | (6,988 | ) | (5,915 | ) | |||
Proceeds from the reissuance of treasury stock | 1,322 | 1,079 | |||||
Cash paid for purchase of treasury stock | (43,798 | ) | — | ||||
Net cash (used in) provided by financing activities | (266,592 | ) | 406,638 | ||||
Effect of exchange rate changes on cash and cash equivalents | (37,589 | ) | 53,624 | ||||
Net decrease in cash and cash equivalents | (309,149 | ) | (1,562,946 | ) | |||
Cash and cash equivalents at beginning of year | 955,628 | 2,125,591 | |||||
Cash and cash equivalents at end of period | $ | 646,479 | $ | 562,645 | |||
Reconciliation of net income to net cash provided by operating activities: | |||||||
Net income | $ | 223,781 | $ | 115,381 | |||
Adjustments to reconcile net income to net cash provided by operating activities: | |||||||
Gain on disposal of subsidiary | (6,746 | ) | — | ||||
Depreciation and amortization | 119,641 | 112,907 | |||||
Provision for losses on accounts receivable | 11,545 | 13,191 | |||||
Stock-based compensation expense | 23,694 | 21,217 | |||||
Accretion of debt discount and debt issuance costs | 1,134 | 1,692 | |||||
Deferred income taxes | (11,567 | ) | 1,312 | ||||
Changes in operating assets and liabilities, net of acquisitions and disposition: | |||||||
Accounts receivable | (309,390 | ) | 190,070 | ||||
Inventories | (397,692 | ) | (416,832 | ) | |||
Prepaid expenses and other assets | (1,871 | ) | (3,500 | ) | |||
Accounts payable | 474,214 | 470,569 | |||||
Accrued expenses and other liabilities | 22,575 | (64,932 | ) | ||||
Total adjustments | (74,463 | ) | 325,694 | ||||
Net cash provided by operating activities | $ | 149,318 | $ | 441,075 | |||
Supplemental schedule of non-cash investing activities: | |||||||
Issuance of stock to acquire business | $ | — | $ | 247,232 | |||
The accompanying Notes to Consolidated Financial Statements are an integral part of these financial statements.
6
TECH DATA CORPORATION AND SUBSIDIARIES
NOTES TO CONSOLIDATED FINANCIAL STATEMENTS
(Unaudited)
NOTE 1 — BUSINESS AND SUMMARY OF SIGNIFICANT ACCOUNTING POLICIES
Description of Business
Tech Data Corporation (“Tech Data” or the “Company”) is one of the world’s largest wholesale distributors of technology products. Tech Data serves as a vital link in the evolving technology ecosystem by bringing products from the world’s leading technology vendors to market, as well as helping customers create solutions best suited to maximize business outcomes for their end-user customers. Tech Data’s customers include value-added resellers, direct marketers, retailers and corporate resellers who support the diverse technology needs of end users. The Company manages its operations in three geographic segments: the Americas, Europe and Asia-Pacific.
Principles of Consolidation
The consolidated financial statements include the accounts of Tech Data and its subsidiaries. All significant intercompany accounts and transactions have been eliminated in consolidation. The Company operates on a fiscal year that ends on January 31.
Basis of Presentation
The consolidated financial statements have been prepared by the Company, without audit, pursuant to the rules and regulations of the United States ("U.S.") Securities and Exchange Commission (“SEC”). The Company prepares its financial statements in conformity with generally accepted accounting principles in the U.S. (“GAAP”). These principles require management to make estimates and assumptions that affect the reported amounts of assets and liabilities and disclosure of contingent assets and liabilities at the date of the financial statements and the reported amounts of revenues and expenses during the reporting period. Actual results could differ from those estimates. In the opinion of management, the accompanying unaudited consolidated financial statements contain all adjustments (consisting of only normal recurring adjustments) necessary to present fairly the consolidated financial position of the Company as of October 31, 2018, its consolidated statements of income, comprehensive income (loss) for the three and nine months ended October 31, 2018 and 2017 and its consolidated cash flows for the nine months ended October 31, 2018 and 2017.
Seasonality
The Company’s quarterly operating results have fluctuated significantly in the past and will likely continue to do so in the future as a result of currency fluctuations and seasonal variations in the demand for the products and services offered. Narrow operating margins may magnify the impact of these factors on the Company's quarterly operating results. Historical seasonal variations have included an increase in European demand during the Company’s fiscal fourth quarter and decreased demand in other fiscal quarters. The seasonal trend in Europe typically results in greater operating leverage, and therefore, lower selling, general and administrative expenses as a percentage of net sales in the region and on a consolidated basis during the second half of the Company's fiscal year, particularly in the Company's fourth quarter. Therefore, the results of operations for the three and nine months ended October 31, 2018 and 2017 are not necessarily indicative of the results that can be expected for the entire fiscal year ended January 31, 2019.
Additionally, the comparability of financial information between periods is impacted by the timing of the acquisition of Avnet, Inc.'s ("Avnet") Technology Solutions business (“TS”), which occurred on February 27, 2017 (see Note 4 - Acquisitions for further discussion). Therefore, the results of operations for the nine months ended October 31, 2018 include an additional month of TS operations, as compared to the nine months ended October 31, 2017.
Acquisition, integration and restructuring expenses
Acquisition, integration and restructuring expenses are primarily comprised of restructuring costs, Information Technology ("IT") related costs, professional services, transaction related costs and other costs related to the fiscal 2018 acquisition of TS, as well as restructuring costs related to the Global Business Optimization Program which was initiated in fiscal 2019 (see Note 5 – Acquisition, Integration and Restructuring Expenses for further discussion).
Legal settlements and other, net
The Company has been a claimant in proceedings seeking damages from certain manufacturers of LCD flat panel and cathode ray tube displays, as well as reimbursement from insurance providers of certain costs incurred by the Company associated with the restatement of certain of the Company’s consolidated financial statements and other financial information from fiscal 2009 to 2013. The Company reached settlement agreements during the periods presented and has recorded these amounts, net of attorney fees and expenses, in “legal settlements and other, net” in the Consolidated Statement of Income.
7
Accounts Receivable Purchase Agreements
The Company has uncommitted accounts receivable purchase agreements under which certain accounts receivable may be sold, without recourse, to third-party financial institutions. Under these programs, the Company may sell certain accounts receivable in exchange for cash less a discount, as defined in the agreements. Available capacity under these programs, which the Company uses as a source of working capital funding, is dependent on the level of accounts receivable eligible to be sold into these programs and the financial institutions' willingness to purchase such receivables. In addition, certain of these agreements also require that the Company continue to service, administer and collect the sold accounts receivable. At October 31, 2018 and January 31, 2018, the Company had a total of $924.6 million and $687.2 million, respectively, of outstanding accounts receivable sold to and held by financial institutions under these agreements. During the three months ended October 31, 2018 and 2017, discount fees recorded under these facilities were $4.1 million and $1.8 million, respectively, and during the nine months ended October 31, 2018 and 2017, discount fees recorded under these facilities were $10.5 million and $5.9 million, respectively. These discount fees are included as a component of "other expense (income), net" in the Consolidated Statement of Income.
Recently Adopted Accounting Standards
In May 2014, the FASB issued an accounting standard which supersedes all existing revenue recognition guidance under current GAAP. In March, April, May and December 2016, the FASB issued additional updates to the new accounting standard which provided supplemental adoption guidance and clarifications. The new standard requires the recognition of revenue to depict the transfer of promised goods or services in an amount that reflects the consideration the Company expects to be entitled to in exchange for those goods and services. The Company adopted the standard utilizing the full retrospective method during the quarter ended April 30, 2018. The adoption of this standard impacted the reporting of certain revenues on a gross or net basis, primarily related to changes in the reporting of certain software revenue transactions from a gross basis to a net basis. Additionally, the Company reclassified certain amounts on the consolidated balance sheet related to customer rebates, sales returns and other discounts from a reduction of accounts receivable to accrued expenses and other liabilities as these amounts represent liabilities to customers. Similarly, the Company reclassified certain amounts for the Company's right to recover assets from customers related to sales returns from inventory to prepaid expenses and other assets. The adoption of this standard had no impact on gross profit, operating income, net income or cash flows from operations.
As a result of the adoption of the new revenue recognition standard, certain amounts in the Company’s Consolidated Statement of Income for the three and nine months ended October 31, 2017 and Consolidated Balance Sheet as of January 31, 2018 have been recast as follows:
Three months ended October 31, 2017 | Nine months ended October 31, 2017 | ||||||||||||||||||||||
As Previously Reported | Adjustment for New Accounting Standard on Revenue Recognition | As Adjusted | As Previously Reported | Adjustment for New Accounting Standard on Revenue Recognition | As Adjusted | ||||||||||||||||||
(in thousands) | |||||||||||||||||||||||
Net sales | $ | 9,135,728 | $ | (687,257 | ) | $ | 8,448,471 | $ | 25,682,482 | $ | (2,118,038 | ) | $ | 23,564,444 | |||||||||
Cost of products sold | 8,609,647 | (687,257 | ) | 7,922,390 | 24,183,722 | (2,118,038 | ) | 22,065,684 | |||||||||||||||
As of January 31, 2018: | As Previously Reported | Adjustment for New Accounting Standard on Revenue Recognition | As Adjusted | ||||||||
(in thousands) | |||||||||||
ASSETS | |||||||||||
Accounts receivable, net | $ | 5,783,666 | $ | 252,050 | $ | 6,035,716 | |||||
Inventories | 3,065,218 | (99,697 | ) | 2,965,521 | |||||||
Prepaid expenses and other assets | 288,178 | 115,370 | 403,548 | ||||||||
LIABILITIES AND SHAREHOLDERS' EQUITY | |||||||||||
Accounts payable | $ | 6,947,282 | $ | 14,911 | $ | 6,962,193 | |||||
Accrued expenses and other liabilities | 917,174 | 252,812 | 1,169,986 | ||||||||
8
The following table presents the effect of the adoption of the new revenue recognition standard on the Consolidated Statement of Income for fiscal 2018 by quarter:
First Quarter | Second Quarter | Third Quarter | Fourth Quarter | Fiscal Year 2018 | |||||||||||||||||||||||||||||||||||
As Previously Reported | Adjusted for New Accounting Standard | As Previously Reported | Adjusted for New Accounting Standard | As Previously Reported | Adjusted for New Accounting Standard | As Previously Reported | Adjusted for New Accounting Standard | As Previously Reported | Adjusted for New Accounting Standard | ||||||||||||||||||||||||||||||
(in thousands) | |||||||||||||||||||||||||||||||||||||||
Net sales | $ | 7,664,063 | $ | 7,023,620 | $ | 8,882,691 | $ | 8,092,353 | $ | 9,135,728 | $ | 8,448,471 | $ | 11,092,529 | $ | 10,033,397 | $ | 36,775,011 | $ | 33,597,841 | |||||||||||||||||||
Cost of products sold | $ | 7,206,975 | $ | 6,566,532 | $ | 8,367,100 | $ | 7,576,762 | $ | 8,609,647 | $ | 7,922,390 | $ | 10,475,668 | $ | 9,416,536 | $ | 34,659,390 | $ | 31,482,220 | |||||||||||||||||||
In August 2016, the FASB issued a new accounting standard that addresses how certain cash receipts and cash payments are presented and classified on the statement of cash flows. The Company adopted this standard during the quarter ended April 30, 2018. The adoption of this standard had no material impact on the Company's consolidated financial statements.
In October 2016, the FASB issued a new accounting standard that revises the accounting for the income tax consequences of intra-entity transfers of assets other than inventory. The Company adopted this standard during the quarter ended April 30, 2018. The adoption of this standard had no material impact on the Company's consolidated financial statements.
In May 2017, the FASB issued a new accounting standard that clarifies the guidance regarding the changes to the terms or conditions of a share-based payment award that would require an entity to apply modification accounting. The Company adopted this standard during the quarter ended April 30, 2018. The adoption of this standard had no material impact on the Company's consolidated financial statements.
Recently Issued Accounting Standards
In February 2016, the FASB issued an accounting standard which requires the recognition of assets and liabilities arising from lease transactions on the balance sheet and the disclosure of additional information about leasing arrangements. Under the new guidance, for all leases, interest expense and amortization of the right to use asset will be recorded for leases determined to be financing leases and straight-line lease expense will be recorded for leases determined to be operating leases. Lessees will initially recognize assets for the right to use the leased assets and liabilities for the obligations created by those leases. In July 2018, the FASB issued additional updates to the new accounting standard which provide entities with a transition option to initially account for the impact of the adoption with a cumulative-effect adjustment to the opening balance of retained earnings in the period of adoption. The Company expects to elect this transition option. The accounting standard is effective for the Company beginning with the quarter ending April 30, 2019, with early adoption permitted. The Company has made progress in its assessment phase and is in the process of compiling all agreements that are considered leases under the new guidance and implementing the process and system changes necessary to calculate the impact of the pronouncement on its financial statements. The Company currently expects that the primary impact will be an increase in its total assets and total liabilities due to the recognition of right-of-use assets and corresponding lease liabilities upon implementation for leases currently accounted for as operating leases.
In June 2016, the FASB issued an accounting standard which revises the methodology for measuring credit losses on financial instruments and the timing of the recognition of those losses. Under the new standard, financial assets measured at an amortized cost basis are to be presented net of the amount not expected to be collected via an allowance for credit losses. Estimated credit losses are to be based on historical information adjusted for management's expectation that current conditions and supportable forecasts differ from historical experience. The accounting standard is effective for the Company beginning with the quarter ending April 30, 2020, with early adoption permitted. The Company does not expect the adoption of this standard to have a material impact on its consolidated financial statements.
In August 2017, the FASB issued a new accounting standard that amends and simplifies guidance related to hedge accounting to more accurately portray the economics of an entity’s risk management activities in its financial statements. The accounting standard is effective for the Company beginning with the quarter ending April 30, 2019, with early adoption permitted. The Company does not expect the adoption of this standard to have a material impact on its consolidated financial statements.
In August 2018, the FASB issued a new accounting standard which aligns the capitalization requirements for implementation costs incurred in a cloud computing hosting arrangement that is a service contract with the existing capitalization requirements for implementation costs incurred to develop or obtain internal-use software. The accounting standard is effective for the Company beginning with the quarter ending April 30, 2020, with early adoption permitted. The Company does not expect the adoption of this standard to have a material impact on its consolidated financial statements.
In August 2018, the SEC adopted a final rule that eliminates or amends certain disclosure requirements that were deemed redundant and outdated in light of changes in SEC requirements, U.S. GAAP or changes in technology or the business environment. The rule also requires registrants to include in their interim financial statements a reconciliation of changes in stockholders’ equity in the notes or as a separate statement. The final rule was effective on November 5, 2018, however, registrants may begin providing the new interim
9
reconciliation of stockholders’ equity in the first interim period beginning after the effective date. The Company will present the interim reconciliation of stockholders’ equity in its Form 10-Q beginning with the quarter ending April 30, 2019.
Reclassifications
Certain reclassifications have been made to the prior period amounts to conform to the current period presentation. These reclassifications did not have a material impact on previously reported amounts other than as described above.
10
NOTE 2 — REVENUE RECOGNITION
The Company’s revenues primarily result from the sale of various technology products and services. The Company recognizes revenue as control of products is transferred to customers, which generally happens at the point of shipment. Products sold by the Company are delivered via shipment from the Company’s facilities, dropshipment directly from the vendor, or by electronic delivery of keys for software products. In relation to product support, supply chain management and other services performed by the Company, revenue is recognized over time as the services are performed. Service revenues and related contract liabilities were not material for the periods presented.
The Company has contracts with certain customers where the Company’s performance obligation is to arrange for the products or services to be provided by another party. In these arrangements, as the Company assumes an agency relationship in the transaction, revenue is recognized in the amount of the net fee associated with serving as an agent. These arrangements primarily relate to certain fulfillment contracts, as well as sales of software services and extended warranty services.
The Company allows its customers to return product for exchange or credit subject to certain limitations. A liability is recorded at the time of sale for estimated product returns based upon historical experience and an asset is recognized for the amount expected to be recorded in inventory upon product return. The Company also provides volume rebates and other discounts to certain customers which are considered variable consideration. A provision for customer rebates and other discounts is recorded as a reduction of revenue at the time of sale based on an evaluation of the contract terms and historical experience.
The Company considers shipping & handling activities as costs to fulfill the sales of products. Shipping revenue is included in net sales when control of the product is transferred to the customer, and the related shipping and handling costs are included in cost of products sold. Taxes imposed by governmental authorities on the Company’s revenue producing activities with customers, such as sales taxes and value added taxes, are excluded from net sales.
The Company disaggregates its operating segment revenue by geography, which the Company believes provides a meaningful depiction of the nature of its revenue. Net sales shown in Note 14 – Segment Information includes service revenues, which are not a significant component of total revenue, and are aggregated within the respective geographies.
The following table provides a comparison of sales generated from products purchased from vendors that exceeded 10% of the Company's consolidated net sales for the three and nine months ended October 31, 2018 and 2017 (as a percent of consolidated net sales):
Three months ended October 31, | Nine months ended October 31, | ||||||
2018 | 2017 | 2018 | 2017 | ||||
Apple, Inc. | 17% | 18% | 15% | 16% | |||
HP Inc. | 11% | 11% | 11% | 11% | |||
Cisco Systems, Inc. | 10% | 11% | 11% | 11% | |||
11
NOTE 3 — EARNINGS PER SHARE ("EPS")
The Company presents the computation of earnings per share on a basic and diluted basis. Basic EPS is computed by dividing net income by the weighted average number of shares outstanding during the reported period. Diluted EPS reflects the potential dilution related to equity-based incentives (see Note 9 – Stock-Based Compensation for further discussion) using the treasury stock method. The composition of basic and diluted EPS is as follows:
Three months ended October 31, | Nine months ended October 31, | ||||||||||||||
2018 | 2017 | 2018 | 2017 | ||||||||||||
(in thousands, except per share data) | |||||||||||||||
Net income | $ | 114,216 | $ | 37,268 | $ | 223,781 | $ | 115,381 | |||||||
Weighted average common shares - basic | 38,358 | 38,186 | 38,357 | 37,877 | |||||||||||
Effect of dilutive securities: | |||||||||||||||
Equity based awards | 168 | 247 | 202 | 228 | |||||||||||
Weighted average common shares - diluted | 38,526 | 38,433 | 38,559 | 38,105 | |||||||||||
Earnings per share: | |||||||||||||||
Basic | $ | 2.98 | $ | 0.98 | $ | 5.83 | $ | 3.05 | |||||||
Diluted | $ | 2.96 | $ | 0.97 | $ | 5.80 | $ | 3.03 | |||||||
For the three months ended October 31, 2018 and 2017, there were 45,072 and 15,739 shares, respectively, excluded from the computation of diluted earnings per share because their effect would have been antidilutive. For the nine months ended October 31, 2018 and 2017, there were 43,783 and 30,578 shares, respectively, excluded from the computation of diluted earnings per share because their effect would have been antidilutive.
NOTE 4 — ACQUISITIONS
Acquisition of TS
On February 27, 2017, Tech Data acquired all of the outstanding shares of TS for an aggregate purchase price of approximately $2.8 billion, comprised of approximately $2.5 billion in cash and 2,785,402 shares of the Company's common stock, valued at approximately $247 million based on the closing price of the Company's common stock on February 27, 2017. The total cash consideration payable to Avnet was subject to certain working capital and other adjustments, as determined through the process established in the interest purchase agreement. In August 2018, the Company executed a settlement agreement with Avnet, resulting in a final working capital adjustment of $120 million which was paid to Avnet during the three months ended October 31, 2018. As the measurement period has concluded, a gain of $9.6 million was recorded in “acquisition, integration and restructuring expenses” in the Consolidated Statement of Income for the nine months ended October 31, 2018, representing the difference between the final working capital adjustment and the Company’s prior estimate. Additionally, as part of the settlement agreement, the Company and Avnet reached agreement on the final geographic allocation of the purchase price for tax reporting purposes which resulted in the recognition of a deferred tax asset in the U.S. for future tax deductions related to the amortization of goodwill for tax purposes. The recognition of the deferred tax asset in the U.S. resulted in an income tax benefit of $0.2 million during the three months ended October 31, 2018 and $13.0 million during the nine months ended October 31, 2018.
12
The Company has accounted for the TS acquisition as a business combination and allocated the purchase price to the fair values of assets acquired and liabilities assumed. The allocation of the purchase price to assets acquired and liabilities assumed is as follows:
(in millions) | |||
Cash | $ | 176 | |
Accounts receivable | 1,830 | ||
Inventories | 239 | ||
Prepaid expenses and other current assets | 100 | ||
Property and equipment, net | 62 | ||
Goodwill | 727 | ||
Intangible assets | 919 | ||
Other assets, net | 151 | ||
Total assets | 4,204 | ||
Other current liabilities | 1,169 | ||
Revolving credit loans and long-term debt | 134 | ||
Other long-term liabilities | 99 | ||
Total liabilities | 1,402 | ||
Purchase price | $ | 2,802 | |
Identifiable intangible assets are comprised of approximately $875 million of customer relationships with a weighted-average amortization period of 14 years and $44 million of trade names with an amortization period of 5 years.
The following table presents unaudited supplemental pro forma information as if the TS acquisition had occurred at the beginning of fiscal 2017. The pro forma results presented are based on combining the stand-alone operating results of the Company and TS for the periods prior to the acquisition date after giving effect to certain adjustments related to the transaction. The pro forma results exclude any benefits that may result from potential cost synergies of the combined company and certain non-recurring costs. As a result, the pro forma information below does not purport to present what actual results would have been had the acquisition actually been consummated on the date indicated and it is not necessarily indicative of the results of operations that may result in the future.
Three months ended October 31: | Nine months ended October 31: | ||||||
2017 | 2017 | ||||||
(in millions) | |||||||
Pro forma net sales | $ | 8,448 | $ | 24,234 | |||
Pro forma net income | $ | 39 | $ | 126 | |||
Adjustments reflected in the pro forma results include the following:
• | Amortization of acquired intangible assets |
• | Interest costs associated with the transaction |
• | Removal of certain non-recurring transaction costs |
• | Tax effects of adjustments based on an estimated statutory tax rate |
13
NOTE 5 — ACQUISITION, INTEGRATION AND RESTRUCTURING EXPENSES
Acquisition, integration and restructuring expenses are comprised of costs related to the fiscal 2018 acquisition of TS as well as restructuring costs related to the Global Business Optimization Program which was initiated in fiscal 2019.
Acquisition of TS
Acquisition, integration and restructuring expenses related to the acquisition of TS are primarily comprised of restructuring costs, IT related costs, professional services, transaction related costs and other costs. Restructuring costs are comprised of severance and facility exit costs. IT related costs consist primarily of data center and non-ERP application migration and integration costs, as well as, IT related professional services. Professional services are primarily comprised of integration related activities, including professional fees for project management, accounting, tax and other consulting services. Transaction related costs primarily consist of investment banking fees, legal expenses and due diligence costs incurred in connection with the completion of the transaction. Other costs includes payroll related costs including retention, stock compensation, relocation and travel expenses, incurred as part of the integration of TS. For the nine months ended October 31, 2018, other costs are partially offset by the gain recorded related to the settlement agreement with Avnet (see Note 4 – Acquisitions for further discussion).
Acquisition, integration and restructuring expenses for the three and nine months ended October 31, 2018 and 2017 related to the acquisition of TS are comprised of the following:
Three months ended October 31, | Nine months ended October 31, | ||||||||||||||
2018 | 2017 | 2018 | 2017 | ||||||||||||
(in thousands) | |||||||||||||||
Restructuring costs | $ | 1,618 | $ | 6,861 | $ | 16,267 | $ | 24,188 | |||||||
IT related costs | 2,120 | 5,688 | 10,606 | 12,044 | |||||||||||
Professional services | 807 | 9,622 | 5,213 | 30,691 | |||||||||||
Transaction related costs | 268 | 1,925 | 1,461 | 19,154 | |||||||||||
Other costs | 2,340 | 5,652 | 1,785 | 15,854 | |||||||||||
Total | $ | 7,153 | $ | 29,748 | $ | 35,332 | $ | 101,931 | |||||||
During the three months ended October 31, 2018 and 2017, the Company recorded restructuring costs in Europe of $1.6 million and $4.9 million, respectively. During the three months ended October 31, 2017, the Company recorded restructuring costs in the Americas of $2.0 million. During the nine months ended October 31, 2018 and 2017, the Company recorded restructuring costs in the Americas of $3.6 million and $12.4 million, respectively, and in Europe of $12.7 million and $11.8 million, respectively. The accrued restructuring charges are included in “accrued expenses and other liabilities” in the Consolidated Balance Sheet.
Restructuring activity during the nine months ended October 31, 2018 related to the acquisition of TS is as follows:
Nine months ended October 31, 2018 | ||||||||||||
Severance | Facility Exit Costs | Total | ||||||||||
(in thousands) | ||||||||||||
Balance at January 31, 2018 | $ | 13,366 | $ | 1,630 | $ | 14,996 | ||||||
Fiscal 2019 restructuring expenses | 13,238 | 3,029 | 16,267 | |||||||||
Cash payments | (17,277 | ) | (2,015 | ) | (19,292 | ) | ||||||
Foreign currency translation | (1,011 | ) | (228 | ) | (1,239 | ) | ||||||
Balance at October 31, 2018 | $ | 8,316 | $ | 2,416 | $ | 10,732 | ||||||
Global Business Optimization Program
On August 29, 2018, the Company's Board of Directors approved the Global Business Optimization Program (the "GBO Program") to increase investment in the Company’s strategic priorities and implement operational initiatives to drive productivity and enhance profitability. Under the GBO Program, the Company expects to incur cash charges of approximately $70 million to $80 million, primarily comprised of $40 million to $45 million of charges in Europe and $30 million to $35 million of charges in the Americas. The majority of these charges will be incurred prior to the end of fiscal 2020. The cash charges primarily consist of severance costs, and also include professional services and other costs.
14
Restructuring expenses for the three and nine months ended October 31, 2018 related to the GBO Program are comprised of the following:
Three months ended October 31, | Nine months ended October 31, | ||||||
2018 | 2018 | ||||||
(in thousands) | |||||||
Severance costs | $ | 8,741 | $ | 17,615 | |||
Professional services | 4,383 | 13,852 | |||||
Total | $ | 13,124 | $ | 31,467 | |||
During the three months ended October 31, 2018, the Company recorded restructuring costs related to the GBO Program of $2.5 million in the Americas, $10.1 million in Europe and $0.5 million in Asia-Pacific. During the nine months ended October 31, 2018, the Company recorded restructuring costs of $9.8 million in the Americas, $21.0 million in Europe and $0.7 million in Asia-Pacific. The accrued restructuring charges are included in “accrued expenses and other liabilities” in the Consolidated Balance Sheet.
Restructuring activity during the nine months ended October 31, 2018 related to the GBO Program is as follows:
Nine months ended October 31, 2018 | ||||||||||||
Severance | Professional Services | Total | ||||||||||
(in thousands) | ||||||||||||
Fiscal 2019 restructuring expenses | $ | 17,615 | $ | 13,852 | $ | 31,467 | ||||||
Cash payments | (6,036 | ) | (4,046 | ) | (10,082 | ) | ||||||
Foreign currency translation | (605 | ) | (112 | ) | (717 | ) | ||||||
Balance at October 31, 2018 | $ | 10,974 | $ | 9,694 | $ | 20,668 | ||||||
NOTE 6 — GAIN ON DISPOSAL OF SUBSIDIARY
During the second quarter of fiscal 2019, the Company executed an agreement to sell certain of its operations in Ireland for a total sales price of approximately $15.3 million, subject to final working capital adjustments. The Company recorded a gain on sale of $6.7 million during the nine months ended October 31, 2018, which includes the reclassification of $5.1 million from accumulated other comprehensive income for cumulative translation adjustments associated with the Company’s investment in this foreign entity. The operating results of this entity were insignificant relative to the Company's consolidated financial results for all periods presented.
15
NOTE 7 — DEBT
The carrying value of the Company's outstanding debt consists of the following (in thousands):
As of: | October 31, 2018 | January 31, 2018 | |||||
Senior Notes, interest at 3.70% payable semi-annually, due February 15, 2022 | $ | 500,000 | $ | 500,000 | |||
Senior Notes, interest at 4.95% payable semi-annually, due February 15, 2027 | 500,000 | 500,000 | |||||
Less—unamortized debt discount and debt issuance costs | (7,544 | ) | (8,678 | ) | |||
Senior Notes, net | 992,456 | 991,322 | |||||
Term Loans, interest rate of 3.74% and 3.07% at October 31, 2018 and January 31, 2018, respectively | 300,000 | 500,000 | |||||
Other committed and uncommitted revolving credit facilities, average interest rate of 6.97% and 6.07% at October 31, 2018 and January 31, 2018, respectively | 102,526 | 119,826 | |||||
Other long-term debt | 16,907 | 26,761 | |||||
1,411,889 | 1,637,909 | ||||||
Less—current maturities (included as “revolving credit loans and current maturities of long-term debt, net”) | (110,330 | ) | (132,661 | ) | |||
Total long-term debt | $ | 1,301,559 | $ | 1,505,248 | |||
Senior Notes
In January 2017, the Company issued $500.0 million aggregate principal amount of 3.70% Senior Notes due 2022 (the "3.70% Senior Notes") and $500.0 million aggregate principal amount of 4.95% Senior Notes due 2027 (the "4.95% Senior Notes") (collectively the "2017 Senior Notes"). The net proceeds from the issuance of the 2017 Senior Notes were used to fund a portion of the purchase price of the acquisition of TS. The Company pays interest on the 2017 Senior Notes semi-annually in arrears on February 15 and August 15 of each year. The interest rate payable on the 2017 Senior Notes will be subject to adjustment from time to time if the credit rating assigned to such series of notes changes. At no point will the interest rate be reduced below the interest rate payable on the notes on the date of the initial issuance or increase more than 2.00% above the interest rate payable on the notes of the series on the date of their initial issuance. The 2017 Senior Notes are senior unsecured obligations of the Company and will rank equally with all other unsecured and unsubordinated indebtedness from time to time outstanding.
The Company, at its option, may redeem the 3.70% Senior Notes at any time prior to January 15, 2022 and the 4.95% Senior Notes at any time prior to November 15, 2026, in each case in whole or in part, at a redemption price equal to the greater of (i) 100% of the principal amount of the 2017 Senior Notes to be redeemed or (ii) the sum of the present values of the remaining scheduled payments of principal and interest on the 2017 Senior Notes to be redeemed, discounted to the date of redemption on a semi-annual basis at a rate equal to the sum of the applicable Treasury Rate plus 30 basis points for the 3.70% Senior Notes and 40 basis points for the 4.95% Senior Notes, plus the accrued and unpaid interest on the principal amount being redeemed up to the date of redemption. The Company may also redeem the 2017 Senior Notes, at any time in whole or from time to time in part, on or after January 15, 2022 for the 3.70% Senior Notes and November 15, 2026 for the 4.95% Senior Notes, in each case, at a redemption price equal to 100% of the principal amount of the 2017 Senior Notes to be redeemed.
Other Credit Facilities
The Company has a $1.25 billion revolving credit facility with a syndicate of banks (the “Credit Agreement”), which among other things, provides for (i) a maturity date of November 2, 2021 and (ii) an interest rate on borrowings, facility fees and letter of credit fees based on the Company’s non-credit enhanced senior unsecured debt rating as determined by Standard & Poor’s Rating Service and Moody’s Investor Service. The Company pays interest on advances under the Credit Agreement at LIBOR (or similar interbank offered rates depending on currency draw) plus a predetermined margin that is based on the Company’s debt rating. There were no amounts outstanding under the Credit Agreement at October 31, 2018 and January 31, 2018.
The Company entered into a term loan credit agreement on November 2, 2016 with a syndicate of banks (the "Term Loan Credit Agreement") which provides for the borrowing of (i) a tranche of senior unsecured term loans in an original aggregate principal amount of $250 million and maturing three years after the funding date and (ii) a tranche of senior unsecured term loans in an original aggregate principal amount of $750 million and maturing five years after the funding date. The Company pays interest on advances under the Term Loan Credit Agreement at a variable rate based on LIBOR (or similar interbank offered rates depending on currency draw) plus a predetermined margin that is based on the Company's debt rating. In connection with the acquisition of TS on February 27, 2017, the Company borrowed $1.0 billion under its Term Loan Credit Agreement in order to fund a portion of the cash consideration paid to Avnet. The borrowings were comprised of a $250.0 million tranche of three-year senior unsecured term loans (the “2020 Term Loans”) and a $750.0 million tranche of five-year senior unsecured term loans (the “2022 Term Loans”). The 2020 Term Loans were repaid in full during fiscal 2018.
16
The outstanding principal amount of the 2022 Term Loans is payable in equal quarterly installments of (i) for the first three years after the funding date, 5.0% per annum of the initial principal amount and (ii) for the fourth and fifth years after the funding date, 10.0% per annum of the initial principal amount, with the remaining balance payable on February 27, 2022. The Company may repay the 2022 Term Loans, at any time in whole or in part, without penalty or premium prior to the maturity date. Quarterly installment payments due under the 2022 Term Loans are reduced by the amount of any prepayments made by the Company. During the nine months ended October 31, 2018, the Company made principal prepayments of $200 million on the 2022 Term Loans. At October 31, 2018, there was $300 million outstanding on the 2022 Term Loans, at an interest rate of 3.74%.
The Company also has an agreement with a syndicate of banks (the “Receivables Securitization Program”) that allows the Company to transfer an undivided interest in a designated pool of U.S. accounts receivable, on an ongoing basis, to provide collateral for borrowings up to a maximum of $750.0 million. Under this program, the Company transfers certain U.S. trade receivables into a wholly-owned bankruptcy remote special purpose entity. Such receivables, which are recorded in the Consolidated Balance Sheet, totaled approximately $1.7 billion and $1.5 billion, respectively, at October 31, 2018 and January 31, 2018. As collections reduce accounts receivable balances included in the collateral pool, the Company may transfer interests in new receivables to bring the amount available to be borrowed up to the maximum. Interest is to be paid on advances under the Receivables Securitization Program at the applicable commercial paper or LIBOR rate plus an agreed-upon margin. There were no amounts outstanding under the Receivables Securitization Program at October 31, 2018 and January 31, 2018.
In addition to the facilities described above, the Company has various other committed and uncommitted lines of credit and overdraft facilities totaling approximately $432.9 million at October 31, 2018 to support its operations. Most of these facilities are provided on an unsecured, short-term basis and are reviewed periodically for renewal. There was $102.5 million outstanding on these facilities at October 31, 2018, at a weighted average interest rate of 6.97%, and there was $119.8 million outstanding at January 31, 2018, at a weighted average interest rate of 6.07%.
At October 31, 2018, the Company had also issued standby letters of credit of $11.5 million. These letters of credit typically act as a guarantee of payment to certain third parties in accordance with specified terms and conditions. The issuance of these letters of credit reduces the Company's borrowing availability under certain of the above-mentioned credit facilities.
Certain of the Company’s credit facilities contain limitations on the amounts of annual dividends and repurchases of common stock and require compliance with other obligations, warranties and covenants. The financial ratio covenants under these credit facilities include a maximum total leverage ratio and a minimum interest coverage ratio. At October 31, 2018, the Company was in compliance with all such financial covenants.
17
NOTE 8 — INCOME TAXES
U.S. Tax Reform
On December 22, 2017, the U.S. federal government enacted the U.S. Tax Cuts and Jobs Act (“U.S. Tax Reform”) which significantly revised U.S. corporate income tax law by, among other things, reducing the U.S. federal corporate income tax rate from 35% to 21% and implementing a modified territorial tax system that includes a one-time transition tax on deemed repatriated earnings of foreign subsidiaries. Due to the complexities involved in accounting for U.S. Tax Reform, the SEC issued Staff Accounting Bulletin (“SAB”) 118 which requires that the Company include in its financial statements the reasonable estimate of the impact of U.S. Tax Reform on earnings to the extent such reasonable estimate has been determined. SAB 118 allows the Company to report provisional amounts within a measurement period up to one year due to the complexities inherent in adopting the changes. In the fourth quarter of fiscal 2018, the Company recorded income tax expense of $95.4 million, which represented the Company’s reasonable estimate of the impact of the enactment of U.S. Tax Reform. The amounts recorded include income tax expense of $101.1 million for the one-time transition tax and a net income tax benefit of $5.7 million related to the remeasurement of net deferred tax liabilities as a result of the change in the U.S. federal corporate income tax rate.
During the three and nine months ended October 31, 2018, the Company decreased its provisional estimate of the one-time transition tax by $24.0 million upon further analysis of earnings and profits of the Company's foreign subsidiaries and utilization of foreign tax credits. The Company considers both the recognition of the transition tax and the remeasurement of deferred taxes incomplete. The final impact from the enactment of U.S. Tax Reform may differ from the reasonable estimate of $71.4 million due to substantiation of foreign-based earnings and profits and foreign tax credits and the utilization of those foreign tax credits. Additionally, new guidance from regulators, interpretation of the law, and refinement of the Company’s estimates from ongoing analysis of data and tax positions may further change the provisional amounts recorded. Any further changes in the provisional amount recorded will be reflected in income tax expense in the period they are identified. Additionally, U.S. Tax Reform subjects a U.S. shareholder to tax on Global Intangible Low-Taxed Income (“GILTI”) earned by certain foreign subsidiaries. The Company can make an accounting policy election to either treat taxes due on the GILTI as a current period expense, or factor such amounts into its measurement of deferred taxes. Given the complexity of the GILTI provisions, the Company is still evaluating these matters and has not yet determined its accounting policy. However, the Company has included tax expense related to GILTI for current year operations in the estimated annual effective tax rate and has not provided for GILTI on deferred items.
Tax Indemnifications
In connection with the acquisition of TS, pursuant to the interest purchase agreement, the Company and Avnet agreed to indemnify each other in relation to certain tax matters. As a result, the Company has recorded certain indemnification assets and liabilities for expected amounts to be received from and paid to Avnet. During the three and nine months ended October 31, 2018, due to the resolution of a pre-acquisition tax matter in a jurisdiction in which the Company operates, the Company recorded a benefit in income tax expense of $5.5 million and $6.1 million, respectively. As a result, the Company recorded expenses to recognize the corresponding indemnification liability of $5.5 million and $6.1 million during the three and nine months ended October 31, 2018, respectively, which is included in “selling, general and administrative expenses” in the Consolidated Statement of Income. The net impact of these items had no impact on the Company’s net income.
Effective Tax Rate
The Company's effective tax rate was 2.0% and 32.1% for the three months ended October 31, 2018 and 2017, respectively, and 7.0% and 33.8% for the nine months ended October 31, 2018 and 2017, respectively. On an absolute dollar basis, the provision for income taxes decreased to $2.3 million for the third quarter of fiscal 2019 compared to $17.6 million for the third quarter of fiscal 2018 and decreased to $16.8 million for the nine months ended October 31, 2018 compared to $59.0 million for the nine months ended October 31, 2017. The decrease in the effective tax rate and the provision for income taxes for the three and nine months ended October 31, 2018, as compared to the prior year, is primarily due to the decrease in the provisional estimate of the one-time transition tax related to U.S. Tax Reform, the impact of the resolution of a pre-acquisition tax matter related to TS, the decrease in the U.S. federal income tax rate partially offset by GILTI provisions due to U.S. Tax Reform and the relative mix of earnings and losses within the taxing jurisdictions in which the Company operates. The decrease in both the effective tax rate and the provision for income taxes for the nine months ended October 31, 2018, is also impacted by income tax benefits recorded in relation to the settlement agreement reached with Avnet of $13.0 million (see Note 4 – Acquisitions for further discussion).
18
NOTE 9 — STOCK-BASED COMPENSATION
For the nine months ended October 31, 2018 and 2017, the Company recorded $23.7 million and $21.2 million, respectively, of stock-based compensation expense.
The 2018 Equity Incentive Plan was approved by the Company’s shareholders in June 2018 and includes 2.0 million shares available for grant. The Company is authorized to award officers, employees, and non-employee members of the Board of Directors restricted stock, options to purchase common stock, stock appreciation rights and performance awards that are dependent upon achievement of specified performance goals. Equity-based compensation awards have a maximum term of 10 years, unless a shorter period is specified by the Compensation Committee of the Board of Directors ("Compensation Committee") or is required under local law. Awards under the plan are priced as determined by the Compensation Committee and are required to be priced at, or above, the fair market value of the Company’s common stock on the date of grant. Awards generally vest between one and three years from the date of grant. The Company’s policy is to utilize shares of its treasury stock, to the extent available, to satisfy its obligation to issue shares upon the exercise of awards.
Restricted stock units
A summary of the Company’s restricted stock activity for the nine months ended October 31, 2018 is as follows:
Shares | ||
Nonvested at January 31, 2018 | 700,532 | |
Granted | 278,530 | |
Vested | (262,485 | ) |
Canceled | (52,828 | ) |
Nonvested at October 31, 2018 | 663,749 | |
Performance based restricted stock units
The Company's performance based restricted stock unit awards are subject to vesting conditions, including meeting specified cumulative performance objectives over a period of three years. Each performance based award recipient could vest in 0% to 150% of the target shares granted, contingent on the achievement of the Company's financial performance metrics. A summary of the Company’s performance based restricted stock activity, assuming maximum achievement, for the nine months ended October 31, 2018 is as follows:
Shares | ||
Nonvested at January 31, 2018 | 170,685 | |
Granted | 153,719 | |
Canceled | (27,258 | ) |
Nonvested at October 31, 2018 | 297,146 | |
NOTE 10 — SHAREHOLDERS' EQUITY
On October 2, 2018, the Company's Board of Directors authorized a share repurchase program for up to $200.0 million of the Company's common stock. In conjunction with the Company’s share repurchase program, a 10b5-1 plan was executed that instructs the broker selected by the Company to repurchase shares on behalf of the Company. The amount of common stock repurchased in accordance with the 10b5-1 plan on any given trading day is determined by a formula in the plan, which is based on the market price of the Company’s common stock. Shares repurchased by the Company are held in treasury for general corporate purposes, including issuances under equity incentive and benefit plans. The reissuance of shares from treasury stock is based on the weighted average purchase price of the shares.
The Company’s common share issuance activity for the nine months ended October 31, 2018 is summarized as follows:
Shares | Weighted-average price per share | |||||
Treasury stock balance at January 31, 2018 | 21,083,972 | $ | 44.59 | |||
Shares of treasury stock repurchased | 621,440 | 70.48 | ||||
Shares of treasury stock reissued for equity incentive plans | (198,021 | ) | ||||
Treasury stock balance at October 31, 2018 | 21,507,391 | $ | 45.34 | |||
19
NOTE 11 — FAIR VALUE MEASUREMENTS
The Company’s assets and liabilities carried or disclosed at fair value are classified in one of the following three categories: Level 1 – quoted market prices in active markets for identical assets and liabilities; Level 2 – inputs other than quoted market prices included in Level 1 above that are observable for the asset or liability, either directly or indirectly; and Level 3 – unobservable inputs for the asset or liability. The classification of an asset or liability within the fair value hierarchy is based on the lowest level of any input that is significant to the fair value measurement.
The following table summarizes the valuation of the Company's assets and liabilities that are measured at fair value on a recurring basis:
October 31, 2018 | January 31, 2018 | ||||||||||||||
Fair value measurement category | Fair value measurement category | ||||||||||||||
Level 1 | Level 2 | Level 3 | Level 1 | Level 2 | Level 3 | ||||||||||
(in thousands) | |||||||||||||||
ASSETS | |||||||||||||||
Foreign currency forward contracts | $ | 6,859 | $ | 5,025 | |||||||||||
LIABILITIES | |||||||||||||||
Foreign currency forward contracts | $ | 12,853 | $ | 11,675 | |||||||||||
The Company's foreign currency forward contracts are measured on a recurring basis based on foreign currency spot rates and forward rates quoted by banks or foreign currency dealers (Level 2 criteria) and are marked-to-market each period with gains and losses on these contracts recorded in the Consolidated Statement of Income on a basis consistent with the classification of the change in the fair value of the underlying transactions giving rise to these foreign currency exchange gains and losses in the period in which their value changes, with the offsetting amount for unsettled positions being included in either "prepaid expenses and other assets" or "accrued expenses and other liabilities" in the Consolidated Balance Sheet. See further discussion below in Note 12 – Derivative Instruments.
The Company utilizes life insurance policies to fund the Company’s nonqualified deferred compensation plan. The life insurance asset recorded by the Company is the amount that would be realized upon the assumed surrender of the policy. This amount is based on the underlying fair value of the invested assets contained within the life insurance policies. The gains and losses are recorded in the Company’s Consolidated Statement of Income within "other expense (income), net." The related deferred compensation liability is also marked-to-market each period based upon the returns of the various investments selected by the plan participants and the gains and losses are recorded in the Company’s Consolidated Statement of Income within "selling, general and administrative expenses." The net realizable value of the Company's life insurance investments and related deferred compensation liability was $42.4 million and $42.4 million, respectively, at October 31, 2018 and $44.8 million and $44.7 million, respectively, at January 31, 2018.
The carrying value of the 2017 Senior Notes discussed in Note 7 – Debt represents cost less unamortized debt discount and debt issuance costs. The estimated fair value of the 2017 Senior Notes is based upon quoted market information (Level 1). The estimated fair value of the 2017 Senior Notes was $976 million and $1.02 billion, respectively, at October 31, 2018 and January 31, 2018. The carrying amounts of accounts receivable, accounts payable and accrued expenses approximate fair value because of the short maturity of these items. The carrying amounts of debt outstanding pursuant to revolving credit facilities and under the Term Loan Credit Agreement approximate fair value as the majority of these instruments have variable interest rates which approximate current market rates (Level 2 criteria).
NOTE 12 — DERIVATIVE INSTRUMENTS
In the ordinary course of business, the Company is exposed to movements in foreign currency exchange rates. The Company’s foreign currency risk management objective is to protect earnings and cash flows from the impact of exchange rate changes primarily through the use of foreign currency forward contracts to hedge both intercompany and third party loans, accounts receivable and accounts payable. These derivatives are not designated as hedging instruments.
The Company’s foreign currency exposure relates primarily to international transactions where the currency collected from customers can be different from the currency used to purchase the product. The Company’s transactions in its foreign operations are denominated primarily in the following currencies: Australian dollar, British pound, Canadian dollar, Czech koruna, Danish krone, euro, Indian rupee, Indonesian rupiah, Mexican peso, Norwegian krone, Polish zloty, Singapore dollar, Swedish krona, Swiss franc and U.S. dollar.
The Company considers inventory as an economic hedge against foreign currency exposure in accounts payable in certain circumstances. This practice offsets such inventory against corresponding accounts payable denominated in currencies other than the functional currency of the subsidiary buying the inventory when determining the net exposure to be hedged using traditional forward contracts. Under this strategy, the Company would expect to increase or decrease selling prices for products purchased in foreign currencies based on fluctuations in foreign currency exchange rates affecting the underlying accounts payable. To the extent the Company incurs a foreign currency exchange loss (gain) on the underlying accounts payable denominated in the foreign currency, a
20
corresponding increase (decrease) in gross profit would be expected as the related inventory is sold. This strategy can result in a certain degree of quarterly earnings volatility as the underlying accounts payable is remeasured using the foreign currency exchange rate prevailing at the end of each period, or settlement date if earlier, whereas the corresponding increase (decrease) in gross profit is not realized until the related inventory is sold.
The Company recognizes foreign currency exchange gains and losses on its derivative instruments used to manage its exposures to foreign currency denominated accounts receivable and accounts payable as a component of “cost of products sold” which is consistent with the classification of the change in fair value upon remeasurement of the underlying hedged accounts receivable or accounts payable. The Company recognizes foreign currency exchange gains and losses on its derivative instruments used to manage its exposures to foreign currency denominated financing transactions as a component of “other expense (income), net,” which is consistent with the classification of the change in fair value upon remeasurement of the underlying hedged loans. The total amount recognized in earnings on the Company's foreign currency forward contracts, which depending upon the nature of the underlying hedged asset or liability is included as a component of either “cost of products sold” or “other expense (income), net,” was a net foreign currency exchange loss of $21.5 million and gain of $0.3 million, respectively, for the three months ended October 31, 2018 and 2017 and a foreign currency exchange loss of $20.9 million and $22.4 million, respectively, for the nine months ended October 31, 2018 and 2017. The gains and losses on the Company’s foreign currency forward contracts are largely offset by the change in the fair value of the underlying hedged assets or liabilities.
The notional amount of forward exchange contracts is the amount of foreign currency to be bought or sold at maturity. Notional amounts are indicative of the extent of the Company’s involvement in the various types and uses of derivative financial instruments and are not a measure of the Company’s exposure to credit or market risks through its use of derivatives. The estimated fair value of derivative financial instruments represents the amount required to enter into similar offsetting contracts with similar remaining maturities based on quoted market prices.
The Company's average notional amounts of derivative financial instruments outstanding during the three months ended October 31, 2018 and 2017 were approximately $1.5 billion and $0.9 billion, respectively, with average maturities of 24 days and 28 days, respectively. The Company's average notional amounts of derivative financial instruments outstanding during the nine months ended October 31, 2018 and 2017 were approximately $1.4 billion and $1.0 billion, respectively, with average maturities of 27 days and 33 days, respectively. As discussed above, under the Company's hedging policies, gains and losses on the derivative financial instruments are largely offset by the gains and losses on the underlying assets or liabilities being hedged.
The Company’s foreign currency forward contracts are also discussed in Note 11 – Fair Value Measurements.
NOTE 13 — COMMITMENTS & CONTINGENCIES
Guarantees
The Company has arrangements with certain finance companies that provide inventory financing facilities to the Company’s customers. In conjunction with certain of these arrangements, the Company would be required to purchase certain inventory in the event the inventory is repossessed from the customers by the finance companies. As the Company does not have access to information regarding the amount of inventory purchased from the Company still on hand with the customer at any point in time, the Company’s repurchase obligations relating to inventory cannot be reasonably estimated. Repurchases of inventory by the Company under these arrangements have been insignificant to date. The Company believes that, based on historical experience, the likelihood of a material loss pursuant to these inventory repurchase obligations is remote.
The Company provides additional financial guarantees to finance companies on behalf of certain customers. The majority of these guarantees are for an indefinite period of time, where the Company would be required to perform if the customer is in default with the finance company related to purchases made from the Company. The Company reviews the underlying credit for these guarantees on at least an annual basis. As of October 31, 2018 and January 31, 2018, the outstanding amount of guarantees under these arrangements totaled $1.3 million and $3.3 million, respectively. The Company believes that, based on historical experience, the likelihood of a material loss pursuant to the above guarantees is remote.
Contingencies
Prior to fiscal 2004, one of the Company’s subsidiaries, located in Spain, was audited in relation to various value added tax (“VAT”) matters and received notices of assessment for several fiscal years that alleged the subsidiary did not properly collect and remit VAT. The Spanish subsidiary appealed these assessments beginning in March 2010. As of January 31, 2018, the Company had recorded a liability for the entire amount of the remaining assessments, which related to fiscal years 1994 and 1995, of approximately $10.7 million, including estimates of various penalties and interest. During the nine months ended October 31, 2018, the Company paid the assessed amounts and recorded a benefit in interest expense of $0.9 million to adjust its accrual for estimated interest costs to the final assessed amount.
In December 2010, in a non-unanimous decision, a Brazilian appellate court overturned a 2003 trial court which had previously ruled in favor of the Company’s Brazilian subsidiary related to the imposition of certain taxes on payments abroad related to the licensing of commercial software products, commonly referred to as “CIDE tax.” The Company estimates the total exposure related to the CIDE tax,
21
including interest, was approximately $20.3 million at October 31, 2018. The Brazilian subsidiary has appealed the unfavorable ruling to the Supreme Court and Superior Court, Brazil's two highest appellate courts. Based on the legal opinion of outside counsel, the Company believes that the chances of success on appeal of this matter are favorable and the Brazilian subsidiary intends to vigorously defend its position that the CIDE tax is not due. However, due to the lack of predictability of the Brazilian court system, the Company has concluded that it is reasonably possible that the Brazilian subsidiary may incur a loss up to the total exposure described above. The Company believes the resolution of this litigation will not be material to the Company’s consolidated net assets or liquidity.
In June 2013, the Company was the subject of a document seizure by the French Autorité de la Concurrence (Competition Authority), following allegations of anticompetitive distribution practices in the French market for the products of one of the Company's suppliers. In October 2018, the Competition Authority delivered a notification des griefs (statement of objections) to the Company, stating that the Competition Authority is pursuing charges against the Company in this matter. The Competition Authority has taken similar action against the Company's supplier and another of its distributors. At this time, the Company cannot determine the likelihood of loss or reasonably estimate the range of any loss arising from this proceeding.
The Company is subject to various other legal proceedings and claims arising in the ordinary course of business. The Company’s management does not expect that the outcome in any of these other legal proceedings, individually or collectively, will have a material adverse effect on the Company’s financial condition, results of operations or cash flows.
NOTE 14 — SEGMENT INFORMATION
The Company operates predominantly in a single industry segment as a distributor of technology products, logistics management, and other value-added services. While the Company operates primarily in one industry, it is managed based on three geographic segments. The Company does not consider stock-based compensation expense in assessing the performance of its operating segments, and therefore the Company excludes stock-based compensation expense from segment information. The accounting policies of the segments are the same as those described in Note 1 – Business and Summary of Significant Accounting Policies.
Financial information by geographic segment is as follows (in thousands):
Three months ended October 31, | Nine months ended October 31, | ||||||||||||||
2018 | 2017 | 2018 | 2017 | ||||||||||||
Net sales: | (As Adjusted) | (As Adjusted) | |||||||||||||
Americas (1) | $ | 4,137,852 | $ | 3,663,498 | $ | 11,799,389 | $ | 10,568,516 | |||||||
Europe | 4,920,156 | 4,518,669 | 14,130,985 | 12,269,044 | |||||||||||
Asia-Pacific | 282,021 | 266,304 | 844,075 | 726,884 | |||||||||||
Total | $ | 9,340,029 | $ | 8,448,471 | $ | 26,774,449 | $ | 23,564,444 | |||||||
Operating income: | |||||||||||||||
Americas (2), (3) | $ | 112,399 | $ | 55,551 | $ | 261,671 | $ | 194,426 | |||||||
Europe (4), (5), (6) | 39,889 | 29,909 | 86,292 | 73,172 | |||||||||||
Asia-Pacific | 2,739 | 2,432 | 3,480 | 11,795 | |||||||||||
Stock-based compensation expense | (8,139 | ) | (8,325 | ) | (23,694 | ) | (21,217 | ) | |||||||
Total | $ | 146,888 | $ | 79,567 | $ | 327,749 | $ | 258,176 | |||||||
Depreciation and amortization: | |||||||||||||||
Americas | $ | 23,394 | $ | 24,645 | $ | 70,244 | $ | 62,308 | |||||||
Europe | 13,679 | 15,734 | 42,686 | 44,957 | |||||||||||
Asia-Pacific | 2,169 | 1,955 | 6,711 | 5,642 | |||||||||||
Total | $ | 39,242 | $ | 42,334 | $ | 119,641 | $ | 112,907 | |||||||
Capital expenditures: | |||||||||||||||
Americas | $ | 11,493 | $ | 167,210 | $ | 24,105 | $ | 195,169 | |||||||
Europe | 4,742 | 4,450 | 13,821 | 16,764 | |||||||||||
Asia-Pacific | 1,195 | 506 | 2,227 | 2,046 | |||||||||||
Total | $ | 17,430 | $ | 172,166 | $ | 40,153 | $ | 213,979 | |||||||
22
As of: | October 31, 2018 | January 31, 2018 | |||||
Identifiable assets: | (As Adjusted) | ||||||
Americas | $ | 5,539,656 | $ | 5,014,409 | |||
Europe | 6,435,338 | 7,336,974 | |||||
Asia-Pacific | 584,609 | 568,976 | |||||
Total | $ | 12,559,603 | $ | 12,920,359 | |||
Long-lived assets: | |||||||
Americas (1) | $ | 212,124 | $ | 214,922 | |||
Europe | 50,968 | 57,781 | |||||
Asia-Pacific | 5,212 | 6,388 | |||||
Total | $ | 268,304 | $ | 279,091 | |||
Goodwill & acquisition-related intangible assets, net: | |||||||
Americas | $ | 1,097,610 | $ | 1,139,273 | |||
Europe | 576,465 | 645,134 | |||||
Asia-Pacific | 104,315 | 130,093 | |||||
Total | $ | 1,778,390 | $ | 1,914,500 | |||
(1) | Net sales in the United States represented 91% and 89%, respectively, of the total Americas' net sales for the three months ended October 31, 2018 and 2017, and 90% and 89% of the total Americas' net sales for the nine months ended October 31, 2018 and 2017. Total long-lived assets in the United States represented 97% of the Americas' total long-lived assets at both October 31, 2018 and January 31, 2018. |
(2) | Operating income in the Americas for the three months ended October 31, 2018 and 2017 includes acquisition, integration and restructuring expenses of $6.0 million and $14.1 million, respectively (see further discussion in Note 5 – Acquisition, Integration and Restructuring Expenses). Operating income in the Americas includes a gain related to legal settlements and other, net, of $7.2 million for the three months ended October 31, 2018 (see further discussion in Note 1 - Business and Summary of Significant Accounting Policies). Operating income in the Americas for the three months ended October 31, 2018 includes a benefit of approximately $25 million related to the collection of an accounts receivable balance previously considered uncollectible. |
(3) | Operating income in the Americas for the nine months ended October 31, 2018 and 2017 includes acquisition, integration and restructuring expenses of $19.0 million and $58.6 million, respectively, and a gain related to legal settlements and other, net, of $15.4 million and $42.6 million, respectively. Operating income in the Americas for the nine months ended October 31, 2018 includes a benefit of approximately $25 million related to the collection of an accounts receivable balance previously considered uncollectible. |
(4) Operating income in Europe for the three months ended October 31, 2018 and 2017 includes acquisition, integration and restructuring expenses of $13.1 million and $14.1 million, respectively. Operating income in Europe for the nine months ended October 31, 2018 and 2017, includes acquisition, integration and restructuring expenses of $44.4 million and $40.4 million, respectively.
(5) | Operating income in Europe for the three and nine months ended October 31, 2018 includes expenses of $5.5 million and $6.5 million, respectively, related to the recognition of certain tax indemnification liabilities (see further discussion in Note 8 – Income Taxes). |
(6) | Operating income in Europe for the nine months ended October 31, 2018 includes a gain on disposal of a subsidiary of $6.7 million (see further discussion in Note 6 – Gain on Disposal of Subsidiary). |
23
ITEM 2. Management’s Discussion and Analysis of Financial Condition and Results of Operations.
FORWARD-LOOKING STATEMENTS
This Quarterly Report on Form 10-Q, including this Management's Discussion and Analysis of Financial Condition and Results of Operations (“MD&A”), contains forward-looking statements, as described in the “safe harbor” provision of the Private Securities Litigation Reform Act of 1995. These statements involve a number of risks and uncertainties and actual results could differ materially from those projected. These forward-looking statements regarding future events and the future results of Tech Data Corporation (“Tech Data”, “we”, “our”, “us” or the “Company”) are based on current expectations, estimates, forecasts, and projections about the industries in which we operate and the beliefs and assumptions of our management. Words such as “expects,” “anticipates,” “targets,” “goals,” “projects,” “intends,” “plans,” “believes,” “seeks,” “estimates,” variations of such words, and similar expressions are intended to identify such forward-looking statements. In addition, any statements that refer to our future financial performance, our anticipated growth and trends in our businesses, and other characterizations of future events or circumstances, are forward-looking statements. Readers are cautioned that these forward-looking statements are only predictions and are subject to risks, uncertainties, and assumptions. Therefore, actual results may differ materially and adversely from those expressed in any forward-looking statements. Readers are referred to the cautionary statements and important factors discussed in Part I, Item 1A. Risk Factors in our Annual Report on Form 10-K for the year ended January 31, 2018 for further information with respect to important risks and other factors that could cause actual results to differ materially from those in the forward-looking statements. We undertake no obligation to revise or update publicly any forward-looking statements for any reason.
OVERVIEW
Tech Data is one of the world’s largest wholesale distributors of technology products. Tech Data serves as a vital link in the evolving technology ecosystem by bringing products from the world’s leading technology vendors to market, as well as helping our customers create solutions best suited to maximize business outcomes for their end-user customers.
On February 27, 2017, we acquired Avnet, Inc.'s (“Avnet”) Technology Solutions business ("TS"). TS delivers data center hardware and software solutions and services and we believe the TS acquisition strengthens our end-to-end solutions and deepens our value added capabilities in the data center and next-generation technologies. We acquired TS for an aggregate purchase price of approximately $2.8 billion, comprised of approximately $2.5 billion in cash and 2,785,402 shares of the Company's common stock. In August 2018, we entered into a settlement agreement with Avnet to finalize the TS purchase price (see Note 4 of Notes to Consolidated Financial Statements for further discussion), which resulted in the recognition of a gain of $9.6 million during the nine months ended October 31, 2018. Additionally, as part of the settlement agreement, we reached agreement with Avnet on the final geographic allocation of the purchase price for tax reporting purposes which resulted in the recognition of a deferred tax asset in the United States (“U.S.”) for future tax deductions related to the amortization of goodwill for tax purposes. The recognition of the deferred tax asset in the U.S. resulted in an income tax benefit of $13.0 million during the nine months ended October 31, 2018.
Due to the timing of the completion of the TS acquisition, the results of operations for the nine months ended October 31, 2018 include an additional month of TS operations, as compared to the nine months ended October 31, 2017, which impacts comparability between periods.
CRITICAL ACCOUNTING POLICIES | |
Effective February 1, 2018, we adopted the requirements of Accounting Standards Update 2014-09, “Revenue from Contracts with Customers”. See Note 2 of Notes to Consolidated Financial Statements for information regarding our revenue recognition critical accounting policy. There have been no other material changes to the critical accounting policies previously disclosed in our Annual Report on Form 10-K for the year ended January 31, 2018.
RECENT ACCOUNTING PRONOUNCEMENTS | |
See Note 1 of Notes to Consolidated Financial Statements for the discussion on recent accounting pronouncements, including the impacts of the adoption of the new revenue recognition accounting standard.
24
NON-GAAP FINANCIAL INFORMATION
In addition to disclosing financial results that are determined in accordance with generally accepted accounting principles in the U.S. (“GAAP”), the Company also discloses certain non-GAAP financial information. Certain of these measures are presented as adjusted for the impact of changes in foreign currencies (referred to as “impact of changes in foreign currencies”). Removing the impact of the changes in foreign currencies provides a framework for assessing our financial performance as compared to prior periods. The impact of changes in foreign currencies is calculated by using the exchange rates from the prior year comparable period applied to the results of operations for the current period. The non-GAAP financial measures presented in this document include:
• | Net sales, as adjusted, which is defined as net sales adjusted for the impact of changes in foreign currencies; |
• | Gross profit, as adjusted, which is defined as gross profit as adjusted for the impact of changes in foreign currencies; |
• | Selling, general and administrative expenses (“SG&A”), as adjusted, which is defined as SG&A as adjusted for the impact of changes in foreign currencies; |
• | Non-GAAP operating income, which is defined as operating income as adjusted to exclude acquisition, integration and restructuring expenses, legal settlements and other, net, acquisition-related intangible assets amortization expense, gain on disposal of subsidiary and tax indemnifications; |
• | Non-GAAP net income, which is defined as net income as adjusted to exclude acquisition, integration and restructuring expenses, legal settlements and other, net, acquisition-related intangible assets amortization expense, gain on disposal of subsidiary, tax indemnifications, value added tax assessments and related interest expense, acquisition-related financing expenses, the income tax effects of these adjustments, the reversal of deferred tax valuation allowances and the impact of the U.S. Tax Reform; |
• | Non-GAAP earnings per share-diluted, which is defined as earnings per share-diluted as adjusted to exclude the per share impact of acquisition, integration and restructuring expenses, legal settlements and other, net, acquisition-related intangible assets amortization expense, gain on disposal of subsidiary, tax indemnifications, value added tax assessments and related interest expense, acquisition-related financing expenses, the income tax effects of these adjustments, the reversal of deferred tax valuation allowances and the impact of the U.S. Tax Reform. |
Management believes that providing this additional information is useful to the reader to assess and understand our financial performance as compared with results from previous periods. Management also uses these non-GAAP measures to evaluate performance against certain operational goals and under certain of our performance-based compensation plans. However, analysis of results on a non-GAAP basis should be used as a complement to, and in conjunction with, data presented in accordance with GAAP. Additionally, because these non-GAAP measures are not calculated in accordance with GAAP, they may not necessarily be comparable to similarly titled measures reported by other companies.
25
RESULTS OF OPERATIONS
The following table sets forth our Consolidated Statement of Income as a percentage of net sales:
Three months ended October 31, | Nine months ended October 31, | ||||||||||||||
2018 | 2017 | 2018 | 2017 | ||||||||||||
Net sales | 100.00 | % | 100.00 | % | 100.00 | % | 100.00 | % | |||||||
Cost of products sold | 94.04 | 93.77 | 94.00 | 93.64 | |||||||||||
Gross profit | 5.96 | 6.23 | 6.00 | 6.36 | |||||||||||
Operating expenses: | |||||||||||||||
Selling, general and administrative expenses | 4.25 | 4.93 | 4.61 | 5.01 | |||||||||||
Acquisition, integration and restructuring expenses | 0.22 | 0.36 | 0.25 | 0.43 | |||||||||||
Legal settlements and other, net | (0.08 | ) | — | (0.06 | ) | (0.18 | ) | ||||||||
Gain on disposal of subsidiary | — | — | (0.02 | ) | — | ||||||||||
4.39 | 5.29 | 4.78 | 5.26 | ||||||||||||
Operating income | 1.57 | 0.94 | 1.22 | 1.10 | |||||||||||
Interest expense | 0.27 | 0.31 | 0.29 | 0.36 | |||||||||||
Other expense (income), net | 0.05 | (0.02 | ) | 0.03 | — | ||||||||||
Income before income taxes | 1.25 | 0.65 | 0.90 | 0.74 | |||||||||||
Provision for income taxes | 0.03 | 0.21 | 0.06 | 0.25 | |||||||||||
Net income | 1.22 | % | 0.44 | % | 0.84 | % | 0.49 | % | |||||||
26
NET SALES | |
QUARTERLY RESULTS
The following table summarizes our net sales and change in net sales by geographic region for the three months ended October 31, 2018 and 2017:
Three months ended October 31, | Change | |||||||||||||
2018 | 2017 | $ | % | |||||||||||
(in millions) | ||||||||||||||
Consolidated net sales, as reported | $ | 9,340 | $ | 8,448 | $ | 892 | 10.6 | % | ||||||
Impact of changes in foreign currencies | 157 | — | 157 | |||||||||||
Consolidated net sales, as adjusted | $ | 9,497 | $ | 8,448 | $ | 1,049 | 12.4 | % | ||||||
Americas net sales, as reported | $ | 4,138 | $ | 3,663 | $ | 475 | 13.0 | % | ||||||
Impact of changes in foreign currencies | 21 | — | 21 | |||||||||||
Americas net sales, as adjusted | $ | 4,159 | $ | 3,663 | $ | 496 | 13.5 | % | ||||||
Europe net sales, as reported | $ | 4,920 | $ | 4,519 | $ | 401 | 8.9 | % | ||||||
Impact of changes in foreign currencies | 121 | — | 121 | |||||||||||
Europe net sales, as adjusted | $ | 5,041 | $ | 4,519 | $ | 522 | 11.6 | % | ||||||
Asia-Pacific net sales, as reported | $ | 282 | $ | 266 | $ | 16 | 6.0 | % | ||||||
Impact of changes in foreign currencies | 15 | — | 15 | |||||||||||
Asia-Pacific net sales, as adjusted | $ | 297 | $ | 266 | $ | 31 | 11.7 | % | ||||||
QUARTERLY COMMENTARY
AMERICAS
• | The increase in Americas net sales, as adjusted, of $496 million is primarily due to growth in personal computer systems and data center products. |
EUROPE
• | The increase in Europe net sales, as adjusted, of $522 million is primarily due to growth in mobility and data center products, as well as personal computer systems. The impact of changes in foreign currencies is primarily due to the weakening of the euro against the U.S. dollar. |
ASIA-PACIFIC
• | The increase in Asia-Pacific net sales, as adjusted, of $31 million is primarily due to growth in data center products. |
27
YEAR TO DATE RESULTS
The following table summarizes our net sales and change in net sales by geographic region for the nine months ended October 31, 2018:
Nine months ended October 31, | Change | |||||||||||||
2018 | 2017 | $ | % | |||||||||||
(in millions) | ||||||||||||||
Consolidated net sales, as reported | $ | 26,774 | $ | 23,564 | $ | 3,210 | 13.6 | % | ||||||
Impact of changes in foreign currencies | (578 | ) | — | (578 | ) | |||||||||
Consolidated net sales, as adjusted | $ | 26,196 | $ | 23,564 | $ | 2,632 | 11.2 | % | ||||||
Americas net sales, as reported | $ | 11,799 | $ | 10,568 | $ | 1,231 | 11.6 | % | ||||||
Impact of changes in foreign currencies | 11 | — | 11 | |||||||||||
Americas net sales, as adjusted | $ | 11,810 | $ | 10,568 | $ | 1,242 | 11.8 | % | ||||||
Europe net sales, as reported | $ | 14,131 | $ | 12,269 | $ | 1,862 | 15.2 | % | ||||||
Impact of changes in foreign currencies | (604 | ) | — | (604 | ) | |||||||||
Europe net sales, as adjusted | $ | 13,527 | $ | 12,269 | $ | 1,258 | 10.3 | % | ||||||
Asia-Pacific net sales, as reported | $ | 844 | $ | 727 | $ | 117 | 16.1 | % | ||||||
Impact of changes in foreign currencies | 15 | — | 15 | |||||||||||
Asia-Pacific net sales, as adjusted | $ | 859 | $ | 727 | $ | 132 | 18.2 | % | ||||||
YEAR TO DATE COMMENTARY
AMERICAS
• | The increase in Americas net sales, as adjusted, of approximately $1.2 billion is primarily due to growth in data center and software products, including the impact of an additional month of TS operations due to the timing of the completion of the acquisition in the prior year, as well as growth in personal computer systems. |
EUROPE
• | The increase in Europe net sales, as adjusted, of approximately $1.3 billion is primarily due to growth in data center and software products, including the impact of an additional month of TS operations due to the timing of the completion of the acquisition in the prior year, as well as growth in mobility products and personal computer systems. The impact of changes in foreign currencies is primarily due to the strengthening of the euro against the U.S. dollar. |
ASIA-PACIFIC
• | The increase in Asia-Pacific net sales, as adjusted, of $132 million is primarily due to growth in data center products and the impact of an additional month of TS operations due to the timing of the completion of the acquisition in the prior year. |
28
MAJOR VENDORS
The following table provides a comparison of net sales generated from products purchased from vendors that exceeded 10% of our consolidated net sales for the three and nine months ended October 31, 2018 and 2017 (as a percent of consolidated net sales):
Three months ended October 31, | Nine months ended October 31, | ||||||
2018 | 2017 | 2018 | 2017 | ||||
Apple, Inc. | 17% | 18% | 15% | 16% | |||
HP Inc. | 11% | 11% | 11% | 11% | |||
Cisco Systems, Inc. | 10% | 11% | 11% | 11% | |||
There were no customers that exceeded 10% of our consolidated net sales for the three and nine months ended October 31, 2018 and 2017.
GROSS PROFIT | |
The following tables provide a comparison of our gross profit and gross profit as a percentage of net sales for the three and nine months ended October 31, 2018 and 2017:
QUARTERLY RESULTS | ||||
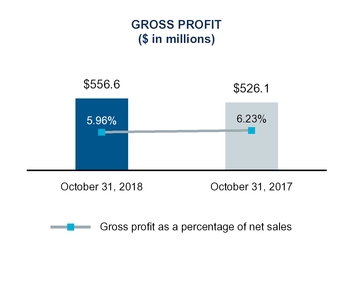
Three months ended October 31, | Change | |||||||||||||
2018 | 2017 | $ | % | |||||||||||
(in millions) | ||||||||||||||
Gross profit, as reported | $ | 556.6 | $ | 526.1 | $ | 30.5 | 5.8 | % | ||||||
Impact of changes in foreign currencies | 9.7 | — | 9.7 | |||||||||||
Gross profit, as adjusted | $ | 566.3 | $ | 526.1 | $ | 40.2 | 7.6 | % | ||||||
YEAR TO DATE RESULTS | ||||
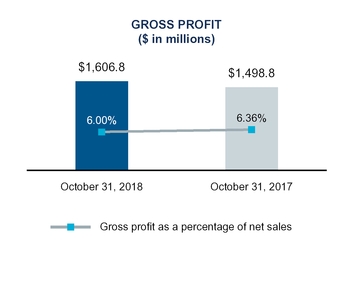
Nine months ended October 31, | Change | |||||||||||||
2018 | 2017 | $ | % | |||||||||||
(in millions) | ||||||||||||||
Gross profit, as reported | $ | 1,606.8 | $ | 1,498.8 | $ | 108.0 | 7.2 | % | ||||||
Impact of changes in foreign currencies | (31.1 | ) | — | (31.1 | ) | |||||||||
Gross profit, as adjusted | $ | 1,575.7 | $ | 1,498.8 | $ | 76.9 | 5.1 | % | ||||||
The quarter and year to date increase in gross profit, as adjusted, of $40.2 million and $76.9 million, respectively, is primarily due to an increase in net sales volume. The year to date increase also includes the impact of an additional month of TS operations due to the timing of the completion of the acquisition in the prior year. The quarter and year to date decrease in gross profit as a percentage of net sales, as reported, of 27 basis points and 36 basis points, respectively, is primarily due to the mix of products sold and the impact of a competitive environment.
29
OPERATING EXPENSES | |
SELLING, GENERAL AND ADMINISTRATIVE EXPENSES
The following tables provide a comparison of our selling, general and administrative expenses for the three and nine months ended October 31, 2018 and 2017:
Three months ended October 31, | Change | |||||||||||||
2018 | 2017 | $ | % | |||||||||||
(in millions) | ||||||||||||||
SG&A, as reported | $ | 396.7 | $ | 416.8 | $ | (20.1 | ) | (4.8 | )% | |||||
Impact of changes in foreign currencies | 7.6 | — | 7.6 | |||||||||||
SG&A, as adjusted | $ | 404.3 | $ | 416.8 | $ | (12.5 | ) | (3.0 | )% | |||||
SG&A as a percentage of net sales, as reported | 4.25 | % | 4.93 | % | (68) bps | |||||||||
Nine months ended October 31, | Change | |||||||||||||
2018 | 2017 | $ | % | |||||||||||
(in millions) | ||||||||||||||
SG&A, as reported | $ | 1,234.4 | $ | 1,180.0 | $ | 54.4 | 4.6 | % | ||||||
Impact of changes in foreign currencies | (26.4 | ) | — | (26.4 | ) | |||||||||
SG&A, as adjusted | $ | 1,208.0 | $ | 1,180.0 | $ | 28.0 | 2.4 | % | ||||||
SG&A as a percentage of net sales, as reported | 4.61 | % | 5.01 | % | (40) bps | |||||||||
The quarter to date decrease in SG&A, as adjusted, of $12.5 million, as compared to the same period in the prior fiscal year, is primarily due to a benefit of approximately $25 million related to the collection of an accounts receivable balance previously considered uncollectible, partially offset by an expense of $5.5 million to record an indemnification liability to Avnet due to the resolution of a pre-acquisition tax matter. The expense recorded in SG&A related to an indemnification liability is offset by a benefit of $5.5 million recorded in the provision for income taxes (see Note 8 of Notes to Consolidated Financial Statements for further discussion). The year to date increase in SG&A, as adjusted, of $28.0 million, as compared to the same period in the prior fiscal year, is primarily due to an additional month of TS operations due to the timing of the completion of the acquisition in the prior year, partially offset by a benefit of approximately $25 million related to the collection of an accounts receivable balance previously considered uncollectible. The quarter to date and year to date decrease in SG&A as a percentage of net sales, as reported, of 68 basis points and 40 basis points, respectively, is primarily due to greater operating leverage from our increased sales.
ACQUISITION, INTEGRATION AND RESTRUCTURING EXPENSES
Acquisition, integration and restructuring expenses are comprised of costs related to the fiscal 2018 acquisition of TS as well as restructuring costs related to the Global Business Optimization Program which was initiated in fiscal 2019.
Acquisition of TS
Acquisition, integration and restructuring expenses related to the acquisition of TS are primarily comprised of restructuring costs, Information Technology ("IT") related costs, professional services, transaction related costs and other costs. Restructuring costs are comprised of severance and facility exit costs. IT related costs consist primarily of data center and non-ERP application migration and integration costs, as well as, IT related professional services. Professional services are primarily comprised of integration related activities, including professional fees for project management, accounting, tax and other consulting services. Transaction related costs primarily consist of investment banking fees, legal expenses and due diligence costs incurred in connection with the completion of the transaction. Other costs includes payroll related costs including retention, stock compensation, relocation and travel expenses, incurred as part of the integration of TS. For the nine months ended October 31, 2018, other costs are partially offset by the gain recorded related to the settlement agreement with Avnet (see Note 4 of Notes to Consolidated Financial Statements for further discussion).
Acquisition, integration and restructuring expenses for the three and nine months ended October 31, 2018 and 2017 related to the acquisition of TS are comprised of the following:
Three months ended October 31, | Nine months ended October 31, | ||||||||||||||
2018 | 2017 | 2018 | 2017 | ||||||||||||
(in millions) | |||||||||||||||
Restructuring costs | $ | 1.6 | $ | 6.9 | $ | 16.3 | $ | 24.2 | |||||||
IT related costs | 2.1 | 5.7 | 10.6 | 12.0 | |||||||||||
Professional services | 0.8 | 9.6 | 5.2 | 30.7 | |||||||||||
Transaction related costs | 0.3 | 1.9 | 1.4 | 19.2 | |||||||||||
Other costs | 2.4 | 5.6 | 1.8 | 15.8 | |||||||||||
Total | $ | 7.2 | $ | 29.7 | $ | 35.3 | $ | 101.9 | |||||||
30
Global Business Optimization Program
On August 29, 2018, our Board of Directors approved the Global Business Optimization Program (the “GBO Program”) to increase investment in our strategic priorities and implement operational initiatives to drive productivity and enhance profitability. Under the GBO Program, we expect to incur cash charges of approximately $70 million to $80 million, primarily comprised of $40 million to $45 million of charges in Europe and $30 million to $35 million of charges in the Americas. The majority of these charges will be incurred prior to the end of fiscal 2020. The cash charges primarily consist of severance costs, and also include professional services and other costs. The GBO Program is expected to result in annual cost savings of $70 million to $80 million over the next two years, of which approximately half is expected to be reinvested to accelerate our strategic priorities.
Restructuring expenses for the three and nine months ended October 31, 2018 related to the GBO Program are comprised of the following:
Three months ended October 31, | Nine months ended October 31, | ||||||
2018 | 2018 | ||||||
(in thousands) | |||||||
Severance costs | $ | 8.7 | $ | 17.6 | |||
Professional services | 4.4 | 13.9 | |||||
Total | $ | 13.1 | $ | 31.5 | |||
During the three months ended October 31, 2018, we recorded restructuring costs related to the GBO Program of $2.5 million in the Americas, $10.1 million in Europe and $0.5 million in Asia-Pacific. During the nine months ended October 31, 2018, we recorded restructuring costs of $9.8 million in the Americas, $21.0 million in Europe and $0.7 million in Asia-Pacific.
LEGAL SETTLEMENTS AND OTHER, NET
We have been a claimant in proceedings seeking damages from certain manufacturers of LCD flat panel and cathode ray tube displays, as well as reimbursement from insurance providers of certain costs associated with the restatement of our consolidated financial statements and other financial information from fiscal 2009 to 2013. We reached settlement agreements during the periods presented and have recorded these amounts, net of attorney fees and expenses, in “legal settlements and other, net” in the Consolidated Statement of Income.
GAIN ON DISPOSAL OF SUBSIDIARY
During the second quarter of fiscal 2019, we executed an agreement to sell certain of our operations in Ireland for a total sales price of approximately $15.3 million, subject to final working capital adjustments. We recorded a gain on sale of $6.7 million during the nine months ended October 31, 2018, which includes the reclassification of $5.1 million from accumulated other comprehensive income for cumulative translation adjustments associated with our investment in this foreign entity. The operating results of this entity were insignificant relative to the consolidated financial results for all periods presented.
31
OPERATING INCOME | |
CONSOLIDATED RESULTS
The following tables provide an analysis of GAAP operating income and non-GAAP operating income on a consolidated and regional basis as well as a reconciliation of GAAP operating income to non-GAAP operating income on a consolidated and regional basis for the three and nine months ended October 31, 2018 and 2017:
QUARTERLY RESULTS
($ in millions)
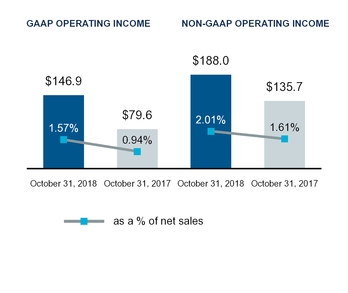
YEAR TO DATE RESULTS
($ in millions)
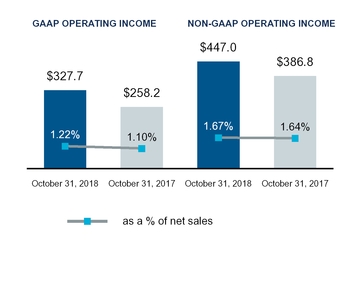
Three months ended October 31, | Nine months ended October 31, | ||||||||||||||
2018 | 2017 | 2018 | 2017 | ||||||||||||
(in millions) | |||||||||||||||
Operating income | $ | 146.9 | $ | 79.6 | $ | 327.7 | $ | 258.2 | |||||||
Acquisition, integration and restructuring expenses | 20.3 | 29.7 | 66.8 | 101.9 | |||||||||||
Legal settlements and other, net | (7.2 | ) | — | (15.4 | ) | (41.3 | ) | ||||||||
Acquisition-related intangible assets amortization expense | 22.5 | 26.4 | 68.5 | 68.0 | |||||||||||
Gain on disposal of subsidiary | — | — | (6.7 | ) | — | ||||||||||
Tax indemnifications | 5.5 | — | 6.1 | — | |||||||||||
Non-GAAP operating income | $ | 188.0 | $ | 135.7 | $ | 447.0 | $ | 386.8 | |||||||
CONSOLIDATED COMMENTARY
• | The quarter and year to date increases in GAAP operating income of $67.3 million and $69.5 million, respectively, are primarily due to an increase in net sales volume, a benefit of approximately $25 million related to the collection of an accounts receivable balance previously considered uncollectible and a decrease in acquisition, integration and restructuring expenses. The year to date increase in GAAP operating income is partially offset by lower gains on legal settlements. |
• | The quarter and year to date increases in non-GAAP operating income of $52.3 million and $60.2 million, respectively, are primarily due to an increase in net sales volume and a benefit of approximately $25 million related to the collection of an accounts receivable balance previously considered uncollectible. |
• | The year to date results are also impacted by an additional month of TS operations due to the timing of the completion of the acquisition in the prior year. |
32
AMERICAS | |
QUARTERLY RESULTS
($ in millions)
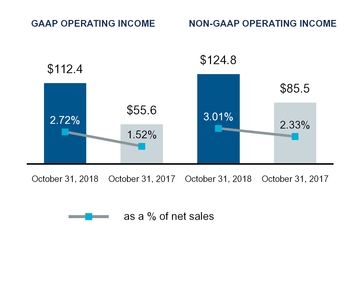
YEAR TO DATE RESULTS
($ in millions)
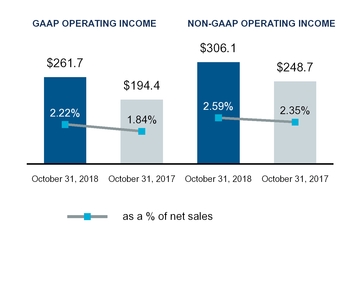
Three months ended October 31, | Nine months ended October 31, | ||||||||||||||
2018 | 2017 | 2018 | 2017 | ||||||||||||
(in millions) | |||||||||||||||
Operating income - Americas | $ | 112.4 | $ | 55.6 | $ | 261.7 | $ | 194.4 | |||||||
Acquisition, integration and restructuring expenses | 6.0 | 14.1 | 19.0 | 58.6 | |||||||||||
Legal settlements and other, net | (7.2 | ) | — | (15.4 | ) | (42.6 | ) | ||||||||
Acquisition-related intangible assets amortization expense | 13.6 | 15.8 | 40.8 | 38.3 | |||||||||||
Non-GAAP operating income - Americas | $ | 124.8 | $ | 85.5 | $ | 306.1 | $ | 248.7 | |||||||
AMERICAS COMMENTARY
• | The quarter to date increase in GAAP operating income of $56.8 million is primarily due to an increase in net sales volume, a benefit of approximately $25 million related to the collection of an accounts receivable balance previously considered uncollectible, a decrease in acquisition, integration and restructuring expense and gains from legal settlements. The year to date increase in GAAP operating income of $67.3 million is primarily due to an increase in net sales volume, a benefit of approximately $25 million related to the collection of an accounts receivable balance previously considered uncollectible and a decrease in acquisition, integration and restructuring expenses, partially offset by lower gains from legal settlements. |
• | The quarter and year to date increases in non-GAAP operating income of $39.3 million and $57.4 million, respectively, are primarily due to an increase in net sales volume and a benefit of approximately $25 million related to the collection of an accounts receivable balance previously considered uncollectible. |
• | The year to date results are also impacted by an additional month of TS operations due to the timing of the completion of the acquisition in the prior year. |
33
EUROPE | |
QUARTERLY RESULTS
($ in millions)
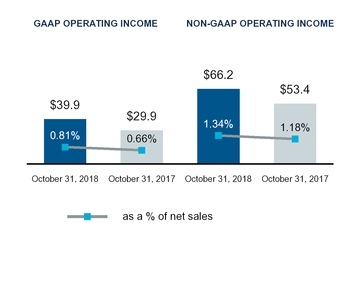
YEAR TO DATE RESULTS
($ in millions)
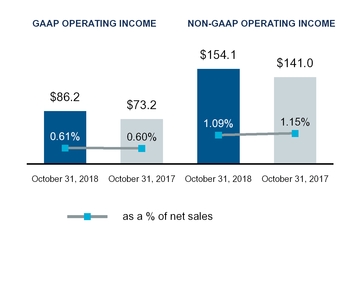
Three months ended October 31, | Nine months ended October 31, | ||||||||||||||
2018 | 2017 | 2018 | 2017 | ||||||||||||
(in millions) | |||||||||||||||
Operating income - Europe | $ | 39.9 | $ | 29.9 | $ | 86.2 | $ | 73.2 | |||||||
Acquisition, integration and restructuring expenses | 13.1 | 14.1 | 44.4 | 40.4 | |||||||||||
Legal settlements and other, net | — | — | — | 1.3 | |||||||||||
Acquisition-related intangible assets amortization expense | 7.7 | 9.4 | 23.7 | 26.1 | |||||||||||
Gain on disposal of subsidiary | — | — | (6.7 | ) | — | ||||||||||
Tax indemnification | 5.5 | — | 6.5 | — | |||||||||||
Non-GAAP operating income - Europe | $ | 66.2 | $ | 53.4 | $ | 154.1 | $ | 141.0 | |||||||
EUROPE COMMENTARY
• | The quarter to date increases in both GAAP and non-GAAP operating income are primarily due to an increase in net sales volume. The year to date increases in both GAAP and non-GAAP operating income are primarily due to an increase in net sales volume, partially offset by an increase in SG&A. |
• | The year to date increases in net sales volume and SG&A are both impacted by an additional month of TS operations due to the timing of the completion of the acquisition in the prior year. |
34
ASIA-PACIFIC | |
QUARTERLY RESULTS
($ in millions)
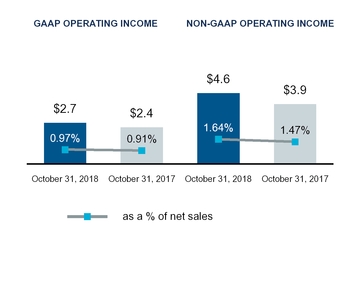
YEAR TO DATE RESULTS
($ in millions)
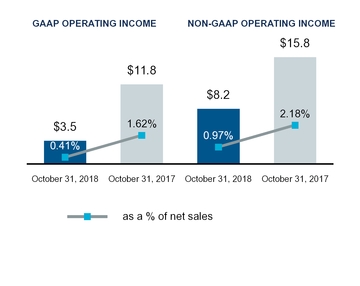
Three months ended October 31, | Nine months ended October 31, | |||||||||||||||
2018 | 2017 | 2018 | 2017 | |||||||||||||
(in millions) | ||||||||||||||||
Operating income - Asia-Pacific | $ | 2.7 | $ | 2.4 | $ | 3.5 | $ | 11.8 | ||||||||
Acquisition, integration and restructuring expenses | 0.6 | 0.3 | 1.1 | 0.4 | ||||||||||||
Acquisition-related intangible assets amortization expense | 1.3 | 1.2 | 4.0 | 3.6 | ||||||||||||
Tax indemnification | — | — | (0.4 | ) | — | |||||||||||
Non-GAAP operating income - Asia-Pacific | $ | 4.6 | $ | 3.9 | $ | 8.2 | $ | 15.8 | ||||||||
ASIA-PACIFIC COMMENTARY
• | Quarter to date GAAP and non-GAAP operating income were both relatively flat when compared to the prior year. The year to date decreases in both GAAP and non-GAAP operating income are primarily due to investments in personnel to support our operations in the region. |
35
OPERATING INCOME BY REGION | |
We do not consider stock-based compensation expenses in assessing the performance of our operating segments, and therefore the Company reports stock-based compensation expenses separately. The following table reconciles our operating income by geographic region to our consolidated operating income.
Three months ended October 31, | Nine months ended October 31, | ||||||||||||||
2018 | 2017 | 2018 | 2017 | ||||||||||||
(in millions) | |||||||||||||||
Americas | $ | 112.4 | $ | 55.6 | $ | 261.7 | $ | 194.4 | |||||||
Europe | 39.9 | 29.9 | 86.2 | 73.2 | |||||||||||
Asia-Pacific | 2.7 | 2.4 | 3.5 | 11.8 | |||||||||||
Stock-based compensation expense | (8.1 | ) | (8.3 | ) | (23.7 | ) | (21.2 | ) | |||||||
Operating income | $ | 146.9 | $ | 79.6 | $ | 327.7 | $ | 258.2 | |||||||
INTEREST EXPENSE | |
Interest expense decreased by $0.5 million to $25.4 million in the third quarter of fiscal 2019 compared to $25.9 million in the third quarter of fiscal 2018. The quarter to date decrease is primarily due to $1.8 million of prior year interest expense on $350 million of Senior Notes that matured in September 2017 and lower amounts outstanding on the Term Loan Credit Agreement, partially offset by higher average borrowings and interest rates on other credit facilities during the period. On a year to date basis, interest expense decreased by $5.8 million to $79.4 million in the first nine months of fiscal 2019 compared to $85.2 million in the same period of the prior fiscal year. The year to date decrease is primarily due to $8.3 million of prior year interest expense on $350 million of Senior Notes that matured in September 2017, $4.6 million of costs incurred in the prior year related to a commitment for a bridge loan facility obtained in conjunction with the acquisition of TS, and lower amounts outstanding on the Term Loan Credit Agreement, partially offset by higher average borrowings and interest rates on other credit facilities during the period.
OTHER EXPENSE (INCOME), NET | |
Other expense (income), net, consists primarily of gains and losses on the investments contained within life insurance policies used to fund our nonqualified deferred compensation plan, interest income, discounts on the sale of accounts receivable and net foreign currency exchange gains and losses on certain financing transactions and the related derivative instruments used to hedge such financing transactions. Other expense (income), net, increased to $5.0 million of expense in the third quarter of fiscal 2019 compared to $1.2 million of income in the third quarter of the prior year, primarily due to losses on the investments within the life insurance policies used to fund our nonqualified deferred compensation plan and higher discounts on the sale of accounts receivable. On a year to date basis, other expense (income), net, increased to $7.8 million of expense in the first nine months of fiscal 2019 compared to $1.4 million of income in the same period of the prior fiscal year. The year to date increase in other expense (income), net, is primarily due to losses on the investments within the life insurance policies used to fund our nonqualified deferred compensation plan and higher discount fees on the sale of accounts receivable.
36
PROVISION FOR INCOME TAXES | |
The following table provides a comparison of our provision for income taxes and our effective tax rate for the three and nine months ended October 31, 2018 and 2017:
QUARTERLY RESULTS | ||||
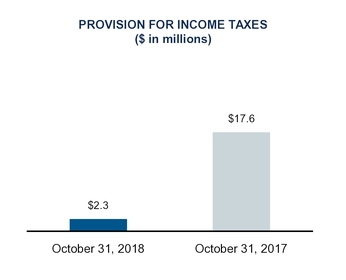
YEAR TO DATE RESULTS | ||||
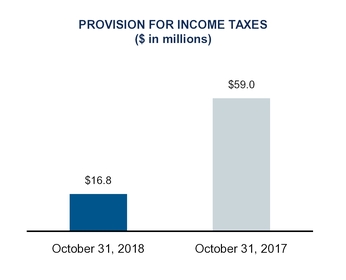
Three months ended October 31, | Nine months ended October 31, | ||||||
2018 | 2017 | 2018 | 2017 | ||||
Effective tax rate | 2.0% | 32.1% | 7.0% | 33.8% | |||
The decrease in both the effective tax rate and the provision for income taxes for the three and nine months ended October 31, 2018, as compared to the prior year, is primarily due to the impact of the following:
• | During the three and nine months ended October 31, 2018, we decreased our provisional estimate of the one-time transition tax related to U.S. Tax Reform by $24.0 million. |
• | During the three and nine months ended October 31, 2018, we recorded income tax benefits of $5.5 million and $6.1 million, respectively, due to the resolution of a pre-acquisition tax matter related to TS. |
• | During the nine months ended October 31, 2018, we recorded income tax benefits of $13.0 million in relation to the settlement agreement reached with Avnet (see Note 4 of Notes to Consolidated Financial Statements for further discussion). |
• | The decrease in the U.S. federal income tax rate partially offset by GILTI provisions due to U.S. Tax Reform. |
Additionally, the change in the effective tax rate was impacted by the relative mix of earnings and losses within the taxing jurisdictions in which we operate.
U.S. Tax Reform
On December 22, 2017, the U.S. federal government enacted the U.S. Tax Cuts and Jobs Act (“U.S. Tax Reform”) which significantly revised U.S. corporate income tax law by, among other things, reducing the U.S. federal corporate income tax rate from 35% to 21% and implementing a modified territorial tax system that includes a one-time transition tax on deemed repatriated earnings of foreign subsidiaries. The SEC has provided accounting and reporting guidance that allows us to report provisional amounts within a measurement period up to one year due to the complexities inherent in adopting the changes. In the fourth quarter of fiscal 2018, we recorded income tax expense of $95.4 million, which represented our reasonable estimate of the impact of the enactment of U.S. Tax Reform. The amounts recorded include income tax expense of $101.1 million for the one-time transition tax and a net income tax benefit of $5.7 million related to the remeasurement of net deferred tax liabilities as a result of the change in the U.S. federal corporate income tax rate.
During the three and nine months ended October 31, 2018, we decreased our provisional estimate of the one-time transition tax by $24.0 million upon further analysis of earnings and profits of our foreign subsidiaries and utilization of foreign tax credits. We consider
37
both the recognition of the transition tax and the remeasurement of deferred taxes incomplete. New guidance from regulators, interpretation of the law, and refinement of our estimates from ongoing analysis of data and tax positions may further change the provisional amounts recorded (see Note 8 of Notes to Consolidated Financial Statements for further discussion).
Tax Indemnifications
In connection with the acquisition of TS, pursuant to the interest purchase agreement, the Company and Avnet agreed to indemnify each other in relation to certain tax matters. As a result, we have recorded certain indemnification assets and liabilities for expected amounts to be received from and paid to Avnet. During the three and nine months ended October 31, 2018, due to the resolution of a pre-acquisition tax matter in a jurisdiction in which we operate, we recorded a benefit in income tax expense of $5.5 million and $6.1 million, respectively. As a result, we recorded expenses to recognize the corresponding indemnification liability of $5.5 million and $6.1 million during the three and nine months ended October 31, 2018, respectively, which is included in “selling, general and administrative expenses” in the Consolidated Statement of Income. The net impact of these items had no impact on our net income.
38
NET INCOME AND EARNINGS PER SHARE-DILUTED | |
QUARTERLY RESULTS
The following table provides an analysis of GAAP and non-GAAP net income and earnings per share-diluted as well as a reconciliation of results recorded in accordance with GAAP and non-GAAP financial measures for the three months ended October 31, 2018 and 2017 ($ in millions, except per share data):
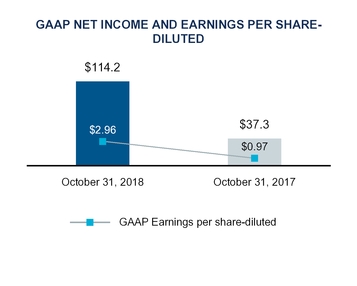

CONSOLIDATED GAAP TO NON-GAAP RECONCILIATION | |||||||||||||||
Net Income | Earnings per Share-Diluted | ||||||||||||||
Three months ended October 31, 2018: | 2018 | 2017 | 2018 | 2017 | |||||||||||
(in millions, except per share data) | |||||||||||||||
GAAP results | $ | 114.2 | $ | 37.3 | $ | 2.96 | $ | 0.97 | |||||||
Acquisition, integration and restructuring expenses | 20.3 | 29.7 | 0.53 | 0.77 | |||||||||||
Legal settlements and other, net | (7.2 | ) | — | (0.19 | ) | — | |||||||||
Acquisition-related intangible assets amortization expense | 22.5 | 26.4 | 0.58 | 0.69 | |||||||||||
Tax indemnifications | 5.5 | — | 0.14 | — | |||||||||||
Income tax effect of tax indemnifications | (5.5 | ) | — | (0.14 | ) | — | |||||||||
Income tax effect of other adjustments above | (8.8 | ) | (16.7 | ) | (0.23 | ) | (0.43 | ) | |||||||
Income tax benefit from acquisition settlement | (0.2 | ) | — | — | — | ||||||||||
Reversal of deferred tax valuation allowances | (0.5 | ) | — | (0.01 | ) | — | |||||||||
Impact of U.S. Tax Reform | (24.0 | ) | — | (0.62 | ) | — | |||||||||
Non-GAAP results | $ | 116.3 | $ | 76.7 | $ | 3.02 | $ | 2.00 | |||||||
39
YEAR TO DATE RESULTS
The following table provides an analysis of GAAP and non-GAAP net income and earnings per share-diluted as well as a reconciliation of results recorded in accordance with GAAP and non-GAAP financial measures for the nine months ended October 31, 2018 and 2017 ($ in millions, except per share data):
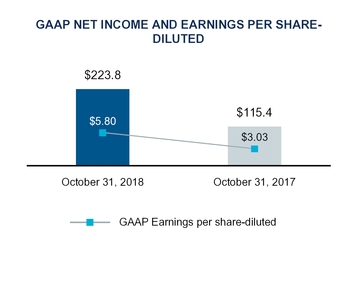
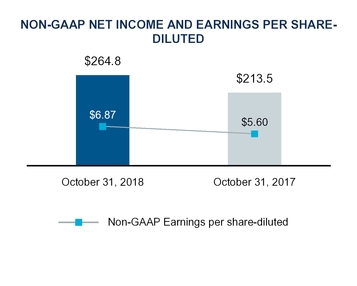
CONSOLIDATED GAAP TO NON-GAAP RECONCILIATION | |||||||||||||||
Net Income | Earnings per Share-Diluted | ||||||||||||||
Nine months ended October 31, 2018: | 2018 | 2017 | 2018 | 2017 | |||||||||||
(in millions, except per share data) | |||||||||||||||
GAAP results | $ | 223.8 | $ | 115.4 | $ | 5.80 | $ | 3.03 | |||||||
Acquisition, integration and restructuring expenses | 66.8 | 101.9 | 1.73 | 2.68 | |||||||||||
Legal settlements and other, net | (15.4 | ) | (41.0 | ) | (0.40 | ) | (1.08 | ) | |||||||
Acquisition-related intangible assets amortization expense | 68.5 | 68.0 | 1.78 | 1.78 | |||||||||||
Gain on disposal of subsidiary | (6.7 | ) | — | (0.17 | ) | — | |||||||||
Tax indemnifications | 6.1 | — | 0.16 | — | |||||||||||
Value added tax assessment and related interest expense | (0.9 | ) | — | (0.02 | ) | — | |||||||||
Acquisition-related financing expenses | — | 8.8 | — | 0.23 | |||||||||||
Income tax effect of tax indemnifications | (6.1 | ) | — | (0.16 | ) | — | |||||||||
Income tax effect of other adjustments above | (31.2 | ) | (39.6 | ) | (0.81 | ) | (1.04 | ) | |||||||
Income tax benefit from acquisition settlement | (13.0 | ) | — | (0.34 | ) | — | |||||||||
Reversal of deferred tax valuation allowances | (3.1 | ) | — | (0.08 | ) | — | |||||||||
Impact of U.S. Tax Reform | (24.0 | ) | — | (0.62 | ) | — | |||||||||
Non-GAAP results | $ | 264.8 | $ | 213.5 | $ | 6.87 | $ | 5.60 | |||||||
40
LIQUIDITY AND CAPITAL RESOURCES | |
Our discussion of liquidity and capital resources includes an analysis of our cash flows and capital structure for all periods presented.
CASH FLOWS
The following table summarizes our Consolidated Statement of Cash Flows:
Nine months ended October 31, 2018: | 2018 | 2017 | |||||
(in millions) | |||||||
Net cash provided by (used in): | |||||||
Operating activities | $ | 149.3 | $ | 441.1 | |||
Investing activities | (154.3 | ) | (2,464.3 | ) | |||
Financing activities | (266.6 | ) | 406.6 | ||||
Effect of exchange rate changes on cash and cash equivalents | (37.5 | ) | 53.7 | ||||
Net decrease in cash and cash equivalents | $ | (309.1 | ) | $ | (1,562.9 | ) | |
As a distribution company, our business requires significant investment in working capital, particularly accounts receivable and inventory, partially financed through our accounts payable to vendors and short-term borrowings. An important driver of our operating cash flows is our cash conversion cycle (also referred to as “net cash days”). Our net cash days are defined as days of sales outstanding in accounts receivable ("DSO") plus days of supply on hand in inventory ("DOS"), less days of purchases outstanding in accounts payable ("DPO"). We manage our cash conversion cycle on a daily basis throughout the year and our reported financial results reflect that cash conversion cycle at the balance sheet date. The following tables present the components of our cash conversion cycle, in days, as of October 31, 2018 and 2017, and January 31, 2018 and 2017.
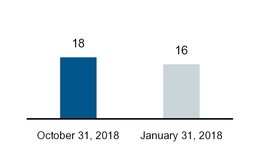
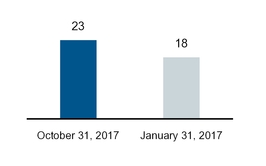
As of: | October 31, 2018 | January 31, 2018 | As of: | October 31, 2017 | January 31, 2017 | ||||||||
DSO | 58 | 55 | DSO | 54 | 43 | ||||||||
DOS | 33 | 29 | DOS | 32 | 29 | ||||||||
DPO | (73 | ) | (68 | ) | DPO | (63 | ) | (54 | ) | ||||
Net cash days | 18 | 16 | Net cash days | 23 | 18 | ||||||||
The decrease in cash provided by operating activities of $291.8 million is primarily due to changes in working capital, including impacts from the timing of collections from customers. Additionally, cash provided by operating activities in the first nine months of fiscal 2018 includes a net benefit from changes in TS working capital as compared to the date of acquisition.
The decrease in net cash used in investing activities is primarily due to $2.25 billion in cash paid in the prior year for the acquisition of TS, net of cash acquired. The increase in net cash used by financing activities is primarily due to current year payments of $200 million under the Term Loan Credit Agreement as compared to net borrowings in the prior year of $800 million, partially offset by the repayment of $350 million of Senior Notes upon maturity in the prior year.
41
CAPITAL RESOURCES AND DEBT COMPLIANCE
Our debt to total capital ratio was 33% at October 31, 2018. As part of our capital structure and to provide us with significant liquidity, we have a diverse range of financing facilities across our geographic regions with various financial institutions. Also providing us liquidity are our cash and cash equivalents balances across our regions which are deposited and/or invested with various financial institutions. We are exposed to risk of loss on funds deposited with these financial institutions; however, we monitor our financing and depository financial institution partners regularly for credit quality. We believe that our existing sources of liquidity, including our financing facilities and cash resources, as well as cash expected to be provided by operating activities and our ability to issue debt or equity, if necessary, will be sufficient to meet our working capital needs and cash requirements for at least the next 12 months.
At October 31, 2018, we had approximately $646.5 million in cash and cash equivalents, of which approximately $628.1 million was held in our foreign subsidiaries. As discussed above, the Company currently has sufficient resources, cash flows and liquidity within the U.S. to fund current and expected future working capital requirements. Historically, we have utilized and reinvested cash earned outside the U.S. to fund foreign operations and expansion. We are currently in process of evaluating the use of our foreign cash due to the enactment of U.S. Tax Reform (see Note 8 of Notes to Consolidated Financial Statements for further discussion).
The following is a discussion of our various financing facilities:
Senior notes
In January 2017, we issued $500.0 million aggregate principal amount of 3.70% Senior Notes due 2022 (the "3.70% Senior Notes") and $500.0 million aggregate principal amount of 4.95% Senior Notes due 2027 (the "4.95% Senior Notes") (collectively the "2017 Senior Notes"). The net proceeds from the issuance of the 2017 Senior Notes were used to fund a portion of the purchase price of the acquisition of TS. We pay interest on the 2017 Senior Notes semi-annually in arrears on February 15 and August 15 of each year. The interest rate payable on the 2017 Senior Notes will be subject to adjustment from time to time if the credit rating assigned to such series of notes changes. At no point will the interest rate be reduced below the interest rate payable on the notes on the date of the initial issuance or increase more than 2.00% above the interest rate payable on the notes of the series on the date of their initial issuance. The 2017 Senior Notes are our senior unsecured obligations and will rank equally with all of our other unsecured and unsubordinated indebtedness outstanding from time to time.
We, at our option, may redeem the 3.70% Senior Notes at any time prior to January 15, 2022 and the 4.95% Senior Notes at any time prior to November 15, 2026, in each case in whole or in part, at a redemption price equal to the greater of (i) 100% of the principal amount of the 2017 Senior Notes to be redeemed or (ii) the sum of the present values of the remaining scheduled payments of principal and interest on the 2017 Senior Notes to be redeemed, discounted to the date of redemption on a semi-annual basis at a rate equal to the sum of the applicable Treasury Rate plus 30 basis points for the 3.70% Senior Notes and 40 basis points for the 4.95% Senior Notes, plus the accrued and unpaid interest on the principal amount being redeemed up to the date of redemption. We may also redeem the 2017 Senior Notes, at any time in whole or from time to time in part, on or after January 15, 2022 for the 3.70% Senior Notes and November 15, 2026 for the 4.95% Senior Notes, in each case, at a redemption price equal to 100% of the principal amount of the 2017 Senior Notes to be redeemed.
Other credit facilities
We have a $1.25 billion revolving credit facility with a syndicate of banks (the “Credit Agreement”) which, among other things, provides for (i) a maturity date of November 2, 2021 and (ii) an interest rate on borrowings, facility fees and letter of credit fees based on our non-credit enhanced senior unsecured debt rating as determined by Standard & Poor’s Rating Service and Moody’s Investor Service. We pay interest on advances under the Credit Agreement at the applicable LIBOR rate (or similar interbank offered rates depending on currency draw) plus a predetermined margin that is based on our debt rating. Our borrowings under the Credit Agreement vary within the period primarily based on changes in our working capital. There were no amounts outstanding under the Credit Agreement at October 31, 2018 and January 31, 2018.
We entered into a term loan credit agreement on November 2, 2016 with a syndicate of banks (the "Term Loan Credit Agreement") which provides for the borrowing of (i) a tranche of senior unsecured term loans in an original aggregate principal amount of $250 million and maturing three years after the funding date and (ii) a tranche of senior unsecured term loans in an original aggregate principal amount of $750 million and maturing five years after the funding date. We pay interest on advances under the Term Loan Credit Agreement at a variable rate based on LIBOR (or similar interbank offered rates depending on currency draw) plus a predetermined margin that is based on our debt rating. In connection with the acquisition of TS on February 27, 2017, we borrowed $1.0 billion under our Term Loan Credit Agreement in order to fund a portion of the cash consideration paid to Avnet. The borrowings were comprised of a $250.0 million tranche of three-year senior unsecured term loans (the “2020 Term Loans”) and a $750.0 million tranche of five-year senior unsecured term loans (the “2022 Term Loans”). The 2020 Term Loans were repaid in full during fiscal 2018.
The outstanding principal amount of the 2022 Term Loans is payable in equal quarterly installments of i) for the first three years after the funding date, 5.0% per annum of the initial principal amount and ii) for the fourth and fifth years after the funding date, 10.0% per annum of the initial principal amount, with the remaining balance payable on February 27, 2022. We may repay the 2022 Term Loans, at any time in whole or in part, without penalty or premium prior to the maturity date. Quarterly installment payments due under the
42
2022 Term Loans are reduced by the amount of any prepayments made by us. At October 31, 2018, there was $300 million outstanding on the 2022 Term Loans, at an interest rate of 3.74%.
We also have an agreement with a syndicate of banks (the "Receivables Securitization Program") that allows us to transfer an undivided interest in a designated pool of U.S. accounts receivable, on an ongoing basis, to provide collateral for borrowings up to a maximum of $750.0 million. Under this program, we transfer certain U.S. trade receivables into a wholly-owned bankruptcy remote special purpose entity. Such receivables, which are recorded in the Consolidated Balance Sheet, totaled approximately $1.7 billion and $1.5 billion, respectively, at October 31, 2018 and January 31, 2018. As collections reduce accounts receivable balances included in the collateral pool, we may transfer interests in new receivables to bring the amount available to be borrowed up to the maximum. The Receivables Securitization Program has a maturity date of August 8, 2019 and we pay interest on advances at designated commercial paper or LIBOR-based rates plus an agreed-upon margin. Our borrowings under the Receivables Securitization Agreement vary within the period primarily based on changes in our working capital. There were no amounts outstanding under the Receivables Securitization Program at October 31, 2018 and January 31, 2018.
In addition to the facilities described above, we have various other committed and uncommitted lines of credit and overdraft facilities totaling approximately $432.9 million at October 31, 2018 to support our operations. Most of these facilities are provided on an unsecured, short-term basis and are reviewed periodically for renewal. Our borrowings under these facilities vary within the period primarily based on changes in our working capital. There was $102.5 million outstanding on these facilities at October 31, 2018, at a weighted average interest rate of 6.97%, and there was $119.8 million outstanding at January 31, 2018, at a weighted average interest rate of 6.07%.
At October 31, 2018, we had also issued standby letters of credit of $11.5 million. These letters of credit typically act as a guarantee of payment to certain third parties in accordance with specified terms and conditions. The issuance of these letters of credit reduces the Company's borrowing availability under certain of the above-mentioned credit facilities.
Certain of our credit facilities contain limitations on the amounts of annual dividends and repurchases of common stock and require compliance with other obligations, warranties and covenants. The financial ratio covenants within these credit facilities include a maximum total leverage ratio and a minimum interest coverage ratio. At October 31, 2018, we were in compliance with all such financial covenants.
Accounts receivable purchase agreements
We have uncommitted accounts receivable purchase agreements under which certain accounts receivable may be sold, without recourse, to third-party financial institutions. Under these programs, we may sell certain accounts receivable in exchange for cash less a discount, as defined in the agreements. Available capacity under these programs, which we use as a source of working capital funding, is dependent on the level of accounts receivable eligible to be sold into these programs and the financial institutions' willingness to purchase such receivables. In addition, certain of these agreements also require that we continue to service, administer and collect the sold accounts receivable. At October 31, 2018 and January 31, 2018, we had a total of $924.6 million and $687.2 million, respectively, of outstanding accounts receivable sold to and held by financial institutions under these agreements. During the three months ended October 31, 2018 and 2017, discount fees recorded under these facilities were $4.1 million and $1.8 million, respectively, and during the nine months ended October 31, 2018 and 2017, discount fees recorded under these facilities were $10.5 million and $5.9 million, respectively. These discount fees are included as a component of "other expense (income), net" in our Consolidated Statement of Income.
43
ITEM 3. Quantitative and Qualitative Disclosures About Market Risk.
For a description of the Company’s market risks, see “Part II, Item 7A. Quantitative and Qualitative Disclosures About Market Risk” in our Annual Report on Form 10-K for the fiscal year ended January 31, 2018.
No material changes have occurred in our market risks since January 31, 2018.
44
ITEM 4. Controls and Procedures.
Evaluation of Disclosure Controls and Procedures
The Company maintains disclosure controls and procedures designed to ensure that information required to be disclosed in reports filed under the Securities Exchange Act of 1934, as amended (the “Exchange Act”), is recorded, processed, summarized and reported within the specified time period. Tech Data’s management, with the participation of the Company’s Chief Executive Officer (“CEO”) and Chief Financial Officer (“CFO”), has evaluated the effectiveness of the Company’s disclosure controls and procedures (as defined in Rules 13a-15(e) and 15d-15(e) under the Exchange Act), as of October 31, 2018. Based on that evaluation, the Company’s CEO and CFO concluded that the Company’s disclosure controls and procedures were effective as of October 31, 2018.
Changes in Internal Control Over Financial Reporting
There were no changes in our internal control over financial reporting (as defined in Rules 13a-15(f) and 15d-15(f) under the Exchange Act) identified in connection with management’s evaluation during our third quarter of fiscal 2019 that have materially affected, or are reasonably likely to materially affect, the Company’s internal control over financial reporting.
45
PART II
ITEM 1. Legal Proceedings.
Prior to fiscal 2004, one of our subsidiaries, located in Spain, was audited in relation to various value added tax (“VAT”) matters and received notices of assessment for several fiscal years that alleged the subsidiary did not properly collect and remit VAT. The Spanish subsidiary appealed these assessments beginning in March 2010. As of January 31, 2018, we had recorded a liability for the entire amount of the remaining assessments, which related to fiscal years 1994 and 1995, of approximately $10.7 million, including estimates of various penalties and interest. During the nine months ended October 31, 2018, we paid the assessed amounts and recorded a benefit in interest expense of $0.9 million to adjust our accrual for estimated interest costs to the final assessed amount.
In December 2010, in a non-unanimous decision, a Brazilian appellate court overturned a 2003 trial court which had previously ruled in favor of our Brazilian subsidiary related to the imposition of certain taxes on payments abroad related to the licensing of commercial software products, commonly referred to as “CIDE tax.” We estimate the total exposure related to the CIDE tax, including interest, was approximately $20.3 million at October 31, 2018. The Brazilian subsidiary has appealed the unfavorable ruling to the Supreme Court and Superior Court, Brazil's two highest appellate courts. Based on the legal opinion of outside counsel, we believe that the chances of success on appeal of this matter are favorable and the Brazilian subsidiary intends to vigorously defend its position that the CIDE tax is not due. However, due to the lack of predictability of the Brazilian court system, we have concluded that it is reasonably possible that the Brazilian subsidiary may incur a loss up to the total exposure described above. We believe the resolution of this litigation will not be material to the Company’s consolidated net assets or liquidity.
In June 2013, we were the subject of a document seizure by the French Autorité de la Concurrence (Competition Authority), following allegations of anticompetitive distribution practices in the French market for the products of one of our suppliers. In October 2018, the Competition Authority delivered a notification des griefs (statement of objections) to the Company, stating that the Competition Authority is pursuing charges against the Company in this matter. The Competition Authority has taken similar action against our supplier and another of its distributors. At this time, we cannot determine the likelihood of loss or reasonably estimate the range of any loss arising from this proceeding.
We are subject to various other legal proceedings and claims arising in the ordinary course of business. Our management does not expect that the outcome in any of these other legal proceedings, individually or collectively, will have a material adverse effect on our financial condition, results of operations, or cash flows.
ITEM 1A. Risk Factors.
In addition to other information set forth in this report, you should carefully consider the factors discussed in Part I, Item 1A. “Risk Factors” in our Annual Report on Form 10-K for the year ended January 31, 2018, which could materially affect our business, financial position and results of operations. Risk factors which could cause actual results to differ materially from those suggested by forward-looking statements include but are not limited to those discussed or identified in this document, in our public filings with the SEC, and those incorporated by reference in Part I, Item 1A. “Risk Factors” in our Annual Report on Form 10-K for the year ended January 31, 2018.
ITEM 2. Unregistered Sales of Equity Securities and Use of Proceeds.
The following table presents information with respect to purchases of common stock by the Company under the share repurchase program during the quarter ended October 31, 2018:
Issuer Purchases of Equity Securities | ||||||||||||||
Period | Total number of shares purchased | Average price paid per share | Total number of shares purchased as part of a publicly announced plan or program | Maximum dollar value of shares that may yet be purchased under the plan or programs | ||||||||||
October 1 - October 31, 2018 | 621,440 | $ | 70.48 | 621,440 | $ | 156,202,388 | ||||||||
Total | 621,440 | $ | 70.48 | 621,440 | ||||||||||
46
ITEM 3. Defaults Upon Senior Securities.
Not applicable.
ITEM 4. Mine Safety Disclosures.
Not applicable.
47
ITEM 5. Other Information.
None.
48
ITEM 6. Exhibits.
(a) | Exhibits |
3-1(2) | Amended and Restated Articles of Incorporation of Tech Data Corporation filed on June 4, 2014 with the Secretary of the State of Florida |
3-2(2) | Bylaws of Tech Data Corporation as adopted by the Board of Directors and approved by the Shareholders on June 4, 2014 |
31-A(1) | Certification of Chief Executive Officer Pursuant to Exchange Act Rules 13a-14(a) and 15d-14(a), as Adopted Pursuant to Section 302 of the Sarbanes-Oxley Act of 2002 |
31-B(1) | Certification of Chief Financial Officer Pursuant to Exchange Act Rules 13a-14(a) and 15d-14(a), as Adopted Pursuant to Section 302 of the Sarbanes-Oxley Act of 2002 |
32-A(1) | Certification of Chief Executive Officer Pursuant to 18 U.S.C. Section 1350, as Adopted Pursuant to Section 906 of the Sarbanes-Oxley Act of 2002 |
32-B(1) | Certification of Chief Financial Officer Pursuant to 18 U.S.C. Section 1350, as Adopted Pursuant to Section 906 of the Sarbanes-Oxley Act of 2002 |
101(3) | Interactive data files pursuant to Rule 405 of Regulation S-T: (i) Consolidated Balance Sheet as of October 31, 2018 and January 31, 2018; (ii) Consolidated Statement of Income for the three and nine months ended October 31, 2018 and 2017; (iii) Consolidated Statement of Comprehensive Income (Loss) for the three and nine months ended October 31, 2018 and 2017; (iv) Consolidated Statement of Cash Flows for the nine months ended October 31, 2018 and 2017; and (v) Notes to Consolidated Financial Statements, detail tagged. |
(1) | Filed herewith. |
(2) | Incorporated by reference to the Exhibits included in the Company’s Form 10-Q for the quarter ended April 30, 2014, File No. 0-14625. |
(3) | XBRL (Extensible Business Reporting Language) information is furnished and not filed or a part of a registration statement or prospectus for purposes of Sections 11 and 12 of the Securities Act of 1933, is deemed not filed for purposes of Section 18 of the Securities Exchange Act of 1934, and otherwise is not subject to liability under these sections. |
49
SIGNATURES
Pursuant to the requirements of the Securities Exchange Act of 1934, the Registrant has duly caused this report to be signed on its behalf by the undersigned thereunto duly authorized.
TECH DATA CORPORATION
(Registrant)
Signature | Title | Date | ||
/s/ RICHARD T. HUME | Chief Executive Officer, Director (principal executive officer) | December 6, 2018 | ||
Richard T. Hume | ||||
/s/ CHARLES V. DANNEWITZ | Executive Vice President, Chief Financial Officer (principal financial officer) | December 6, 2018 | ||
Charles V. Dannewitz | ||||
50
Exhibit 31-A
Certification of Chief Executive Officer
Pursuant to
Exchange Act Rules 13a-14(a) and 15d-14(a)
As Adopted Pursuant to
Section 302 of The Sarbanes-Oxley Act of 2002
I, Richard T. Hume, certify that:
1. | I have reviewed this quarterly report on Form 10-Q of Tech Data Corporation (the “registrant”); |
2. | Based on my knowledge, this report does not contain any untrue statement of a material fact or omit to state a material fact necessary to make the statements made, in light of the circumstances under which such statements were made, not misleading with respect to the period covered by this report; |
3. | Based on my knowledge, the financial statements, and other financial information included in this report, fairly present in all material respects the financial condition, results of operations and cash flows of the registrant as of, and for, the periods presented in this report; |
4. | The registrant’s other certifying officer and I are responsible for establishing and maintaining disclosure controls and procedures (as defined in Exchange Act Rules 13a-15(e) and 15d-15(e)), and internal control over financial reporting (as defined in Exchange Act Rules 13a-15(f) and 15d-15(f)) for the registrant and have: |
a) | Designed such disclosure controls and procedures, or caused such disclosure controls and procedures to be designed under our supervision, to ensure that material information relating to the registrant, including its consolidated subsidiaries, is made known to us by others within those entities, particularly during the period in which this report is being prepared; |
b) | Designed such internal control over financial reporting, or caused such internal control over financial reporting to be designed under our supervision, to provide reasonable assurance regarding the reliability of financial reporting and the preparation of financial statements for external purposes in accordance with generally accepted accounting principles; |
c) | Evaluated the effectiveness of the registrant’s disclosure controls and procedures and presented in this report our conclusions about the effectiveness of the disclosure controls and procedures, as of the end of the period covered by this report based on such evaluation; and |
d) | Disclosed in this report any change in the registrant’s internal control over financial reporting that occurred during the registrant’s most recent fiscal quarter (the registrant’s fourth fiscal quarter in the case of an annual report) that has materially affected, or is reasonably likely to materially affect, the registrant’s internal control over financial reporting; and |
5. | The registrant’s other certifying officer and I have disclosed, based on our most recent evaluation of internal control over financial reporting, to the registrant’s auditors and the audit committee of the registrant’s board of directors (or persons performing the equivalent functions): |
a) | All significant deficiencies and material weaknesses in the design or operation of internal control over financial reporting which are reasonably likely to adversely affect the registrant’s ability to record, process, summarize and report financial information; and |
b) | Any fraud, whether or not material, that involves management or other employees who have a significant role in the registrant’s internal control over financial reporting. |
Date: December 6, 2018
/s/Richard T. Hume |
Richard T. Hume Chief Executive Officer, Director |
Exhibit 31-B
Certification of Chief Financial Officer
Pursuant to
Exchange Act Rules 13a-14(a) and 15d-14(a)
As Adopted Pursuant to
Section 302 of The Sarbanes-Oxley Act of 2002
I, Charles V. Dannewitz, certify that:
1. | I have reviewed this quarterly report on Form 10-Q of Tech Data Corporation (the “registrant”); |
2. | Based on my knowledge, this report does not contain any untrue statement of a material fact or omit to state a material fact necessary to make the statements made, in light of the circumstances under which such statements were made, not misleading with respect to the period covered by this report; |
3. | Based on my knowledge, the financial statements, and other financial information included in this report, fairly present in all material respects the financial condition, results of operations and cash flows of the registrant as of, and for, the periods presented in this report; |
4. | The registrant’s other certifying officer and I are responsible for establishing and maintaining disclosure controls and procedures (as defined in Exchange Act Rules 13a-15(e) and 15d-15(e)), and internal control over financial reporting (as defined in Exchange Act Rules 13a-15(f) and 15d-15(f)) for the registrant and have: |
a) | Designed such disclosure controls and procedures, or caused such disclosure controls and procedures to be designed under our supervision, to ensure that material information relating to the registrant, including its consolidated subsidiaries, is made known to us by others within those entities, particularly during the period in which this report is being prepared; |
b) | Designed such internal control over financial reporting, or caused such internal control over financial reporting to be designed under our supervision, to provide reasonable assurance regarding the reliability of financial reporting and the preparation of financial statements for external purposes in accordance with generally accepted accounting principles; |
c) | Evaluated the effectiveness of the registrant’s disclosure controls and procedures and presented in this report our conclusions about the effectiveness of the disclosure controls and procedures, as of the end of the period covered by this report based on such evaluation; and |
d) | Disclosed in this report any change in the registrant’s internal control over financial reporting that occurred during the registrant’s most recent fiscal quarter (the registrant’s fourth fiscal quarter in the case of an annual report) that has materially affected, or is reasonably likely to materially affect, the registrant’s internal control over financial reporting; and |
5. | The registrant’s other certifying officer and I have disclosed, based on our most recent evaluation of internal control over financial reporting, to the registrant’s auditors and the audit committee of the registrant’s board of directors (or persons performing the equivalent functions): |
a) | All significant deficiencies and material weaknesses in the design or operation of internal control over financial reporting which are reasonably likely to adversely affect the registrant’s ability to record, process, summarize and report financial information; and |
b) | Any fraud, whether or not material, that involves management or other employees who have a significant role in the registrant’s internal control over financial reporting. |
Date: December 6, 2018
/s/Charles V. Dannewitz |
Charles V. Dannewitz Executive Vice President, Chief Financial Officer |
Exhibit 32-A
Certification of Chief Executive Officer
Pursuant to
18 U.S.C. Section 1350,
As Adopted Pursuant to
Section 906 of The Sarbanes-Oxley Act of 2002
I, Richard T. Hume, Chief Executive Officer of Tech Data Corporation (the “Company”), certify, pursuant to Section 906 of the Sarbanes-Oxley Act of 2002, 18 U.S.C. Section 1350, that, to my knowledge:
(i) | The Quarterly Report on Form 10-Q of Tech Data Corporation for the quarter ended October 31, 2018 (the “Report”) fully complies with the requirements of Section 13(a) of the Securities Exchange Act of 1934, (15 U.S.C. 78m), and |
(ii) | The information contained in the Report fairly presents, in all material respects, the financial condition and results of operations of the Company. |
Date: December 6, 2018
/s/Richard T. Hume |
Richard T. Hume Chief Executive Officer, Director |
Exhibit 32-B
Certification of Chief Financial Officer
Pursuant to
18 U.S.C. Section 1350,
As Adopted Pursuant to
Section 906 of The Sarbanes-Oxley Act of 2002
I, Charles V. Dannewitz, Executive Vice President, Chief Financial Officer of Tech Data Corporation (the “Company”), certify, pursuant to Section 906 of the Sarbanes-Oxley Act of 2002, 18 U.S.C. Section 1350, that, to my knowledge:
(i) | The Quarterly Report on Form 10-Q of Tech Data Corporation for the quarter ended October 31, 2018 (the “Report”) fully complies with the requirements of Section 13(a) of the Securities Exchange Act of 1934, (15 U.S.C. 78m), and |
(ii) | The information contained in the Report fairly presents, in all material respects, the financial condition and results of operations of the Company. |
Date: December 6, 2018
/s/Charles V. Dannewitz |
Charles V. Dannewitz Executive Vice President, Chief Financial Officer |
Serious News for Serious Traders! Try StreetInsider.com Premium Free!
You May Also Be Interested In
- Tenet Director and Executive Officer Liang Qiu Files Early Warning Report
- Shake Shack (SHAK) Announces Resignation of Jonathan Sokoloff from Board, Cuts Board Size to 10 from 11
- Craft Cannabis Cultivator Hamilton Farms Lands on Dispensary Shelves in New Jersey
Create E-mail Alert Related Categories
SEC FilingsSign up for StreetInsider Free!
Receive full access to all new and archived articles, unlimited portfolio tracking, e-mail alerts, custom newswires and RSS feeds - and more!
