Form 8-K GMS Inc. For: Dec 07
UNITED STATES
SECURITIES AND EXCHANGE COMMISSION
Washington, D.C. 20549
FORM 8-K
CURRENT REPORT
Pursuant to Section 13 or 15(d)
of the Securities Exchange Act of 1934
Date of Report (Date of earliest event reported): December 7, 2017
GMS INC.
(Exact name of registrant as specified in charter)
|
Delaware |
|
001-37784 |
|
46-2931287 |
|
(State or Other Jurisdiction |
|
(Commission |
|
(I.R.S. Employer |
|
100 Crescent Centre Parkway, Suite 800 |
|
30084 |
|
(Address of Principal Executive Offices) |
|
(Zip Code) |
Registrant’s telephone number, including area code: (800) 392-4619
Check the appropriate box below if the Form 8-K filing is intended to simultaneously satisfy the filing obligation of the registrant under any of the following provisions:
o Written communications pursuant to Rule 425 under the Securities Act (17 CFR 230.425)
o Soliciting material pursuant to Rule 14a-12 under the Exchange Act (17 CFR 240.14a-12)
o Pre-commencement communications pursuant to Rule 14d-2(b) under the Exchange Act (17 CFR 240.14d-2(b))
o Pre-commencement communications pursuant to Rule 13e-4(c) under the Exchange Act (17 CFR 240.13e-4(c))
Indicate by check mark whether the registrant is an emerging growth company as defined in Rule 405 of the Securities Act of 1933 (§230.405 of this chapter) or Rule 12b-2 of the Securities Exchange Act of 1934 (§240.12b-2 of this chapter).
Emerging growth company o
If an emerging growth company, indicate by check mark if the registrant has elected not to use the extended transition period for complying with any new or revised financial accounting standards provided pursuant to Section 13(a) of the Exchange Act o
Item 2.02. Results of Operations and Financial Condition.
On December 7, 2017, GMS Inc. (the “Company” or “GMS”) issued a press release, a copy of which is furnished as Exhibit 99.1 hereto and incorporated herein by reference, announcing the Company’s financial results for the three and six months ended October 31, 2017.
The information contained in Item 7.01 concerning the presentation to GMS investors is hereby incorporated into this Item 2.02 by reference.
In accordance with General Instruction B.2 of Form 8-K, the information in this Item 2.02 of this Current Report on Form 8-K, including Exhibits 99.1 and 99.2 attached hereto, shall not be deemed “filed” for the purposes of Section 18 of the Securities Exchange Act of 1934, as amended (the “Exchange Act”), or otherwise subject to the liabilities of that section, nor shall it be deemed incorporated by reference in any filing under the Securities Act of 1933, as amended (the “Securities Act”), or the Exchange Act, except as shall be expressly set forth by specific reference in such a filing.
Item 7.01. Regulation FD Disclosure.
The slide presentation furnished as Exhibit 99.2 hereto, and incorporated herein by reference, will be presented to certain investors of GMS on December 7, 2017 and may be used by GMS in various other presentations to investors on or after December 7, 2017.
In accordance with General Instruction B.2 of Form 8-K, the information in this Item 7.01 of this Current Report on Form 8-K, including Exhibit 99.2 attached hereto, shall not be deemed “filed” for the purposes of Section 18 of the Exchange Act, or otherwise subject to the liabilities of that section, nor shall it be deemed incorporated by reference in any filing under the Securities Act or the Exchange Act, except as shall be expressly set forth by specific reference in such a filing.
Item 9.01. Financial Statements and Exhibits.
(d) Exhibits.
|
Exhibit |
|
Description |
|
99.1* |
|
Press release, dated December 7, 2017. |
|
99.2* |
|
GMS Inc. presentation to investors. |
*Furnished herewith
EXHIBIT INDEX
|
Exhibit |
|
Description |
|
99.1* |
|
|
|
99.2* |
|
*Furnished herewith
SIGNATURES
Pursuant to the requirements of the Securities Exchange Act of 1934, the Registrant has duly caused this report to be signed on its behalf by the undersigned hereunto duly authorized.
|
|
GMS INC. | ||
|
|
|
| |
|
|
|
| |
|
Date: December 7, 2017 |
By: |
/s/ H. Douglas Goforth | |
|
|
|
Name: |
H. Douglas Goforth |
|
|
|
Title: |
Chief Financial Officer |

GMS REPORTS RECORD SALES AND ADJUSTED EBITDA FOR SECOND QUARTER 2018
- Second Quarter Net Sales Increased 9.5% to $648.0 Million -
- Second Quarter Net Income Improved by 4.6% to $18.0 Million -
- Second Quarter Adjusted EBITDA Increased 9.5% to $54.2 Million -
Tucker, Georgia, December 7, 2017. GMS Inc. (NYSE: GMS), a leading North American distributor of wallboard and suspended ceilings systems, today reported financial results for the second quarter of fiscal 2018 ended October 31, 2017.
Second Quarter 2018 Highlights Compared to Second Quarter 2017
· Net sales increased 9.5% to a record $648.0 million; base business net sales increased 5.1%
· Wallboard unit volume grew 4.3% to a record 929 million square feet
· Net income increased to $18.0 million, or $0.43 per diluted share, compared to $17.2 million, or $0.42 per diluted share
· Adjusted EBITDA grew 9.5% to a record $54.2 million
· Gross margin expanded 20 basis points to 32.8%
· Acquired ASI Building Products, LLC in Michigan and Washington Builders Supply, Inc. in Pennsylvania during the second quarter
Mike Callahan, President and CEO of GMS, stated, “We are pleased to report a solid quarter highlighted by record Adjusted EBITDA of $54.2 million and net sales of $648.0 million, despite the negative impact of hurricanes Harvey and Irma. Our results reflect broad-based growth across all of our product categories, driven by strong commercial activity highlighted by 19.0% increase in our ceilings business, as well as 10.2% increase in our other product sales. As expected, gross margin rebounded from the first quarter to 32.8%, and we remain confident in our previously issued outlook of full-year gross margin of 32.5% for fiscal 2018.”
Mr. Callahan continued, “Our third quarter is off to a good start as underlying demand remains solid, pricing is up across all of our product categories and we continue to execute well against our growth strategy, all of which should drive above market net sales growth in the second half of the fiscal year. This coupled with improving gross margins and modest SG&A leverage expected in the second half of the fiscal year will help us deliver another record year of Adjusted EBITDA.”
Second Quarter 2018 Results
Net sales for the second quarter of fiscal 2018 ended October 31, 2017 were $648.0 million, compared to $591.8 million for the second quarter of fiscal 2017 ended October 31, 2016.
· Wallboard sales of $288.5 million increased 6.9%, compared to the second quarter of fiscal 2017 driven by wallboard unit volume growth of 4.3% to 929 million square feet and pricing improvement. Wallboard volumes benefitted from steady end market demand and the positive impact of acquisitions.
· Ceilings sales of $101.6 million rose 19.0%, compared to the second quarter of fiscal 2017, mainly due to greater commercial activity, price gains and the positive impact of acquisitions.
· Steel framing sales of $103.2 million grew 7.4%, compared to the second quarter of fiscal 2017, due to strong commercial activity and the positive impact of acquisitions, offset by lower steel prices.
· Other product sales of $154.7 million were up 10.2%, compared to the second quarter of fiscal 2017, as a result of strategic initiatives, price gains and the positive impact of acquisitions.
Gross profit of $212.3 million grew 9.9%, compared to $193.2 million in the second quarter of fiscal 2017, mainly attributable to higher pricing and increased sales. Gross margin was 32.8%, compared to 32.6% in the second quarter of fiscal 2017 largely due to pricing discipline and purchasing initiatives. On a sequential basis, gross margin improved 90 basis points from 31.9% from the first quarter of fiscal 2018.
Net income of $18.0 million, or $0.43 per diluted share, increased by 4.6% or $0.8 million, compared to $17.2 million, or $0.42 per diluted share, in the second quarter of fiscal 2017. Adjusted net income of $21.6 million, or $0.51 per diluted share, grew $1.5 million, compared to $20.1 million, or $0.49 per diluted share, in the second quarter of fiscal 2017.
Adjusted EBITDA of $54.2 million rose 9.5%, compared to $49.5 million in the second quarter of fiscal 2017. Adjusted EBITDA margin was 8.4% as a percentage of net sales, compared to 8.4% in the second quarter of fiscal 2017, with slight improvement in gross margin offset by an increase in SG&A related expenses.
Capital Resources
At October 31, 2017, GMS had cash of $19.8 million and total debt of $610.5 million, as compared to cash of $19.7 million and total debt of $602.9 million at July 31, 2017.
Acquisition Activity
During the second quarter of fiscal 2018, the Company acquired ASI Building Products, LLC, or ASI, a leading provider of ceilings and quality building products serving residential and commercial projects in Eastern Michigan, and Washington Builders Supply, Inc., or WBS, a leading provider of drywall, steel, insulation along with a full range of commercial and residential services in the Western Pennsylvania market.
Subsequent to October 31, 2017, the Company acquired Southwest Building Materials, Ltd. (“SWBM”). SWBM distributes wallboard, ceilings and other interior building products serving residential and commercial projects of all sizes throughout Northwest Texas. GMS now has 16 locations in Texas.
Conference Call and Webcast
GMS will host a conference call and webcast to discuss its results for the second quarter ended October 31, 2017 at 10:00 a.m. Eastern Time on December 7, 2017. Investors who wish to participate in the call should dial 800-259-2693 (domestic) or 323-794-2551 (international) at least 5 minutes prior to the start of the call. The live webcast will be available on the Investors section of the Company’s website at www.gms.com. There will be a slide presentation of the results available on that page of the website as well. Replays of the call will be available through January 7, 2018 and can be accessed at 844-512-2921 (domestic) or 412-317-6671 (international) and entering the pass code 5463988.
About GMS Inc.
Founded in 1971, GMS operates a network of more than 210 distribution centers across the United States. GMS’s extensive product offering of wallboard, suspended ceilings systems, or ceilings, and complementary interior construction products is designed to provide a comprehensive one-stop-shop for our core customer, the interior contractor who installs these products in commercial and residential buildings.
Use of Non-GAAP Financial Measures
GMS reports its financial results in accordance with GAAP. However, it presents Adjusted net income, Adjusted EBITDA, Adjusted EBITDA margin and base business growth, which are not recognized financial measures under GAAP. GMS believes that Adjusted net income, Adjusted EBITDA and Adjusted EBITDA margin assist investors and analysts in comparing its operating performance across reporting periods on a consistent basis by excluding items that the Company does not believe are indicative of its core operating performance. The Company’s management believes Adjusted net income, Adjusted EBITDA, Adjusted EBITDA margin and base business growth are helpful in highlighting trends in its operating results, while other measures can differ significantly depending on long-term strategic decisions regarding capital structure, the tax jurisdictions in which the Company operates and capital investments. In addition, the Company utilizes Adjusted EBITDA in certain calculations under its senior secured asset based revolving credit facility and its senior secured first lien term loan facility.
You are encouraged to evaluate each adjustment and the reasons GMS considers it appropriate for supplemental analysis. In addition, in evaluating Adjusted net income and Adjusted EBITDA, you should be aware that in the future, the Company may incur expenses similar to the adjustments in the presentation of Adjusted net income and Adjusted EBITDA. The Company’s presentation of Adjusted net income and Adjusted EBITDA should not be construed as an inference that its future results will be unaffected by unusual or non-recurring items. In addition, Adjusted net income and Adjusted EBITDA may not be comparable to similarly titled measures used by other companies in GMS’s industry or across different industries.
Forward-Looking Statements and Information:
This press release includes “forward-looking statements” within the meaning of the Private Securities Litigation Reform Act of 1995. You can generally identify forward-looking statements by the Company’s use of forward-looking terminology such as “anticipate,” “believe,” “continue,” “could,” “estimate,” “expect,” “intend,” “may,” “might,” “plan,” “potential,” “predict,” “seek,” or “should,” or the negative thereof or other variations thereon or comparable terminology. In particular, statements about the markets in which GMS operates, including the potential for growth in the commercial, residential and repair and remodeling, or R&R, markets, statements about its expectations, beliefs, plans, strategies, objectives, prospects, assumptions or future events or performance, statements related to net sales, gross profit, gross margins and capital expenditures, as well as non-GAAP financial measures such as Adjusted EBITDA, Adjusted net income and base business growth and statements regarding potential acquisitions and future greenfield locations, demand trends and future SG&A savings contained in this press release are forward-looking statements. The Company has based these forward-looking statements on its current expectations, assumptions, estimates and projections. While the Company believes these expectations, assumptions, estimates and projections are reasonable, such forward-looking statements are only predictions and involve known and unknown risks and uncertainties, many of which are beyond its control. Forward-looking statements involve risks and uncertainties, including, but not limited to, economic, competitive, governmental and technological factors outside of the Company’s control, that may cause its business, strategy or actual results to differ materially from the forward-looking statements. These risks and uncertainties may include, among other things: changes in the prices, supply, and/or demand for products which GMS distributes; general economic and business conditions in the United States; the activities of competitors; changes in significant operating expenses; changes in the availability of capital and interest rates; adverse weather patterns or conditions; acts of cyber intrusion; variations in the performance of the financial markets, including the credit markets; and other factors described in the “Risk Factors” section in the Company’s Annual Report on Form 10-K for the fiscal year ended April 30, 2017, and in its other periodic reports filed with the SEC. In addition, the statements in this release are made as of December 7, 2017. The Company undertakes no obligation to update any of the forward looking statements made herein, whether as a result of new information, future events, changes in expectation or otherwise. These forward-looking statements should not be relied upon as representing the Company’s views as of any date subsequent to December 7, 2017.
GMS Inc.
Condensed Consolidated Statements of Operations and Comprehensive Income (Unaudited)
Three and Six Months Ended October 31, 2017 and 2016
(in thousands, except per share data)
|
|
|
Three Months Ended |
|
Six Months Ended |
| ||||||||
|
|
|
October 31, |
|
October 31, |
| ||||||||
|
|
|
2017 |
|
2016 |
|
2017 |
|
2016 |
| ||||
|
Net sales |
|
$ |
648,004 |
|
$ |
591,846 |
|
$ |
1,290,161 |
|
$ |
1,141,646 |
|
|
Cost of sales (exclusive of depreciation and amortization shown separately below) |
|
435,744 |
|
398,622 |
|
872,797 |
|
769,837 |
| ||||
|
Gross profit |
|
212,260 |
|
193,224 |
|
417,364 |
|
371,809 |
| ||||
|
Operating expenses: |
|
|
|
|
|
|
|
|
| ||||
|
Selling, general and administrative |
|
159,898 |
|
149,798 |
|
315,970 |
|
284,856 |
| ||||
|
Depreciation and amortization |
|
16,713 |
|
17,368 |
|
33,058 |
|
33,163 |
| ||||
|
Total operating expenses |
|
176,611 |
|
167,166 |
|
349,028 |
|
318,019 |
| ||||
|
Operating income |
|
35,649 |
|
26,058 |
|
68,336 |
|
53,790 |
| ||||
|
Other (expense) income: |
|
|
|
|
|
|
|
|
| ||||
|
Interest expense |
|
(7,917 |
) |
(7,154 |
) |
(15,417 |
) |
(14,731 |
) | ||||
|
Write-off of debt discount and deferred financing fees |
|
— |
|
(1,466 |
) |
(74 |
) |
(6,892 |
) | ||||
|
Other income, net |
|
274 |
|
496 |
|
564 |
|
1,089 |
| ||||
|
Total other (expense), net |
|
(7,643 |
) |
(8,124 |
) |
(14,927 |
) |
(20,534 |
) | ||||
|
Income before taxes |
|
28,006 |
|
17,934 |
|
53,409 |
|
33,256 |
| ||||
|
Provision for income taxes |
|
9,983 |
|
710 |
|
20,043 |
|
6,869 |
| ||||
|
Net income |
|
$ |
18,023 |
|
$ |
17,224 |
|
$ |
33,366 |
|
$ |
26,387 |
|
|
Weighted average common shares outstanding: |
|
|
|
|
|
|
|
|
| ||||
|
Basic |
|
41,006 |
|
40,943 |
|
40,988 |
|
39,579 |
| ||||
|
Diluted |
|
42,146 |
|
41,320 |
|
42,137 |
|
39,956 |
| ||||
|
Net income per share: |
|
|
|
|
|
|
|
|
| ||||
|
Basic |
|
$ |
0.44 |
|
$ |
0.42 |
|
$ |
0.81 |
|
$ |
0.67 |
|
|
Diluted |
|
$ |
0.43 |
|
$ |
0.42 |
|
$ |
0.79 |
|
$ |
0.66 |
|
GMS Inc.
Condensed Consolidated Balance Sheets (Unaudited)
October 31, 2017 and April 30, 2017
(in thousands, except per share data)
|
|
|
October 31, |
|
April 30, |
| ||
|
|
|
2017 |
|
2017 |
| ||
|
Assets |
|
|
|
|
| ||
|
Current assets: |
|
|
|
|
| ||
|
Cash and cash equivalents |
|
$ |
19,781 |
|
$ |
14,561 |
|
|
Trade accounts and notes receivable, net of allowances of $11,581 and $9,851, respectively |
|
354,394 |
|
328,988 |
| ||
|
Inventories, net |
|
209,932 |
|
200,234 |
| ||
|
Prepaid expenses and other current assets |
|
15,258 |
|
11,403 |
| ||
|
Total current assets |
|
599,365 |
|
555,186 |
| ||
|
Property and equipment, net of accumulated depreciation of $77,856 and $71,409, respectively |
|
157,893 |
|
154,465 |
| ||
|
Goodwill |
|
426,288 |
|
423,644 |
| ||
|
Intangible assets, net |
|
239,658 |
|
252,293 |
| ||
|
Other assets |
|
7,523 |
|
7,677 |
| ||
|
Total assets |
|
$ |
1,430,727 |
|
$ |
1,393,265 |
|
|
Liabilities and Stockholders’ Equity |
|
|
|
|
| ||
|
Current liabilities: |
|
|
|
|
| ||
|
Accounts payable |
|
$ |
118,918 |
|
$ |
102,688 |
|
|
Accrued compensation and employee benefits |
|
39,418 |
|
58,393 |
| ||
|
Other accrued expenses and current liabilities |
|
42,316 |
|
37,891 |
| ||
|
Current portion of long-term debt |
|
27,786 |
|
11,530 |
| ||
|
Total current liabilities |
|
228,438 |
|
210,502 |
| ||
|
Non-current liabilities: |
|
|
|
|
| ||
|
Long-term debt, less current portion |
|
582,755 |
|
583,390 |
| ||
|
Deferred income taxes, net |
|
21,651 |
|
26,820 |
| ||
|
Other liabilities |
|
34,657 |
|
35,371 |
| ||
|
Liabilities to noncontrolling interest holders, less current portion |
|
15,543 |
|
22,576 |
| ||
|
Total liabilities |
|
883,044 |
|
878,659 |
| ||
|
Commitments and contingencies |
|
|
|
|
| ||
|
Stockholders’ equity: |
|
|
|
|
| ||
|
Common stock, par value $0.01 per share, 500,000 shares authorized; 41,031 and 40,971 shares issued as of October 31, 2017 and April 30, 2017, respectively |
|
410 |
|
410 |
| ||
|
Preferred stock, par value $0.01 per share, 50,000 shares authorized; 0 shares issued as of October 31, 2017 and April 30, 2017 |
|
— |
|
— |
| ||
|
Additional paid-in capital |
|
487,774 |
|
488,459 |
| ||
|
Retained earnings |
|
59,987 |
|
26,621 |
| ||
|
Accumulated other comprehensive loss |
|
(488 |
) |
(884 |
) | ||
|
Total stockholders’ equity |
|
547,683 |
|
514,606 |
| ||
|
Total liabilities and stockholders’ equity |
|
$ |
1,430,727 |
|
$ |
1,393,265 |
|
GMS Inc.
Condensed Consolidated Statements of Cash Flows (Unaudited)
Six Months Ended October 31, 2017 and 2016
(in thousands)
|
|
|
Six Months Ended |
| ||||
|
|
|
October 31, |
| ||||
|
|
|
2017 |
|
2016 |
| ||
|
Cash flows from operating activities: |
|
|
|
|
| ||
|
Net income |
|
$ |
33,366 |
|
$ |
26,387 |
|
|
Adjustments to reconcile net income to net cash provided by operating activities: |
|
|
|
|
| ||
|
Depreciation and amortization of property and equipment |
|
12,013 |
|
12,930 |
| ||
|
Write-off, accretion and amortization of debt discount and deferred financing fees |
|
1,412 |
|
8,264 |
| ||
|
Amortization of intangible assets |
|
21,045 |
|
20,233 |
| ||
|
Provision for losses on accounts and notes receivable |
|
873 |
|
(230 |
) | ||
|
Provision for obsolescence of inventory |
|
483 |
|
(85 |
) | ||
|
Equity-based compensation |
|
436 |
|
1,499 |
| ||
|
(Gain) on sale of assets |
|
(598 |
) |
(130 |
) | ||
|
Changes in assets and liabilities net of effects of acquisitions: |
|
|
|
|
| ||
|
Trade accounts and notes receivable |
|
(21,837 |
) |
(19,316 |
) | ||
|
Inventories |
|
(7,366 |
) |
(13,444 |
) | ||
|
Accounts payable |
|
14,590 |
|
606 |
| ||
|
Deferred income taxes |
|
(5,437 |
) |
(12,373 |
) | ||
|
Prepaid expenses and other assets |
|
(2,357 |
) |
(3,105 |
) | ||
|
Accrued compensation and employee benefits |
|
(16,352 |
) |
(13,783 |
) | ||
|
Accrued expenses and liabilities |
|
3,055 |
|
3,851 |
| ||
|
Liabilities to noncontrolling interest holders |
|
(2,129 |
) |
907 |
| ||
|
Income tax receivable / payable |
|
(1,834 |
) |
(11,520 |
) | ||
|
Cash provided by operating activities |
|
29,363 |
|
691 |
| ||
|
Cash flows from investing activities: |
|
|
|
|
| ||
|
Purchases of property and equipment |
|
(8,442 |
) |
(5,024 |
) | ||
|
Proceeds from sale of assets |
|
1,928 |
|
1,319 |
| ||
|
Acquisition of businesses, net of cash acquired |
|
(18,375 |
) |
(139,939 |
) | ||
|
Cash used in investing activities |
|
(24,889 |
) |
(143,644 |
) | ||
|
Cash flows from financing activities: |
|
|
|
|
| ||
|
Repayments on the revolving credit facility |
|
(443,920 |
) |
(635,732 |
) | ||
|
Borrowings from the revolving credit facility |
|
352,567 |
|
686,216 |
| ||
|
Payments of principal on long-term debt |
|
(2,888 |
) |
(2,178 |
) | ||
|
Principal repayments of capital lease obligations |
|
(2,936 |
) |
(2,492 |
) | ||
|
Proceeds from issuance of common stock in initial public offering, net of underwriting discounts |
|
— |
|
156,941 |
| ||
|
Repayment of term loan |
|
— |
|
(160,000 |
) | ||
|
Borrowings from term loan amendment |
|
577,616 |
|
481,225 |
| ||
|
Repayment of term loan amendment |
|
(477,616 |
) |
(381,225 |
) | ||
|
Debt issuance costs |
|
(636 |
) |
(2,487 |
) | ||
|
Payments for taxes related to net share settlement of equity awards |
|
(1,441 |
) |
— |
| ||
|
Cash provided by financing activities |
|
746 |
|
140,268 |
| ||
|
Increase (decrease) in cash and cash equivalents |
|
5,220 |
|
(2,685 |
) | ||
|
Cash and cash equivalents, beginning of period |
|
14,561 |
|
19,072 |
| ||
|
Cash and cash equivalents, end of period |
|
$ |
19,781 |
|
$ |
16,387 |
|
|
Supplemental cash flow disclosures: |
|
|
|
|
| ||
|
Cash paid for income taxes |
|
$ |
28,455 |
|
$ |
30,790 |
|
|
Cash paid for interest |
|
14,104 |
|
13,163 |
| ||
|
Supplemental schedule of noncash activities: |
|
|
|
|
| ||
|
Assets acquired under capital lease |
|
$ |
6,378 |
|
$ |
5,180 |
|
|
Issuance of installment notes associated with equity-based compensation liability awards |
|
11,898 |
|
5,353 |
| ||
GMS Inc.
Net Sales by Product Group
Three and Six Months Ended October 31, 2017 and 2016
(in thousands of dollars)
|
|
|
Three Months Ended |
|
Six Months Ended |
| ||||||||||||||||
|
|
|
October 31, |
|
% of |
|
October 31, |
|
% of |
|
October 31, |
|
% of |
|
October 31, |
|
% of |
| ||||
|
|
|
2017 |
|
Total |
|
2016 |
|
Total |
|
2017 |
|
Total |
|
2016 |
|
Total |
| ||||
|
|
|
|
|
|
|
|
|
|
|
|
|
|
|
|
|
|
| ||||
|
Wallboard |
|
$ |
288,498 |
|
44.5 |
% |
$ |
269,975 |
|
45.6 |
% |
$ |
573,155 |
|
44.4 |
% |
$ |
521,271 |
|
45.7 |
% |
|
Ceilings |
|
101,646 |
|
15.7 |
% |
85,400 |
|
14.4 |
% |
201,356 |
|
15.6 |
% |
171,749 |
|
15.0 |
% | ||||
|
Steel framing |
|
103,203 |
|
15.9 |
% |
96,075 |
|
16.2 |
% |
207,854 |
|
16.1 |
% |
180,417 |
|
15.8 |
% | ||||
|
Other products |
|
154,657 |
|
23.9 |
% |
140,396 |
|
23.7 |
% |
307,796 |
|
23.9 |
% |
268,209 |
|
23.5 |
% | ||||
|
Total net sales |
|
$ |
648,004 |
|
|
|
$ |
591,846 |
|
|
|
$ |
1,290,161 |
|
|
|
$ |
1,141,646 |
|
|
|
GMS Inc.
Reconciliation of Net Income to Adjusted EBITDA
Three and Six Months Ended October 31, 2017 and 2016
(in thousands)
|
|
|
Three Months Ended |
|
Six Months Ended |
| ||||||||
|
|
|
October 31, |
|
October 31, |
| ||||||||
|
|
|
2017 |
|
2016 |
|
2017 |
|
2016 |
| ||||
|
|
|
|
|
|
|
|
|
|
| ||||
|
Net income |
|
$ |
18,023 |
|
$ |
17,224 |
|
$ |
33,366 |
|
$ |
26,387 |
|
|
Interest expense |
|
7,917 |
|
7,154 |
|
15,417 |
|
14,731 |
| ||||
|
Write-off of debt discount and deferred financing fees |
|
— |
|
1,466 |
|
74 |
|
6,892 |
| ||||
|
Interest income |
|
(26 |
) |
(35 |
) |
(49 |
) |
(78 |
) | ||||
|
Income tax expense |
|
9,983 |
|
710 |
|
20,043 |
|
6,869 |
| ||||
|
Depreciation expense |
|
6,023 |
|
6,548 |
|
12,013 |
|
12,930 |
| ||||
|
Amortization expense |
|
10,690 |
|
10,820 |
|
21,045 |
|
20,233 |
| ||||
|
EBITDA |
|
$ |
52,610 |
|
$ |
43,887 |
|
$ |
101,909 |
|
$ |
87,964 |
|
|
Stock appreciation expense or (income)(a) |
|
642 |
|
(144 |
) |
1,232 |
|
(236 |
) | ||||
|
Redeemable noncontrolling interests(b) |
|
164 |
|
2,531 |
|
1,030 |
|
2,823 |
| ||||
|
Equity-based compensation(c) |
|
375 |
|
686 |
|
847 |
|
1,359 |
| ||||
|
Severance and other permitted costs(d) |
|
113 |
|
118 |
|
317 |
|
258 |
| ||||
|
Transaction costs (acquisitions and other)(e) |
|
88 |
|
1,827 |
|
246 |
|
2,481 |
| ||||
|
(Gain) loss on sale of assets |
|
(207 |
) |
68 |
|
(597 |
) |
(130 |
) | ||||
|
Management fee to related party(f) |
|
— |
|
— |
|
— |
|
188 |
| ||||
|
Effects of fair value adjustments to inventory(g) |
|
187 |
|
457 |
|
187 |
|
621 |
| ||||
|
Interest rate cap mark-to-market(h) |
|
238 |
|
89 |
|
434 |
|
132 |
| ||||
|
Secondary public offering costs(i) |
|
— |
|
— |
|
631 |
|
— |
| ||||
|
Debt transaction costs(j) |
|
35 |
|
— |
|
758 |
|
— |
| ||||
|
EBITDA add-backs |
|
1,635 |
|
5,632 |
|
5,085 |
|
7,496 |
| ||||
|
Adjusted EBITDA |
|
$ |
54,245 |
|
$ |
49,519 |
|
$ |
106,994 |
|
$ |
95,460 |
|
|
Adjusted EBITDA margin |
|
8.4 |
% |
8.4 |
% |
8.3 |
% |
8.4 |
% | ||||
(a) Represents non-cash compensation expenses (income) related to stock appreciation rights agreements. For additional details regarding stock appreciation rights, refer to “Management’s Discussion and Analysis of Financial Condition and Results of Operations—Critical Accounting Policies—Subsidiary Equity-Based Deferred Compensation Arrangements” included in our Annual Report on Form 10-K for the year ended April 30, 2017.
(b) Represents non-cash compensation expense related to changes in the redemption values of noncontrolling interests. For additional details regarding redeemable noncontrolling interests of our subsidiaries, refer to “Management’s Discussion and Analysis of Financial Condition and Results of Operations—Critical Accounting Policies—Subsidiary Equity-Based Deferred Compensation Arrangements” included in our Annual Report on Form 10-K for the year ended April 30, 2017.
(c) Represents non-cash equity-based compensation expense related to the issuance of stock options.
(d) Represents severance expenses and other costs permitted in calculations under the ABL Facility and the First Lien Facility.
(e) Represents one-time costs related to our IPO and acquisitions (other than the Acquisition) paid to third party advisors.
(f) Represents management fees paid by us to AEA. Following our IPO, AEA no longer receives management fees from us.
(g) Represents the non-cash cost of sales impact of purchase accounting adjustments to increase inventory to its estimated fair value.
(h) Represents the mark-to-market adjustments for the interest rate cap.
(i) Represents one-time costs related to our secondary offering paid to third party advisors.
(j) Represents expenses paid to third party advisors related to debt refinancing activities.
GMS Inc.
Reconciliation of Income Before Taxes to Adjusted Net Income
Three and Six Months Ended October 31, 2017 and 2016
(in thousands, except per share data)
|
|
|
Three Months Ended |
|
Six Months Ended |
| ||||||||
|
|
|
October 31, |
|
October 31, |
| ||||||||
|
|
|
2017 |
|
2016 |
|
2017 |
|
2016 |
| ||||
|
Income before taxes |
|
$ |
28,006 |
|
$ |
17,934 |
|
$ |
53,409 |
|
$ |
33,256 |
|
|
EBITDA add-backs |
|
1,635 |
|
5,632 |
|
5,085 |
|
7,496 |
| ||||
|
Write-off of debt discount and deferred financing fees |
|
— |
|
1,466 |
|
74 |
|
6,892 |
| ||||
|
Purchase accounting depreciation and amortization (1) |
|
5,521 |
|
7,650 |
|
10,545 |
|
15,649 |
| ||||
|
Adjusted pre-tax income |
|
35,162 |
|
32,682 |
|
69,113 |
|
63,293 |
| ||||
|
Adjusted income tax expense |
|
13,537 |
|
12,583 |
|
26,609 |
|
24,368 |
| ||||
|
Adjusted net income |
|
$ |
21,625 |
|
$ |
20,099 |
|
$ |
42,504 |
|
$ |
38,925 |
|
|
Normalized tax rate (2) |
|
38.5 |
% |
38.5 |
% |
38.5 |
% |
38.5 |
% | ||||
|
|
|
|
|
|
|
|
|
|
| ||||
|
Weighted average shares outstanding: |
|
|
|
|
|
|
|
|
| ||||
|
Basic |
|
41,006 |
|
40,943 |
|
40,988 |
|
39,579 |
| ||||
|
Diluted |
|
42,146 |
|
41,320 |
|
42,137 |
|
39,956 |
| ||||
|
Adjusted net income per share: |
|
|
|
|
|
|
|
|
| ||||
|
Basic |
|
$ |
0.53 |
|
$ |
0.49 |
|
$ |
1.04 |
|
$ |
0.98 |
|
|
Diluted |
|
$ |
0.51 |
|
$ |
0.49 |
|
$ |
1.01 |
|
$ |
0.97 |
|
(1) Depreciation and amortization from the increase in value of certain long-term assets associated with the April 1, 2014 acquisition of the predecessor company. Full year projected amounts are $21.8 million and $15.6 million for FY18 and FY19, respectively.
(2) Normalized tax rate determined based on expected taxes, on a cash basis, due for the FY17 tax return, which will be filed in the third quarter of FY18.
Contact Information:
Investor Relations:
678-353-2883
Media Relations:
770-723-3378
Safe Harbor and Basis of Presentation Forward-Looking Statement Safe Harbor - This presentation includes "forward-looking statements" within the meaning of the Private Securities Litigation Reform Act of 1995. All of these forward-looking statements are based on estimates and assumptions made by our management that, although believed by us to be reasonable, are inherently uncertain. Examples of forward-looking statements include those related to net sales, gross profit, gross margins, capital expenditures and market share growth, as well as non-GAAP financial measures such as Adjusted EBITDA, the ratio of debt-to-Adjusted EBITDA, adjusted net income and base business sales, including any management expectations or outlook for fiscal 2018 and beyond. In addition, statements regarding potential acquisitions and future greenfield locations are forward-looking statements, as well as statements regarding the markets in which the Company operates and the potential for growth in the commercial, residential and repair and remodeling, or R&R, markets. Forward-looking statements involve risks and uncertainties, including, but not limited to, economic, competitive, governmental and technological factors outside of our control, that may cause our business, strategy or actual results to differ materially from the forward-looking statements. These risks and uncertainties may include, among other things: changes in the prices, margin, supply, and/or demand for products which we distribute; general economic and business conditions in the United States; the activities of competitors; changes in significant operating expenses; changes in the availability of capital and interest rates; adverse weather patterns or conditions; acts of cyber intrusion; variations in the performance of the financial markets, including the credit markets; and other factors described in the "Risk Factors" section in our Annual Report on Form 10-K for the fiscal year ended April 30, 2017, and in our other periodic reports filed with the SEC. In addition, the statements in this presentation are made as of December 7, 2017. We undertake no obligation to update any of the forward looking statements made herein, whether as a result of new information, future events, changes in expectation or otherwise. These forward-looking statements should not be relied upon as representing our views as of any date subsequent to December 7, 2017. Use of Non-GAAP and Adjusted Financial Information - To supplement GAAP financial information, we use adjusted measures of operating results which are non-GAAP measures. This non-GAAP adjusted financial information is provided as additional information for investors. These adjusted results exclude certain costs, expenses, gains and losses, and we believe their exclusion can enhance an overall understanding of our past financial performance and also our prospects for the future. These adjustments to our GAAP results are made with the intent of providing both management and investors a more complete understanding of our operating performance by excluding non-recurring, infrequent or other non-cash charges that are not believed to be material to the ongoing performance of our business. The presentation of this additional information is not meant to be considered in isolation or as a substitute for GAAP measures of net income, diluted earnings per share or net cash provided by (used in) operating activities prepared in accordance with generally accepted accounting principles in the United States. 2
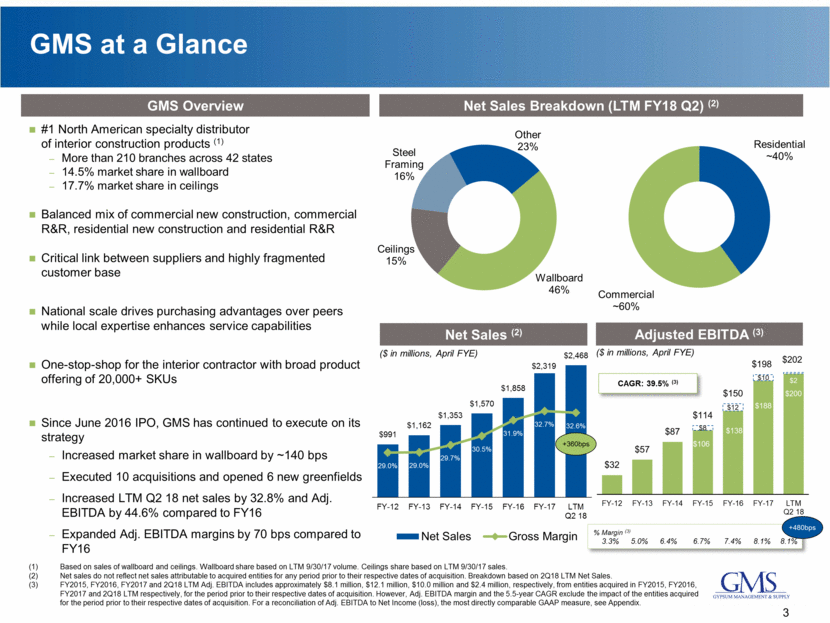
GMS at a Glance GMS Overview Net Sales Breakdown (LTM FY18 Q2) (2) Wallboard 46% Ceilings 15% Steel Framing 16% Other 23% CAGR: 39.5% (3) ($ in millions, April FYE) #1 North American specialty distributor of interior construction products (1) More than 210 branches across 42 states 14.5% market share in wallboard 17.7% market share in ceilings Balanced mix of commercial new construction, commercial R&R, residential new construction and residential R&R Critical link between suppliers and highly fragmented customer base National scale drives purchasing advantages over peers while local expertise enhances service capabilities One-stop-shop for the interior contractor with broad product offering of 20,000+ SKUs Since June 2016 IPO, GMS has continued to execute on its strategy Increased market share in wallboard by ~140 bps Executed 10 acquisitions and opened 6 new greenfields Increased LTM Q2 18 net sales by 32.8% and Adj. EBITDA by 44.6% compared to FY16 Expanded Adj. EBITDA margins by 70 bps compared to FY16 Based on sales of wallboard and ceilings. Wallboard share based on LTM 9/30/17 volume. Ceilings share based on LTM 9/30/17 sales. Net sales do not reflect net sales attributable to acquired entities for any period prior to their respective dates of acquisition. Breakdown based on 2Q18 LTM Net Sales. FY2015, FY2016, FY2017 and 2Q18 LTM Adj. EBITDA includes approximately $8.1 million, $12.1 million, $10.0 million and $2.4 million, respectively, from entities acquired in FY2015, FY2016, FY2017 and 2Q18 LTM respectively, for the period prior to their respective dates of acquisition. However, Adj. EBITDA margin and the 5.5-year CAGR exclude the impact of the entities acquired for the period prior to their respective dates of acquisition. For a reconciliation of Adj. EBITDA to Net Income (loss), the most directly comparable GAAP measure, see Appendix. Adjusted EBITDA (3) 3 Net Sales (2) ($ in millions, April FYE) % Margin (3) 3.3% 5.0% 6.4% 6.7% 7.4% 8.1% 8.1% +480bps +360bps Residential ~40% Commercial ~60% $106 $138 $188 $200 $8 $12 $10 $2 $32 $57 $87 $114 $150 $198 $202 FY-12 FY-13 FY-14 FY-15 FY-16 FY-17 LTM Q2 18
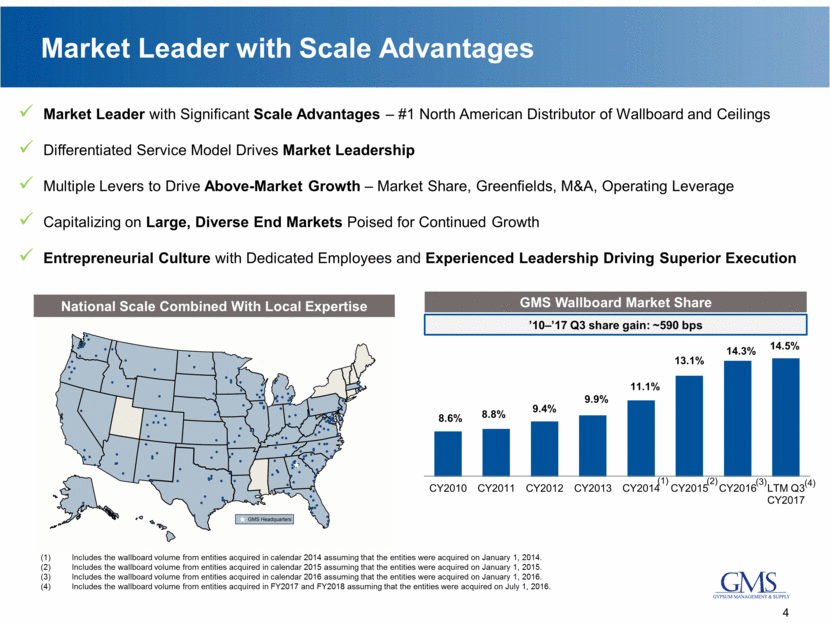
Includes the wallboard volume from entities acquired in calendar 2014 assuming that the entities were acquired on January 1, 2014. Includes the wallboard volume from entities acquired in calendar 2015 assuming that the entities were acquired on January 1, 2015. Includes the wallboard volume from entities acquired in calendar 2016 assuming that the entities were acquired on January 1, 2016. Includes the wallboard volume from entities acquired in FY2017 and FY2018 assuming that the entities were acquired on July 1, 2016. Market Leader with Scale Advantages National Scale Combined With Local Expertise 4 Market Leader with Significant Scale Advantages – #1 North American Distributor of Wallboard and Ceilings Differentiated Service Model Drives Market Leadership Multiple Levers to Drive Above-Market Growth – Market Share, Greenfields, M&A, Operating Leverage Capitalizing on Large, Diverse End Markets Poised for Continued Growth Entrepreneurial Culture with Dedicated Employees and Experienced Leadership Driving Superior Execution GMS Wallboard Market Share ’10–’17 Q3 share gain: ~590 bps (1) (2) (3) (4) 8.6% 8.8% 9.4% 9.9% 11.1% 13.1% 14.3% 14.5% CY2010 CY2011 CY2012 CY2013 CY2014 CY2015 CY2016 LTM Q3 CY2017
Q2 2018 Highlights Above-Market Growth Attractive Capital Structure Accretive Acquisitions Continued Profit Improvement Net sales increased 9.5% to a record $648.0 million Base business net sales up 5.1% Wallboard unit volume grew 4.3% to a record 929 million square feet Net income increased 4.6% to $18.0 million, or EPS of $0.43 per diluted share Gross profit increased 9.9% to a record $212.3 million Adjusted EBITDA grew 9.5% to a record $54.2 million In Q2 2018, acquired ASI Building Products, LLC in Michigan and Washington Builders Supply, Inc. in Pennsylvania Subsequent to Q2, acquired Southwest Building Materials, Ltd. in Texas Completed 10 acquisitions representing 20 branches since June 2016 IPO (26 acquisitions representing 59 branches since FY2013) 2.9x leverage (net debt(1) / LTM PF Adjusted EBITDA(2)) as of October 31, 2017 Standard & Poor’s upgraded GMS corporate debt in November to BB- from B+ No major maturities until 2023 5 Includes unamortized discount and deferred financing costs. Numbers may not add up due to rounding. PF Adjusted EBITDA includes the earnings of acquired entities from the beginning of the periods presented to the date of such acquisitions, as well as certain purchasing synergies and cost savings, as defined in and permitted by the ABL Facility and the First Lien Facility, and which is used in the calculation of certain baskets to covenants in the Company’s debt agreements, including in connection with the Company’s ability to incur additional indebtedness. FY2016, FY2017 and FY18 Q2 LTM PF Adj. EBITDA includes approximately $12.1 million, $9.5 million and $2.4 million, respectively, from entities acquired in FY2016, FY2017 and FY18 Q2 LTM, respectively, for the period prior to their respective dates of acquisition. For a reconciliation of PF Adjusted EBITDA to net income, the most directly comparable GAAP metric, see Appendix.

Attractive Acquirer with Significant Consolidation Opportunity Acquisition Strategy Recent GMS Acquisitions Acquisition Rationale Industry Structure: Large, highly fragmented industry comprised of hundreds of competitors Similar business operations enable efficient integration Limited number of scaled players Acquisition Strategy: Criteria: leading capabilities in targeted new markets / increase existing network density / enhance strategic capabilities Fit GMS culture and platform Deliver scale benefits Attractive purchase price multiples Dedicated M&A team Pipeline: Significant portion of the market is comprised of local, independent competitors representing significant opportunity Maintain active dialogue with many potential targets One branch with LTM Sales of $46.8 million Strategic entrance into the greater Philadelphia metropolitan area Founded in 1994 Sept 1, 2016 Aug 29, 2016 Three branches with LTM Sales of $52.9 million Strategic entrance into south Florida Founded in 2008 and headquartered in Pompano, FL Oct 3, 2016 Three branches with LTM Sales of $30.0 million Strategic entrance into south central Ohio Founded in 1996 and headquartered in Dayton, OH Quarter FY17 Q2 FY17 Q2 FY17 Q2 FY17 Q2 Oct 31, 2016 Three branches with LTM Sales of $27.0 million Nice geographic fit with FY16 Q3 MI acquisition Founded in 1965 and headquartered in Southfield, MI FY17 Q3 One branch with LTM sales of $12.3 million Strategic entrance into northeastern Indiana Founded in 1984 Dec 5, 2016 FY17 Q4 One branch with LTM sales of $11.7 million Expands existing presence in Hawaii Founded in 1974 Feb 1, 2017 6 FY18 Q2 Aug 1, 2017 Three branches with LTM sales of $24.5 million Expands existing presence in Michigan Founded in 1988 FY18 Q2 Oct 2, 2017 Expansion of Ohio Valley brand Expands existing presence in Western Pennsylvania Founded in 1988 Expands Cowtown brand in Northwest Texas Founded in 1984 FY18 Q3 Dec 4, 2017
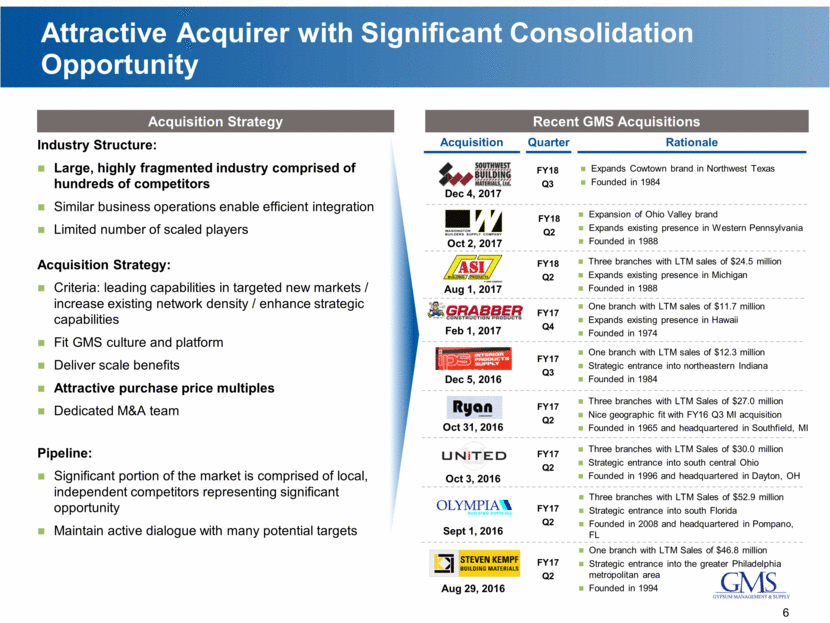
Profitable Sales Expansion in Fiscal Q2 2018 Gross Profit ($ mm) Fiscal Q2 2018 Gross Profit & Margin Adj. EBITDA ($ mm) Fiscal Q2 2018 Adjusted EBITDA (2) When calculating our “base business” results, we exclude any branches that were acquired in the current fiscal year, prior fiscal year and three months prior to the start of the prior fiscal year. For a reconciliation of Adj. EBITDA to Net Income (loss), the most directly comparable GAAP metric, see Appendix. Margin (2): 8.4% 8.4% 5.1% organic sales growth, led by ceilings (+12.9%) and other products (+6.1%) Gross margin improved 20 bps from prior year and 90 bps on a sequential basis Adjusted EBITDA grew 9.5% to $54.2 million reflecting stronger sales activity and improved gross margins Adjusted EBITDA margins were flat with prior year and improved 20 bps on a sequential basis Commentary +9.5% YOY Fiscal Q2 2018 Performance 7 $49.5 $54.2 - 10.0 20.0 30.0 40.0 50.0 60.0 Fiscal Q2 2017 Fiscal Q2 2018 ($ in millions) Fiscal Q2 YOY Base FY17 FY18 Growth Business (1) WB Volume (MSF) 891 929 4.3% 0.7% WB Price ($ / MSF) 303 $ 311 $ 2.4% Net Sales Wallboard 270.0 $ 288.5 $ 6.9% 3.0% Ceilings 85.4 101.6 19.0% 12.9% Steel Framing 96.1 103.2 7.4% 2.3% Other Products 140.4 154.7 10.2% 6.1% Total Net Sales 591.8 $ 648.0 $ 9.5% 5.1%
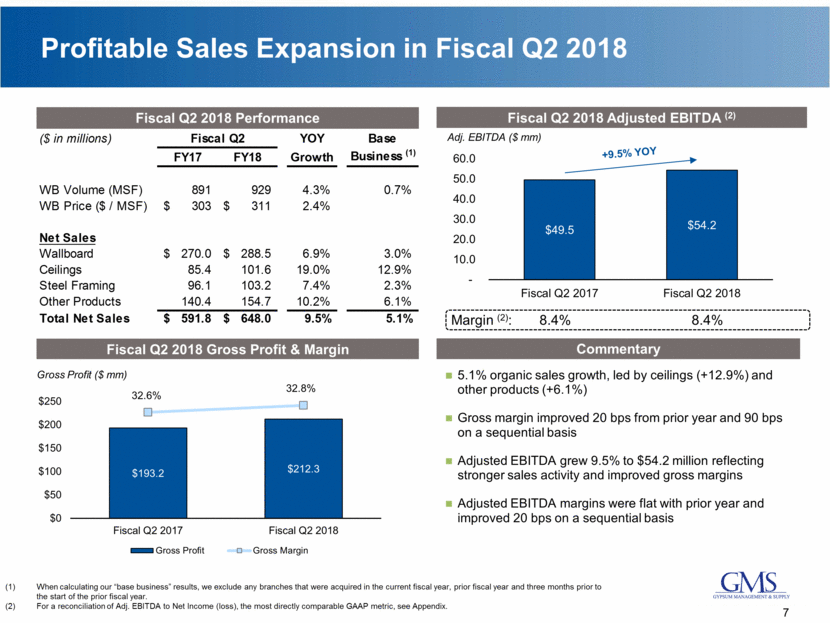
Attractive Capital Structure Leverage of 2.9x Net Debt / LTM Pro Forma Adj. EBITDA as of 10/31/17, down from 3.4x Net Debt / LTM Pro Forma Adj. EBITDA as of 10/31/16 Substantial liquidity, with $19.8 million of cash and an additional $322 million undrawn on the ABL facility, as of 10/31/17 Moody’s and Standard & Poor’s current rating of B1/BB- (Moody’s upgraded GMS to B1 in July of 2017, Standard & Poor’s upgraded GMS to BB- in November of 2017) In Q1 2018, expanded First Lien Term Loan by $100 million, extended maturity to 2023, reduced the rate by 50 bps and used the net proceeds to pay down ABL facility Commentary Leverage Summary Net Debt / PF Adjusted EBITDA Includes unamortized discount and deferred financing costs. Numbers may not add up due to rounding. PF Adjusted EBITDA includes the earnings of acquired entities from the beginning of the periods presented to the date of such acquisitions, as well as certain purchasing synergies and cost savings, as defined in and permitted by the ABL Facility and the First Lien Facility, and which is used in the calculation of certain baskets to covenants in the Company’s debt agreements, including in connection with the Company’s ability to incur additional indebtedness. FY2016, FY2017 and FY18 Q2 LTM PF Adj. EBITDA includes approximately $12.1 million, $9.5 million and $2.4 million, respectively, from entities acquired in FY2016, FY2017 and FY18 Q2 LTM, respectively, for the period prior to their respective dates of acquisition. For a reconciliation of PF Adjusted EBITDA to net income, the most directly comparable GAAP metric, see Appendix. 8 4.9x 4.3x 2.9x 2.9x 4/30/15 4/30/16 4/30/17 LTM 10/31/17 ($ mm) 4/30/15 4/30/16 4/30/17 10/31/17 FYE FYE FYE LTM Cash and cash equivalents $12 $19 $15 $20 Asset-Based Revolver 17 102 103 12 First Lien Term Loan 386 382 478 575 Second Lien Term Loan 160 160 - - Capital Lease and Other 10 14 14 24 Total Debt $573 $658 $595 $611 PF Adj. EBITDA (1) $114 $150 $198 $202 Total Debt / PF Adj. EBITDA 5.0x 4.4x 3.0x 3.0x Net Debt / PF Adj. EBITDA 4.9x 4.3x 2.9x 2.9x
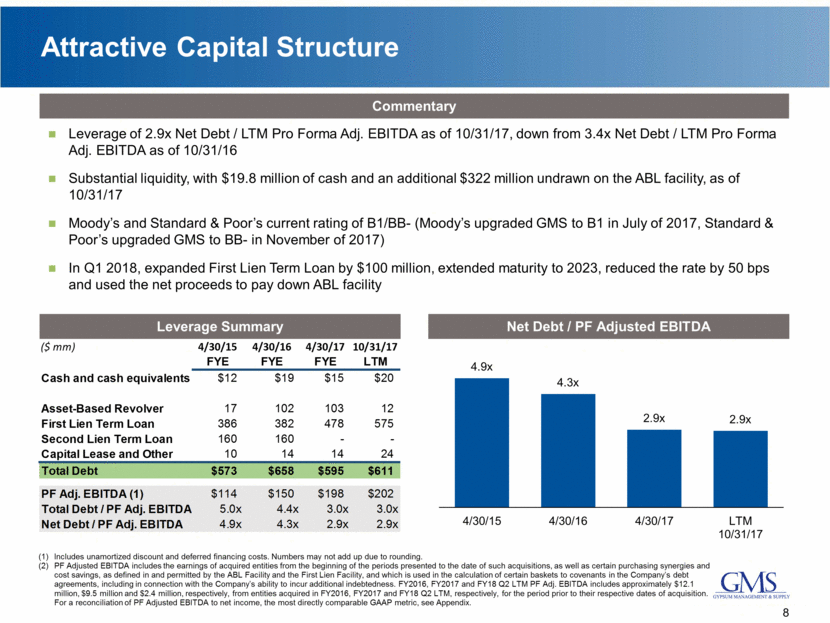
Leading Specialty Distributor Poised for Continued Growth Market Leader with Significant Scale Advantages – #1 North American Distributor of Wallboard and Ceilings Differentiated Service Model Drives Market Leadership Multiple Levers to Drive Above-Market Growth – Market Share, Greenfields, M&A, Operating Leverage Capitalizing on Large, Diverse End Markets Poised for Continued Growth Entrepreneurial Culture with Dedicated Employees and Experienced Leadership Driving Superior Execution 9
5 :4 2 2 / 4 1 0 /2 /6 2 / t n e m Docu d ve Unsa Appendix
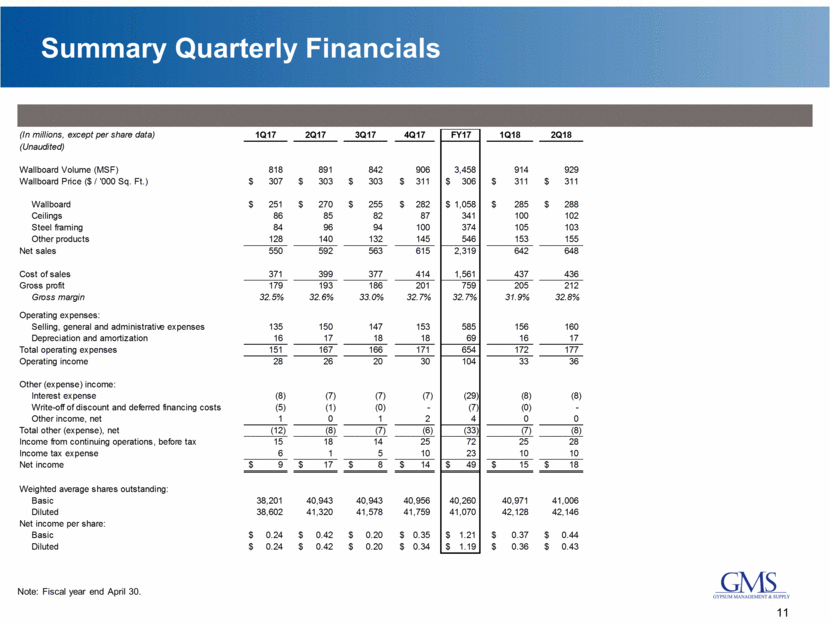
Summary Quarterly Financials Note: Fiscal year end April 30. 11 (In millions, except per share data) 1Q17 2Q17 3Q17 4Q17 FY17 1Q18 2Q18 (Unaudited) Wallboard Volume (MSF) 818 891 842 906 3,458 914 929 Wallboard Price ($ / '000 Sq. Ft.) 307 $ 303 $ 303 $ 311 $ 306 $ 311 $ 311 $ Wallboard 251 $ 270 $ 255 $ 282 $ 1,058 $ 285 $ 288 $ Ceilings 86 85 82 87 341 100 102 Steel framing 84 96 94 100 374 105 103 Other products 128 140 132 145 546 153 155 Net sales 550 592 563 615 2,319 642 648 Cost of sales 371 399 377 414 1,561 437 436 Gross profit 179 193 186 201 759 205 212 Gross margin 32.5% 32.6% 33.0% 32.7% 32.7% 31.9% 32.8% Operating expenses: Selling, general and administrative expenses 135 150 147 153 585 156 160 Depreciation and amortization 16 17 18 18 69 16 17 Total operating expenses 151 167 166 171 654 172 177 Operating income 28 26 20 30 104 33 36 Other (expense) income: Interest expense (8) (7) (7) (7) (29) (8) (8) Write-off of discount and deferred financing costs (5) (1) (0) - (7) (0) - Other income, net 1 0 1 2 4 0 0 Total other (expense), net (12) (8) (7) (6) (33) (7) (8) Income from continuing operations, before tax 15 18 14 25 72 25 28 Income tax expense 6 1 5 10 23 10 10 Net income 9 $ 17 $ 8 $ 14 $ 49 $ 15 $ 18 $ Weighted average shares outstanding: Basic 38,201 40,943 40,943 40,956 40,260 40,971 41,006 Diluted 38,602 41,320 41,578 41,759 41,070 42,128 42,146 Net income per share: Basic 0.24 $ 0.42 $ 0.20 $ 0.35 $ 1.21 $ 0.37 $ 0.44 $ Diluted 0.24 $ 0.42 $ 0.20 $ 0.34 $ 1.19 $ 0.36 $ 0.43 $
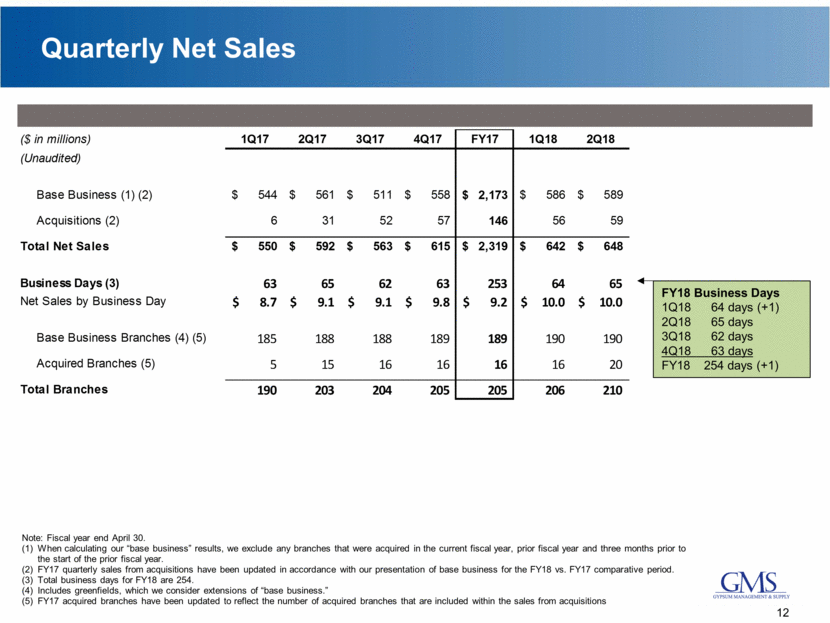
Quarterly Net Sales Note: Fiscal year end April 30. When calculating our “base business” results, we exclude any branches that were acquired in the current fiscal year, prior fiscal year and three months prior to the start of the prior fiscal year. FY17 quarterly sales from acquisitions have been updated in accordance with our presentation of base business for the FY18 vs. FY17 comparative period. Total business days for FY18 are 254. Includes greenfields, which we consider extensions of “base business.” FY17 acquired branches have been updated to reflect the number of acquired branches that are included within the sales from acquisitions FY18 Business Days 1Q18 64 days (+1) 2Q18 65 days 3Q18 62 days 4Q18 63 days FY18 254 days (+1) 12 ($ in millions) 1Q17 2Q17 3Q17 4Q17 FY17 1Q18 2Q18 (Unaudited) Base Business (1) (2) 544 $ 561 $ 511 $ 558 $ 2,173 $ 586 $ 589 $ Acquisitions (2) 6 31 52 57 146 56 59 Total Net Sales 550 $ 592 $ 563 $ 615 $ 2,319 $ 642 $ 648 $ Business Days (3) 63 65 62 63 253 64 65 Net Sales by Business Day 8.7 $ 9.1 $ 9.1 $ 9.8 $ 9.2 $ 10.0 $ 10.0 $ Base Business Branches (4) (5) 185 188 188 189 189 190 190 Acquired Branches (5) 5 15 16 16 16 16 20 Total Branches 190 203 204 205 205 206 210
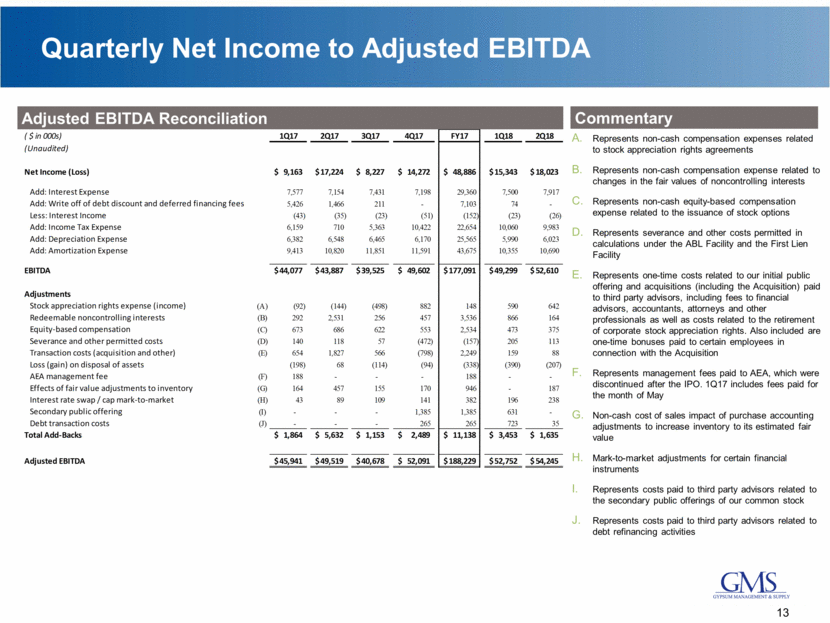
Quarterly Net Income to Adjusted EBITDA Adjusted EBITDA Reconciliation Commentary Represents non-cash compensation expenses related to stock appreciation rights agreements Represents non-cash compensation expense related to changes in the fair values of noncontrolling interests Represents non-cash equity-based compensation expense related to the issuance of stock options Represents severance and other costs permitted in calculations under the ABL Facility and the First Lien Facility Represents one-time costs related to our initial public offering and acquisitions (including the Acquisition) paid to third party advisors, including fees to financial advisors, accountants, attorneys and other professionals as well as costs related to the retirement of corporate stock appreciation rights. Also included are one-time bonuses paid to certain employees in connection with the Acquisition Represents management fees paid to AEA, which were discontinued after the IPO. 1Q17 includes fees paid for the month of May Non-cash cost of sales impact of purchase accounting adjustments to increase inventory to its estimated fair value Mark-to-market adjustments for certain financial instruments Represents costs paid to third party advisors related to the secondary public offerings of our common stock Represents costs paid to third party advisors related to debt refinancing activities 13 ( $ in 000s) 1Q17 2Q17 3Q17 4Q17 FY17 1Q18 2Q18 (Unaudited) Net Income (Loss) 9,163 $ 17,224 $ 8,227 $ 14,272 $ 48,886 $ 15,343 $ 18,023 $ Add: Interest Expense 7,577 7,154 7,431 7,198 29,360 7,500 7,917 Add: Write off of debt discount and deferred financing fees 5,426 1,466 211 - 7,103 74 - Less: Interest Income (43) (35) (23) (51) (152) (23) (26) Add: Income Tax Expense 6,159 710 5,363 10,422 22,654 10,060 9,983 Add: Depreciation Expense 6,382 6,548 6,465 6,170 25,565 5,990 6,023 Add: Amortization Expense 9,413 10,820 11,851 11,591 43,675 10,355 10,690 EBITDA 44,077 $ 43,887 $ 39,525 $ 49,602 $ 177,091 $ 49,299 $ 52,610 $ Adjustments Stock appreciation rights expense (income) (A) (92) (144) (498) 882 148 590 642 Redeemable noncontrolling interests (B) 292 2,531 256 457 3,536 866 164 Equity-based compensation (C) 673 686 622 553 2,534 473 375 Severance and other permitted costs (D) 140 118 57 (472) (157) 205 113 Transaction costs (acquisition and other) (E) 654 1,827 566 (798) 2,249 159 88 Loss (gain) on disposal of assets (198) 68 (114) (94) (338) (390) (207) AEA management fee (F) 188 - - - 188 - - Effects of fair value adjustments to inventory (G) 164 457 155 170 946 - 187 Interest rate swap / cap mark-to-market (H) 43 89 109 141 382 196 238 Secondary public offering (I) - - - 1,385 1,385 631 - Debt transaction costs (J) - - - 265 265 723 35 Total Add-Backs 1,864 $ 5,632 $ 1,153 $ 2,489 $ 11,138 $ 3,453 $ 1,635 $ Adjusted EBITDA 45,941 $ 49,519 $ 40,678 $ 52,091 $ 188,229 $ 52,752 $ 54,245 $
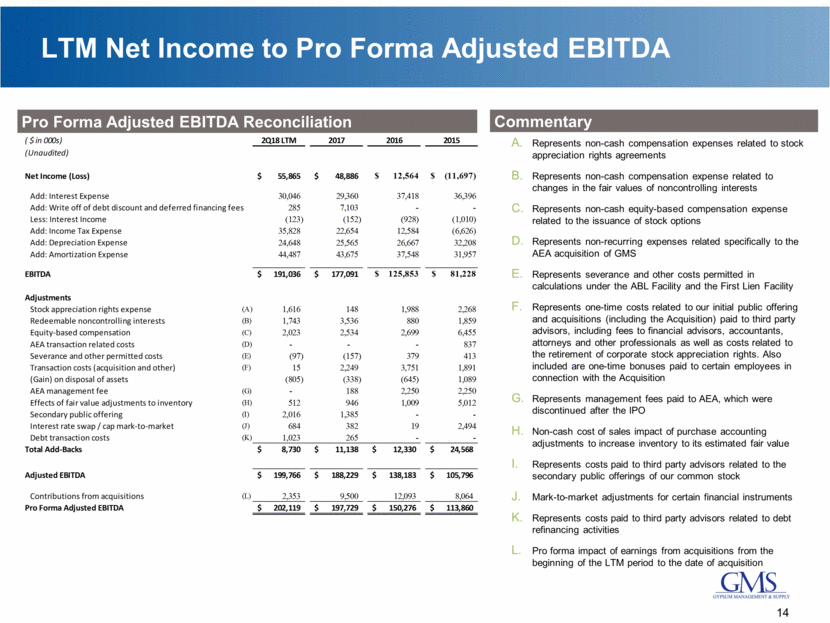
LTM Net Income to Pro Forma Adjusted EBITDA Pro Forma Adjusted EBITDA Reconciliation Commentary 14 Represents non-cash compensation expenses related to stock appreciation rights agreements Represents non-cash compensation expense related to changes in the fair values of noncontrolling interests Represents non-cash equity-based compensation expense related to the issuance of stock options Represents non-recurring expenses related specifically to the AEA acquisition of GMS Represents severance and other costs permitted in calculations under the ABL Facility and the First Lien Facility Represents one-time costs related to our initial public offering and acquisitions (including the Acquisition) paid to third party advisors, including fees to financial advisors, accountants, attorneys and other professionals as well as costs related to the retirement of corporate stock appreciation rights. Also included are one-time bonuses paid to certain employees in connection with the Acquisition Represents management fees paid to AEA, which were discontinued after the IPO Non-cash cost of sales impact of purchase accounting adjustments to increase inventory to its estimated fair value Represents costs paid to third party advisors related to the secondary public offerings of our common stock Mark-to-market adjustments for certain financial instruments Represents costs paid to third party advisors related to debt refinancing activities Pro forma impact of earnings from acquisitions from the beginning of the LTM period to the date of acquisition ( $ in 000s) 2Q18 LTM 2017 2016 2015 (Unaudited) Net Income (Loss) 55,865 $ 48,886 $ $ 12,564 $ (11,697) Add: Interest Expense 30,046 29,360 37,418 36,396 Add: Write off of debt discount and deferred financing fees 285 7,103 - - Less: Interest Income (123) (152) (928) (1,010) Add: Income Tax Expense 35,828 22,654 12,584 (6,626) Add: Depreciation Expense 24,648 25,565 26,667 32,208 Add: Amortization Expense 44,487 43,675 37,548 31,957 EBITDA 191,036 $ 177,091 $ $ 125,853 $ 81,228 Adjustments Stock appreciation rights expense (A) 1,616 148 1,988 2,268 Redeemable noncontrolling interests (B) 1,743 3,536 880 1,859 Equity-based compensation (C) 2,023 2,534 2,699 6,455 AEA transaction related costs (D) - - - 837 Severance and other permitted costs (E) (97) (157) 379 413 Transaction costs (acquisition and other) (F) 15 2,249 3,751 1,891 (Gain) on disposal of assets (805) (338) (645) 1,089 AEA management fee (G) - 188 2,250 2,250 Effects of fair value adjustments to inventory (H) 512 946 1,009 5,012 Secondary public offering (I) 2,016 1,385 - - Interest rate swap / cap mark-to-market (J) 684 382 19 2,494 Debt transaction costs (K) 1,023 265 - - Total Add-Backs 8,730 $ 11,138 $ 12,330 $ 24,568 $ Adjusted EBITDA 199,766 $ 188,229 $ 138,183 $ 105,796 $ Contributions from acquisitions (L) 2,353 9,500 12,093 8,064 Pro Forma Adjusted EBITDA 202,119 $ 197,729 $ 150,276 $ 113,860 $
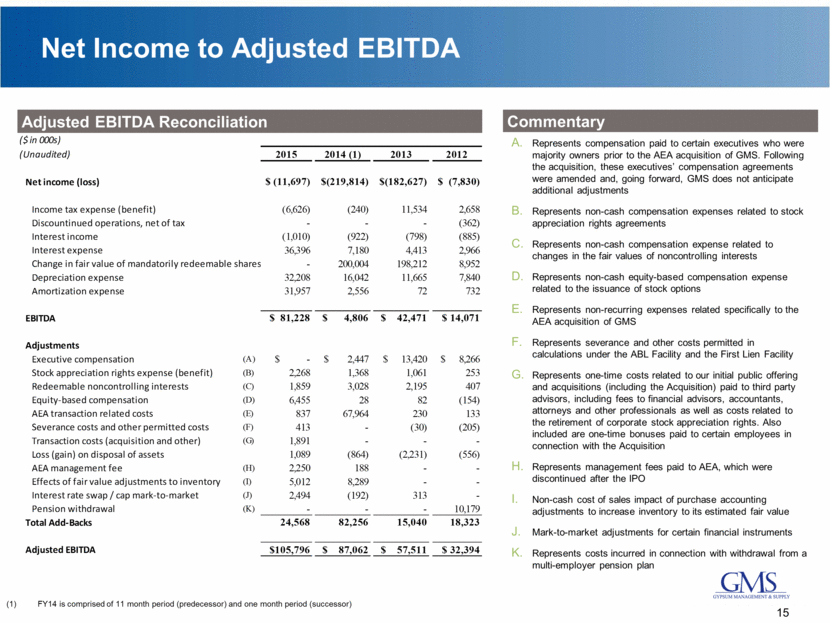
Net Income to Adjusted EBITDA Adjusted EBITDA Reconciliation Commentary Represents compensation paid to certain executives who were majority owners prior to the AEA acquisition of GMS. Following the acquisition, these executives’ compensation agreements were amended and, going forward, GMS does not anticipate additional adjustments Represents non-cash compensation expenses related to stock appreciation rights agreements Represents non-cash compensation expense related to changes in the fair values of noncontrolling interests Represents non-cash equity-based compensation expense related to the issuance of stock options Represents non-recurring expenses related specifically to the AEA acquisition of GMS Represents severance and other costs permitted in calculations under the ABL Facility and the First Lien Facility Represents one-time costs related to our initial public offering and acquisitions (including the Acquisition) paid to third party advisors, including fees to financial advisors, accountants, attorneys and other professionals as well as costs related to the retirement of corporate stock appreciation rights. Also included are one-time bonuses paid to certain employees in connection with the Acquisition Represents management fees paid to AEA, which were discontinued after the IPO Non-cash cost of sales impact of purchase accounting adjustments to increase inventory to its estimated fair value Mark-to-market adjustments for certain financial instruments Represents costs incurred in connection with withdrawal from a multi-employer pension plan 15 FY14 is comprised of 11 month period (predecessor) and one month period (successor) ($ in 000s) (Unaudited) 2015 2014 (1) 2013 2012 Net income (loss) $ (11,697) $(219,814) $(182,627) $ (7,830) Income tax expense (benefit) (6,626) (240) 11,534 2,658 Discountinued operations, net of tax - - - (362) Interest income (1,010) (922) (798) (885) Interest expense 36,396 7,180 4,413 2,966 Change in fair value of mandatorily redeemable shares - 200,004 198,212 8,952 Depreciation expense 32,208 16,042 11,665 7,840 Amortization expense 31,957 2,556 72 732 EBITDA $ 81,228 $ 4,806 $ 42,471 $ 14,071 Adjustments Executive compensation (A) $ - $ 2,447 $ 13,420 $ 8,266 Stock appreciation rights expense (benefit) (B) 2,268 1,368 1,061 253 Redeemable noncontrolling interests (C) 1,859 3,028 2,195 407 Equity-based compensation (D) 6,455 28 82 (154) AEA transaction related costs (E) 837 67,964 230 133 Severance costs and other permitted costs (F) 413 - (30) (205) Transaction costs (acquisition and other) (G) 1,891 - - - Loss (gain) on disposal of assets 1,089 (864) (2,231) (556) AEA management fee (H) 2,250 188 - - Effects of fair value adjustments to inventory (I) 5,012 8,289 - - Interest rate swap / cap mark-to-market (J) 2,494 (192) 313 - Pension withdrawal (K) - - - 10,179 Total Add-Backs 24,568 82,256 15,040 18,323 Adjusted EBITDA $105,796 $ 87,062 $ 57,511 $ 32,394
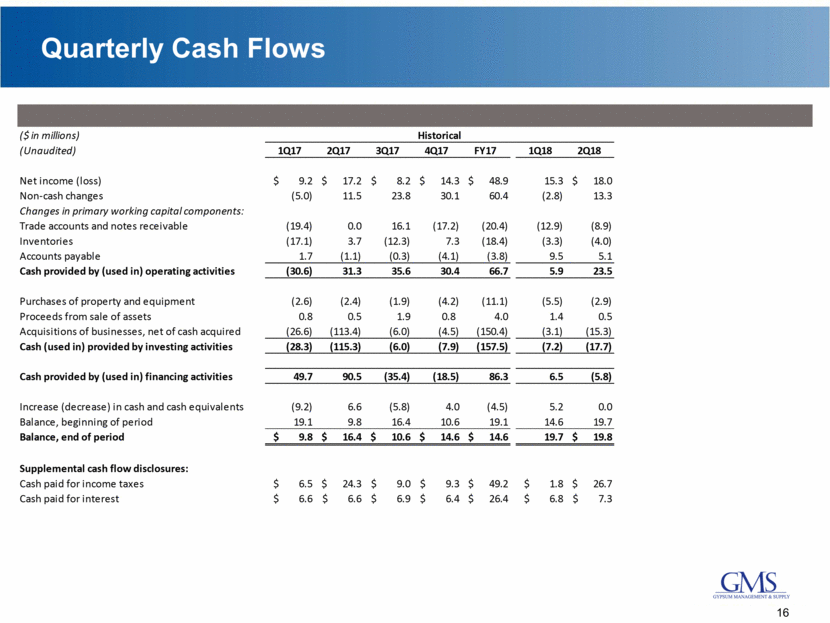
Quarterly Cash Flows 16 ($ in millions) (Unaudited) 1Q17 2Q17 3Q17 4Q17 FY17 1Q18 2Q18 Net income (loss) $ 9.2 $ 17.2 $ 8.2 $ 14.3 $ 48.9 15.3 $ 18.0 Non-cash changes (5.0) 11.5 23.8 30.1 60.4 (2.8) 13.3 Changes in primary working capital components: Trade accounts and notes receivable (19.4) 0.0 16.1 (17.2) (20.4) (12.9) (8.9) Inventories (17.1) 3.7 (12.3) 7.3 (18.4) (3.3) (4.0) Accounts payable 1.7 (1.1) (0.3) (4.1) (3.8) 9.5 5.1 Cash provided by (used in) operating activities (30.6) 31.3 35.6 30.4 66.7 5.9 23.5 Purchases of property and equipment (2.6) (2.4) (1.9) (4.2) (11.1) (5.5) (2.9) Proceeds from sale of assets 0.8 0.5 1.9 0.8 4.0 1.4 0.5 Acquisitions of businesses, net of cash acquired (26.6) (113.4) (6.0) (4.5) (150.4) (3.1) (15.3) Cash (used in) provided by investing activities (28.3) (115.3) (6.0) (7.9) (157.5) (7.2) (17.7) Cash provided by (used in) financing activities 49.7 90.5 (35.4) (18.5) 86.3 6.5 (5.8) Increase (decrease) in cash and cash equivalents (9.2) 6.6 (5.8) 4.0 (4.5) 5.2 0.0 Balance, beginning of period 19.1 9.8 16.4 10.6 19.1 14.6 19.7 Balance, end of period $ 9.8 $ 16.4 $ 10.6 $ 14.6 $ 14.6 19.7 $ 19.8 Supplemental cash flow disclosures: Cash paid for income taxes $ 6.5 $ 24.3 $ 9.0 $ 9.3 $ 49.2 $ 1.8 $ 26.7 Cash paid for interest $ 6.6 $ 6.6 $ 6.9 $ 6.4 $ 26.4 $ 6.8 $ 7.3 Historical
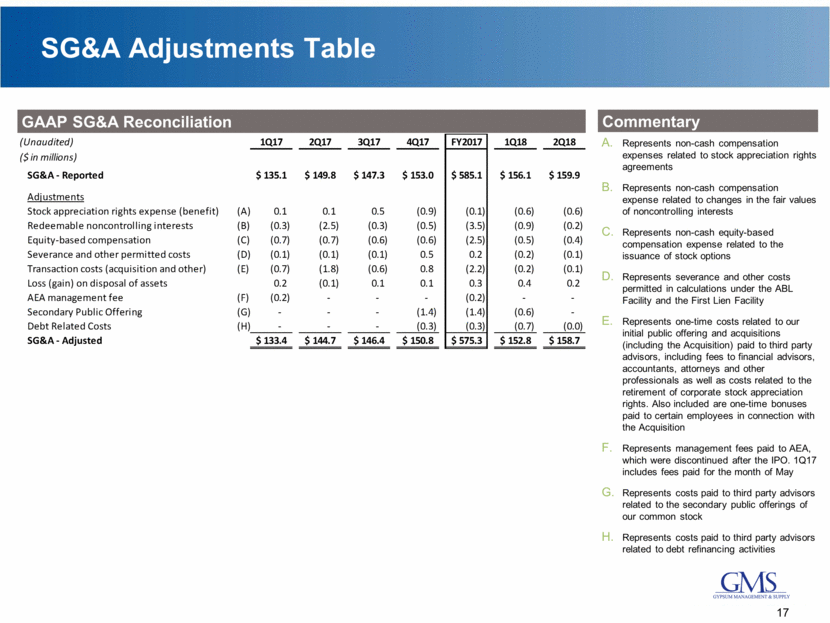
SG&A Adjustments Table GAAP SG&A Reconciliation Commentary Represents non-cash compensation expenses related to stock appreciation rights agreements Represents non-cash compensation expense related to changes in the fair values of noncontrolling interests Represents non-cash equity-based compensation expense related to the issuance of stock options Represents severance and other costs permitted in calculations under the ABL Facility and the First Lien Facility Represents one-time costs related to our initial public offering and acquisitions (including the Acquisition) paid to third party advisors, including fees to financial advisors, accountants, attorneys and other professionals as well as costs related to the retirement of corporate stock appreciation rights. Also included are one-time bonuses paid to certain employees in connection with the Acquisition Represents management fees paid to AEA, which were discontinued after the IPO. 1Q17 includes fees paid for the month of May Represents costs paid to third party advisors related to the secondary public offerings of our common stock Represents costs paid to third party advisors related to debt refinancing activities 17 (Unaudited) 1Q17 2Q17 3Q17 4Q17 FY2017 1Q18 2Q18 ($ in millions) SG&A - Reported 135.1 $ 149.8 $ 147.3 $ 153.0 $ 585.1 $ 156.1 $ 159.9 $ Adjustments Stock appreciation rights expense (benefit) (A) 0.1 0.1 0.5 (0.9) (0.1) (0.6) (0.6) Redeemable noncontrolling interests (B) (0.3) (2.5) (0.3) (0.5) (3.5) (0.9) (0.2) Equity-based compensation (C) (0.7) (0.7) (0.6) (0.6) (2.5) (0.5) (0.4) Severance and other permitted costs (D) (0.1) (0.1) (0.1) 0.5 0.2 (0.2) (0.1) Transaction costs (acquisition and other) (E) (0.7) (1.8) (0.6) 0.8 (2.2) (0.2) (0.1) Loss (gain) on disposal of assets 0.2 (0.1) 0.1 0.1 0.3 0.4 0.2 AEA management fee (F) (0.2) - - - (0.2) - - Secondary Public Offering (G) - - - (1.4) (1.4) (0.6) - Debt Related Costs (H) - - - (0.3) (0.3) (0.7) (0.0) SG&A - Adjusted 133.4 $ 144.7 $ 146.4 $ 150.8 $ 575.3 $ 152.8 $ 158.7 $
www.gms.com

Serious News for Serious Traders! Try StreetInsider.com Premium Free!
You May Also Be Interested In
- GMS Inc. (GMS) PT Raised to $112 at Baird
- L.L.Bean and Summersalt Launch New Limited Edition Summer Collaboration
- Forcura Launches Referral Summary for Post-Acute Care Market
Create E-mail Alert Related Categories
SEC FilingsSign up for StreetInsider Free!
Receive full access to all new and archived articles, unlimited portfolio tracking, e-mail alerts, custom newswires and RSS feeds - and more!


 Tweet
Tweet Share
Share