
Form 8-K VEECO INSTRUMENTS INC For: Oct 29
�
�
UNITED STATES
SECURITIES AND EXCHANGE COMMISSION
Washington, D.C.� 20549
�
�
FORM�8-K
�
�
CURRENT REPORT
PURSUANT TO SECTION�13 OR 15(d)�OF THE
SECURITIES EXCHANGE ACT OF 1934
�
�
Date of Report (Date of earliest event reported): October�29, 2014
�
VEECO INSTRUMENTS INC.
(Exact name of registrant as specified in its charter)
�
|
Delaware |
� |
0-16244 |
� |
11-2989601 |
|
(State�or�other�jurisdiction |
� |
(Commission |
� |
(IRS�Employer |
�
Terminal Drive, Plainview, New York 11803
(Address of principal executive offices)
�
(516) 677-0200
(Registrant�s telephone number, including area code)
�
Not applicable
(Former name or former address, if changed since last report)
�
Check the appropriate box below if the Form�8-K filing is intended to simultaneously satisfy the filing obligation of the registrant under any of the following provisions (see General Instruction A.2. below):
�
o����������� Written communications pursuant to Rule�425 under the Securities Act (17 CFR 230.425)
�
o����������� Soliciting material pursuant to Rule�14a-12 under the Exchange Act (17 CFR 240.14a-12)
�
o����������� Pre-commencement communications pursuant to Rule�14d-2(b)�under the Exchange Act (17 CFR 240.14d-2(b))
�
o����������� Pre-commencement communications pursuant to Rule�13e-4(c)�under the Exchange Act (17 CFR 240.13e-4(c))
�
�
�
�
Item 2.02�� Results of Operations and Financial Condition.
�
On October�29, 2014, Veeco Instruments Inc. issued a press release announcing its financial results for the quarter ended September�30, 2014.� In connection with the release and the related conference call, Veeco posted a presentation relating to its third quarter 2014 financial results on its website (www.veeco.com).� Copies of the press release and presentation are furnished as Exhibit�99.1 and Exhibit�99.2 to this report.
�
Item 9.01�� Financial Statements and Exhibits.
�
(d)�������������������������������� Exhibits.
�
|
Exhibit |
� |
Description |
|
� |
� |
� |
|
99.1 |
� |
Press release issued by Veeco dated October�29, 2014 |
|
� |
� |
� |
|
99.2 |
� |
Veeco Q3 2014 Conference Call, October�29, 2014 |
�
The information in this report, including the exhibits, shall not be deemed �filed� for purposes of Section�18 of the Securities Exchange Act of 1934, as amended (the �Exchange Act�), or otherwise subject to the liabilities under that Section, nor shall this information or these exhibits be deemed to be incorporated by reference into any filing under the Securities Act of 1933, as amended, or the Exchange Act, except as expressly set forth by specific reference in such a filing.
�
SIGNATURES
�
Pursuant to the requirements of the Securities Exchange Act of 1934, the registrant has duly caused this report to be signed on its behalf by the undersigned hereunto duly authorized.
�
|
October�29, 2014 |
VEECO INSTRUMENTS INC. | |
|
� |
� | |
|
� |
By: |
/s/ Gregory A. Robbins |
|
� |
Name: Gregory A. Robbins | |
|
� |
Title: Senior Vice President and General Counsel | |
�
�
EXHIBIT�INDEX
�
|
Exhibit |
� |
Description |
|
� |
� |
� |
|
99.1 |
� |
Press release issued by Veeco dated October�29, 2014 |
|
� |
� |
� |
|
99.2 |
� |
Veeco Q3 2014 Conference Call, October�29, 2014 |
�
EXHIBIT�99.1
�
|
|
 �� �������������������������������NEWS
�
FOR IMMEDIATE RELEASE
�
VEECO REPORTS THIRD QUARTER 2014 FINANCIAL RESULTS
�
Plainview, N.Y., October�29, 2014 � Veeco Instruments Inc. (Nasdaq: VECO) announced its financial results for the third quarter ended September�30, 2014.� Veeco reports its results on a U.S. generally accepted accounting principles (�GAAP�) basis, and also provides results excluding certain items.� Refer to the attached table for details of the reconciliation between GAAP operating results and Non-GAAP operating results.
�
GAAP Results ($M except per share data)
�
|
� |
� |
Q3��14 |
� |
Q3��13 |
� | ||
|
Revenues |
� |
$ |
93.3 |
� |
$ |
99.3 |
� |
|
Net loss |
� |
$ |
(14.0 |
) |
$ |
(6.0 |
) |
|
Per share loss |
� |
$ |
(0.35 |
) |
$ |
(0.16 |
) |
�
Non-GAAP Results ($M except per share data)
�
|
� |
� |
Q3��14 |
� |
Q3��13 |
� | ||
|
Adjusted EBITDA |
� |
$ |
(1.8 |
) |
$ |
(1.8 |
) |
|
Net loss |
� |
$ |
(0.8 |
) |
$ |
(3.0 |
) |
|
Per share loss |
� |
$ |
(0.02 |
) |
$ |
(0.08 |
) |
�
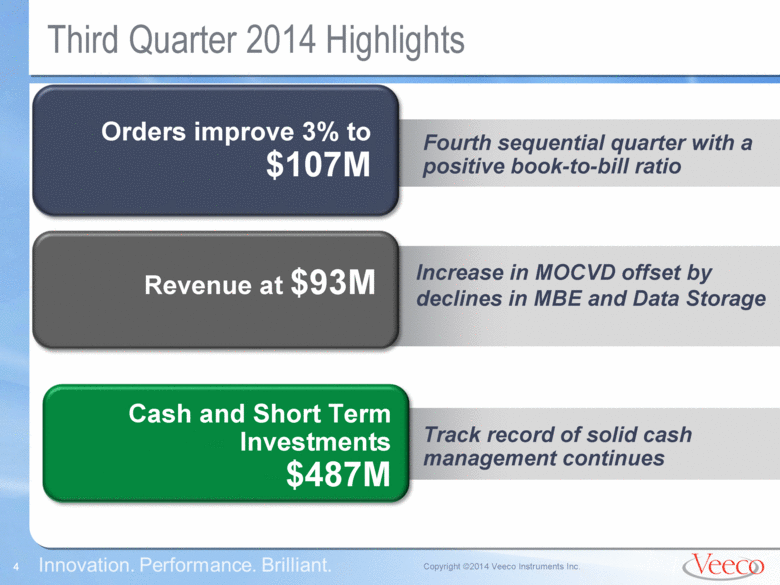
�Veeco reported $93 million in revenues, a slight decline from the second quarter of 2014, as an increase in MOCVD revenue was offset by declines in our other businesses,� commented John R. Peeler, Chairman and Chief Executive Officer. �We have been steadily improving Veeco�s bottom line performance this year by lowering our operating expenses and driving higher gross margins, resulting in an adjusted EBITDA loss of $2M. We continue to manage our cash well, ending the quarter with a cash balance of $487 million, up $2 million from the prior quarter.�
�
�Third quarter 2014 orders were $107 million, higher than the second quarter of 2014,� continued Peeler. �LED�& Solar orders totaled $93M, the highest level since the third quarter of 2011, driven by an 8% increase in MOCVD.� MBE won several key R&D deals and booked a total of $9 million in the quarter, the highest level this year. We also booked our prototype FAST-ALD system for development of flexible OLED displays at our key customer. With no capacity purchases by hard drive customers, Data Storage orders remained weak at $14M.�
�
Outlook
�
Veeco�s fourth quarter 2014 revenue is currently forecasted to be between $100 and $115 million. Earnings per share is currently forecasted to be a loss of between ($0.25) to ($0.13) on a GAAP basis, and a ($0.03) loss to $0.09 earnings on a non-GAAP basis. Please refer to the attached financial table for more details.
�
Peeler added, �Veeco�s second half 2014 orders are currently expected to be higher than the first half, driven by growth in MOCVD, as LED unit demand and quoting activity remain strong. Veeco is making progress improving bottom line performance through a combination of better business conditions, execution on growth initiatives, and a more streamlined company with lower operating expenses.�
�
�
Conference Call Information
�
A conference call reviewing these results has been scheduled for today at 5:00pm ET. To join the call, dial 1-888-684-1278 (toll free) or 913-312-0829 and use passcode 7677500. The call will also be webcast live on the Veeco website at ir.veeco.com. A replay of the call will be available beginning tonight at 8:00pm ET through 8:00pm ET on Wednesday, November�12, 2014 at 1-888-203-1112 (toll free) or 1-719-457-0820, using passcode 7677500, and on the Veeco website. We will post an accompanying slide presentation to our website prior to the beginning of the call.
�
About Veeco
�
Veeco�s process equipment solutions enable the manufacture of LEDs, flexible OLED displays, solar cells, power electronics, hard drives, MEMS and wireless chips.� We are the market leader in MOCVD, MBE,�Ion Beam and other advanced thin film process technologies. Our high performance systems drive innovation in energy efficiency, consumer electronics and network storage and allow our customers to maximize productivity and achieve lower cost of ownership.� For information on our company, products and worldwide service and support, please visit www.veeco.com.
�
To the extent that this news release discusses expectations or otherwise makes statements about the future, such statements are forward-looking and are subject to a number of risks and uncertainties that could cause actual results to differ materially from the statements made. These factors include the risks discussed in the Business Description and Management�s Discussion and Analysis sections of Veeco�s Annual Report on Form�10-K for the year ended December�31, 2013 and in our subsequent quarterly reports on Form�10-Q, current reports on Form�8-K and press releases.� Veeco does not undertake any obligation to update any forward-looking statements to reflect future events or circumstances after the date of such statements.
�
-financial tables attached-
�
|
Veeco Contacts: |
� |
� |
|
� |
� |
� |
|
Investor Relations: |
� |
Media: |
|
Debra Wasser 516-677-0200 x1472 |
� |
Jeffrey Pina 516-677-0200 x1222 |
|
� |
�
�
Veeco Instruments Inc. and Subsidiaries
Consolidated Statements of Operations
(In thousands, except per share data)
(Unaudited)
�
|
� |
� |
For�the�three�months�ended |
� |
For�the�nine�months�ended |
� | ||||||||
|
� |
� |
September�30, |
� |
September�30, |
� | ||||||||
|
� |
� |
2014 |
� |
2013 |
� |
2014 |
� |
2013 |
� | ||||
|
Net sales |
� |
$ |
93,341 |
� |
$ |
99,324 |
� |
$ |
279,304 |
� |
$ |
258,540 |
� |
|
Cost of sales |
� |
60,783 |
� |
69,016 |
� |
182,296 |
� |
171,040 |
� | ||||
|
Gross profit |
� |
32,558 |
� |
30,308 |
� |
97,008 |
� |
87,500 |
� | ||||
|
� |
� |
� |
� |
� |
� |
� |
� |
� |
� | ||||
|
Operating expenses: |
� |
� |
� |
� |
� |
� |
� |
� |
� | ||||
|
Selling, general and administrative |
� |
21,712 |
� |
19,650 |
� |
65,270 |
� |
59,077 |
� | ||||
|
Research and development |
� |
19,968 |
� |
18,993 |
� |
60,747 |
� |
60,600 |
� | ||||
|
Amortization |
� |
3,149 |
� |
855 |
� |
8,951 |
� |
2,566 |
� | ||||
|
Restructuring |
� |
2,317 |
� |
1,240 |
� |
3,510 |
� |
1,771 |
� | ||||
|
Asset impairment |
� |
2,864 |
� |
� |
� |
2,864 |
� |
� |
� | ||||
|
Total operating expenses |
� |
50,010 |
� |
40,738 |
� |
141,342 |
� |
124,014 |
� | ||||
|
Other operating, net |
� |
36 |
� |
(493 |
) |
(334 |
) |
(141 |
) | ||||
|
Changes in contingent consideration |
� |
� |
� |
� |
� |
(29,368 |
) |
� |
� | ||||
|
Operating income (loss) |
� |
(17,488 |
) |
(9,937 |
) |
(14,632 |
) |
(36,373 |
) | ||||
|
Interest income (expense), net |
� |
305 |
� |
192 |
� |
541 |
� |
620 |
� | ||||
|
Income (loss) before income taxes |
� |
(17,183 |
) |
(9,745 |
) |
(14,091 |
) |
(35,753 |
) | ||||
|
Income tax provision (benefit) |
� |
(3,206 |
) |
(3,719 |
) |
(4,063 |
) |
(15,575 |
) | ||||
|
Net income (loss) |
� |
$ |
(13,977 |
) |
$ |
(6,026 |
) |
$ |
(10,028 |
) |
$ |
(20,178 |
) |
|
� |
� |
� |
� |
� |
� |
� |
� |
� |
� | ||||
|
Income (loss) per common share: |
� |
� |
� |
� |
� |
� |
� |
� |
� | ||||
|
Basic: |
� |
� |
� |
� |
� |
� |
� |
� |
� | ||||
|
Income (loss) |
� |
$ |
(0.35 |
) |
$ |
(0.16 |
) |
$ |
(0.26 |
) |
$ |
(0.52 |
) |
|
� |
� |
� |
� |
� |
� |
� |
� |
� |
� | ||||
|
Diluted: |
� |
� |
� |
� |
� |
� |
� |
� |
� | ||||
|
Income (loss) |
� |
$ |
(0.35 |
) |
$ |
(0.16 |
) |
$ |
(0.26 |
) |
$ |
(0.52 |
) |
|
� |
� |
� |
� |
� |
� |
� |
� |
� |
� | ||||
|
Weighted average shares outstanding: |
� |
� |
� |
� |
� |
� |
� |
� |
� | ||||
|
Basic |
� |
39,401 |
� |
38,841 |
� |
39,317 |
� |
38,774 |
� | ||||
|
Diluted |
� |
39,401 |
� |
38,841 |
� |
39,317 |
� |
38,774 |
� | ||||
�
�
Veeco Instruments Inc. and Subsidiaries
Condensed Consolidated Balance Sheets
(In thousands)
�
|
� |
� |
September�30, |
� |
December�31, |
� | ||
|
� |
� |
2014 |
� |
2013 |
� | ||
|
� |
� |
(Unaudited) |
� |
� |
� | ||
|
ASSETS |
� |
� |
� |
� |
� | ||
|
Current assets: |
� |
� |
� |
� |
� | ||
|
Cash and cash equivalents |
� |
$ |
264,008 |
� |
$ |
210,799 |
� |
|
Short-term investments |
� |
222,954 |
� |
281,538 |
� | ||
|
Restricted cash |
� |
487 |
� |
2,738 |
� | ||
|
Accounts receivable, net |
� |
61,588 |
� |
23,823 |
� | ||
|
Inventories |
� |
46,594 |
� |
59,726 |
� | ||
|
Prepaid expenses and other current assets |
� |
51,332 |
� |
23,303 |
� | ||
|
Assets held for sale |
� |
2,653 |
� |
� |
� | ||
|
Deferred income taxes |
� |
8,384 |
� |
11,716 |
� | ||
|
Total current assets |
� |
658,000 |
� |
613,643 |
� | ||
|
� |
� |
� |
� |
� |
� | ||
|
Property, plant and equipment at cost, net |
� |
80,720 |
� |
89,139 |
� | ||
|
Goodwill |
� |
91,521 |
� |
91,348 |
� | ||
|
Deferred income taxes |
� |
397 |
� |
397 |
� | ||
|
Intangible assets, net |
� |
106,015 |
� |
114,716 |
� | ||
|
Other assets |
� |
19,745 |
� |
38,726 |
� | ||
|
Total assets |
� |
$ |
956,398 |
� |
$ |
947,969 |
� |
|
� |
� |
� |
� |
� |
� | ||
|
LIABILITIES AND EQUITY |
� |
� |
� |
� |
� | ||
|
Current liabilities: |
� |
� |
� |
� |
� | ||
|
Accounts payable |
� |
$ |
26,113 |
� |
$ |
35,755 |
� |
|
Accrued expenses and other current liabilities |
� |
40,468 |
� |
51,084 |
� | ||
|
Customer deposits and deferred revenue |
� |
65,553 |
� |
34,754 |
� | ||
|
Income taxes payable |
� |
6,840 |
� |
6,149 |
� | ||
|
Deferred income taxes |
� |
159 |
� |
159 |
� | ||
|
Current portion of long-term debt |
� |
308 |
� |
290 |
� | ||
|
Total current liabilities |
� |
139,441 |
� |
128,191 |
� | ||
|
� |
� |
� |
� |
� |
� | ||
|
Deferred income taxes |
� |
19,741 |
� |
28,052 |
� | ||
|
Long-term debt |
� |
1,614 |
� |
1,847 |
� | ||
|
Other liabilities |
� |
3,484 |
� |
9,649 |
� | ||
|
Total liabilities |
� |
164,280 |
� |
167,739 |
� | ||
|
� |
� |
� |
� |
� |
� | ||
|
Equity |
� |
792,118 |
� |
780,230 |
� | ||
|
� |
� |
� |
� |
� |
� | ||
|
Total liabilities and equity |
� |
$ |
956,398 |
� |
$ |
947,969 |
� |
�
�
Veeco Instruments Inc. and Subsidiaries
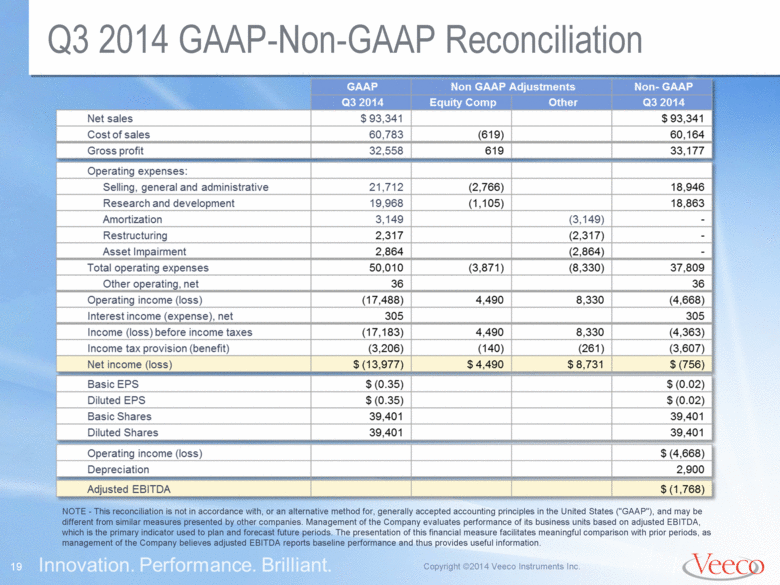
Reconciliation GAAP to Non-GAAP Financial Data
(In thousands, except per share data)
(Unaudited)
�
|
� |
� |
� |
� |
Non-GAAP�Adjustments |
� |
� |
� | ||||||
|
For�the�three�months�ended�September�30,�2014 |
� |
GAAP |
� |
Equity-based |
� |
Other |
� |
Non-GAAP |
� | ||||
|
Net sales |
� |
$ |
93,341 |
� |
$ |
� |
� |
$ |
� |
� |
$ |
93,341 |
� |
|
Cost of sales |
� |
60,783 |
� |
(619 |
) |
� |
� |
60,164 |
� | ||||
|
Gross profit |
� |
32,558 |
� |
619 |
� |
� |
� |
33,177 |
� | ||||
|
Gross margin |
� |
34.9 |
% |
� |
� |
� |
� |
35.5 |
% | ||||
|
Operating expenses: |
� |
� |
� |
� |
� |
� |
� |
� |
� | ||||
|
Selling, general and administrative |
� |
21,712 |
� |
(2,766 |
) |
� |
� |
18,946 |
� | ||||
|
Research and development |
� |
19,968 |
� |
(1,105 |
) |
� |
� |
18,863 |
� | ||||
|
Amortization |
� |
3,149 |
� |
� |
� |
(3,149 |
) |
� |
� | ||||
|
Restructuring |
� |
2,317 |
� |
� |
� |
(2,317 |
) |
� |
� | ||||
|
Asset impairment |
� |
2,864 |
� |
� |
� |
(2,864 |
) |
� |
� | ||||
|
Total operating expenses |
� |
50,010 |
� |
(3,871 |
) |
(8,330 |
) |
37,809 |
� | ||||
|
Other operating, net |
� |
36 |
� |
� |
� |
� |
� |
36 |
� | ||||
|
Operating income (loss) |
� |
(17,488 |
) |
4,490 |
� |
8,330 |
� |
(4,668 |
) | ||||
|
Interest income (expense), net |
� |
305 |
� |
� |
� |
� |
� |
305 |
� | ||||
|
Income (loss) before income taxes |
� |
(17,183 |
) |
4,490 |
� |
8,330 |
� |
(4,363 |
) | ||||
|
Income tax provision (benefit) |
� |
(3,206 |
) |
(140 |
) |
(261 |
) |
(3,607 |
)(1) | ||||
|
Net income (loss) |
� |
$ |
(13,977 |
) |
$ |
4,630 |
� |
$ |
8,591 |
� |
$ |
(756 |
) |
|
� |
� |
� |
� |
� |
� |
� |
� |
� |
� | ||||
|
Basic EPS |
� |
$ |
(0.35 |
) |
� |
� |
� |
� |
$ |
(0.02 |
) | ||
|
Diluted EPS |
� |
$ |
(0.35 |
) |
� |
� |
� |
� |
$ |
(0.02 |
) | ||
|
Basic shares |
� |
39,401 |
� |
� |
� |
� |
� |
39,401 |
� | ||||
|
Diluted shares |
� |
39,401 |
� |
� |
� |
� |
� |
39,401 |
� | ||||
|
� |
� |
� |
� |
� |
� |
� |
� |
� |
� | ||||
|
Operating income (loss) |
� |
� |
� |
� |
� |
� |
� |
$ |
(4,668 |
) | |||
|
Depreciation |
� |
� |
� |
� |
� |
� |
� |
2,900 |
� | ||||
|
Adjusted EBITDA |
� |
� |
� |
� |
� |
� |
� |
$ |
(1,768 |
) | |||
�
(1)�The Company utilized the with and without method to determine the income tax effect of non-GAAP adjustments.
�
NOTE - This reconciliation is not in accordance with, or an alternative method for, generally accepted accounting principles in the United States (�GAAP�), and may be different from similar measures presented by other companies. Management of the Company evaluates performance of its business units based on adjusted EBITDA, which is the primary indicator used to plan and forecast future periods. The presentation of this financial measure facilitates meaningful comparison with prior periods, as management of the Company believes adjusted EBITDA reports baseline performance and thus provides useful information.
�
�
Veeco Instruments Inc. and Subsidiaries
Reconciliation GAAP to Non-GAAP Financial Data
(In thousands, except per share data)
(Unaudited)
�
|
� |
� |
� |
� |
Non-GAAP�Adjustments |
� |
� |
� | ||||||
|
For�the�three�months�ended�September�30,�2013 |
� |
GAAP |
� |
Equity-based |
� |
Other |
� |
Non-GAAP |
� | ||||
|
Net sales |
� |
$ |
99,324 |
� |
$ |
� |
� |
$ |
� |
� |
$ |
99,324 |
� |
|
Cost of sales |
� |
69,016 |
� |
(295 |
) |
� |
� |
68,721 |
� | ||||
|
Gross profit |
� |
30,308 |
� |
295 |
� |
� |
� |
30,603 |
� | ||||
|
Gross margin |
� |
30.5 |
% |
� |
� |
� |
� |
30.8 |
% | ||||
|
Operating expenses: |
� |
� |
� |
� |
� |
� |
� |
� |
� | ||||
|
Selling, general and administrative |
� |
19,650 |
� |
(1,794 |
) |
� |
� |
17,856 |
� | ||||
|
Research and development |
� |
18,993 |
� |
(674 |
) |
� |
� |
18,319 |
� | ||||
|
Amortization |
� |
855 |
� |
� |
� |
(855 |
) |
� |
� | ||||
|
Restructuring |
� |
1,240 |
� |
� |
� |
(1,240 |
) |
� |
� | ||||
|
Total operating expenses |
� |
40,738 |
� |
(2,468 |
) |
(2,095 |
) |
36,175 |
� | ||||
|
Other operating, net |
� |
(493 |
) |
� |
� |
� |
� |
(493 |
) | ||||
|
Operating income (loss) |
� |
(9,937 |
) |
2,763 |
� |
2,095 |
� |
(5,079 |
) | ||||
|
Interest income (expense), net |
� |
192 |
� |
� |
� |
� |
� |
192 |
� | ||||
|
Income (loss) before income taxes |
� |
(9,745 |
) |
2,763 |
� |
2,095 |
� |
(4,887 |
) | ||||
|
Income tax provision (benefit) |
� |
(3,719 |
) |
1,036 |
� |
786 |
� |
(1,897 |
)(1) | ||||
|
Net income (loss) |
� |
$ |
(6,026 |
) |
$ |
1,727 |
� |
$ |
1,309 |
� |
$ |
(2,990 |
) |
|
� |
� |
� |
� |
� |
� |
� |
� |
� |
� | ||||
|
Basic EPS |
� |
$ |
(0.16 |
) |
� |
� |
� |
� |
$ |
(0.08 |
) | ||
|
Diluted EPS |
� |
$ |
(0.16 |
) |
� |
� |
� |
� |
$ |
(0.08 |
) | ||
|
Basic shares |
� |
38,841 |
� |
� |
� |
� |
� |
38,841 |
� | ||||
|
Diluted shares |
� |
38,841 |
� |
� |
� |
� |
� |
38,841 |
� | ||||
|
� |
� |
� |
� |
� |
� |
� |
� |
� |
� | ||||
|
Operating income (loss) |
� |
� |
� |
� |
� |
� |
� |
$ |
(5,079 |
) | |||
|
Depreciation |
� |
� |
� |
� |
� |
� |
� |
3,240 |
� | ||||
|
Adjusted EBITDA |
� |
� |
� |
� |
� |
� |
� |
$ |
(1,839 |
) | |||
�
(1)�The Company utilized the with and without method to determine the income tax effect of non-GAAP adjustments.
�
NOTE - This reconciliation is not in accordance with, or an alternative method for, generally accepted accounting principles in the United States (�GAAP�), and may be different from similar measures presented by other companies. Management of the Company evaluates performance of its business units based on adjusted EBITDA, which is the primary indicator used to plan and forecast future periods. The presentation of this financial measure facilitates meaningful comparison with prior periods, as management of the Company believes adjusted EBITDA reports baseline performance and thus provides useful information.
�
�
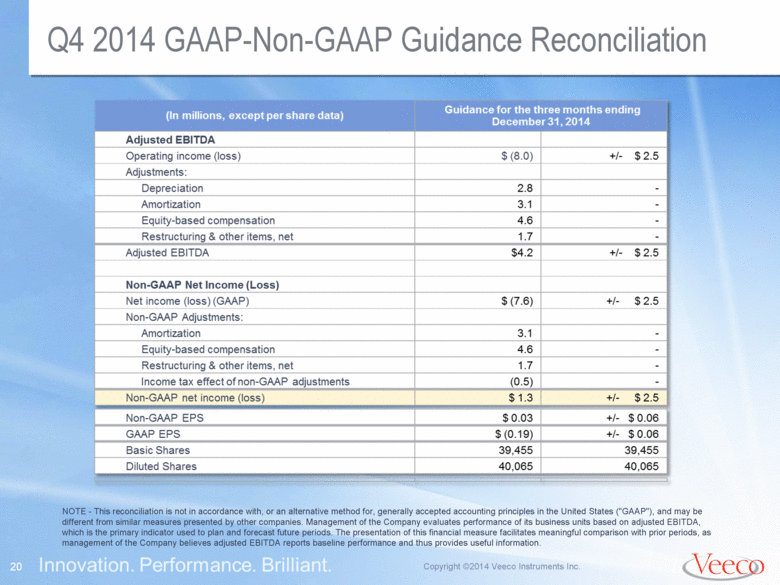
Veeco Instruments Inc. and Subsidiaries
Reconciliation GAAP to Non-GAAP Financial Data
(In millions, except per share data)
(Unaudited)
�
|
� |
� |
Guidance�range�for |
� | |||
|
Adjusted EBITDA |
� |
� |
� |
� |
� | |
|
� |
� |
� |
� |
� |
� | |
|
Operating income (loss) |
� |
$ |
(8.0 |
) |
+/- $2.5 |
� |
|
� |
� |
� |
� |
� |
� | |
|
Adjustments: |
� |
� |
� |
� |
� | |
|
� |
� |
� |
� |
� |
� | |
|
Depreciation |
� |
2.8 |
� |
� |
� | |
|
Amortization |
� |
3.1 |
� |
� |
� | |
|
Equity-based compensation |
� |
4.6 |
� |
� |
� | |
|
Restructuring�& other items, net |
� |
1.7 |
� |
� |
� | |
|
Adjusted EBITDA |
� |
$ |
4.2 |
� |
+/- $2.5 |
� |
|
� |
� |
� |
� |
� |
� | |
|
� |
� |
� |
� |
� |
� | |
|
Non-GAAP Net Income |
� |
� |
� |
� |
� | |
|
� |
� |
� |
� |
� |
� | |
|
Net income (loss) (GAAP basis) |
� |
$ |
(7.6 |
) |
+/- $2.5 |
� |
|
� |
� |
� |
� |
� |
� | |
|
Non-GAAP adjustments: |
� |
� |
� |
� |
� | |
|
� |
� |
� |
� |
� |
� | |
|
Amortization |
� |
3.1 |
� |
� |
� | |
|
Equity-based compensation |
� |
4.6 |
� |
� |
� | |
|
Restructuring�& other items, net |
� |
1.7 |
� |
� |
� | |
|
Income tax effect of non-GAAP adjustments |
� |
(0.5 |
) |
� |
(1) | |
|
Non-GAAP net income (loss) |
� |
$ |
1.3 |
� |
+/- $2.5 |
� |
|
Non-GAAP earnings per diluted share excluding certain items (�Non-GAAP EPS�) |
� |
$ |
0.03 |
� |
+/- $0.06 |
� |
|
� |
� |
� |
� |
� |
� | |
|
GAAP earnings per diluted share excluding certain items (�GAAP EPS�) |
� |
$ |
(0.19 |
) |
+/- $0.06 |
� |
|
Weighted average shares outstanding: |
� |
� |
� |
� |
� | |
|
Basic |
� |
39,455 |
� |
39,455 |
� | |
|
Diluted |
� |
40,065 |
� |
40,065 |
� | |
�
(1)�The Company utilizes the with and without method to determine the income tax effect of non-GAAP adjustments.
�
NOTE - This reconciliation is not in accordance with, or an alternative method for, generally accepted accounting principles in the United States (�GAAP�), and may be different from similar measures presented by other companies. Management of the Company evaluates performance of its business units based on adjusted EBITDA, which is the primary indicator used to plan and forecast future periods. The presentation of this financial measure facilitates meaningful comparison with prior periods, as management of the Company believes adjusted EBITDA reports baseline performance and thus provides useful information.
�
Exhibit 99.2
|
|
Q3 2014 Conference Call����������������� October 29, 2014� |

�
|
|
Safe Harbor To the extent that this presentation discusses expectations or otherwise makes statements about the future, such statements are forward-looking and are subject to a number of risks and uncertainties that could cause actual results to differ materially from the statements made.�� These items include the risk factors discussed in the Business Description and Management's Discussion and Analysis sections of Veeco's Annual Report on Form 10-K for the year ended December 31, 2013 and subsequent Quarterly Reports on Form 10-Q and current reports on Form 8-K.� Veeco does not undertake any obligation to update any forward-looking statements to reflect future events or circumstances after the date of such statements.� |

�
|
|
John Peeler� Chairman & CEO Introduction |
�
|
|
Third Quarter 2014 Highlights Orders improve 3% to $107M Cash and Short Term Investments� $487M� Revenue at $93M Fourth sequential quarter with a positive book-to-bill ratio Track record of solid cash management continues Increase in MOCVD offset by declines in MBE and Data Storage�� |
�
|
|
Sam Maheshwari, CFO Financial Highlights |

�
|
|
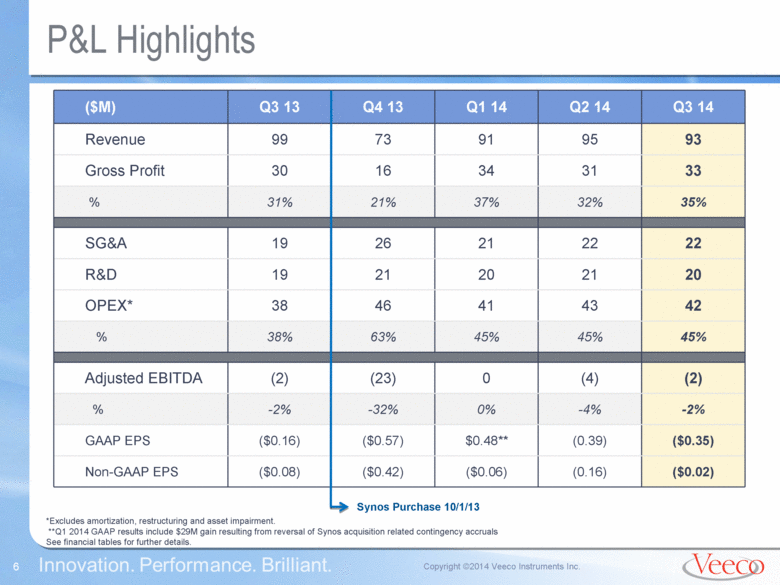
P&L Highlights ($M) Q3 13 Q4 13 Q1 14 Q2 14 Q3 14 Revenue 99 73 91 95 93 Gross Profit 30 16 34 31 33� % 31% 21% 37% 32% 35% SG&A 19 26 21 22 22 R&D 19 21 20 21 20 OPEX* 38 46 41 43 42��� % 38% 63% 45% 45% 45% Adjusted EBITDA (2) (23) 0 (4) (2)�� %� -2% -32% 0% -4% -2% GAAP EPS ($0.16) ($0.57) $0.48** (0.39) ($0.35) Non-GAAP EPS ($0.08) ($0.42) ($0.06) (0.16) ($0.02) *Excludes amortization, restructuring and asset impairment.� **Q1 2014 GAAP results include $29M gain resulting from reversal of Synos acquisition related contingency accruals� See financial tables for further details. Synos Purchase 10/1/13 |
�
|
|
Q3 2014 Bookings and Revenue Highlights and Trends Q3 13 Q4 13 Q1 14 Q2 14 Q3 14 LED & Solar 75 57 71 77 77 MOCVD 68 50 64 67 71 MBE 7 6 7 10 6 ALD NA 1 0 0 0 Data Storage 24 16 20 18 16 Total 99 73 91 95 93 Total� Bookings:� $107M Revenue Data Storage ~$14M LED & Solar ~$93M Total� Revenue:� $93M Bookings Data Storage ~$16M LED & Solar ~$77M Q3 13 Q4 13 Q1 14 Q2 14 Q314 LED & Solar 73 63 88 81 93 MOCVD 66 52 83 75 81 MBE 7 11 5 6 9 ALD NA 0 0 0 3 Data Storage 18 22 15 23 14 Total 91 85 103 104 107 |

�
|
|
Balance Sheet Highlights Track Record of Solid Cash Management Continues ($M) Q3 13 Q4 13 Q1 14 Q2 14 Q3 14 Cash & Short-term Investments 573 495 483 485 487 Accounts Receivable 38 24 51 58 62 Inventory 58 60 52 48 47 Accounts Payable 28 36 28 28 26 ($M) Q3 13 Q4 13 Q1 14 Q2 14 Q3 14 DSO 34 29 50 55 59 DOI� 76 95 83 69 70 DPO� 37 57 45 39 39 Synos Purchase 10/1/13 |

�
|
|
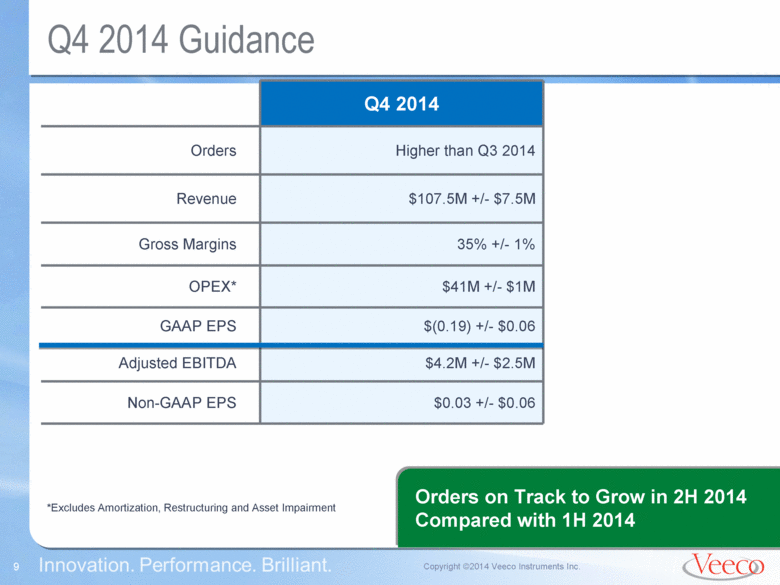
Q4 2014 Guidance���������������������������������������������������������������������� Q4 2014 Orders Higher than Q3 2014 Revenue $107.5M +/- $7.5M Gross Margins 35% +/- 1% OPEX* $41M +/- $1M GAAP EPS $(0.19) +/- $0.06 Adjusted EBITDA $4.2M +/- $2.5M� Non-GAAP EPS $0.03 +/- $0.06 Orders on Track to Grow in 2H 2014 Compared with 1H 2014 *Excludes Amortization, Restructuring and Asset Impairment |
�
|
|
Business Update and Outlook |

�
|
|
Trends favoring LED: Sources: DisplaySearch, IHS Research, Digitimes Forecast Reports iPhone shipments 200M� by 2015 UHD TV sales expected to double to 32M in 2015� from 13.5M in 201414% of TV market by 2015� Apple iPhone 6 and 6+�� Larger screens = more LEDs Wearables gain traction Unit shipments to grow from 54M in 2014 to 800M in 2023 LED backlighting currently featured in certain devices� Utilization rates remain high overall, adjusting for seasonality |

�
|
|
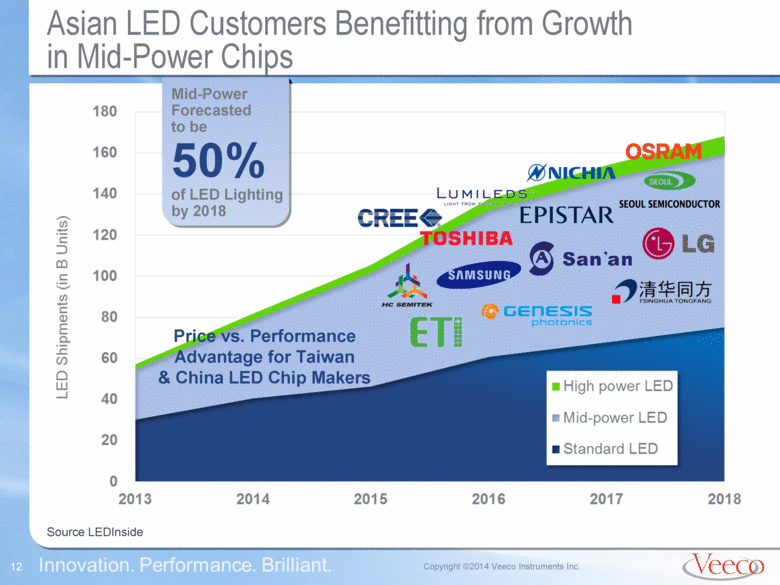
Asian LED Customers Benefitting from Growth� in Mid-Power Chips Price vs. Performance Advantage for Taiwan� & China LED Chip Makers Source LEDInside� Mid-Power Forecasted to be 50% of LED Lighting by 2018 |
�
|
|
EPIK700: Highest Productivity and Lowest Cost of Ownership MOCVD System Highest productivity platform with up to 20% improved CoO compared to previous generations Designed for best-in-class uniformity which provides greater wafer yield Fastest to production with easy process transfer Most efficient capital investment for maximum profitability� EPIK700 Surpasses Competition: More Good LEDs for Less Money� |

�
|
|
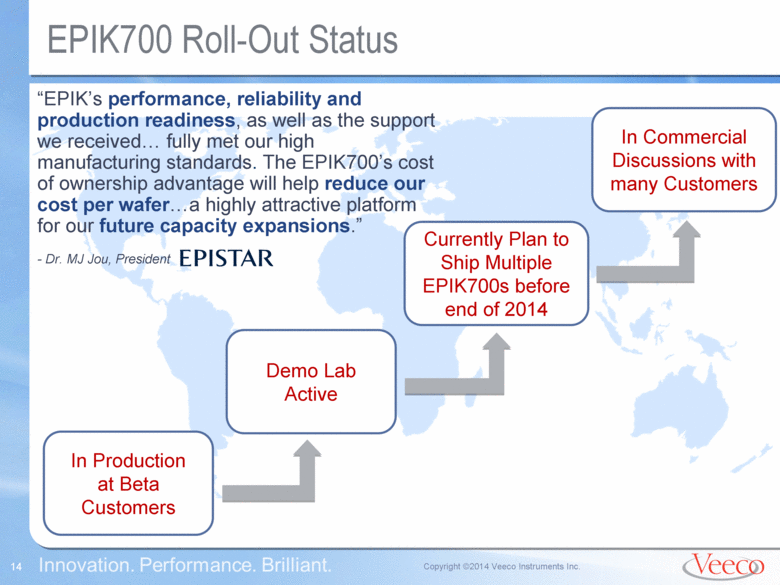
EPIK700 Roll-Out Status In Production at Beta Customers Demo Lab Active Currently Plan to Ship Multiple EPIK700s before end of 2014 In Commercial Discussions with many Customers �EPIK�s performance, reliability and production readiness, as well as the support we received fully met our high manufacturing standards. The EPIK700�s cost of ownership advantage will help reduce our cost per wafera highly attractive platform for our future capacity expansions.�� - Dr. MJ Jou, President� |
�
|
|
1� Aligning FAST-ALD Technology for Near and Longer-Term Market Growth Opportunities Engaged with Key Customer on 6G-H Process Development;� 2015 Ramp Opportunity�� OLED Mobile� Encapsulation $300-500M TAM Sell 3.5G FAST-ALD System to� OLED Panel Makers Lab Tool On-Line by Q1�15 2 OLED Display Encapsulation >$200M TAM 3� Market Validation� for New Applications Semiconductor & Other >$200M TAM |

�
|
|
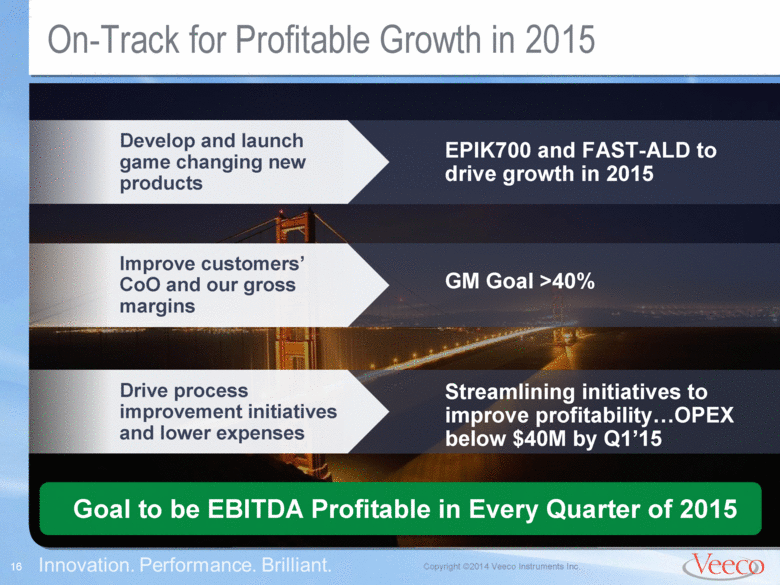
On-Track for Profitable Growth in 2015 Goal to be EBITDA Profitable in Every Quarter of 2015 Develop and launch game changing new products� EPIK700 and FAST-ALD to drive growth in 2015 GM Goal >40%�� Streamlining initiatives to� improve profitabilityOPEX below $40M by Q1�15� Improve customers� CoO and our gross margins Drive process improvement initiatives and lower expenses |
�
|
|
Q&A Session |

�
|
|
Reconciliation Tables |
�
|
|
Q3 2014 GAAP-Non-GAAP Reconciliation NOTE - This reconciliation is not in accordance with, or an alternative method for, generally accepted accounting principles in the United States ("GAAP"), and may be different from similar measures presented by other companies. Management of the Company evaluates performance of its business units based on adjusted EBITDA, which is the primary indicator used to plan and forecast future periods. The presentation of this financial measure facilitates meaningful comparison with prior periods, as management of the Company believes adjusted EBITDA reports baseline performance and thus provides useful information. |
�
|
|
Q4 2014 GAAP-Non-GAAP Guidance Reconciliation NOTE - This reconciliation is not in accordance with, or an alternative method for, generally accepted accounting principles in the United States ("GAAP"), and may be different from similar measures presented by other companies. Management of the Company evaluates performance of its business units based on adjusted EBITDA, which is the primary indicator used to plan and forecast future periods. The presentation of this financial measure facilitates meaningful comparison with prior periods, as management of the Company believes adjusted EBITDA reports baseline performance and thus provides useful information. |
�
�