
Form 8-K OWENS ILLINOIS INC /DE/ For: Oct 28
�
�
UNITED STATES
SECURITIES AND EXCHANGE COMMISSION
Washington, D.C. 20549
�
FORM�8-K
�
CURRENT REPORT
Pursuant to Section�13 OR 15(d)�of
The Securities Exchange Act of 1934
�
October�28, 2014
Date of Report (Date of earliest event reported)
�

�
OWENS-ILLINOIS,�INC.
(Exact name of registrant as specified in its charter)
�
|
Delaware |
� |
1-9576 |
� |
22-2781933 |
|
(State or other jurisdiction of incorporation) |
� |
(Commission |
� |
(IRS Employer Identification No.) |
�
|
One Michael Owens Way Perrysburg, Ohio |
� |
43551-2999 |
|
(Address of principal executive offices) |
� |
(Zip Code) |
�
(567) 336-5000
(Registrant�s telephone number, including area code)
�
�
(Former name or former address, if changed since last report)
�
Check the appropriate box if the Form�8-K filing is intended to simultaneously satisfy the filing obligation of the registrant under any of the following provisions:
�
������������ Written communications pursuant to Rule�425 under the Securities Act (17 CFR 230.425)
�
������������ Soliciting material pursuant to Rule�14a-12 under the Exchange Act (17 CFR 240.14a-12)
�
������������ Pre-commencement communications pursuant to Rule�14d-2(b)�under the Exchange Act (17 CFR 240.14d-2(b))
�
������������ Pre-commencement communications pursuant to Rule�13e-4(c)�under the Exchange Act (17 CFR 240.13e-4(c))
�
�
�
�
ITEM 2.02.�������� RESULTS OF OPERATIONS AND FINANCIAL CONDITION.
�
On October�28, 2014, Owens-Illinois,�Inc. (the �Company�) issued a press release announcing its results of operations for the quarter ended September�30, 2014.� A copy of the press release is furnished as Exhibit�99.1.� Additional financial information, posted to the Company�s web site, is furnished as Exhibit�99.2.
�
The information in this Item 2.02 of this Current Report on Form�8-K, including the exhibits, is provided under Item 2.02 of Form�8-K and shall not be deemed �filed� for the purposes of Section�18 of the Securities Exchange Act of 1934 or otherwise subject to the liabilities of that section. Furthermore, the information in this Item 2.02 of this Current Report, including the exhibits, shall not be deemed to be incorporated by reference into the filings of the registrant under the Securities Act of 1933 regardless of any general incorporation language in such filings.
�
ITEM 8.01.��������� OTHER ITEMS.
�
On October�28, 2014, the Company issued a press release announcing that the Company�s Board of Directors had increased the Company�s share repurchase program authorization to $500 million. The authorization expires on December�31, 2017 and includes approximately $85 million remaining under the current share repurchase program. A copy of the press release is attached hereto as Exhibit�99.3 and is incorporated herein by reference.
�
ITEM 9.01.������������������������������ FINANCIAL STATEMENTS AND EXHIBITS.
�
(d)�������������������������������������������������������������������������������� Exhibits.
�
|
Exhibit |
� |
Description |
|
� |
� |
� |
|
99.1 |
� |
Press Release dated October�28, 2014, announcing results of operations for the quarter ended September�30, 2014 |
|
� |
� |
� |
|
99.2 |
� |
Additional financial information � quarter ended September�30, 2014 |
|
� |
� |
� |
|
99.3 |
� |
Press Release dated October�28, 2014, announcing the $500 million share repurchase program |
�
�
SIGNATURES
�
Pursuant to the requirements of the Securities Exchange Act of 1934, the registrant has duly caused this report to be signed on its behalf by the undersigned hereunto duly authorized.
�
|
� |
OWENS-ILLINOIS,�INC. | |
|
� |
� | |
|
� |
� | |
|
Date: October�28, 2014 |
By: |
/s/ Stephen P. Bramlage,�Jr. |
|
� |
Name: |
Stephen P. Bramlage,�Jr. |
|
� |
Title: |
Senior Vice President and |
|
� |
� |
Chief Financial Officer |
�
�
EXHIBIT�INDEX
�
|
Exhibit |
� |
Description |
|
� |
� |
� |
|
99.1 |
� |
Press Release dated October�28, 2014, announcing results of operations for the quarter ended September�30, 2014 |
|
� |
� |
� |
|
99.2 |
� |
Additional financial information � quarter ended September�30, 2014 |
|
� |
� |
� |
|
99.3 |
� |
Press Release dated October�28, 2014, announcing the $500 million share repurchase program |
�
Exhibit 99.1
�

�
FOR IMMEDIATE RELEASE
�
O-I REPORTS THIRD QUARTER 2014 RESULTS
Continued gains in South America and Europe offset by
headwinds in North America and Asia Pacific
�
PERRYSBURG, Ohio (October�28, 2014) � Owens-Illinois,�Inc. (NYSE: OI) today reported financial results for the third quarter ending September�30, 2014.
�
������ Third quarter 2014 earnings from continuing operations attributable to the Company were $0.37 per share (diluted), compared with $0.79 per share in the same period of 2013. Excluding certain items management considers not representative of ongoing operations, adjusted earnings(1)�were $0.75 per share compared with $0.79 per share in the same period of 2013.
�
������ Volumes declined approximately 3 percent on a global basis year-over-year. Double-digit volume growth in South America was more than offset by declines in Europe, North America and Asia Pacific.
�
������ South America and Europe continue to generate year-on-year gains in operating profit. North America and Asia Pacific reported lower operating profit, primarily due to lower sales and production volume.
�
������ The Company agreed to enter into a joint venture and long-term supply agreement with Constellation Brands,�Inc. to supply glass for their growing beer business.
�
������ The Board of Directors authorizes $500 million in share repurchases through 2017. The Company expects to repurchase at least $100 million in shares during 2015.
�
Commenting on the Company�s third quarter results, Chairman and Chief Executive Officer Al Stroucken said, �South America performed well in the quarter on higher sales and better productivity, leading to a 45 percent increase in profitability year-over-year. Europe also turned in strong results, despite a decline in shipments. This can be attributed largely to savings generated through our European asset optimization program. In Asia Pacific, we adjusted our capacity in Australia to better match reduced levels of wine exports. North America was clearly impacted by the continued volume decline of major domestic beer brands. This was exacerbated by lower productivity at our North American facilities, which we are addressing with great focus.�
�
(1)� Adjusted earnings refers to earnings from continuing operations attributable to the Company, excluding items management does not consider representative of ongoing operations, as cited in the table entitled Reconciliation to Adjusted Earnings in this release.
�
![]()
�
�
|
� |
� |
Three�months�ended |
� |
Nine�months�ended |
� | ||||||||
|
� |
� |
September�30 |
� |
September�30 |
� | ||||||||
|
(Dollars�in�millions,�except�per�share�amounts�and�operating�profit�margin) |
� |
2014 |
� |
2013 |
� |
2014 |
� |
2013 |
� | ||||
|
Net sales |
� |
$ |
1,745 |
� |
$ |
1,784 |
� |
$ |
5,181 |
� |
$ |
5,206 |
� |
|
Segment operating profit |
� |
248 |
� |
259 |
� |
728 |
� |
752 |
� | ||||
|
Segment operating profit margin |
� |
14.3 |
% |
14.6 |
% |
14.1 |
% |
14.5 |
% | ||||
|
Earnings attributable to the Company from continuing operations |
� |
61 |
� |
132 |
� |
297 |
� |
346 |
� | ||||
|
Earnings per share from continuing operations (diluted) |
� |
$ |
0.37 |
� |
$ |
0.79 |
� |
$ |
1.79 |
� |
$ |
2.08 |
� |
|
� |
� |
� |
� |
� |
� |
� |
� |
� |
� |
� |
� |
� |
� |
|
Adjusted earnings (non-GAAP) |
� |
$ |
124 |
� |
$ |
132 |
� |
$ |
360 |
� |
$ |
366 |
� |
|
Adjusted earnings per share (non-GAAP) |
� |
$ |
0.75 |
� |
$ |
0.79 |
� |
$ |
2.17 |
� |
$ |
2.20 |
� |
�
Net sales in the third quarter of 2014 were $1.7 billion, down 2 percent from the prior year third quarter. Price was up approximately 1 percent on a global basis. The Company realized price increases in all regions except Europe, which was expected given competitive pressures. Unfavorable foreign exchange rates weighed on reported sales, especially in South America and Europe.
�
Sales volume, in terms of tonnes shipped, declined in three of the Company�s four regions, leading to a global volume decrease of 3 percent. Volume in South America increased 15 percent, driven by gains in all countries, with beer outpacing other categories. Shipments in Europe were down one percent, reflecting market weakness across all segments. Volume in North America fell 3 percent, primarily due to continued declines in the major domestic beer brands. Volume in Asia Pacific contracted 24 percent due primarily to the Company�s smaller footprint in China, as well as ongoing weak beer and wine demand in Australia.
�
Segment operating profit was $248 million, down $11 million compared with the prior year third quarter. Europe recorded a $7 million increase in operating profit, as the benefit from its improving cost position fully offset lower sales volume. South America�s operating profit increased 45 percent. Higher sales and production volumes, coupled with the lack of unfavorable events that occurred in 2013, contributed to the region�s improved performance.
�
Asia Pacific and North America reported lower operating profit in the quarter. In Australia, continued weak demand in domestic beer and in wine exports suppressed sales and production volume. The Company responded by modestly reducing capacity to improve financial returns. In North America, operating profit was dampened by lower sales and production volumes, as well as lower productivity.
�
Corporate and other costs improved by $7 million compared with prior year, primarily driven by lower pension expense.
�
Net interest expense in the quarter decreased by $1 million compared with the same period of 2013, primarily due to deleveraging efforts.
�
Commenting on the Company�s outlook for the fourth quarter, Stroucken said, �There are strong indications of market uncertainty across the globe. Despite this, we expect higher operating profit in Europe and South America, driven by increased productivity and cost savings in the quarter. Profitability in Asia Pacific and North America, however, will remain muted in the face of lower sales and production volume. We remain confident in our ability to improve our
�
�
operations, increase profitability and generate cash flow. As we approach an inflection point in our capital allocation priorities, we intend to commit a larger share of capital to our shareholders. In 2015, we will repurchase at least $100 million in shares. This is part of a three-year $500 million share repurchase program recently authorized by our Board of Directors.�
�
Based on the fourth quarter outlook, the Company now expects adjusted EPS for full year 2014 to be in the range of $2.62 to $2.72 per share. Due to the seasonality of its business, the Company generates most of its free cash flow (FCF) in the fourth quarter of the year. The strength of the US dollar is presently expected to reduce FCF, which is reported in US dollars, by approximately $30 million. As such, the Company expects FCF for 2014 to be approximately $320 million.
�
About O-I
�
Owens-Illinois,�Inc. (NYSE: OI) is the world�s largest glass container manufacturer and preferred partner for many of the world�s leading food and beverage brands. The Company had revenues of $7.0 billion in 2013 and employs approximately 22,500 people at 77 plants in 21 countries. With global headquarters in Perrysburg, Ohio, USA, O-I delivers safe, sustainable, pure, iconic, brand-building glass packaging to a growing global marketplace. For more information, visit www.o-i.com.
�
O-I�s Glass Is Life� movement promotes the widespread benefits of glass packaging in key markets around the globe. Join us in the #betteringlass conversation at www.glassislife.com.
�
Regulation G
�
The information presented above regarding adjusted net earnings relates to net earnings from continuing operations attributable to the Company exclusive of items management considers not representative of ongoing operations and does not conform to U.S. generally accepted accounting principles (GAAP). It should not be construed as an alternative to the reported results determined in accordance with GAAP. Management has included this non-GAAP information to assist in understanding the comparability of results of ongoing operations. Further, the information presented above regarding free cash flow does not conform to GAAP. Management defines free cash flow as cash provided by continuing operating activities less capital spending (both as determined in accordance with GAAP) and has included this non-GAAP information to assist in understanding the comparability of cash flows. Management uses non-GAAP information principally for internal reporting, forecasting, budgeting and calculating compensation payments. Management believes that the non-GAAP presentation allows the board of directors, management, investors and analysts to better understand the Company�s financial performance in relationship to core operating results and the business outlook.
�
The Company routinely posts important information on its website � www.o-i.com/investors.
�
Forward looking statements
�
This document contains �forward looking� statements within the meaning of Section�21E of the Securities Exchange Act of 1934 and Section�27A of the Securities Act of 1933. Forward looking statements reflect the Company�s current expectations and projections about future events at the time, and thus involve uncertainty and risk. The words �believe,� �expect,� �anticipate,� �will,� �could,� �would,� �should,� �may,� �plan,� �estimate,� �intend,� �predict,� �potential,� �continue,� and the negatives of these words and other similar expressions generally identify forward looking statements. It is possible the Company�s future financial performance may differ from expectations due to a variety of factors including, but not limited to the following: (1)�foreign currency fluctuations relative to the U.S. dollar, specifically the Euro, Brazilian real and
�
�
Australian dollar, (2)�changes in capital availability or cost, including interest rate fluctuations and the ability of the Company to refinance debt at favorable terms, (3)�the general political, economic and competitive conditions in markets and countries where the Company has operations, including uncertainties related to economic and social conditions, disruptions in capital markets, disruptions in the supply chain, competitive pricing pressures, inflation or deflation, and changes in tax rates and laws, (4)�consumer preferences for alternative forms of packaging, (5)�cost and availability of raw materials, labor, energy and transportation, (6)�the Company�s ability to manage its cost structure, including its success in implementing restructuring plans and achieving cost savings, (7)�consolidation among competitors and customers, (8)�the ability of the Company to acquire businesses and expand plants, integrate operations of acquired businesses and achieve expected synergies, (9)�unanticipated expenditures with respect to environmental, safety and health laws, (10)�the Company�s ability to further develop its sales, marketing and product development capabilities, and (11) the timing and occurrence of events which are beyond the control of the Company, including any expropriation of the Company�s operations, floods and other natural disasters, events related to asbestos-related claims, and the other risk factors discussed in the Company�s Annual Report on Form�10-K for the year ended December�31, 2013 and any subsequently filed Quarterly Report on Form�10-Q. It is not possible to foresee or identify all such factors. Any forward looking statements in this document are based on certain assumptions and analyses made by the Company in light of its experience and perception of historical trends, current conditions, expected future developments, and other factors it believes are appropriate in the circumstances. Forward looking statements are not a guarantee of future performance and actual results or developments may differ materially from expectations. While the Company continually reviews trends and uncertainties affecting the Company�s results of operations and financial condition, the Company does not assume any obligation to update or supplement any particular forward looking statements contained in this document.
�
Conference call scheduled for October�29, 2014
O-I CEO Al Stroucken and CFO Steve Bramlage will conduct a conference call to discuss the Company�s latest results on Wednesday, October�29, 2014, at 8:00�a.m., Eastern Time. A live webcast of the conference call, including presentation materials, will be available on the O-I website, www.o-i.com/investors, in the Presentations�& Webcast section.
�
The conference call also may be accessed by dialing 888-733-1701 (U.S. and Canada) or 706-634-4943 (international) by 7:50�a.m., Eastern Time, on October�29. Ask for the O-I conference call. A replay of the call will be available on the O-I website, www.o-i.com/investors, for a year following the call.
�
|
Contact: |
Sasha Sekpeh, 567-336-5128 � O-I Investor Relations |
|
� |
Lisa Babington, 567-336-1445 � O-I Corporate Communications |
�
O-I news releases are available on the O-I website at www.o-i.com.
�
O-I�s fourth quarter 2014 earnings conference call is currently scheduled for Tuesday, February�3, 2015, at 8:00�a.m., Eastern Time.
�
�
OWENS-ILLINOIS,�INC.
Condensed Consolidated Results of Operations
(Dollars in millions, except per share amounts)
�
|
� |
� |
Three�months�ended |
� |
Nine�months�ended |
� | ||||||||
|
Unaudited |
� |
2014 |
� |
2013 |
� |
2014 |
� |
2013 |
� | ||||
|
� |
� |
� |
� |
� |
� |
� |
� |
� |
� | ||||
|
Net sales |
� |
$ |
1,745 |
� |
$ |
1,784 |
� |
$ |
5,181 |
� |
$ |
5,206 |
� |
|
Cost of goods sold |
� |
(1,408 |
) |
(1,432 |
) |
(4,165 |
) |
(4,166 |
) | ||||
|
� |
� |
� |
� |
� |
� |
� |
� |
� |
� | ||||
|
Gross profit |
� |
337 |
� |
352 |
� |
1,016 |
� |
1,040 |
� | ||||
|
� |
� |
� |
� |
� |
� |
� |
� |
� |
� | ||||
|
Selling and administrative expense |
� |
(118 |
) |
(119 |
) |
(382 |
) |
(377 |
) | ||||
|
Research, development and engineering expense |
� |
(15 |
) |
(15 |
) |
(47 |
) |
(45 |
) | ||||
|
Interest expense, net |
� |
(53 |
) |
(54 |
) |
(161 |
) |
(178 |
) | ||||
|
Equity earnings |
� |
13 |
� |
16 |
� |
48 |
� |
49 |
� | ||||
|
Other expense, net |
� |
(73 |
) |
(2 |
) |
(70 |
) |
(17 |
) | ||||
|
� |
� |
� |
� |
� |
� |
� |
� |
� |
� | ||||
|
Earnings from continuing operations before income taxes |
� |
91 |
� |
178 |
� |
404 |
� |
472 |
� | ||||
|
� |
� |
� |
� |
� |
� |
� |
� |
� |
� | ||||
|
Provision for income taxes |
� |
(23 |
) |
(40 |
) |
(89 |
) |
(110 |
) | ||||
|
� |
� |
� |
� |
� |
� |
� |
� |
� |
� | ||||
|
Earnings from continuing operations |
� |
68 |
� |
138 |
� |
315 |
� |
362 |
� | ||||
|
� |
� |
� |
� |
� |
� |
� |
� |
� |
� | ||||
|
Loss from discontinued operations |
� |
(1 |
) |
(2 |
) |
(22 |
) |
(15 |
) | ||||
|
� |
� |
� |
� |
� |
� |
� |
� |
� |
� | ||||
|
Net earnings |
� |
67 |
� |
136 |
� |
293 |
� |
347 |
� | ||||
|
� |
� |
� |
� |
� |
� |
� |
� |
� |
� | ||||
|
Net earnings attributable to noncontrolling interests |
� |
(7 |
) |
(6 |
) |
(18 |
) |
(16 |
) | ||||
|
� |
� |
� |
� |
� |
� |
� |
� |
� |
� | ||||
|
Net earnings attributable to the Company |
� |
$ |
60 |
� |
$ |
130 |
� |
$ |
275 |
� |
$ |
331 |
� |
|
� |
� |
� |
� |
� |
� |
� |
� |
� |
� | ||||
|
Amounts attributable to the Company: |
� |
� |
� |
� |
� |
� |
� |
� |
� | ||||
|
Earnings from continuing operations |
� |
$ |
61 |
� |
$ |
132 |
� |
$ |
297 |
� |
$ |
346 |
� |
|
Loss from discontinued operations |
� |
(1 |
) |
(2 |
) |
(22 |
) |
(15 |
) | ||||
|
Net earnings |
� |
$ |
60 |
� |
$ |
130 |
� |
$ |
275 |
� |
$ |
331 |
� |
|
� |
� |
� |
� |
� |
� |
� |
� |
� |
� | ||||
|
Basic earnings per share: |
� |
� |
� |
� |
� |
� |
� |
� |
� | ||||
|
Earnings from continuing operations |
� |
$ |
0.37 |
� |
$ |
0.80 |
� |
$ |
1.80 |
� |
$ |
2.10 |
� |
|
Loss from discontinued operations |
� |
� |
� |
(0.01 |
) |
(0.13 |
) |
(0.09 |
) | ||||
|
Net earnings |
� |
$ |
0.37 |
� |
$ |
0.79 |
� |
$ |
1.67 |
� |
$ |
2.01 |
� |
|
� |
� |
� |
� |
� |
� |
� |
� |
� |
� | ||||
|
Weighted average shares outstanding (thousands) |
� |
164,798 |
� |
164,546 |
� |
164,821 |
� |
164,330 |
� | ||||
|
� |
� |
� |
� |
� |
� |
� |
� |
� |
� | ||||
|
Diluted earnings per share: |
� |
� |
� |
� |
� |
� |
� |
� |
� | ||||
|
Earnings from continuing operations |
� |
$ |
0.37 |
� |
$ |
0.79 |
� |
$ |
1.79 |
� |
$ |
2.08 |
� |
|
Loss from discontinued operations |
� |
� |
� |
(0.01 |
) |
(0.13 |
) |
(0.09 |
) | ||||
|
Net earnings |
� |
$ |
0.37 |
� |
$ |
0.78 |
� |
$ |
1.66 |
� |
$ |
1.99 |
� |
|
� |
� |
� |
� |
� |
� |
� |
� |
� |
� | ||||
|
Diluted average shares (thousands) |
� |
166,138 |
� |
165,981 |
� |
166,187 |
� |
165,739 |
� | ||||
�
�
OWENS-ILLINOIS,�INC.
Condensed Consolidated Balance Sheets
(Dollars in millions)
�
|
Unaudited |
� |
September�30, |
� |
December�31, |
� |
September�30, |
� | |||
|
� |
� |
� |
� |
� |
� |
� |
� | |||
|
Assets |
� |
� |
� |
� |
� |
� |
� | |||
|
Current assets: |
� |
� |
� |
� |
� |
� |
� | |||
|
Cash and cash equivalents |
� |
$ |
264 |
� |
$ |
383 |
� |
$ |
219 |
� |
|
Receivables |
� |
1,042 |
� |
943 |
� |
1,172 |
� | |||
|
Inventories |
� |
1,112 |
� |
1,117 |
� |
1,178 |
� | |||
|
Prepaid expenses |
� |
105 |
� |
107 |
� |
103 |
� | |||
|
Total current assets |
� |
2,523 |
� |
2,550 |
� |
2,672 |
� | |||
|
� |
� |
� |
� |
� |
� |
� |
� | |||
|
Property, plant and equipment, net |
� |
2,499 |
� |
2,632 |
� |
2,657 |
� | |||
|
Goodwill |
� |
1,960 |
� |
2,059 |
� |
2,059 |
� | |||
|
Other assets |
� |
1,176 |
� |
1,178 |
� |
1,084 |
� | |||
|
� |
� |
� |
� |
� |
� |
� |
� | |||
|
Total assets |
� |
$ |
8,158 |
� |
$ |
8,419 |
� |
$ |
8,472 |
� |
|
� |
� |
� |
� |
� |
� |
� |
� | |||
|
Liabilities and Share Owners� Equity |
� |
� |
� |
� |
� |
� |
� | |||
|
Current liabilities: |
� |
� |
� |
� |
� |
� |
� | |||
|
Short-term loans and long-term debt due within one year |
� |
$ |
1,067 |
� |
$ |
322 |
� |
$ |
366 |
� |
|
Current portion of asbestos-related liabilities |
� |
150 |
� |
150 |
� |
155 |
� | |||
|
Accounts payable |
� |
1,027 |
� |
1,144 |
� |
989 |
� | |||
|
Other liabilities |
� |
544 |
� |
638 |
� |
577 |
� | |||
|
Total current liabilities |
� |
2,788 |
� |
2,254 |
� |
2,087 |
� | |||
|
� |
� |
� |
� |
� |
� |
� |
� | |||
|
Long-term debt |
� |
2,434 |
� |
3,245 |
� |
3,298 |
� | |||
|
Asbestos-related liabilities |
� |
226 |
� |
298 |
� |
198 |
� | |||
|
Other long-term liabilities |
� |
887 |
� |
1,019 |
� |
1,512 |
� | |||
|
Share owners� equity |
� |
1,823 |
� |
1,603 |
� |
1,377 |
� | |||
|
� |
� |
� |
� |
� |
� |
� |
� | |||
|
Total liabilities and share owners� equity |
� |
$ |
8,158 |
� |
$ |
8,419 |
� |
$ |
8,472 |
� |
�
�
OWENS-ILLINOIS,�INC.
Condensed Consolidated Cash Flows
(Dollars in millions)
�
|
� |
� |
Nine�months�ended |
� | ||||
|
Unaudited |
� |
2014 |
� |
2013 |
� | ||
|
Cash flows from operating activities: |
� |
� |
� |
� |
� | ||
|
Net earnings |
� |
$ |
293 |
� |
$ |
347 |
� |
|
Loss from discontinued operations |
� |
22 |
� |
15 |
� | ||
|
Non-cash charges |
� |
� |
� |
� |
� | ||
|
Depreciation and amortization |
� |
342 |
� |
321 |
� | ||
|
Pension expense |
� |
38 |
� |
77 |
� | ||
|
Restructuring, asset impairment and related charges |
� |
79 |
� |
10 |
� | ||
|
Cash Payments |
� |
� |
� |
� |
� | ||
|
Pension contributions |
� |
(25 |
) |
(23 |
) | ||
|
Asbestos-related payments |
� |
(72 |
) |
(108 |
) | ||
|
Cash paid for restructuring activities |
� |
(45 |
) |
(54 |
) | ||
|
Change in components of working capital |
� |
(312 |
) |
(309 |
) | ||
|
Other, net (a) |
� |
(111 |
) |
(27 |
) | ||
|
Cash provided by continuing operating activities |
� |
209 |
� |
249 |
� | ||
|
Cash utilized in discontinued operating activities |
� |
(22 |
) |
(7 |
) | ||
|
Total cash provided by operating activities |
� |
187 |
� |
242 |
� | ||
|
� |
� |
� |
� |
� |
� | ||
|
Cash flows from investing activities: |
� |
� |
� |
� |
� | ||
|
Additions to property, plant and equipment |
� |
(290 |
) |
(239 |
) | ||
|
Other, net |
� |
23 |
� |
(10 |
) | ||
|
Cash utilized in investing activities |
� |
(267 |
) |
(249 |
) | ||
|
� |
� |
� |
� |
� |
� | ||
|
Cash flows from financing activities: |
� |
� |
� |
� |
� | ||
|
Changes in borrowings, net |
� |
17 |
� |
(159 |
) | ||
|
Issuance of common stock |
� |
5 |
� |
22 |
� | ||
|
Treasury shares purchased |
� |
(12 |
) |
(20 |
) | ||
|
Distributions to noncontrolling interests |
� |
(37 |
) |
(21 |
) | ||
|
Other, net |
� |
(2 |
) |
(20 |
) | ||
|
Cash utilized in financing activities |
� |
(29 |
) |
(198 |
) | ||
|
Effect of exchange rate fluctuations on cash |
� |
(10 |
) |
(7 |
) | ||
|
Decrease in cash |
� |
(119 |
) |
(212 |
) | ||
|
Cash at beginning of period |
� |
383 |
� |
431 |
� | ||
|
Cash at end of period |
� |
$ |
264 |
� |
$ |
219 |
� |
�
(a)���� Other, net includes other non cash charges plus other changes in non-current assets and liabilities.��������
�
�
OWENS-ILLINOIS,�INC.
Reportable Segment Information
(Dollars in millions)
�
|
� |
� |
Three�months�ended |
� |
Nine�months�ended |
� | ||||||||
|
Unaudited |
� |
2014 |
� |
2013 |
� |
2014 |
� |
2013 |
� | ||||
|
Net sales: |
� |
� |
� |
� |
� |
� |
� |
� |
� | ||||
|
Europe |
� |
$ |
709 |
� |
$ |
733 |
� |
$ |
2,205 |
� |
$ |
2,129 |
� |
|
North America |
� |
517 |
� |
529 |
� |
1,543 |
� |
1,525 |
� | ||||
|
South America |
� |
313 |
� |
282 |
� |
826 |
� |
820 |
� | ||||
|
Asia Pacific |
� |
197 |
� |
236 |
� |
584 |
� |
714 |
� | ||||
|
Reportable segment totals |
� |
1,736 |
� |
1,780 |
� |
5,158 |
� |
5,188 |
� | ||||
|
� |
� |
� |
� |
� |
� |
� |
� |
� |
� | ||||
|
Other |
� |
9 |
� |
4 |
� |
23 |
� |
18 |
� | ||||
|
Net sales |
� |
$ |
1,745 |
� |
$ |
1,784 |
� |
$ |
5,181 |
� |
$ |
5,206 |
� |
|
� |
� |
� |
� |
� |
� |
� |
� |
� |
� | ||||
|
Segment operating profit (a): |
� |
� |
� |
� |
� |
� |
� |
� |
� | ||||
|
� |
� |
� |
� |
� |
� |
� |
� |
� |
� | ||||
|
Europe |
� |
$ |
104 |
� |
$ |
97 |
� |
$ |
300 |
� |
$ |
267 |
� |
|
North America |
� |
66 |
� |
87 |
� |
214 |
� |
254 |
� | ||||
|
South America |
� |
61 |
� |
42 |
� |
155 |
� |
132 |
� | ||||
|
Asia Pacific |
� |
17 |
� |
33 |
� |
59 |
� |
99 |
� | ||||
|
� |
� |
� |
� |
� |
� |
� |
� |
� |
� | ||||
|
Reportable segment totals |
� |
248 |
� |
259 |
� |
728 |
� |
752 |
� | ||||
|
� |
� |
� |
� |
� |
� |
� |
� |
� |
� | ||||
|
Items excluded from segment operating profit: |
� |
� |
� |
� |
� |
� |
� |
� |
� | ||||
|
Retained corporate costs and other |
� |
(20 |
) |
(27 |
) |
(79 |
) |
(92 |
) | ||||
|
Items not considered representative of ongoing operations (b) |
� |
(84 |
) |
� |
� |
(84 |
) |
(10 |
) | ||||
|
� |
� |
� |
� |
� |
� |
� |
� |
� |
� | ||||
|
Interest expense, net |
� |
(53 |
) |
(54 |
) |
(161 |
) |
(178 |
) | ||||
|
Earnings from continuing operations before income taxes |
� |
$ |
91 |
� |
$ |
178 |
� |
$ |
404 |
� |
$ |
472 |
� |
|
� |
� |
� |
� |
� |
� |
� |
� |
� |
� | ||||
|
Segment operating profit margin (c): |
� |
� |
� |
� |
� |
� |
� |
� |
� | ||||
|
� |
� |
� |
� |
� |
� |
� |
� |
� |
� | ||||
|
Europe |
� |
14.7 |
% |
13.2 |
% |
13.6 |
% |
12.5 |
% | ||||
|
North America |
� |
12.8 |
% |
16.4 |
% |
13.9 |
% |
16.7 |
% | ||||
|
South America |
� |
19.5 |
% |
14.9 |
% |
18.8 |
% |
16.1 |
% | ||||
|
Asia Pacific |
� |
8.6 |
% |
14.0 |
% |
10.1 |
% |
13.9 |
% | ||||
|
� |
� |
� |
� |
� |
� |
� |
� |
� |
� | ||||
|
Reportable segment margin totals |
� |
14.3 |
% |
14.6 |
% |
14.1 |
% |
14.5 |
% | ||||
�
(a)������������� Segment operating profit consists of consolidated earnings before interest income, interest expense, and provision for income taxes and excludes amounts related to certain items that management considers not representative of ongoing operations as well as certain retained corporate costs.�
�
The Company presents information on segment operating profit because management believes that it provides investors with a measure of operating performance separate from the level of indebtedness or other related costs of capital.� The most directly comparable GAAP financial measure to segment operating profit is earnings from continuing operations before income taxes.� The Company presents segment operating profit because management uses the measure, in combination with net sales and selected cash flow information, to evaluate performance and to allocate resources.�
�
(b)������������� Reference reconciliation to adjusted earnings.
�
(c)�������������� Segment operating profit margin is segment operating profit divided by segment sales.
�
�
OWENS-ILLINOIS,�INC.
Reconciliation to Adjusted Earnings
(Dollars in millions, except per share amounts)
�
The reconciliation below describes the items that management considers not representative of ongoing operations.
�
|
� |
� |
Three�months�ended |
� |
Nine�months�ended |
� | ||||||||
|
Unaudited |
� |
2014 |
� |
2013 |
� |
2014 |
� |
2013 |
� | ||||
|
� |
� |
� |
� |
� |
� |
� |
� |
� |
� | ||||
|
Earnings from continuing operations attributable to the Company |
� |
$ |
61 |
� |
$ |
132 |
� |
$ |
297 |
� |
$ |
346 |
� |
|
Items impacting cost of goods sold: |
� |
� |
� |
� |
� |
� |
� |
� |
� | ||||
|
Restructuring, asset impairment and related charges |
� |
8 |
� |
� |
� |
8 |
� |
� |
� | ||||
|
Items impacting equity earnings |
� |
5 |
� |
� |
� |
5 |
� |
� |
� | ||||
|
Items impacting other expense, net: |
� |
� |
� |
� |
� |
� |
� |
� |
� | ||||
|
Restructuring, asset impairment and related charges |
� |
71 |
� |
� |
� |
71 |
� |
10 |
� | ||||
|
Items impacting interest expense: |
� |
� |
� |
� |
� |
� |
� |
� |
� | ||||
|
Charges for note repurchase premiums and write-off of finance fees |
� |
� |
� |
� |
� |
� |
� |
11 |
� | ||||
|
Items impacting income tax: |
� |
� |
� |
� |
� |
� |
� |
� |
� | ||||
|
Net benefit for income tax on items above |
� |
(20 |
) |
� |
� |
(20 |
) |
(1 |
) | ||||
|
Items impacting net earnings (loss) attributable to noncontrolling interests: |
� |
� |
� |
� |
� |
� |
� |
� |
� | ||||
|
Net impact of noncontrolling interests on items above |
� |
(1 |
) |
� |
� |
(1 |
) |
� |
� | ||||
|
Total adjusting items |
� |
63 |
� |
� |
� |
63 |
� |
20 |
� | ||||
|
� |
� |
� |
� |
� |
� |
� |
� |
� |
� | ||||
|
Adjusted earnings |
� |
$ |
124 |
� |
$ |
132 |
� |
$ |
360 |
� |
$ |
366 |
� |
|
� |
� |
� |
� |
� |
� |
� |
� |
� |
� | ||||
|
Diluted average shares (thousands) |
� |
166,138 |
� |
165,981 |
� |
166,187 |
� |
165,739 |
� | ||||
|
� |
� |
� |
� |
� |
� |
� |
� |
� |
� | ||||
|
Earnings per share from continuing operations (diluted) |
� |
$ |
0.37 |
� |
$ |
0.79 |
� |
$ |
1.79 |
� |
$ |
2.08 |
� |
|
Adjusted earnings per share |
� |
$ |
0.75 |
� |
$ |
0.79 |
� |
$ |
2.17 |
� |
$ |
2.20 |
� |
�
Exhibit 99.2
�
|
|
O-I Third Quarter 2014 Earnings Presentation October 29, 2014 |

�
|
|
Safe Harbor Comments Regulation G The information presented here regarding adjusted net earnings relates to net earnings from continuing operations attributable to the Company exclusive of items management considers not representative of ongoing operations and does not conform to U.S. generally accepted accounting principles (GAAP). It should not be construed as an alternative to the reported results determined in accordance with GAAP. Management has included this non-GAAP information to assist in understanding the comparability of results of ongoing operations. Further, the information presented here regarding free cash flow does not conform to GAAP. Management defines free cash flow as cash provided by continuing operating activities less capital spending (both as determined in accordance with GAAP) and has included this non-GAAP information to assist in understanding the comparability of cash flows. Management uses non-GAAP information principally for internal reporting, forecasting, budgeting and calculating compensation payments. Management believes that the non-GAAP presentation allows the board of directors, management, investors and analysts to better understand the Company�s financial performance in relationship to core operating results and the business outlook. Forward Looking Statements This document contains "forward looking" statements within the meaning of Section 21E of the Securities Exchange Act of 1934 and Section 27A of the Securities Act of 1933. Forward looking statements reflect the Company's current expectations and projections about future events at the time, and thus involve uncertainty and risk. The words �believe,� �expect,� �anticipate,� �will,� �could,� �would,� �should,� �may,� �plan,� �estimate,� �intend,� �predict,� �potential,� �continue,� and the negatives of these words and other similar expressions generally identify forward looking statements. It is possible the Company's future financial performance may differ from expectations due to a variety of factors including, but not limited to the following: (1) foreign currency fluctuations relative to the U.S. dollar, specifically the Euro, Brazilian Real and Australian Dollar, (2) changes in capital availability or cost, including interest rate fluctuations and the ability of the Company to refinance debt at favorable terms, (3) the general political, economic and competitive conditions in markets and countries where the Company has operations, including uncertainties related to economic and social conditions, disruptions in capital markets, disruptions in the supply chain, competitive pricing pressures, inflation or deflation, and changes in tax rates and laws, (4) consumer preferences for alternative forms of packaging, (5) cost and availability of raw materials, labor, energy and transportation, (6) the Company�s ability to manage its cost structure, including its success in implementing restructuring plans and achieving cost savings, (7) consolidation among competitors and customers, (8) the ability of the Company to acquire businesses and expand plants, integrate operations of acquired businesses and achieve expected synergies, (9) unanticipated expenditures with respect to environmental, safety and health laws, (10) the Company�s ability to further develop its sales, marketing and product development capabilities, and (11) the timing and occurrence of events which are beyond the control of the Company, including any expropriation of the Company�s operations, floods and other natural disasters, events related to asbestos-related claims, and the other risk factors discussed in the Company�s Annual Report on Form 10-K for the year ended December 31, 2013 and any subsequently filed Annual Report on Form 10-K or Quarterly Report on Form 10-Q. It is not possible to foresee or identify all such factors. Any forward looking statements in this document are based on certain assumptions and analyses made by the Company in light of its experience and perception of historical trends, current conditions, expected future developments, and other factors it believes are appropriate in the circumstances. Forward looking statements are not a guarantee of future performance and actual results or developments may differ materially from expectations. While the Company continually reviews trends and uncertainties affecting the Company's results of operations and financial condition, the Company does not assume any obligation to update or supplement any particular forward looking statements contained in this document. Presentation Note Unless otherwise noted, the information presented in this presentation reflects continuing operations only. 1 |

�
|
|
Third Quarter 2014 Summary 2 Adjusted EPS of $0.75 Down 5% from prior year Shipments down ~3% Double-digit growth in South America offset by declines elsewhere Mixed results in segment operating profit South America increase due to strong, broad-based growth in beer Europe gains driven by asset optimization program North America impacted by volume decline and lower productivity Asia Pacific contraction driven by continued weak demand in Australia Agreement to partner with Constellation Brands, Inc. in Mexico |

�
|
|
O-I to supply Constellation with glass to support growing beer business O-I to help supply Constellation�s (CBI) glass needs in Mexico O-I and CBI to form 50-50 joint venture that will: Purchase glass container plant adjacent to CBI�s brewery Expand the plant from one furnace to four Supply approximately half of the Mexican brewery�s needs O-I to enter into additional long-term supply agreement with CBI Favorable financial implications of these transactions expected Low risk investment Accretive to earnings in 2016 Exceeds cost of capital 3 |

�
|
|
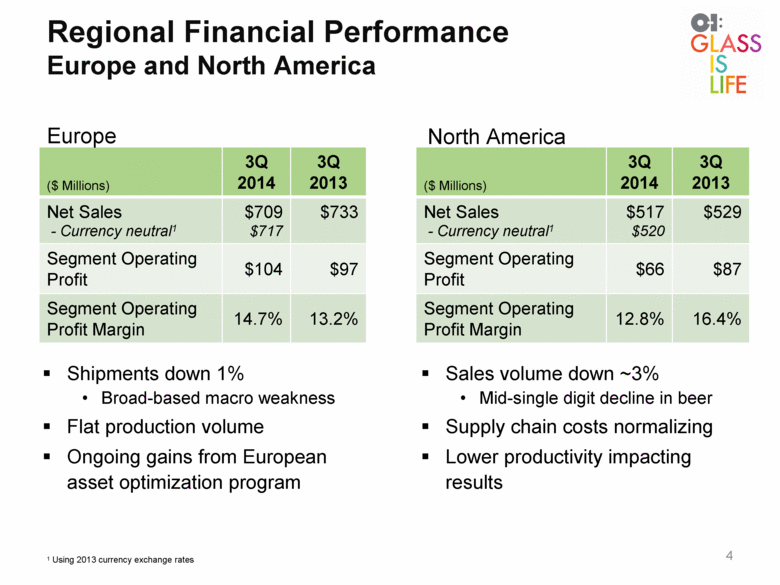
Regional Financial Performance Europe and North America 4 Shipments down 1% Broad-based macro weakness Flat production volume Ongoing gains from European asset optimization program North America ($�Millions) 3Q 2014 3Q 2013 Net Sales - Currency neutral1 $709 $717 $733 Segment Operating Profit $104 $97 Segment Operating Profit Margin 14.7% 13.2% ($�Millions) 3Q 2014 3Q 2013 Net Sales - Currency neutral1 $517 $520 $529 Segment Operating Profit $66 $87 Segment Operating Profit Margin 12.8% 16.4% Europe Sales volume down ~3% Mid-single digit decline in beer Supply chain costs normalizing Lower productivity impacting results 1 Using 2013 currency exchange rates |
�
|
|
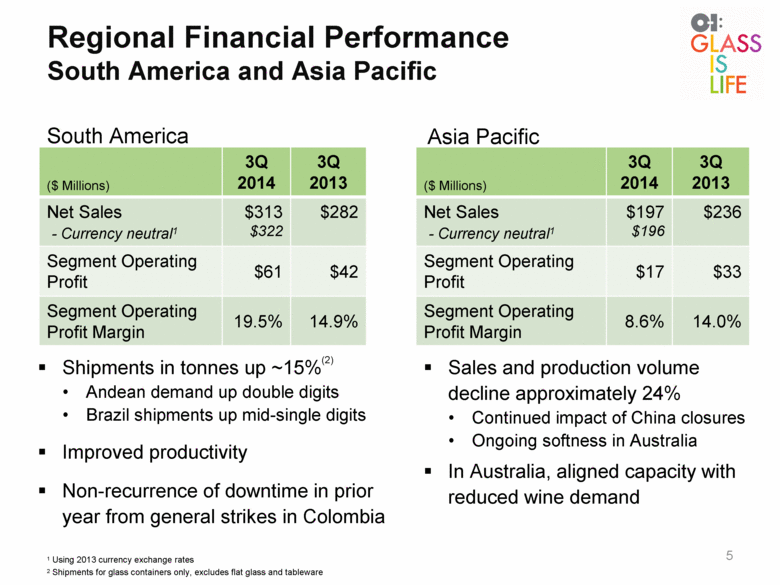
Regional Financial Performance South America and Asia Pacific 5 Shipments in tonnes up ~15%(2) Andean demand up double digits Brazil shipments up mid-single digits Improved productivity Non-recurrence of downtime in prior year from general strikes in Colombia Asia Pacific ($�Millions) 3Q 2014 3Q 2013 Net Sales - Currency neutral1 $313 $322 $282 Segment Operating Profit $61 $42 Segment Operating Profit Margin 19.5% 14.9% ($�Millions) 3Q 2014 3Q 2013 Net Sales - Currency neutral1 $197 $196 $236 Segment Operating Profit $17 $33 Segment Operating Profit Margin 8.6% 14.0% South America Sales and production volume decline approximately 24% Continued impact of China closures Ongoing softness in Australia In Australia, aligned capacity with reduced wine demand 1 Using 2013 currency exchange rates 2 Shipments for glass containers only, excludes flat glass and tableware |
�
|
|
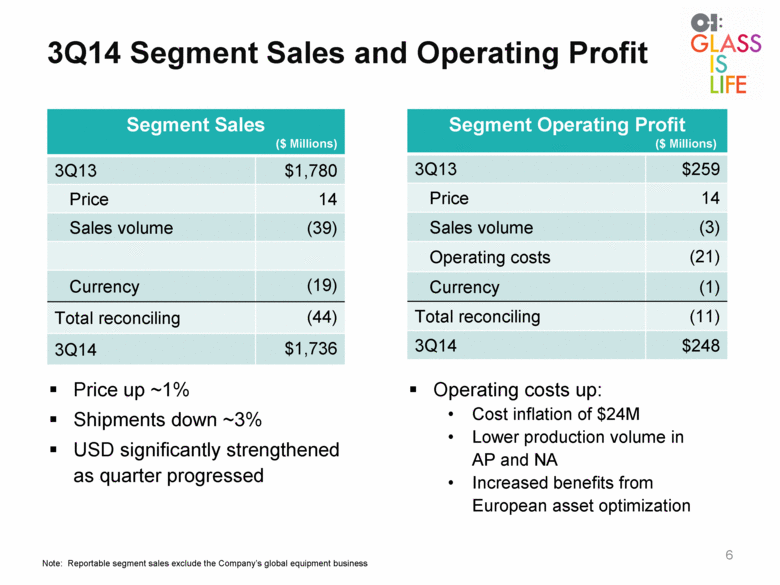
3Q14 Segment Sales and Operating Profit 6 Note: Reportable segment sales exclude the Company�s global equipment business Price up ~1% Shipments down ~3% USD significantly strengthened as quarter progressed Segment Sales ($�Millions) 3Q13 $1,780 Price 14 Sales volume (39) Currency (19) Total reconciling (44) 3Q14 $1,736 Segment Operating Profit ($�Millions) 3Q13 $259 Price 14 Sales volume (3) Operating costs (21) Currency (1) Total reconciling (11) 3Q14 $248 Operating costs up: Cost inflation of $24M Lower production volume in AP and NA Increased benefits from European asset optimization |
�
|
|
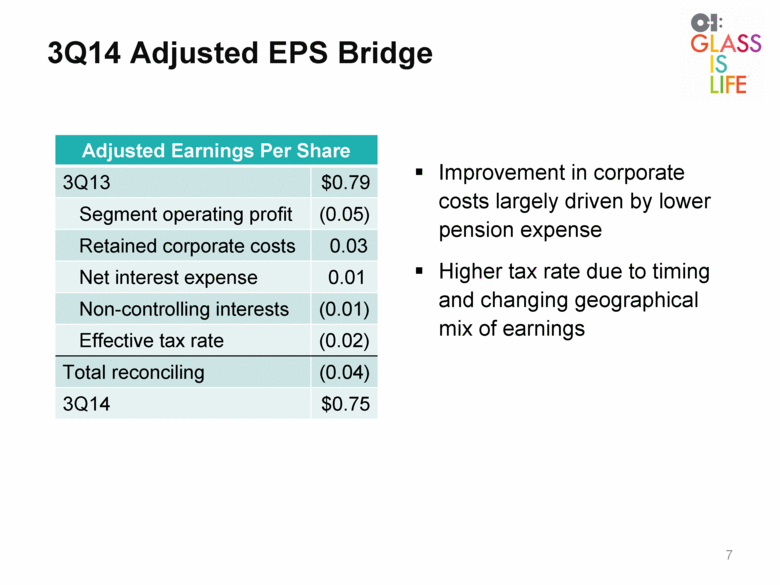
3Q14 Adjusted EPS Bridge 7 Adjusted Earnings Per Share 3Q13 $0.79 Segment operating profit (0.05) Retained corporate costs 0.03 Net interest expense 0.01 Non-controlling interests (0.01) Effective tax rate (0.02) Total reconciling (0.04) 3Q14 $0.75 Improvement in corporate costs largely driven by lower pension expense Higher tax rate due to timing and changing geographical mix of earnings |
�
|
|
4Q 2014 Business Outlook 8 Operational 4Q14 vs. 4Q13 Europe Sales volume flat Continuing benefits from asset optimization FX headwind North America Sales volume down mid-single digits Production curtailments to manage inventory South America Sales volume flat, with uncertainty in Brazil Improved productivity offset to FX headwind Asia Pacific Double-digit volume decline: China and Australia FX headwind Non-Operational 4Q14 vs. 4Q13 Corporate and Other Costs Corporate improvement (pension and incentive comp.) Offset by ~27% tax rate in 4Q (FY14 still ~23%) Net Income 4Q14 vs. 4Q13 Adjusted Earnings $0.45-$0.55, impacted by ~$0.05 FX headwind Full year 2014 Free Cash Flow ~$320M; FX headwind of ~$30M vs prior guidance |

�
|
|
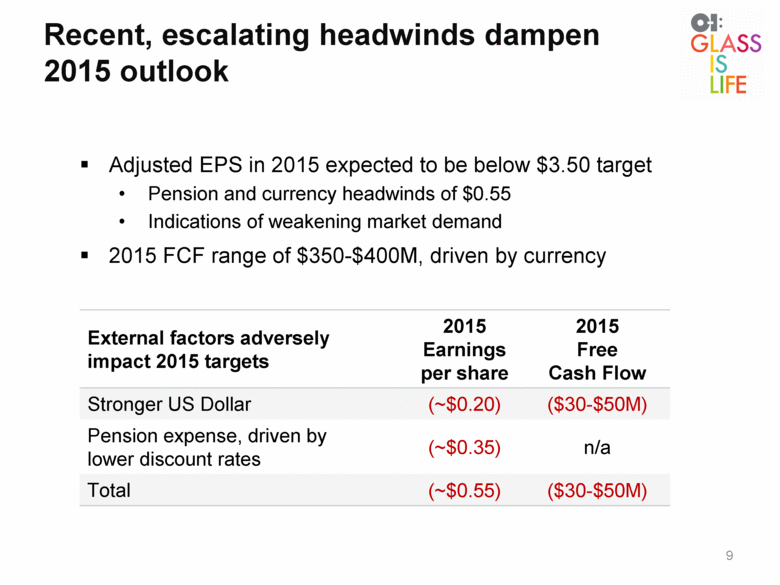
Recent, escalating headwinds dampen 2015 outlook 9 External factors adversely impact 2015 targets 2015 Earnings per share 2015 Free Cash Flow Stronger US Dollar (~$0.20) ($30-$50M) Pension expense, driven by lower discount rates (~$0.35) n/a Total (~$0.55) ($30-$50M) Adjusted EPS in 2015 expected to be below $3.50 target Pension and currency headwinds of $0.55 Indications of weakening market demand 2015 FCF range of $350-$400M, driven by currency |
�
|
|
Balanced approach to use of cash 10 Capital Investment Capital Allocation |

�
|
|
Appendix 11 |

�
|
|
Price, Volume and Currency Impact on Reportable Segment Sales 12 1 Sales negatively impacted by shut down of non-strategic flat glass business in 4Q13 2 Reportable segment sales exclude the Company�s global equipment business $�Millions Europe North America South America 1 Asia Pacific Total 2 3Q13 Segment Sales $733 $529 $282 $236 $1,780 Price (11) 11 9 5 14 Volume (5) (20) 31 (45) (39) Currency (8) (3) (9) 1 (19) Total reconciling (24) (12) 31 (39) (44) 3Q14 Segment Sales $709 $517 $313 $197 $1,736 |

�
|
|
Reconciliation to Adjusted Earnings 13 $�Millions The reconciliation below describes the items that management considers not representative of ongoing operations. Unaudited 2014 2013 2014 2013 61 $�132 $�297 $�346 $�Restructuring, asset impairment and related charges 8 8 5 5 Restructuring, asset impairment and related charges 71 71 10 Charges for note repurchase premiums and write-off of finance fees 11 Items impacting income tax: Net benefit for income tax on items above (20) (20) (1) Items impacting net earnings (loss) attributable to noncontrolling interests: Net impact of noncontrolling interests on items above (1) (1) Total adjusting items 63 - 63 20 Adjusted earnings 124 $�132 $�360 $�366 $�166,138 165,981 166,187 165,739 Earnings per share from continuing operations (diluted) 0.37 $�0.79 $�1.79 $�2.08 $�Adjusted earnings per share 0.75 $�0.79 $�2.17 $�2.20 $�Items impacting other expense, net: Items impacting interest expense: Diluted average shares (thousands) Nine months ended September 30 Earnings from continuing operations attributable to the Company Three months ended September 30 Items impacting equity earnings Items impacting cost of goods sold: |

�
�
Exhibit 99.3
�

�
FOR IMMEDIATE RELEASE
�
|
For more information, contact: |
� |
|
David Johnson |
Lisa Babington |
|
Vice President,�Investor Relations |
Director, Corporate Communications |
|
Perrysburg, Ohio, US |
Perrysburg, Ohio, US |
|
567 336 2600 |
567 336 1445 |
�
O-I Expands Its Stock Repurchase Program
Board Approves $500 Million of Future Share Repurchases
�
PERRYSBURG, Ohio (October�28, 2014) � Owens-Illinois,�Inc. (NYSE: OI) today announced that its Board of Directors has increased the Company�s share repurchase authorization to $500 million. The authorization expires on December�31, 2017, and includes the approximately $85 million remaining under the current program.
�
�In light of our strong cash generation and the health of our balance sheet, we are nearing an inflection point in our capital allocation priorities,� said Chairman and Chief Executive Officer Al Stroucken. �We plan to significantly increase our share buybacks beginning next year, while continuing to invest strategically in the business and to reduce debt.�
�
The Company expects to repurchase at least $100 million in shares of the Company�s common stock in 2015.
�
Under the stock repurchase program, the Company may repurchase shares from time to time in open market transactions, accelerated stock buyback programs, tender offers, privately negotiated transactions or by other means. Repurchases may also be made under a Rule�10b5-1 plan. The timing and amount of repurchase transactions will be determined by the Company�s management based on its evaluation of market conditions, share price, legal requirements and other factors. The program may be suspended, modified or discontinued at any time without prior notice.
�
About O-I
�
Owens-Illinois,�Inc. (NYSE: OI) is the world�s largest glass container manufacturer and preferred partner for many of the world�s leading food and beverage brands. The Company had revenues of $7.0 billion in 2013 and employs approximately 22,500 people at 77 plants in 21 countries. With global headquarters in Perrysburg, Ohio, USA, O-I delivers safe, sustainable, pure, iconic, brand-building glass packaging to a growing global marketplace. For more information, visit www.o-i.com.
�
![]()
�
�
O-I�s Glass Is Life� movement promotes the widespread benefits of glass packaging in key markets around the globe. Join us in the #betteringlass conversation at www.glassislife.com.
�
Forward looking statements
�
This document contains �forward looking� statements within the meaning of Section�21E of the Securities Exchange Act of 1934 and Section�27A of the Securities Act of 1933. Forward looking statements reflect the Company�s current expectations and projections about future events at the time, and thus involve uncertainty and risk. The words �believe,� �expect,� �anticipate,� �will,� �could,� �would,� �should,� �may,� �plan,� �estimate,� �intend,� �predict,� �potential,� �continue,� and the negatives of these words and other similar expressions generally identify forward looking statements. It is possible the Company�s future financial performance may differ from expectations due to a variety of factors including, but not limited to the following: (1)�foreign currency fluctuations relative to the U.S. dollar, specifically the Euro, Brazilian real and Australian dollar, (2)�changes in capital availability or cost, including interest rate fluctuations and the ability of the Company to refinance debt at favorable terms, (3)�the general political, economic and competitive conditions in markets and countries where the Company has operations, including uncertainties related to economic and social conditions, disruptions in capital markets, disruptions in the supply chain, competitive pricing pressures, inflation or deflation, and changes in tax rates and laws, (4)�consumer preferences for alternative forms of packaging, (5)�cost and availability of raw materials, labor, energy and transportation, (6)�the Company�s ability to manage its cost structure, including its success in implementing restructuring plans and achieving cost savings, (7)�consolidation among competitors and customers, (8)�the ability of the Company to acquire businesses and expand plants, integrate operations of acquired businesses and achieve expected synergies, (9)�unanticipated expenditures with respect to environmental, safety and health laws, (10)�the Company�s ability to further develop its sales, marketing and product development capabilities, and (11) the timing and occurrence of events which are beyond the control of the Company, including any expropriation of the Company�s operations, floods and other natural disasters, events related to asbestos-related claims, and the other risk factors discussed in the Company�s Annual Report on Form�10-K for the year ended December�31, 2013 and any subsequently filed Quarterly Report on Form�10-Q. It is not possible to foresee or identify all such factors. Any forward looking statements in this document are based on certain assumptions and analyses made by the Company in light of its experience and perception of historical trends, current conditions, expected future developments, and other factors it believes are appropriate in the circumstances. Forward looking statements are not a guarantee of future performance and actual results or developments may differ materially from expectations. While the Company continually reviews trends and uncertainties affecting the Company�s results of operations and financial condition, the Company does not assume any obligation to update or supplement any particular forward looking statements contained in this document.
�