


Snowflake Reports Financial Results for the Second Quarter of Fiscal 2027
Product revenue of $1.49 billion in the second quarter, representing 37% year-over-year growth
Financial Highlights:
- Revenue of $1.55 billion in the second quarter, representing 35% year-over-year growth
- Net revenue retention rate of 126%
- 828 customers with trailing 12-month product revenue greater than $1 million, representing 27% year-over-year growth
- 829 Forbes Global 2000 customers
- Remaining performance obligations of $9.00 billion, representing 30% year-over-year growth
MENLO PARK, Calif.--(BUSINESS WIRE)-- Snowflake (NYSE: SNOW), the AI Data Cloud company, today announced financial results for its second quarter of fiscal 2027, ended July 31, 2026.
This press release features multimedia. View the full release here: https://www.businesswire.com/news/home/20260902386235/en/
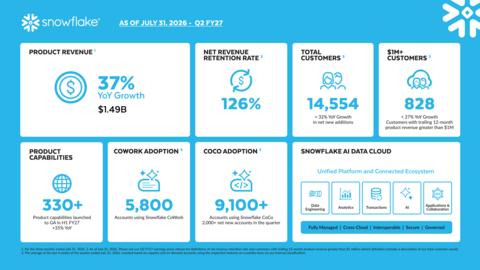
Snowflake Q2 FY27 Infographic (Graphic: Snowflake)
"Snowflake delivered another strong quarter, with product revenue of $1.49 billion, up 37% year-over-year, as Snowflake continues to power the enterprise AI revolution,” said Sridhar Ramaswamy, CEO of Snowflake. “AI continues to compound our advantages, creating a flywheel effect across the business. CoWork and CoCo are driving transformational outcomes for our customers, while fueling rapid adoption, user growth, new workloads, and overall platform consumption. Our rapid pace of innovation, tight go-to-market execution, and operational discipline position us well to capture the opportunity ahead. The Agentic Enterprise runs on Snowflake, and we're just getting started."
“Q2 marks our third consecutive quarter of product revenue growth acceleration, driven by strength in both our core data platform and a meaningful step-up in AI revenue,” said Brian Robins, CFO of Snowflake. “Importantly, we delivered this accelerating growth while expanding operating margin. Balancing growth with discipline remains a top priority, and we are raising our full-year product revenue growth guidance to 36% year-over-year.”
Snowflake Business Highlights:
- AI Momentum: CoCo surpassed 9,100 accounts1, adding more than 2,000 accounts in the quarter alone, while CoWork expanded to 5,800 accounts1.
- Accelerated Product Velocity: Launched over 330 product capabilities to general availability in the first half of fiscal 2027, up 35% year-over-year, and recently introduced Cortex Sense for business context and Cortex AI Gateway, which extends AI from insight to action through its integration of Natoma.
- AI Customer Wins: Customers like 1Password and Indeed chose Snowflake as the foundation for their data and AI transformation. Sayari cut costs by more than half and is using CoCo to accelerate the migration of 12 billion records.
- Customer Growth: Added 692 net new customers in the quarter, up 32% year-over-year, including 14 net new Forbes Global 2000 customers.
See the section titled “Key Business Metrics” for definitions of product revenue, net revenue retention rate, customers with trailing 12-month product revenue greater than $1 million, Forbes Global 2000 customers, and remaining performance obligations.
|
_______________________________________ |
1 The average of the last 4 weeks of the quarter ended July 31, 2026, counted based on capacity and on-demand accounts using the respective features on a weekly basis via our internal classification. |
Financial Outlook:
Our guidance includes GAAP and non-GAAP financial measures.
For the third quarter of fiscal 2027, the company expects:
- Product revenue of $1,588 million to $1,593 million, representing 37% to 38% year-over-year growth
- Non-GAAP operating margin2 of 15.5%
- Non-GAAP weighted-average shares used in computing net income per share attributable to common stockholders—diluted2,3 of 382 million
For the full-year of fiscal 2027, the company expects:
- Product revenue of $6,070 million, representing 36% year-over-year growth, up from previous guidance of $5,840 million, or 31% year-over-year growth
- Non-GAAP product gross margin2 of 74.0%
- Non-GAAP operating margin2 of 14.5%, up from previous guidance of 13.5%
- Non-GAAP adjusted free cash flow margin2 of 23.0%
- Non-GAAP weighted-average shares used in computing net income per share attributable to common stockholders—diluted2,3 of 380 million
A reconciliation of GAAP guidance measures to corresponding non-GAAP guidance measures is not available on a forward-looking basis without unreasonable effort due to the uncertainty regarding, and the potential variability of, expenses that may be incurred in the future. Stock-based compensation-related charges, including employer payroll tax-related items on employee stock transactions, are impacted by the timing of employee stock transactions, the future fair market value of our common stock, and our future hiring and retention needs, all of which are difficult to predict and subject to constant change. These factors could be material to our results computed in accordance with GAAP. Our fiscal year ends January 31, and numbers are rounded for presentation purposes.
_______________________________________ |
2 We report non-GAAP financial measures in addition to, and not as a substitute for, or superior to, financial measures calculated in accordance with GAAP. See the section titled “Statement Regarding Use of Non-GAAP Financial Measures” for an explanation of non-GAAP financial measures. |
3 The potential impact of future repurchases under our stock repurchase program is not reflected in our guidance for weighted-average shares used in computing net income per share attributable to common stockholders—diluted due to the uncertainty regarding, and the potential variability of, the timing and amount of repurchases. Additionally, the dilutive effect of the shares issuable upon conversion of our 0% convertible senior notes due 2027 and 0% convertible senior notes due 2029 (the Notes) using the if-converted method, estimated at approximately 10 million shares for each of the third quarter and full-year of fiscal 2027 based on the current conversion price and net of the potential antidilutive impact of the capped call transactions entered into in connection with the Notes (the Capped Calls), is reflected in our guidance for weighted-average shares used in computing net income per share attributable to common stockholders—diluted. Upon conversion of the Notes, we may choose to satisfy our conversion obligations by paying or delivering, as the case may be, cash, shares of our common stock, or a combination of both. The Capped Calls will have an antidilutive impact when the average stock price of our common stock in a given period is higher than their exercise price. The estimated antidilutive impact of the Capped Calls reflected in our guidance is based on the market price of our common stock as of July 31, 2026, and is subject to change with future stock price movements. |
Second Quarter Fiscal 2027 GAAP and Non-GAAP Results:
The following table summarizes our financial results for the second quarter of fiscal 2027:
|
Second Quarter Fiscal 2027 GAAP Results |
|
Second Quarter Fiscal 2027 Non-GAAP Results(1) |
||
|
Amount (millions) |
Year/Year Growth |
|
|
|
Product revenue |
$1,491.9 |
37% |
|
|
|
|
|
|
|
|
|
|
Amount (millions) |
Margin |
|
Amount (millions) |
Margin |
Product gross profit |
$1,057.4 |
70.9% |
|
$1,114.1 |
74.7% |
Operating income (loss) |
($263.0) |
(17.0%) |
|
$237.0 |
15.3% |
Net cash provided by operating activities |
$91.4 |
5.9% |
(2) |
|
|
Free cash flow |
|
|
|
$83.8 |
5.4% |
Adjusted free cash flow |
|
|
|
$92.3 |
6.0% |
(1) We report non-GAAP financial measures in addition to, and not as a substitute for, or superior to, financial measures calculated in accordance with GAAP. See the section titled “Statement Regarding Use of Non-GAAP Financial Measures” for an explanation of non-GAAP financial measures, and the table titled “GAAP to Non-GAAP Reconciliations” for a reconciliation of GAAP to non-GAAP financial measures.
(2) Calculated as net cash provided by operating activities as a percentage of revenue.
Note: Fiscal year ends January 31. Numbers are rounded for presentation purposes. |
|||||
Conference Call Details
The conference call will begin at 2 p.m. Pacific Time on September 2, 2026. Investors and participants may attend the call by dialing 1-800-330-6730 for domestic callers and 1-646-769-9500 for international callers (Access code: 102163).
The call will also be webcast live on the Snowflake Investor Relations website at https://investors.snowflake.com.
An audio replay of the conference call and webcast will be available two hours after its completion and will be accessible for 30 days on the Snowflake Investor Relations website.
Investor Presentation Details
An investor presentation providing additional information and analysis can be found at https://investors.snowflake.com.
Statement Regarding Use of Non‑GAAP Financial Measures
We report the following non-GAAP financial measures, which have not been prepared in accordance with generally accepted accounting principles in the United States (GAAP), in addition to, and not as a substitute for, or superior to, financial measures calculated in accordance with GAAP.
- Non-GAAP Product gross profit, Operating income, Net income, Net income attributable to Snowflake Inc., and Net income per share attributable to Snowflake Inc. common stockholders—basic and diluted. Non-GAAP product gross profit, operating income, net income, and net income attributable to Snowflake Inc. are each defined as the respective GAAP measure, excluding, as applicable, the effect of (i) stock-based compensation-related charges, including employer payroll tax-related items on employee stock transactions, (ii) amortization of acquired intangibles, (iii) expenses associated with acquisitions and strategic investments, (iv) amortization of debt issuance costs, (v) restructuring charges or recoveries, net, (vi) asset impairment related to office facility exits, net of associated sublease income, if any, (vii) adjustments attributable to noncontrolling interest, if any, and (viii) the related income tax effect of these adjustments as well as the non-recurring income tax expense or benefit associated with acquisitions. Non-GAAP product gross margin is calculated as non-GAAP product gross profit as a percentage of product revenue. Non-GAAP operating margin is calculated as non-GAAP operating income as a percentage of revenue. Our non-GAAP net income per share attributable to Snowflake Inc. common stockholders—basic is calculated by dividing non-GAAP net income attributable to Snowflake Inc. by the weighted-average number of shares of common stock outstanding during the period. Our non-GAAP net income per share attributable to Snowflake Inc. common stockholders—diluted is calculated by dividing non-GAAP net income attributable to Snowflake Inc. by the non-GAAP weighted-average number of diluted shares outstanding, which includes (a) the effect of all potentially dilutive common stock equivalents (stock options, restricted stock units, employee stock purchase rights under our 2020 Employee Stock Purchase Plan), (b) the potential dilutive effect of the shares issuable upon conversion of the Notes using the if-converted method, and (c) the antidilutive impact, if any, of the Capped Calls entered into in connection with the Notes. The Capped Calls are expected to reduce the potential dilution to our common stock upon any conversion of the Notes under certain circumstances. Under GAAP, the antidilutive impact of the Capped Calls is not reflected in diluted shares outstanding until exercised. The potential dilutive effect of outstanding restricted stock units with performance conditions not yet satisfied is included in the non-GAAP weighted-average number of diluted shares at forecasted attainment levels to the extent we believe it is probable that the performance conditions will be met. The potential dilutive effect of outstanding restricted stock units with market conditions is included in the non-GAAP weighted-average number of diluted shares to the extent the market conditions are met. Amounts attributable to noncontrolling interest were zero or not material for all periods presented. Beginning with the fourth quarter of fiscal 2026, the Company no longer attributes a portion of non-GAAP net income to noncontrolling interest as it no longer controls a majority-owned subsidiary. The calculation of non-GAAP basic and diluted net income per share attributable to common stockholders for the fourth quarter of fiscal 2026 and subsequent periods aligns with the methodology used to calculate non-GAAP basic and diluted net income per share attributable to Snowflake Inc. common stockholders as described above. We believe the presentation of operating results that exclude these items that are (i) non-cash items, (ii) non-recurring items, or (iii) items that have highly variable amounts due to factors beyond our control and are unrelated to our core operations such that management does not consider them in evaluating the business performance or making operating plans, provides useful supplemental information to investors and facilitates the analysis of our operating results and comparison of operating results across reporting periods.
- Free cash flow. Free cash flow is defined as net cash provided by operating activities reduced by purchases of property and equipment and any capitalized software development costs. Cash outflows for employee payroll tax items related to the net share settlement of equity awards are included in cash flow for financing activities and, as a result, do not have an effect on the calculation of free cash flow. Free cash flow margin is calculated as free cash flow as a percentage of revenue. We believe these measures provide useful supplemental information to investors because they are indicators of the strength and performance of our core business operations.
- Adjusted free cash flow. Adjusted free cash flow is defined as free cash flow plus (minus) net cash paid (received) on employer and employee payroll tax-related items on employee stock transactions. Employee payroll tax-related items on employee stock transactions are generally pass-through transactions that are expected to have a net zero impact on free cash flow over time, but that may impact free cash flow in any given fiscal quarter due to differences between the time that we receive funds from our employees and the time we remit those funds to applicable tax authorities. We believe that excluding the effects of these payroll tax-related items will enhance investors' ability to evaluate our free cash flow performance, including on a quarter-over-quarter basis. Adjusted free cash flow margin is calculated as adjusted free cash flow as a percentage of revenue. We believe these measures provide useful supplemental information to investors because they are indicators of the strength and performance of our core business operations.
We use these non-GAAP financial measures internally for financial and operational decision-making purposes and as a means to evaluate period-to-period comparisons. Non-GAAP financial measures are not meant to be considered in isolation or as a substitute for comparable GAAP financial measures and should be read only in conjunction with our condensed consolidated financial statements prepared in accordance with GAAP. Our presentation of non-GAAP financial measures may not be comparable to similar measures used by other companies. We encourage investors to carefully consider our results under GAAP, as well as our supplemental non-GAAP information and the reconciliation between these presentations, to more fully understand our business. Please see the tables included at the end of this release for the reconciliation of GAAP to non-GAAP results.
Key Business Metrics
We monitor our key business metrics, including (i) free cash flow and (ii) the other metrics set forth below to help us evaluate our business and growth trends, establish budgets, measure the effectiveness of our sales and marketing efforts, and assess operational efficiencies. See the section titled “Statement Regarding Use of Non-GAAP Financial Measures” for the definition of free cash flow. The calculation of our key business metrics may differ from other similarly titled metrics used by other companies, securities analysts, or investors.
- Product Revenue. Product revenue is a key metric for us because we recognize revenue based on platform consumption, which is inherently variable at our customers’ discretion, and not based on the amount and duration of contract terms. Product revenue is primarily derived from the consumption of compute, storage, and data transfer resources by customers on our platform. Customers have the flexibility to consume more than their contracted capacity during the contract term and may have the ability to roll over unused capacity to future periods, generally upon the purchase of additional capacity at renewal. Our consumption-based business model distinguishes us from subscription-based software companies that generally recognize revenue ratably over the contract term and may not permit rollover. Because customers have flexibility in the timing of their consumption, which can exceed their contracted capacity or extend beyond the original contract term in many cases, the amount of product revenue recognized in a given period is an important indicator of customer satisfaction and the value derived from our platform. While customer use of our platform in any period is not necessarily indicative of future use, we estimate future revenue using predictive models based on customers’ historical usage to plan and determine financial forecasts. Product revenue excludes our professional services and other revenue.
- Net Revenue Retention Rate. To calculate net revenue retention rate, we first specify a measurement period consisting of the trailing two years from our current period end. Next, we define as our measurement cohort the population of customers under capacity contracts that used our platform at any point in the first month of the first year of the measurement period. The cohorts used to calculate net revenue retention rate include end-customers under a reseller arrangement. We then calculate our net revenue retention rate as the quotient obtained by dividing our product revenue from this cohort in the second year of the measurement period by our product revenue from this cohort in the first year of the measurement period. Any customer in the cohort that did not use our platform in the second year remains in the calculation and contributes zero product revenue in the second year. Our net revenue retention rate is subject to adjustments for acquisitions, consolidations, spin-offs, and other market activity, and we present our net revenue retention rate for historical periods reflecting these adjustments. Since we will continue to attribute the historical product revenue to the consolidated contract, consolidation of capacity contracts within a customer’s organization typically will not impact our net revenue retention rate unless one of those customers was not a customer at any point in the first month of the first year of the measurement period.
- Customers with Trailing 12-Month Product Revenue Greater than $1 Million. To calculate the number of customers with trailing 12-month product revenue greater than $1 million, we count the number of customers under capacity arrangements that contributed more than $1 million in product revenue in the trailing 12 months. For purposes of determining our customer count, we treat each customer account, including accounts for end-customers under a reseller arrangement, that has at least one corresponding capacity contract as a unique customer, and a single organization with multiple divisions, segments, or subsidiaries may be counted as multiple customers. We do not include customers that consume our platform only under on-demand arrangements for purposes of determining our customer count. Our customer count is subject to adjustments for acquisitions, consolidations, spin-offs, and other market activity, and we present our customer count for historical periods reflecting these adjustments.
- Forbes Global 2000 Customers. Our Forbes Global 2000 customer count is a subset of our customer count based on the 2026 Forbes Global 2000 list. Our Forbes Global 2000 customer count is subject to adjustments for annual updates to the list by Forbes, as well as acquisitions, consolidations, spin-offs, and other market activity with respect to such customers, and we present our Forbes Global 2000 customer count for historical periods reflecting these adjustments.
- Remaining Performance Obligations. Remaining performance obligations (RPO) represent the amount of contracted future revenue that has not yet been recognized, including (i) deferred revenue and (ii) non-cancelable contracted amounts that will be invoiced and recognized as revenue in future periods. RPO excludes performance obligations from on-demand arrangements and certain time and materials contracts that are billed in arrears. Portions of RPO that are not yet invoiced and are denominated in foreign currencies are revalued into U.S. dollars each period based on the applicable period-end exchange rates. RPO is not necessarily indicative of future product revenue growth because it does not account for the timing of customers’ consumption or their consumption of more than their contracted capacity. Moreover, RPO is influenced by a number of factors, including the timing and size of renewals, the timing and size of purchases of additional capacity, average contract terms, seasonality, changes in foreign currency exchange rates, and the extent to which customers are permitted to roll over unused capacity to future periods, generally upon the purchase of additional capacity at renewal. Due to these factors, it is important to review RPO in conjunction with product revenue and other financial metrics disclosed elsewhere herein.
Use of Forward‑Looking Statements
This release and the accompanying oral presentation contain forward-looking statements within the meaning of Section 27A of the Securities Act of 1933, as amended, and Section 21E of the Securities Exchange Act of 1934, as amended, regarding our performance, including but not limited to statements in the section titled “Financial Outlook.” Words such as “guidance,” “outlook,” “expect,” “anticipate,” “should,” “believe,” “hope,” “target,” “project,” “plan,” “goals,” “estimate,” “potential,” “predict,” “forecast,” “position,” “see,” “on track,” “may,” “will,” “might,” “could,” “intend,” “shall,” “future,” and variations of these terms or the negative of these terms and similar expressions are intended to identify these forward-looking statements. Other than statements of historical fact, all statements contained in this release and accompanying oral presentation are forward-looking statements, including statements regarding (i) our future operating results, targets, or financial position, including expectations regarding revenue recognition; (ii) our business strategy, plans, opportunities, or priorities, including with respect to strategic transactions; (iii) the release, adoption, and use of our new or enhanced products, services, and technology offerings, including those that are under development or not generally available; (iv) market size and growth, trends, and competitive considerations; (v) our vision, strategy, and expected benefits relating to artificial intelligence (AI), the enterprise AI revolution, Snowflake Cortex AI, Snowpark, Snowflake Marketplace, the AI Data Cloud, and AI Data Clouds for specific industries or product categories, including the expected benefits and network effects of the AI Data Cloud; and (vi) the integration, interoperability, and availability of our products, services, and technology offerings with and on third-party products and platforms, including public cloud platforms and AI models.
The forward-looking statements contained in this release and the accompanying oral presentation are subject to known and unknown risks, uncertainties, assumptions, and other factors that may cause actual results or outcomes to be materially different from any future results or outcomes expressed or implied by the forward-looking statements. These risks, uncertainties, assumptions, and other factors include, but are not limited to, those related to our business and financial performance; general market and business conditions, downturns, or uncertainty, including higher inflation, tariffs and trade wars, extended federal government shutdowns, higher interest rates, fluctuations or volatility in capital markets, energy markets, or foreign currency exchange rates, and geopolitical instability; our ability to attract and retain customers that use our platform to support their end-to-end data lifecycle; our ability to execute on our business strategy, including our strategy across our product categories and an effective AI strategy; our ability to respond rapidly and effectively to emerging technology trends, including the adoption and use of AI, and the extent to which our investments in new technologies are successful; the extent to which customers continue to optimize consumption, including with respect to AI features; our ability to compete effectively in a continually evolving market in which enterprises are increasingly adopting AI to perform core functions and significant disruption is being driven by AI; our ability to attract, recruit, and retain qualified personnel to support our operations and growth; the impact of new or optimized product features and pricing strategies on consumption, including AI credit pricing, Iceberg tables, tiered storage pricing, and adaptive warehouses; our ability to consummate and realize the anticipated benefits of any acquisitions, strategic investments, partnerships, or alliances; unforeseen technical, operational, or business challenges impacting the timing, scope, or success of strategic partnerships; the extent to which customers continue to rationalize budgets and prioritize cash flow management, including through shortened contract durations; our ability to develop new products and services and enhance existing products and services; the extent to which customer adoption of new product capabilities results in durable consumption; the growth of successful native applications on the Snowflake Marketplace; our ability to increase and predict customer consumption of our platform, particularly in light of the impact of holidays on customer consumption patterns; our ability to increase our penetration into existing markets and enter and grow new markets, including highly-regulated markets such as financial services, healthcare, and the public sector; the effectiveness of our security measures designed to protect against security incidents and the impact of cybersecurity threat activity directed at us or our customers and any resulting reputational or financial damage; success of our sales and marketing efforts and our ability to promote our brand; our ability to protect our intellectual property rights and the extent to which they provide us with a competitive advantage; our ability to manage growth; our ability to sublease or terminate certain of our office facility commitments and the impact of related asset impairment; the impact and timing of stock repurchases under our stock repurchase program; our ability to reduce stock-based compensation as a percentage of our revenue; our ability to achieve GAAP profitability; and our ability to meet the requirements of the Notes and the settlement timing and method for the Notes and the Capped Calls.
Further information on these and additional risks, uncertainties, assumptions, and other factors that could cause actual outcomes and results to differ materially from those included in or contemplated by the forward-looking statements contained in this release are included under the caption “Risk Factors” and elsewhere in our Form 10-Q for the fiscal quarter ended April 30, 2026 and other filings and reports we make with the Securities and Exchange Commission from time to time, including our Form 10-Q that will be filed for the fiscal quarter ended July 31, 2026.
Moreover, we operate in a very competitive and rapidly changing environment, and new risks may emerge from time to time. It is not possible to predict all risks, nor can we assess the impact of all factors on our business or the extent to which any factor(s) may cause actual results or outcomes to differ materially from those contained in any forward-looking statements we may make. As a result of these risks, uncertainties, assumptions, and other factors, you should not rely on any forward-looking statements as predictions of future events. Forward-looking statements speak only as of the date the statements are made and are based on information available to us at the time those statements are made and/or management's good faith belief as of that time with respect to future events. Except as required by law, we undertake no obligation, and do not intend, to update these forward-looking statements, to review or confirm analysts’ expectations, or to provide interim reports or updates on the progress of the current financial quarter.
About Snowflake
Snowflake is the platform for the AI era, making it easy for enterprises to innovate faster and get more value from data. More than 14,500 customers around the globe, including hundreds of the world’s largest companies, use Snowflake’s AI Data Cloud to build, use and share data, applications and AI. With Snowflake, data and AI are transformative for everyone. Learn more at snowflake.com (NYSE: SNOW).
Source: Snowflake Inc.
Snowflake Inc. Condensed Consolidated Statements of Operations (in thousands, except per share data) (unaudited) |
|||||||||||||||
|
Three Months Ended July 31, |
|
Six Months Ended July 31, |
||||||||||||
|
|
2026 |
|
|
|
2025 |
|
|
|
2026 |
|
|
|
2025 |
|
|
|
|
|
|
|
|
|
||||||||
Revenue |
$ |
1,546,793 |
|
|
$ |
1,144,969 |
|
|
$ |
2,937,744 |
|
|
$ |
2,187,043 |
|
Cost of revenue |
|
510,075 |
|
|
|
371,815 |
|
|
|
974,575 |
|
|
|
720,601 |
|
Gross profit |
|
1,036,718 |
|
|
|
773,154 |
|
|
|
1,963,169 |
|
|
|
1,466,442 |
|
Operating expenses: |
|
|
|
|
|
|
|
||||||||
Sales and marketing |
|
611,615 |
|
|
|
501,957 |
|
|
|
1,200,567 |
|
|
|
960,511 |
|
Research and development |
|
567,476 |
|
|
|
492,003 |
|
|
|
1,102,413 |
|
|
|
964,407 |
|
General and administrative |
|
120,594 |
|
|
|
119,470 |
|
|
|
249,310 |
|
|
|
329,057 |
|
Total operating expenses |
|
1,299,685 |
|
|
|
1,113,430 |
|
|
|
2,552,290 |
|
|
|
2,253,975 |
|
Operating loss |
|
(262,967 |
) |
|
|
(340,276 |
) |
|
|
(589,121 |
) |
|
|
(787,533 |
) |
Interest income |
|
41,996 |
|
|
|
49,467 |
|
|
|
83,141 |
|
|
|
102,630 |
|
Interest expense |
|
(2,081 |
) |
|
|
(2,074 |
) |
|
|
(4,161 |
) |
|
|
(4,145 |
) |
Other income (expense), net |
|
34,762 |
|
|
|
(4,985 |
) |
|
|
25,191 |
|
|
|
(33,043 |
) |
Loss before income taxes |
|
(188,290 |
) |
|
|
(297,868 |
) |
|
|
(484,950 |
) |
|
|
(722,091 |
) |
Provision for income taxes |
|
3,430 |
|
|
|
62 |
|
|
|
2,341 |
|
|
|
5,791 |
|
Net loss |
|
(191,720 |
) |
|
|
(297,930 |
) |
|
|
(487,291 |
) |
|
|
(727,882 |
) |
Less: net income attributable to noncontrolling interest |
|
— |
|
|
|
87 |
|
|
|
— |
|
|
|
227 |
|
Net loss attributable to Snowflake Inc. |
$ |
(191,720 |
) |
|
$ |
(298,017 |
) |
|
$ |
(487,291 |
) |
|
$ |
(728,109 |
) |
Net loss per share attributable to Snowflake Inc. common stockholders—basic and diluted |
$ |
(0.55 |
) |
|
$ |
(0.89 |
) |
|
$ |
(1.40 |
) |
|
$ |
(2.18 |
) |
Weighted-average shares used in computing net loss per share attributable to Snowflake Inc. common stockholders—basic and diluted |
|
349,257 |
|
|
|
335,215 |
|
|
|
347,356 |
|
|
|
333,957 |
|
Snowflake Inc. Condensed Consolidated Balance Sheets (in thousands) (unaudited) |
|||||||
|
July 31, 2026 |
|
January 31, 2026 |
||||
Assets |
|
|
|
||||
Current assets: |
|
|
|
||||
Cash and cash equivalents |
$ |
1,707,187 |
|
$ |
2,828,163 |
||
Short-term investments |
|
637,508 |
|
|
|
1,201,523 |
|
Accounts receivable, net |
|
718,464 |
|
|
|
1,303,740 |
|
Deferred commissions, current |
|
222,084 |
|
|
|
214,058 |
|
Prepaid expenses and other current assets |
|
208,593 |
|
|
|
195,128 |
|
Total current assets |
|
3,493,836 |
|
|
|
5,742,612 |
|
Long-term investments |
|
1,984,482 |
|
|
|
755,013 |
|
Property and equipment, net |
|
207,981 |
|
|
|
248,611 |
|
Operating lease right-of-use assets |
|
285,019 |
|
|
|
274,897 |
|
Goodwill |
|
1,639,003 |
|
|
|
1,194,367 |
|
Intangible assets, net |
|
426,527 |
|
|
|
246,916 |
|
Deferred commissions, non-current |
|
222,581 |
|
|
|
241,759 |
|
Other assets |
|
431,030 |
|
|
|
428,320 |
|
Total assets |
$ |
8,690,459 |
|
|
$ |
9,132,495 |
|
Liabilities and Stockholders’ Equity |
|
|
|
||||
Current liabilities: |
|
|
|
||||
Accounts payable |
$ |
185,250 |
|
|
$ |
145,559 |
|
Accrued expenses and other current liabilities |
|
908,005 |
|
|
|
879,537 |
|
Operating lease liabilities, current |
|
59,787 |
|
|
|
49,598 |
|
Deferred revenue, current |
|
2,568,489 |
|
|
|
3,346,997 |
|
Total current liabilities |
|
3,721,531 |
|
|
|
4,421,691 |
|
Convertible senior notes, net |
|
2,283,985 |
|
|
|
2,279,827 |
|
Operating lease liabilities, non-current |
|
420,043 |
|
|
|
411,689 |
|
Deferred revenue, non-current |
|
27,756 |
|
|
|
14,440 |
|
Other liabilities |
|
87,480 |
|
|
|
80,746 |
|
Stockholders’ equity |
|
2,149,664 |
|
|
|
1,924,102 |
|
Total liabilities and stockholders’ equity |
$ |
8,690,459 |
|
|
$ |
9,132,495 |
|
Snowflake Inc. Condensed Consolidated Statements of Cash Flows (in thousands) (unaudited) |
|||||||||||||||
|
Three Months Ended July 31, |
|
Six Months Ended July 31, |
||||||||||||
|
|
2026 |
|
|
|
2025 |
|
|
|
2026 |
|
|
|
2025 |
|
Cash flows from operating activities: |
|
|
|
|
|
|
|
||||||||
Net loss |
$ |
(191,720 |
) |
|
$ |
(297,930 |
) |
|
$ |
(487,291 |
) |
|
$ |
(727,882 |
) |
Adjustments to reconcile net loss to net cash provided by operating activities: |
|
|
|
|
|
|
|
||||||||
Depreciation and amortization |
|
68,629 |
|
|
|
54,837 |
|
|
|
136,234 |
|
|
|
103,641 |
|
Non-cash operating lease costs |
|
17,669 |
|
|
|
16,156 |
|
|
|
35,551 |
|
|
|
33,998 |
|
Amortization of deferred commissions |
|
59,743 |
|
|
|
33,158 |
|
|
|
117,473 |
|
|
|
58,954 |
|
Stock-based compensation, net of any amounts capitalized |
|
423,582 |
|
|
|
404,217 |
|
|
|
826,052 |
|
|
|
783,677 |
|
Net accretion of discounts on investments |
|
(1,081 |
) |
|
|
(5,717 |
) |
|
|
(3,286 |
) |
|
|
(13,369 |
) |
Net realized and unrealized losses (gains) on strategic investments |
|
(34,755 |
) |
|
|
5,580 |
|
|
|
(25,257 |
) |
|
|
35,265 |
|
Amortization of debt issuance costs |
|
2,081 |
|
|
|
2,074 |
|
|
|
4,161 |
|
|
|
4,145 |
|
Asset impairment related to office facility exits |
|
112 |
|
|
|
2,131 |
|
|
|
17,836 |
|
|
|
108,619 |
|
Deferred income tax |
|
(1,927 |
) |
|
|
(3,445 |
) |
|
|
(8,489 |
) |
|
|
(3,445 |
) |
Other |
|
4,534 |
|
|
|
1,685 |
|
|
|
7,355 |
|
|
|
(3,489 |
) |
Changes in operating assets and liabilities, net of effects of business combinations: |
|
|
|
|
|
|
|
||||||||
Accounts receivable |
|
(146,587 |
) |
|
|
(117,606 |
) |
|
|
600,630 |
|
|
|
276,051 |
|
Deferred commissions |
|
(69,521 |
) |
|
|
(53,750 |
) |
|
|
(106,320 |
) |
|
|
(84,864 |
) |
Prepaid expenses and other assets |
|
22,104 |
|
|
|
(4,486 |
) |
|
|
(351 |
) |
|
|
(22,338 |
) |
Accounts payable |
|
130,904 |
|
|
|
11,771 |
|
|
|
41,231 |
|
|
|
7,348 |
|
Accrued expenses and other liabilities |
|
108,847 |
|
|
|
93,291 |
|
|
|
28,056 |
|
|
|
97,226 |
|
Operating lease liabilities |
|
(22,635 |
) |
|
|
(14,559 |
) |
|
|
(41,842 |
) |
|
|
(26,397 |
) |
Deferred revenue |
|
(278,622 |
) |
|
|
(52,511 |
) |
|
|
(807,163 |
) |
|
|
(323,871 |
) |
Net cash provided by operating activities |
|
91,357 |
|
|
|
74,896 |
|
|
|
334,580 |
|
|
|
303,269 |
|
Cash flows from investing activities: |
|
|
|
|
|
|
|
||||||||
Purchases of property and equipment |
|
(7,554 |
) |
|
|
(16,665 |
) |
|
|
(18,005 |
) |
|
|
(61,654 |
) |
Cash paid for business combinations, net of cash, cash equivalents and restricted cash acquired |
|
(1,992 |
) |
|
|
(164,230 |
) |
|
|
(254,449 |
) |
|
|
(164,230 |
) |
Purchases of intangible assets |
|
— |
|
|
|
(1,311 |
) |
|
|
— |
|
|
|
(1,311 |
) |
Purchases of investments |
|
(919,669 |
) |
|
|
(636,469 |
) |
|
|
(1,816,116 |
) |
|
|
(1,649,044 |
) |
Sales of investments |
|
128,762 |
|
|
|
1,476 |
|
|
|
238,456 |
|
|
|
18,875 |
|
Maturities and redemptions of investments |
|
451,016 |
|
|
|
517,947 |
|
|
|
896,186 |
|
|
|
1,502,129 |
|
Net cash used in investing activities |
|
(349,437 |
) |
|
|
(299,252 |
) |
|
|
(953,928 |
) |
|
|
(355,235 |
) |
Cash flows from financing activities: |
|
|
|
|
|
|
|
||||||||
Proceeds from exercise of stock options |
|
67,845 |
|
|
|
28,186 |
|
|
|
74,424 |
|
|
|
34,446 |
|
Proceeds from issuance of common stock under employee stock purchase plan |
|
— |
|
|
|
— |
|
|
|
66,987 |
|
|
|
53,193 |
|
Taxes paid related to net share settlement of equity awards |
|
(184,896 |
) |
|
|
(161,999 |
) |
|
|
(327,742 |
) |
|
|
(294,497 |
) |
Repurchases of common stock |
|
— |
|
|
|
— |
|
|
|
(300,003 |
) |
|
|
(490,638 |
) |
Payments of deferred purchase consideration for business combinations |
|
— |
|
|
|
(226 |
) |
|
|
(2,250 |
) |
|
|
(600 |
) |
Net cash used in financing activities |
|
(117,051 |
) |
|
|
(134,039 |
) |
|
|
(488,584 |
) |
|
|
(698,096 |
) |
Effect of exchange rate changes on cash, cash equivalents, and restricted cash |
|
(1,860 |
) |
|
|
(175 |
) |
|
|
(4,684 |
) |
|
|
12,222 |
|
Net decrease in cash, cash equivalents, and restricted cash |
|
(376,991 |
) |
|
|
(358,570 |
) |
|
|
(1,112,616 |
) |
|
|
(737,840 |
) |
Cash, cash equivalents, and restricted cash—beginning of period |
|
2,128,678 |
|
|
|
2,319,408 |
|
|
|
2,864,303 |
|
|
|
2,698,678 |
|
Cash, cash equivalents, and restricted cash—end of period |
$ |
1,751,687 |
|
|
$ |
1,960,838 |
|
|
$ |
1,751,687 |
|
|
$ |
1,960,838 |
|
Snowflake Inc. GAAP to Non-GAAP Reconciliations (in thousands, except per share data and percentages) (unaudited) |
|||||||||||||||||||||||||||
|
Three Months Ended July 31, |
|
Six Months Ended July 31, |
||||||||||||||||||||||||
|
2026 |
|
2025 |
|
2026 |
|
2025 |
||||||||||||||||||||
|
Amount |
|
Amount as a % of Revenue |
|
Amount |
|
Amount as a % of Revenue |
|
Amount |
|
Amount as a % of Revenue |
|
Amount |
|
Amount as a % of Revenue |
||||||||||||
Revenue: |
|
|
|
|
|
|
|
|
|
|
|
|
|
|
|
||||||||||||
Product revenue |
$ |
1,491,861 |
|
|
96% |
|
$ |
1,090,496 |
|
|
95% |
|
$ |
2,826,190 |
|
|
96% |
|
$ |
2,087,309 |
|
|
95% |
||||
Professional services and other revenue |
|
54,932 |
|
|
4% |
|
|
54,473 |
|
|
5% |
|
|
111,554 |
|
|
4% |
|
|
99,734 |
|
|
5% |
||||
Revenue |
$ |
1,546,793 |
|
|
100% |
|
$ |
1,144,969 |
|
|
100% |
|
$ |
2,937,744 |
|
|
100% |
|
$ |
2,187,043 |
|
|
100% |
||||
Year-over-year growth |
|
35 |
% |
|
|
|
|
32 |
% |
|
|
|
|
34 |
% |
|
|
|
|
29 |
% |
|
|
||||
|
|
|
|
|
|
|
|
|
|
|
|
|
|
|
|
||||||||||||
Cost of revenue: |
|
|
|
|
|
|
|
|
|
|
|
|
|
|
|
||||||||||||
GAAP cost of product revenue |
$ |
434,418 |
|
|
|
|
$ |
302,316 |
|
|
|
|
$ |
821,292 |
|
|
|
|
$ |
587,592 |
|
|
|
||||
Adjustments: |
|
|
|
|
|
|
|
|
|
|
|
|
|
|
|
||||||||||||
Stock-based compensation-related charges |
|
(31,217 |
) |
|
|
|
|
(31,899 |
) |
|
|
|
|
(62,863 |
) |
|
|
|
|
(62,751 |
) |
|
|
||||
Amortization of acquired intangibles |
|
(25,424 |
) |
|
|
|
|
(13,552 |
) |
|
|
|
|
(49,018 |
) |
|
|
|
|
(25,287 |
) |
|
|
||||
Non-GAAP cost of product revenue |
$ |
377,777 |
|
|
|
|
$ |
256,865 |
|
|
|
|
$ |
709,411 |
|
|
|
|
$ |
499,554 |
|
|
|
||||
|
|
|
|
|
|
|
|
|
|
|
|
|
|
|
|
||||||||||||
GAAP cost of professional services and other revenue |
$ |
75,657 |
|
|
|
|
$ |
69,499 |
|
|
|
|
$ |
153,283 |
|
|
|
|
$ |
133,009 |
|
|
|
||||
Adjustments: |
|
|
|
|
|
|
|
|
|
|
|
|
|
|
|
||||||||||||
Stock-based compensation-related charges |
|
(14,663 |
) |
|
|
|
|
(15,019 |
) |
|
|
|
|
(29,259 |
) |
|
|
|
|
(29,660 |
) |
|
|
||||
Amortization of acquired intangibles |
|
(1,824 |
) |
|
|
|
|
(1,663 |
) |
|
|
|
|
(3,588 |
) |
|
|
|
|
(3,271 |
) |
|
|
||||
Non-GAAP cost of professional services and other revenue |
$ |
59,170 |
|
|
|
|
$ |
52,817 |
|
|
|
|
$ |
120,436 |
|
|
|
|
$ |
100,078 |
|
|
|
||||
|
|
|
|
|
|
|
|
|
|
|
|
|
|
|
|
||||||||||||
GAAP cost of revenue |
$ |
510,075 |
|
|
33% |
|
$ |
371,815 |
|
|
32% |
|
$ |
974,575 |
|
|
33% |
|
$ |
720,601 |
|
|
33% |
||||
Adjustments: |
|
|
|
|
|
|
|
|
|
|
|
|
|
|
|
||||||||||||
Stock-based compensation-related charges |
|
(45,880 |
) |
|
|
|
|
(46,918 |
) |
|
|
|
|
(92,122 |
) |
|
|
|
|
(92,411 |
) |
|
|
||||
Amortization of acquired intangibles |
|
(27,248 |
) |
|
|
|
|
(15,215 |
) |
|
|
|
|
(52,606 |
) |
|
|
|
|
(28,558 |
) |
|
|
||||
Non-GAAP cost of revenue |
$ |
436,947 |
|
|
28% |
|
$ |
309,682 |
|
|
27% |
|
$ |
829,847 |
|
|
28% |
|
$ |
599,632 |
|
|
27% |
||||
|
|
|
|
|
|
|
|
|
|
|
|
|
|
|
|
||||||||||||
Gross profit (loss): |
|
|
|
|
|
|
|
|
|
|
|
|
|
|
|
||||||||||||
GAAP product gross profit |
$ |
1,057,443 |
|
|
|
|
$ |
788,180 |
|
|
|
|
$ |
2,004,898 |
|
|
|
|
$ |
1,499,717 |
|
|
|
||||
Adjustments: |
|
|
|
|
|
|
|
|
|
|
|
|
|
|
|
||||||||||||
Stock-based compensation-related charges |
|
31,217 |
|
|
|
|
|
31,899 |
|
|
|
|
|
62,863 |
|
|
|
|
|
62,751 |
|
|
|
||||
Amortization of acquired intangibles |
|
25,424 |
|
|
|
|
|
13,552 |
|
|
|
|
|
49,018 |
|
|
|
|
|
25,287 |
|
|
|
||||
Non-GAAP product gross profit |
$ |
1,114,084 |
|
|
|
|
$ |
833,631 |
|
|
|
|
$ |
2,116,779 |
|
|
|
|
$ |
1,587,755 |
|
|
|
||||
|
|
|
|
|
|
|
|
|
|
|
|
|
|
|
|
||||||||||||
GAAP professional services and other revenue gross loss |
$ |
(20,725 |
) |
|
|
|
$ |
(15,026 |
) |
|
|
|
$ |
(41,729 |
) |
|
|
|
$ |
(33,275 |
) |
|
|
||||
Adjustments: |
|
|
|
|
|
|
|
|
|
|
|
|
|
|
|
||||||||||||
Stock-based compensation-related charges |
|
14,663 |
|
|
|
|
|
15,019 |
|
|
|
|
|
29,259 |
|
|
|
|
|
29,660 |
|
|
|
||||
Amortization of acquired intangibles |
|
1,824 |
|
|
|
|
|
1,663 |
|
|
|
|
|
3,588 |
|
|
|
|
|
3,271 |
|
|
|
||||
Non-GAAP professional services and other revenue gross profit (loss) |
$ |
(4,238 |
) |
|
|
|
$ |
1,656 |
|
|
|
|
$ |
(8,882 |
) |
|
|
|
$ |
(344 |
) |
|
|
||||
|
|
|
|
|
|
|
|
|
|
|
|
|
|
|
|
||||||||||||
GAAP gross profit |
$ |
1,036,718 |
|
|
67% |
|
$ |
773,154 |
|
|
68% |
|
$ |
1,963,169 |
|
|
67% |
|
$ |
1,466,442 |
|
|
67% |
||||
Adjustments: |
|
|
|
|
|
|
|
|
|
|
|
|
|
|
|
||||||||||||
Stock-based compensation-related charges |
|
45,880 |
|
|
|
|
|
46,918 |
|
|
|
|
|
92,122 |
|
|
|
|
|
92,411 |
|
|
|
||||
Amortization of acquired intangibles |
|
27,248 |
|
|
|
|
|
15,215 |
|
|
|
|
|
52,606 |
|
|
|
|
|
28,558 |
|
|
|
||||
Non-GAAP gross profit |
$ |
1,109,846 |
|
|
72% |
|
$ |
835,287 |
|
|
73% |
|
$ |
2,107,897 |
|
|
72% |
|
$ |
1,587,411 |
|
|
73% |
||||
|
|
|
|
|
|
|
|
|
|
|
|
|
|
|
|
||||||||||||
Gross margin: |
|
|
|
|
|
|
|
|
|
|
|
|
|
|
|
||||||||||||
GAAP product gross margin |
|
71 |
% |
|
|
|
|
72 |
% |
|
|
|
|
71 |
% |
|
|
|
|
72 |
% |
|
|
||||
Adjustments: |
|
|
|
|
|
|
|
|
|
|
|
|
|
|
|
||||||||||||
Stock-based compensation-related charges as a % of product revenue |
|
2 |
% |
|
|
|
|
3 |
% |
|
|
|
|
2 |
% |
|
|
|
|
3 |
% |
|
|
||||
Amortization of acquired intangibles as a % of product revenue |
|
2 |
% |
|
|
|
|
1 |
% |
|
|
|
|
2 |
% |
|
|
|
|
1 |
% |
|
|
||||
Non-GAAP product gross margin |
|
75 |
% |
|
|
|
|
76 |
% |
|
|
|
|
75 |
% |
|
|
|
|
76 |
% |
|
|
||||
|
|
|
|
|
|
|
|
|
|
|
|
|
|
|
|
||||||||||||
GAAP professional services and other revenue gross margin |
|
(38 |
%) |
|
|
|
|
(28 |
%) |
|
|
|
|
(37 |
%) |
|
|
|
|
(33 |
%) |
|
|
||||
Adjustments: |
|
|
|
|
|
|
|
|
|
|
|
|
|
|
|
||||||||||||
Stock-based compensation-related charges as a % of professional services and other revenue |
|
27 |
% |
|
|
|
|
28 |
% |
|
|
|
|
26 |
% |
|
|
|
|
30 |
% |
|
|
||||
Amortization of acquired intangibles as a % of professional services and other revenue |
|
3 |
% |
|
|
|
|
3 
|
% |
|
|
|
|
3 |
% |
|
|
|
|
3 |
% |
|
|
||||
Non-GAAP professional services and other revenue gross margin |
|
(8 |
%) |
|
|
|
|
3 |
% |
|
|
|
|
(8 |
%) |
|
|
|
|
— |
% |
|
|
||||
|
|
|
|
|
|
|
|
|
|
|
|
|
|
|
|
||||||||||||
GAAP gross margin |
|
67 |
% |
|
|
|
|
68 |
% |
|
|
|
|
67 |
% |
|
|
|
|
67 |
% |
|
|
||||
Adjustments: |
|
|
|
|
|
|
|
|
|
|
|
|
|
|
|
||||||||||||
Stock-based compensation-related charges as a % of revenue |
|
3 |
% |
|
|
|
|
4 |
% |
|
|
|
|
3 |
% |
|
|
|
|
5 |
% |
|
|
||||
Amortization of acquired intangibles as a % of revenue |
|
2 |
% |
|
|
|
|
1 |
% |
|
|
|
|
2 |
% |
|
|
|
|
1 |
% |
|
|
||||
Non-GAAP gross margin |
|
72 |
% |
|
|
|
|
73 |
% |
|
|
|
|
72 |
% |
|
|
|
|
73 |
% |
|
|
||||
|
|
|
|
|
|
|
|
|
|
|
|
|
|
|
|
||||||||||||
Operating expenses: |
|
|
|
|
|
|
|
|
|
|
|
|
|
|
|
||||||||||||
GAAP sales and marketing expense |
$ |
611,615 |
|
|
40% |
|
$ |
501,957 |
|
|
44% |
|
$ |
1,200,567 |
|
|
41% |
|
$ |
960,511 |
|
|
44% |
||||
Adjustments: |
|
|
|
|
|
|
|
|
|
|
|
|
|
|
|
||||||||||||
Stock-based compensation-related charges |
|
(109,272 |
) |
|
|
|
|
(100,528 |
) |
|
|
|
|
(213,170 |
) |
|
|
|
|
(193,439 |
) |
|
|
||||
Amortization of acquired intangibles |
|
(12,923 |
) |
|
|
|
|
(9,326 |
) |
|
|
|
|
(26,131 |
) |
|
|
|
|
(17,086 |
) |
|
|
||||
Non-GAAP sales and marketing expense |
$ |
489,420 |
|
|
32% |
|
$ |
392,103 |
|
|
34% |
|
$ |
961,266 |
|
|
33% |
|
$ |
749,986 |
|
|
35% |
||||
|
|
|
|
|
|
|
|
|
|
|
|
|
|
|
|
||||||||||||
GAAP research and development expense |
$ |
567,476 |
|
|
36% |
|
$ |
492,003 |
|
|
44% |
|
$ |
1,102,413 |
|
|
38% |
|
$ |
964,407 |
|
|
44% |
||||
Adjustments: |
|
|
|
|
|
|
|
|
|
|
|
|
|
|
|
||||||||||||
Stock-based compensation-related charges |
|
(256,303 |
) |
|
|
|
|
(242,156 |
) |
|
|
|
|
(504,932 |
) |
|
|
|
|
(473,101 |
) |
|
|
||||
Amortization of acquired intangibles |
|
(2,027 |
) |
|
|
|
|
(2,723 |
) |
|
|
|
|
(3,987 |
) |
|
|
|
|
(5,368 |
) |
|
|
||||
Restructuring recoveries, net(1) |
|
— |
|
|
|
|
|
— |
|
|
|
|
|
— |
|
|
|
|
|
8 |
|
|
|
||||
Non-GAAP research and development expense |
$ |
309,146 |
|
|
20% |
|
$ |
247,124 |
|
|
22% |
|
$ |
593,494 |
|
|
20% |
|
$ |
485,946 |
|
|
22% |
||||
|
|
|
|
|
|
|
|
|
|
|
|
|
|
|
|
||||||||||||
GAAP general and administrative expense |
$ |
120,594 |
|
|
8% |
|
$ |
119,470 |
|
|
10% |
|
$ |
249,310 |
|
|
8% |
|
$ |
329,057 |
|
|
15% |
||||
Adjustments: |
|
|
|
|
|
|
|
|
|
|
|
|
|
|
|
||||||||||||
Stock-based compensation-related charges |
|
(44,908 |
) |
|
|
|
|
(46,580 |
) |
|
|
|
|
(79,796 |
) |
|
|
|
|
(85,953 |
) |
|
|
||||
Amortization of acquired intangibles |
|
(32 |
) |
|
|
|
|
(543 |
) |
|
|
|
|
(64 |
) |
|
|
|
|
(880 |
) |
|
|
||||
Expenses associated with acquisitions and strategic investments |
|
(1,378 |
) |
|
|
|
|
(2,191 |
) |
|
|
|
|
(1,440 |
) |
|
|
|
|
(2,569 |
) |
|
|
||||
Restructuring recoveries, net(1) |
|
2 |
|
|
|
|
|
464 |
|
|
|
|
|
22 |
|
|
|
|
|
1,214 |
|
|
|
||||
Asset impairment related to office facility exits, net of sublease income(2) |
|
17 |
|
|
|
|
|
(2,132 |
) |
|
|
|
|
(17,633 |
) |
|
|
|
|
(108,620 |
) |
|
|
||||
Non-GAAP general and administrative expense |
$ |
74,295 |
|
|
5% |
|
$ |
68,488 |
|
|
6% |
|
$ |
150,399 |
|
|
5% |
|
$ |
132,249 |
|
|
6% |
||||
|
|
|
|
|
|
|
|
|
|
|
|
|
|
|
|
||||||||||||
GAAP total operating expenses |
$ |
1,299,685 |
|
|
84% |
|
$ |
1,113,430 |
|
|
98% |
|
$ |
2,552,290 |
|
|
87% |
|
$ |
2,253,975 |
|
|
103% |
||||
Adjustments: |
|
|
|
|
|
|
|
|
|
|
|
|
|
|
|
||||||||||||
Stock-based compensation-related charges |
|
(410,483 |
) |
|
|
|
|
(389,264 |
) |
|
|
|
|
(797,898 |
) |
|
|
|
|
(752,493 |
) |
|
|
||||
Amortization of acquired intangibles |
|
(14,982 |
) |
|
|
|
|
(12,592 |
) |
|
|
|
|
(30,182 |
) |
|
|
|
|
(23,334 |
) |
|
|
||||
Expenses associated with acquisitions and strategic investments |
|
(1,378 |
) |
|
|
|
|
(2,191 |
) |
|
|
|
|
(1,440 |
) |
|
|
|
|
(2,569 |
) |
|
|
||||
Restructuring recoveries, net(1) |
|
2 |
|
|
|
|
|
464 |
|
|
|
|
|
22 |
|
|
|
|
|
1,222 |
|
|
|
||||
Asset impairment related to office facility exits, net of sublease income(2) |
|
17 |
|
|
|
|
|
(2,132 |
) |
|
|
|
|
(17,633 |
) |
|
|
|
|
(108,620 |
) |
|
|
||||
Non-GAAP total operating expenses |
$ |
872,861 |
|
|
57% |
|
$ |
707,715 |
|
|
62% |
|
$ |
1,705,159 |
|
|
58% |
|
$ |
1,368,181 |
|
|
63% |
||||
|
|
|
|
|
|
|
|
|
|
|
|
|
|
|
|
||||||||||||
Operating income (loss): |
|
|
|
|
|
|
|
|
|
|
|
|
|
|
|
||||||||||||
GAAP operating loss |
$ |
(262,967 |
) |
|
(17%) |
|
$ |
(340,276 |
) |
|
(30%) |
|
$ |
(589,121 |
) |
|
(20%) |
|
$ |
(787,533 |
) |
|
(36%) |
||||
Adjustments: |
|
|
|
|
|
|
|
|
|
|
|
|
|
|
|
||||||||||||
Stock-based compensation-related charges(3) |
|
456,363 |
|
|
|
|
|
436,182 |
|
|
|
|
|
890,020 |
|
|
|
|
|
844,904 |
|
|
|
||||
Amortization of acquired intangibles |
|
42,230 |
|
|
|
|
|
27,807 |
|
|
|
|
|
82,788 |
|
|
|
|
|
51,892 |
|
|
|
||||
Expenses associated with acquisitions and strategic investments |
|
1,378 |
|
|
|
|
|
2,191 |
|
|
|
|
|
1,440 |
|
|
|
|
|
2,569 |
|
|
|
||||
Restructuring recoveries, net(1) |
|
(2 |
) |
|
|
|
|
(464 |
) |
|
|
|
|
(22 |
) |
|
|
|
|
(1,222 |
) |
|
|
||||
Asset impairment related to office facility exits, net of sublease income(2) |
|
(17 |
) |
|
|
|
|
2,132 |
|
|
|
|
|
17,633 |
|
|
|
|
|
108,620 |
|
|
|
||||
Non-GAAP operating income |
$ |
236,985 |
|
|
15% |
|
$ |
127,572 |
|
|
11% |
|
$ |
402,738 |
|
|
14% |
|
$ |
219,230 |
|
|
10% |
||||
|
|
|
|
|
|
|
|
|
|
|
|
|
|
|
|
||||||||||||
Operating margin: |
|
|
|
|
|
|
|
|
|
|
|
|
|
|
|
||||||||||||
GAAP operating margin |
|
(17 |
%) |
|
|
|
|
(30 |
%) |
|
|
|
|
(20 |
%) |
|
|
|
|
(36 |
%) |
|
|
||||
Adjustments: |
|
|
|
|
|
|
|
|
|
|
|
|
|
|
|
||||||||||||
Stock-based compensation-related charges as a % of revenue |
|
29 |
% |
|
|
|
|
39 |
% |
|
|
|
|
30 |
% |
|
|
|
|
39 |
% |
|
|
||||
Amortization of acquired intangibles as a % of revenue |
|
3 |
% |
|
|
|
|
2 |
% |
|
|
|
|
3 |
% |
|
|
|
|
2 |
% |
|
|
||||
Expenses associated with acquisitions and strategic investments as a % of revenue |
|
— |
% |
|
|
|
|
— |
% |
|
|
|
|
— |
% |
|
|
|
|
— |
% |
|
|
||||
Restructuring recoveries, net as a % of revenue |
|
— |
% |
|
|
|
|
— |
% |
|
|
|
|
— |
% |
|
|
|
|
— |
% |
|
|
||||
Asset impairment related to office facility exits, net of sublease income as a % of revenue |
|
— |
% |
|
|
|
|
— |
% |
|
|
|
|
1 |
% |
|
|
|
|
5 |
% |
|
|
||||
Non-GAAP operating margin |
|
15 |
% |
|
|
|
|
11 |
% |
|
|
|
|
14 |
% |
|
|
|
|
10 |
% |
|
|
||||
|
|
|
|
|
|
|
|
|
|
|
|
|
|
|
|
||||||||||||
Net income (loss): |
|
|
|
|
|
|
|
|
|
|
|
|
|
|
|
||||||||||||
GAAP net loss |
$ |
(191,720 |
) |
|
(12%) |
|
$ |
(297,930 |
) |
|
(26%) |
|
$ |
(487,291 |
) |
|
(17%) |
|
$ |
(727,882 |
) |
|
(33%) |
||||
Adjustments: |
|
|
|
|
|
|
|
|
|
|
|
|
|
|
|
||||||||||||
Stock-based compensation-related charges(3) |
|
456,363 |
|
|
|
|
|
436,182 |
|
|
|
|
|
890,020 |
|
|
|
|
|
844,904 |
|
|
|
||||
Amortization of acquired intangibles |
|
42,230 |
|
|
|
|
|
27,807 |
|
|
|
|
|
82,788 |
|
|
|
|
|
51,892 |
|
|
|
||||
Expenses associated with acquisitions and strategic investments |
|
1,378 |
|
|
|
|
|
2,191 |
|
|
|
|
|
1,440 |
|
|
|
|
|
2,569 |
|
|
|
||||
Restructuring recoveries, net(1) |
|
(2 |
) |
|
|
|
|
(464 |
) |
|
|
|
|
(22 |
) |
|
|
|
|
(1,222 |
) |
|
|
||||
Asset impairment related to office facility exits, net of sublease income(2) |
|
(17 |
) |
|
|
|
|
2,132 |
|
|
|
|
|
17,633 |
|
|
|
|
|
108,620 |
|
|
|
||||
Amortization of debt issuance costs |
|
2,081 |
|
|
|
|
|
2,074 |
|
|
|
|
|
4,161 |
|
|
|
|
|
4,145 |
|
|
|
||||
Income tax effect related to the above adjustments and acquisitions |
|
(75,005 |
) |
|
|
|
|
(43,006 |
) |
|
|
|
|
(125,426 |
) |
|
|
|
|
(66,468 |
) |
|
|
||||
Non-GAAP net income |
$ |
235,308 |
|
|
15% |
|
$ |
128,986 |
|
|
11% |
|
$ |
383,303 |
|
|
13% |
|
$ |
216,558 |
|
|
10% |
||||
|
|
|
|
|
|
|
|
|
|
|
|
|
|
|
|
||||||||||||
Net income (loss) attributable to Snowflake Inc.(4): |
|
|
|
|
|
|
|
|
|
|
|
|
|
|
|
||||||||||||
GAAP net loss attributable to Snowflake Inc. |
$ |
(191,720 |
) |
|
(12%) |
|
$ |
(298,017 |
) |
|
(26%) |
|
$ |
(487,291 |
) |
|
(17%) |
|
$ |
(728,109 |
) |
|
(33%) |
||||
Adjustments: |
|
|
|
|
|
|
|
|
|
|
|
|
|
|
|
||||||||||||
Stock-based compensation-related charges(3) |
|
456,363 |
|
|
|
|
|
436,182 |
|
|
|
|
|
890,020 |
|
|
|
|
|
844,904 |
|
|
|
||||
Amortization of acquired intangibles |
|
42,230 |
|
|
|
|
|
27,807 |
|
|
|
|
|
82,788 |
|
|
|
|
|
51,892 |
|
|
|
||||
Expenses associated with acquisitions and strategic investments |
|
1,378 |
|
|
|
|
|
2,191 |
|
|
|
|
|
1,440 |
|
|
|
|
|
2,569 |
|
|
|
||||
Restructuring recoveries, net(1) |
|
(2 |
) |
|
|
|
|
(464 |
) |
|
|
|
|
(22 |
) |
|
|
|
|
(1,222 |
) |
|
|
||||
Asset impairment related to office facility exits, net of sublease income(2) |
|
(17 |
) |
|
|
|
|
2,132 |
|
|
|
|
|
17,633 |
|
|
|
|
|
108,620 |
|
|
|
||||
Amortization of debt issuance costs |
|
2,081 |
|
|
|
|
|
2,074 |
|
|
|
|
|
4,161 |
|
|
|
|
|
4,145 |
|
|
|
||||
Income tax effect related to the above adjustments and acquisitions |
|
(75,005 |
) |
|
|
|
|
(43,006 |
) |
|
|
|
|
(125,426 |
) |
|
|
|
|
(66,468 |
) |
|
|
||||
Adjustments attributable to noncontrolling interest, net of tax |
|
— |
|
|
|
|
|
390 |
|
|
|
|
|
— |
|
|
|
|
|
243 |
|
|
|
||||
Non-GAAP net income attributable to Snowflake Inc. |
$ |
235,308 |
|
|
15% |
|
$ |
129,289 |
|
|
11% |
|
$ |
383,303 |
|
|
13% |
|
$ |
216,574 |
|
|
10% |
||||
|
|
|
|
|
|
|
|
|
|
|
|
|
|
|
|
||||||||||||
Net income (loss) per share attributable to Snowflake Inc. common stockholders—basic and diluted(4): |
|
|
|
|
|
|
|
|
|
|
|
|
|
|
|
||||||||||||
GAAP net loss per share attributable to Snowflake Inc. common stockholders—basic and diluted |
$ |
(0.55 |
) |
|
|
|
$ |
(0.89 |
) |
|
|
|
$ |
(1.40 |
) |
|
|
|
$ |
(2.18 |
) |
|
|
||||
Weighted-average shares used in computing GAAP net loss per share attributable to Snowflake Inc. common stockholders—basic and diluted |
|
349,257 |
|
|
|
|
|
335,215 |
|
|
|
|
|
347,356 |
|
|
|
|
|
333,957 |
|
|
|
||||
|
|
|
|
|
|
|
|
|
|
|
|
|
|
|
|
||||||||||||
Non-GAAP net income per share attributable to Snowflake Inc. common stockholders—basic |
$ |
0.67 |
|
|
|
|
$ |
0.38 |
|
|
|
|
$ |
1.10 |
|
|
|
|
$ |
0.65 |
|
|
|
||||
Weighted-average shares used in computing non-GAAP net income per share attributable to Snowflake Inc. common stockholders—basic |
|
349,257 |
|
|
|
|
|
335,215 |
|
|
|
|
|
347,356 |
|
|
|
|
|
333,957 |
|
|
|
||||
|
|
|
|
|
|
|
|
|
|
|
|
|
|
|
|
||||||||||||
Non-GAAP net income per share attributable to Snowflake Inc. common stockholders—diluted |
$ |
0.62 |
|
|
|
|
$ |
0.35 |
|
|
|
|
$ |
1.02 |
|
|
|
|
$ |
0.58 |
|
|
|
||||
|
|
|
|
|
|
|
|
|
|
|
|
|
|
|
|
||||||||||||
GAAP weighted-average shares used in computing GAAP net loss per share attributable to Snowflake Inc. common stockholders—basic and diluted |
|
349,257 |
|
|
|
|
|
335,215 |
|
|
|
|
|
347,356 |
|
|
|
|
|
333,957 |
|
|
|
||||
Add: Effect of potentially dilutive common stock equivalents |
|
18,345 |
|
|
|
|
|
25,939 |
|
|
|
|
|
16,895 |
|
|
|
|
|
24,986 |
|
|
|
||||
Add: Effect of convertible senior notes |
|
14,603 |
|
|
|
|
|
14,603 |
|
|
|
|
|
14,603 |
|
|
|
|
|
14,603 |
|
|
|
||||
Less: Effect of antidilutive impact of capped call transactions |
|
(4,327 |
) |
|
|
|
|
(3,374 |
) |
|
|
|
|
(2,812 |
) |
|
|
|
|
(2,074 |
) |
|
|
||||
Non-GAAP weighted-average shares used in computing non-GAAP net income per share attributable to Snowflake Inc. common stockholders—diluted(5) |
|
377,878 |
|
|
|
|
|
372,383 |
|
|
|
|
|
376,042 |
|
|
|
|
|
371,472 |
|
|
|
||||
|
|
|
|
|
|
|
|
|
|
|
|
|
|
|
|
||||||||||||
Free cash flow and adjusted free cash flow: |
|
|
|
|
|
|
|
|
|
|
|
|
|
|
|
||||||||||||
GAAP net cash provided by operating activities |
$ |
91,357 |
|
|
6% |
|
$ |
74,896 |
|
|
7% |
|
$ |
334,580 |
|
|
11% |
|
$ |
303,269 |
|
|
14% |
||||
Adjustments: |
|
|
|
|
|
|
|
|
|
|
|
|
|
|
|
||||||||||||
Purchases of property and equipment |
|
(7,554 |
) |
|
|
|
|
(16,665 |
) |
|
|
|
|
(18,005 |
) |
|
|
|
|
(61,654 |
) |
|
|
||||
Non-GAAP free cash flow |
|
83,803 |
|
|
5% |
|
|
58,231 |
|
|
5% |
|
|
316,575 |
|
|
11% |
|
|
241,615 |
|
|
11% |
||||
Adjustments: |
|
|
|
|
|
|
|
|
|
|
|
|
|
|
|
||||||||||||
Net cash paid on payroll tax-related items on employee stock transactions(6) |
|
8,500 |
|
|
|
|
|
9,534 |
|
|
|
|
|
41,242 |
|
|
|
|
|
32,419 |
|
|
|
||||
Non-GAAP adjusted free cash flow |
$ |
92,303 |
|
|
6% |
|
$ |
67,765 |
|
|
6% |
|
$ |
357,817 |
|
|
12% |
|
$ |
274,034 |
|
|
13% |
||||
Non-GAAP free cash flow margin |
|
5 |
% |
|
|
|
|
5 |
% |
|
|
|
|
11 |
% |
|
|
|
|
11 |
% |
|
|
||||
Non-GAAP adjusted free cash flow margin |
|
6 |
% |
|
|
|
|
6 |
% |
|
|
|
|
12 |
% |
|
|
|
|
13 |
% |
|
|
||||
GAAP net cash used in investing activities |
$ |
(349,437 |
) |
|
|
|
$ |
(299,252 |
) |
|
|
|
$ |
(953,928 |
) |
|
|
|
$ |
(355,235 |
) |
|
|
||||
GAAP net cash used in financing activities |
$ |
(117,051 |
) |
|
|
|
$ |
(134,039 |
) |
|
|
|
$ |
(488,584 |
) |
|
|
|
$ |
(698,096 |
) |
|
|
||||
|
|
|
|
|
|
|
|
|
|
|
|
|
|
|
|
||||||||||||
(1) Restructuring recoveries, net represent recoveries on certain costs incurred by us in connection with a restructuring plan for a majority-owned subsidiary.
(2) Asset impairment related to office facility exits, net of sublease income for the six months ended July 31, 2025 primarily relates to our San Mateo office facility.
(3) Stock-based compensation-related charges included employer payroll tax-related expenses on employee stock transactions of approximately $23.6 million and $45.0 million for the three and six months ended July 31, 2026, respectively, and $22.2 million and $41.7 million for the three and six months ended July 31, 2025, respectively.
(4) Beginning with the fourth quarter of fiscal 2026, the Company no longer attributes a portion of GAAP and non-GAAP net income (loss) to noncontrolling interest as it no longer controls a majority-owned subsidiary. As such, for the three and six months ended July 31, 2026, the calculations of GAAP and non-GAAP basic and diluted net income (loss) per share attributable to common stockholders align with the methodologies used to calculate the corresponding metrics for Snowflake Inc. common stockholders.
(5) The non-GAAP weighted-average shares used in computing non-GAAP net income per share attributable to Snowflake Inc. common stockholders—diluted included (a) the effect of all potentially dilutive common stock equivalents (stock options, restricted stock units, and employee stock purchase rights under our 2020 Employee Stock Purchase Plan) and (b) the potential dilutive effect of shares issuable upon conversion of the Notes using the if-converted method, starting from the beginning of the period or the issuance date of the Notes, if later. The potential dilutive effect of outstanding restricted stock units with performance conditions not yet satisfied is included in the non-GAAP weighted-average number of diluted shares at forecasted attainment levels to the extent we believe it is probable that the performance conditions will be met. The potential dilutive effect of outstanding restricted stock units with market conditions is included in the non-GAAP weighted-average number of diluted shares to the extent market conditions are met.
(6) Amounts exclude employee payroll taxes on net share settlement of equity awards, which are reflected as financing cash outflows. For the three and six months ended July 31, 2026, the excluded amounts were $184.9 million and $327.7 million, respectively; for the three and six months ended July 31, 2025, the excluded amounts were $162.0 million and $294.5 million, respectively. |
|||||||||||||||||||||||||||
View source version on businesswire.com: https://www.businesswire.com/news/home/20260902386235/en/
Investor Contact
Katherine McCracken
[email protected]
Press Contact
Eszter Szikora
[email protected]
Source: Snowflake Inc.