

Medtronic reports first quarter fiscal 2027 results; delivers broad-based portfolio performance and raises fiscal 2027 guidance
Strength across the company's largest franchises, new growth platforms, and recent portfolio investments support the long-term growth trajectory
GALWAY,
Key Highlights
- Revenue of
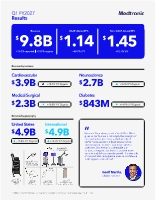
$9.8 billion , increased 13.7% as reported and 13.7% organic, roughly 200 basis points above guidance midpoint - GAAP diluted EPS of
$1.14 ; non-GAAP diluted EPS of$1.45 , ahead of guidance - Raising FY27 organic revenue growth guidance 50 basis points to 7.25% to 7.75%, and FY27 diluted non-GAAP EPS guidance to the new range of
$5.94 to$6.00 - Cardiovascular grew 18.9%, led by 15% growth in Cardiac Rhythm Management and 88% growth in Cardiac Ablation Solutions
- Announced expanded CE Mark indication for Affera™ Mapping and Ablation System and Sphere-9™ Catheter for treatment of ventricular arrhythmias
- Announces strategic investment in Pi-Cardia, a pioneer in leaflet modification technology
- Neuroscience grew 9.3%, driven by 13% growth in Cranial and Spinal Technologies, including low-20s growth in enabling technology; Altaviva meaningfully contributed to 15% growth in Pelvic Health
- Medical Surgical reported strong performance, up 10.2%, led by 9% growth in Surgical and 14% growth in Acute Care & Monitoring
- Announces strategic partnership with Cornerstone Robotics to further expand global access to robotic-assisted surgery
- Announced FDA clearance for Touch Surgery™ Aide next generation computing platform
- Completed acquisitions of Scientia Vascular and SPR Therapeutics, Inc.
"We are off to a strong start in fiscal 2027. What gives us confidence is not simply the strength of the quarter, but importantly, the breadth of performance across our businesses and the increasing contributions from newer growth platforms," said Geoff Martha, Medtronic chairman and chief executive officer. "Our execution, alongside our innovation engine, positions us to serve more patients and deliver durable growth. The strength of our portfolio and pipeline gives us confidence in the opportunities ahead."
Financial Results
Medtronic reported Q1 worldwide revenue of
- Other revenue of
$29 million in the current year versus$72 million in the prior year - Revenue from the Dutch Obesity Clinic (NOK) divestiture with no revenue in the current year and
$17 million in the prior year - Scientia revenue of
$14 million (closedJune 12 ) and SPR Therapeutics revenue of$5 million in the current year (closedJuly 16 ) - Foreign exchange benefit of
$57 million on the remaining net sales
Results were impacted by the extra fiscal week, which occurred in Medtronic's first quarter of FY27. The company estimates the impact of the extra week benefited Q1 organic growth by approximately
Q1 revenue included:
- Cardiovascular Portfolio revenue of
$3.927 billion increased 19.5% as reported and 18.9% organic, with high-20s increase in Electrophysiology Therapies, high-single digit increase in Interventional Cardiology Therapies, high-single digit increase in CardioVascular Surgery, and low-double digit increase in Peripheral Vascular Health, all on an organic basis - Neuroscience Portfolio revenue of
$2.678 billion increased 10.3% reported and 9.3% organic, with low-double digit increase in Cranial & Spinal Technologies, high-single digit increase in Specialty Therapies, and low-single digit increase in Neuromodulation, all on an organic basis - Medical Surgical Portfolio revenue of
$2.279 billion increased 10.0% as reported and 10.2% organic, with high-single digit increase in Surgical & Endoscopy, and mid-teens increase in Acute Care & Monitoring, all on an organic basis - Diabetes business revenue of
$843 million increased 16.9% as reported and 14.9% organic1
Q1 GAAP operating profit and operating margin were
Q1 GAAP net income and diluted earnings per share (EPS) were
Guidance
The company today raised its FY27 organic revenue growth and EPS guidance. The company raised its FY27 organic revenue growth guidance to 7.25% to 7.75%, an increase from the prior guidance of 6.75% to 7.25%. The company also raised its FY27 diluted non-GAAP EPS guidance to the new range of
"We continue to make targeted investments in innovation, portfolio development, and commercial execution that will support sustainable long-term value creation," said Thierry Piéton, Medtronic chief financial officer. "The combination of strong operating performance and disciplined financial management drove revenue and adjusted EPS ahead of expectations, enabling us to raise our fiscal 2027 guidance."
Video Webcast Information
Medtronic will host a video webcast today,
Financial Schedules and Earnings Presentation
The first quarter financial schedules and non-GAAP reconciliations can be viewed by clicking on the Quarterly Earnings link at investorrelations.medtronic.com. To view a printable PDF of the financial schedules and non-GAAP reconciliations, click here. To view the earnings presentation, click here.
About Medtronic
Bold thinking. Bolder actions. We are Medtronic. Medtronic plc, headquartered in Galway,
FORWARD LOOKING STATEMENTS
This press release contains forward-looking statements within the meaning of the Private Securities Litigation Reform Act of 1995, which are subject to risks and uncertainties, including risks related to competitive factors, difficulties and delays inherent in the development, manufacturing, marketing and sale of medical products, government regulation, geopolitical conflicts, changing global trade policies, material acquisition and divestiture transactions, general economic conditions, and other risks and uncertainties described in the company's periodic reports on file with the U.S. Securities and Exchange Commission including the most recent Annual Report on Form 10-K of the company. In some cases, you can identify these statements by forward-looking words or expressions, such as "anticipate," "believe," "could," "estimate," "expect," "forecast," "intend," "looking ahead," "may," "plan," "possible," "potential," "project," "should," "going to," "will," and similar words or expressions, the negative or plural of such words or expressions and other comparable terminology. Actual results may differ materially from anticipated results. Medtronic does not undertake to update its forward-looking statements or any of the information contained in this press release, including to reflect future events or circumstances.
NON-GAAP FINANCIAL MEASURES
This press release contains guidance and financial measures, including adjusted net income, adjusted diluted EPS, and organic revenue, which are considered "non-GAAP" financial measures under applicable SEC rules and regulations. Certain information in this press release also includes calculations or figures that have been prepared internally and have not been reviewed or audited by our independent registered public accounting firm. Use of different methods for preparing, calculating or presenting information may lead to differences and such differences may be material.
Medtronic management believes that non-GAAP financial measures provide information useful to investors in understanding the company's underlying operational performance and trends and to facilitate comparisons with the performance of other companies in the med tech industry. Non-GAAP net income and diluted EPS exclude the effect of certain charges or gains that contribute to or reduce earnings but that result from transactions or events that management believes may or may not recur with similar materiality or impact to operations in future periods (Non-GAAP Adjustments). Medtronic generally uses non-GAAP financial measures to facilitate management's review of the operational performance of the company and as a basis for strategic planning. Non-GAAP financial measures should be considered supplemental to and not a substitute for financial information prepared in accordance with
Medtronic calculates forward-looking non-GAAP financial measures based on internal forecasts that omit certain amounts that would be included in GAAP financial measures. For instance, forward-looking organic revenue growth guidance excludes the impact of foreign currency fluctuations, revenue in the current and prior year reported as "Other", as well as significant acquisitions, divestitures, or other significant discrete items. Forward-looking diluted non-GAAP EPS guidance also excludes other potential charges or gains that would be recorded as Non-GAAP Adjustments to earnings during the fiscal year. Medtronic does not attempt to provide reconciliations of forward-looking non-GAAP EPS guidance to projected GAAP EPS guidance because the combined impact and timing of recognition of these potential charges or gains is inherently uncertain and difficult to predict and is unavailable without unreasonable efforts. In addition, the company believes such reconciliations would imply a degree of precision and certainty that could be confusing to investors. Such items could have a substantial impact on GAAP measures of financial performance.
FINANCIAL COMPARISONS
References to quarterly or annual figures increasing, decreasing, or remaining flat are in comparison to fiscal year 2026, and references to sequential changes are in comparison to the prior fiscal quarter. Unless stated otherwise, quarterly and annual rates and ranges are given on an organic basis. References to organic revenue growth exclude the impact of foreign currency, first quarter revenue in the current and prior year reported as "Other", as well as significant acquisitions, divestitures, or other significant discrete items.
TRANSACTION DETAILS
The separation of our Diabetes business has involved and is expected to be completed through a series of capital markets transactions, which may include a spin-off, split-off, offering, or combination thereof. While a split-off is the company's current preferred separation structure, a final decision has not been reached at this time.
Contacts:
Justin Paquette
Public Relations
+1-612-271-7935
Investor Relations
+1-763-505-2696
____________________________________ | |
1 | The Diabetes results presented here may not correspond to the same financial statement information presented by MiniMed Group, Inc. (MiniMed) due to MiniMed's financials being prepared on a carve out basis through the date of the company's initial public offering (IPO) and on a standalone basis post IPO. |
MEDTRONIC PLC | |||||||||||||
WORLDWIDE REVENUE(1) | |||||||||||||
(Unaudited) | |||||||||||||
FIRST QUARTER(2) | |||||||||||||
REPORTED | ORGANIC | ||||||||||||
(in millions) | FY27 | FY26 | Growth | Currency | FY27(8) | FY26(8) | Growth | ||||||
Cardiovascular(3) | $ 3,927 | $ 3,285 | 19.5 % | $ 21 | $ 3,906 | $ 3,285 | 18.9 % | ||||||
Electrophysiology Therapies | 2,218 | 1,712 | 29.5 | 8 | 2,210 | 1,712 | 29.1 | ||||||
Interventional Cardiology Therapies | 894 | 834 | 7.2 | 6 | 889 | 834 | 6.5 | ||||||
CardioVascular Surgery | 477 | 436 | 9.3 | 5 | 472 | 436 | 8.1 | ||||||
Peripheral Vascular Health | 338 | 302 | 11.6 | 2 | 336 | 302 | 11.0 | ||||||
Neuroscience(3) | 2,678 | 2,427 | 10.3 | 6 | 2,653 | 2,427 | 9.3 | ||||||
Cranial & Spinal Technologies | 1,365 | 1,211 | 12.8 | (2) | 1,367 | 1,211 | 12.9 | ||||||
Specialty Therapies | 774 | 702 | 10.2 | 6 | 754 | 702 | 7.4 | ||||||
Neuromodulation(3) | 539 | 514 | 4.7 | 2 | 531 | 514 | 3.3 | ||||||
Medical Surgical(3) | 2,279 | 2,073 | 10.0 | 15 | 2,265 | 2,056 | 10.2 | ||||||
Surgical & Endoscopy(3) | 1,740 | 1,601 | 8.7 | 14 | 1,726 | 1,584 | 9.0 | ||||||
Acute Care & Monitoring | 539 | 471 | 14.4 | 1 | 538 | 471 | 14.2 | ||||||
Total Reportable Segments | 8,884 | 7,785 | 14.1 | 43 | 8,823 | 7,768 | 13.6 | ||||||
Diabetes(4) | 843 | 721 | 16.9 | 14 | 829 | 721 | 14.9 | ||||||
Other(5) | 29 | 72 | NM(6) | — | — | — | — | ||||||
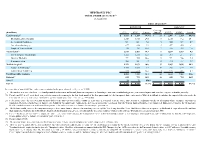
TOTAL | $ 9,756 | $ 8,578 | 13.7 % | $ 57 | $ 9,652 | $ 8,489 | 13.7 % | ||||||
See description of non-GAAP financial measures contained in the press release dated | |
(1) | The data in this schedule has been intentionally rounded to the nearest million and, therefore, may not sum. Percentages have been calculated using actual, non-rounded figures and, therefore, may not recalculate precisely. |
(2) | Fiscal year 2027 is a 53-week fiscal year, with the extra week occurring in the first fiscal month of the first quarter and included in reported first quarter results. While it is difficult to calculate the impact of the extra week, the Company estimates the extra week benefited first quarter organic growth by approximately |
(3) | In fiscal year 2027, the Cardiovascular Portfolio divisions transitioned from Cardiac Rhythm & Heart Failure, Structural Heart & Aortic, and Coronary & Peripheral Vascular to Electrophysiology Therapies, Interventional Cardiology Therapies, CardioVascular Surgery, and Peripheral Vascular Health. Additionally, there was a product line that moved from the Medical Surgical Portfolio in the Surgical & Endoscopy division to the Neuroscience Portfolio in the Neuromodulation division. Prior year net sales has been recast to conform to the current year presentation. |
(4) | The Diabetes results presented here may not correspond to the same financial statement information presented by MiniMed Group, Inc. (MiniMed). The Diabetes Business as reported by Medtronic is prepared on a different basis than standalone Medtronic due to MiniMed's financials being prepared on a carve out basis through the date of the company's initial public offering (IPO) and on a standalone basis post IPO. |
(5) | Includes the historical operations and ongoing transition agreements from businesses the Company has exited or divested, and adjustments to the Company's Italian payback accruals resulting from the |
(6) | Not meaningful (NM). |
(7) | The currency impact to revenue measures the change in revenue between current and prior year periods using constant exchange rates. |
(8) | The three months ended |
MEDTRONIC PLC | |||||||||||
(Unaudited) | |||||||||||
FIRST QUARTER(3) | |||||||||||
REPORTED | ORGANIC | ||||||||||
(in millions) | FY27 | FY26 | Growth | FY27(7) | FY26(7) | Growth | |||||
Cardiovascular(4) | $ 1,853 | $ 1,479 | 25.3 % | $ 1,853 | $ 1,479 | 25.3 % | |||||
Electrophysiology Therapies | 1,177 | 834 | 41.2 | 1,177 | 834 | 41.2 | |||||
Interventional Cardiology Therapies | 294 | 296 | (0.8) | 294 | 296 | (0.8) | |||||
CardioVascular Surgery | 186 | 170 | 9.6 | 186 | 170 | 9.6 | |||||
Peripheral Vascular Health | 196 | 180 | 9.2 | 196 | 180 | 9.2 | |||||
Neuroscience | 1,813 | 1,624 | 11.7 | 1,795 | 1,624 | 10.5 | |||||
Cranial & Spinal Technologies | 1,016 | 890 | 14.1 | 1,016 | 890 | 14.1 | |||||
Specialty Therapies | 447 | 393 | 13.8 | 434 | 393 | 10.4 | |||||
Neuromodulation | 350 | 341 | 2.6 | 345 | 341 | 1.2 | |||||
Medical Surgical | 982 | 884 | 11.1 | 982 | 884 | 11.1 | |||||
Surgical & Endoscopy | 671 | 622 | 7.9 | 671 | 622 | 7.9 | |||||
Acute Care & Monitoring | 311 | 263 | 18.5 | 311 | 263 | 18.5 | |||||
Total Reportable Segments | 4,649 | 3,988 | 16.6 | 4,630 | 3,988 | 16.1 | |||||
Diabetes(5) | 240 | 217 | 10.6 | 240 | 217 | 10.6 | |||||
Other(6) | 17 | 20 | (12.1) | — | — | — | |||||
TOTAL | $ 4,906 | $ 4,224 | 16.1 % | $ 4,870 | $ 4,205 | 15.8 % | |||||
See description of non-GAAP financial measures contained in the press release dated | |
(1) | |
(2) | The data in this schedule has been intentionally rounded to the nearest million and, therefore, may not sum. Percentages have been calculated using actual, non-rounded figures and, therefore, may not recalculate precisely. |
(3) | Fiscal year 2027 is a 53-week fiscal year, with the extra week occurring in the first fiscal month of the first quarter and included in reported first quarter results. |
(4) | In fiscal year 2027, the Cardiovascular Portfolio divisions transitioned from Cardiac Rhythm & Heart Failure, Structural Heart & Aortic, and Coronary & Peripheral Vascular to Electrophysiology Therapies, Interventional Cardiology Therapies, CardioVascular Surgery, and Peripheral Vascular Health. Prior year net sales has been recast to conform to the current year presentation. |
(5) | The Diabetes results presented here may not correspond to the same financial statement information presented by MiniMed Group, Inc. (MiniMed). The Diabetes Business as reported by Medtronic is prepared on a different basis than standalone Medtronic due to MiniMed's financials being prepared on a carve out basis through the date of the company's initial public offering (IPO) and on a standalone basis post IPO. |
(6) | Includes historical operations and ongoing transition agreements from businesses the Company has exited or divested. |
(7) | The three months ended |
MEDTRONIC PLC | |||||||||||||
INTERNATIONAL REVENUE(1) | |||||||||||||
(Unaudited) | |||||||||||||
FIRST QUARTER(2) | |||||||||||||
REPORTED | ORGANIC | ||||||||||||
(in millions) | FY27 | FY26 | Growth | Currency | FY27(8) | FY26(8) | Growth | ||||||
Cardiovascular(3) | $ 2,074 | $ 1,806 | 14.8 % | $ 21 | $ 2,053 | $ 1,806 | 13.7 % | ||||||
Electrophysiology Therapies | 1,041 | 878 | 18.5 | 8 | 1,033 | 878 | 17.6 | ||||||
Interventional Cardiology Therapies | 601 | 538 | 11.6 | 6 | 595 | 538 | 10.5 | ||||||
CardioVascular Surgery | 291 | 266 | 9.2 | 5 | 285 | 266 | 7.2 | ||||||
Peripheral Vascular Health | 142 | 123 | 15.3 | 2 | 140 | 123 | 13.7 | ||||||
Neuroscience(3) | 864 | 803 | 7.6 | 6 | 858 | 803 | 6.8 | ||||||
Cranial & Spinal Technologies | 349 | 320 | 9.0 | (2) | 351 | 320 | 9.5 | ||||||
Specialty Therapies | 326 | 309 | 5.6 | 6 | 321 | 309 | 3.7 | ||||||
Neuromodulation(3) | 189 | 174 | 8.9 | 2 | 186 | 174 | 7.4 | ||||||
Medical Surgical(3) | 1,297 | 1,188 | 9.2 | 15 | 1,282 | 1,171 | 9.5 | ||||||
Surgical & Endoscopy(3) | 1,070 | 980 | 9.2 | 14 | 1,055 | 963 | 9.6 | ||||||
Acute Care & Monitoring | 228 | 209 | 9.2 | 1 | 227 | 209 | 8.8 | ||||||
Total Reportable Segments | 4,236 | 3,797 | 11.5 | 43 | 4,193 | 3,780 | 10.9 | ||||||
Diabetes(4) | 603 | 504 | 19.6 | 14 | 589 | 504 | 16.8 | ||||||
Other(5) | 12 | 53 | NM(6) | — | — | — | — | ||||||
TOTAL | $ 4,850 | $ 4,354 | 11.4 % | $ 57 | $ 4,782 | $ 4,284 | 11.6 % | ||||||
See description of non-GAAP financial measures contained in the press release dated | |
(1) | The data in this schedule has been intentionally rounded to the nearest million and, therefore, may not sum. Percentages have been calculated using actual, non-rounded figures and, therefore, may not recalculate precisely. |
(2) | Fiscal year 2027 is a 53-week fiscal year, with the extra week occurring in the first fiscal month of the first quarter and included in reported first quarter results. |
(3) | In fiscal year 2027, the Cardiovascular Portfolio divisions transitioned from Cardiac Rhythm & Heart Failure, Structural Heart & Aortic, and Coronary & Peripheral Vascular to Electrophysiology Therapies, Interventional Cardiology Therapies, CardioVascular Surgery, and Peripheral Vascular Health. Additionally, there was a product line that moved from the Medical Surgical Portfolio in the Surgical & Endoscopy division to the Neuroscience Portfolio in the Neuromodulation division. Prior year net sales has been recast to conform to the current year presentation. |
(4) | The Diabetes results presented here may not correspond to the same financial statement information presented by MiniMed Group, Inc. (MiniMed). The Diabetes Business as reported by Medtronic is prepared on a different basis than standalone Medtronic due to MiniMed's financials being prepared on a carve out basis through the date of the company's initial public offering (IPO) and on a standalone basis post IPO. |
(5) | Includes the historical operations and ongoing transition agreements from businesses the Company has exited or divested, and adjustments to the Company's Italian payback accruals resulting from the |
(6) | Not meaningful (NM). |
(7) | The currency impact to revenue measures the change in revenue between current and prior year periods using constant exchange rates. |
(8) | The three months ended |
MEDTRONIC PLC | |||
CONDENSED CONSOLIDATED STATEMENTS OF INCOME | |||
(Unaudited) | |||
Three months ended | |||
(in millions, except per share data) | |||
Net sales | $ 9,756 | $ 8,578 | |
Costs and expenses: | |||
Cost of products sold, excluding amortization of intangible assets | 3,416 | 3,001 | |
Research and development expense | 771 | 726 | |
Selling, general, and administrative expense | 3,198 | 2,806 | |
Amortization of intangible assets | 412 | 459 | |
Restructuring charges, net | 72 | 45 | |
Certain litigation charges, net | — | 27 | |
Other operating expense (income), net | 123 | 70 | |
Operating profit | 1,764 | 1,445 | |
Other non-operating expense (income), net | (190) | (33) | |
Interest expense, net | 186 | 176 | |
Income before income taxes | 1,769 | 1,302 | |
Income tax provision | 289 | 255 | |
Net income | 1,479 | 1,047 | |
Net income attributable to noncontrolling interests | (9) | (7) | |
Net income attributable to Medtronic | $ 1,470 | $ 1,040 | |
Basic earnings per share | $ 1.15 | $ 0.81 | |
Diluted earnings per share | $ 1.14 | $ 0.81 | |
Basic weighted average shares outstanding | 1,279.8 | 1,281.6 | |
Diluted weighted average shares outstanding | 1,285.1 | 1,287.1 | |
The data in the schedule above has been intentionally rounded to the nearest million. |
MEDTRONIC PLC | |||||||||||||||||
GAAP TO NON-GAAP RECONCILIATIONS(1) | |||||||||||||||||
(Unaudited) | |||||||||||||||||
Three months ended | |||||||||||||||||
(in millions, except per share data) | Net | Cost of | Gross | Operating | Operating | Income | Net Income | Diluted | Effective | ||||||||
GAAP | $ 9,756 | $ 3,416 | 65.0 % | $ 1,764 | 18.1 % | $ 1,769 | $ 1,470 | $ 1.14 | 16.4 % | ||||||||
Non-GAAP Adjustments: | |||||||||||||||||
Amortization of intangible assets | — | — | — | 412 | 4.2 | 412 | 337 | 0.26 | 18.2 | ||||||||
Restructuring and associated costs(2) | — | (8) | 0.1 | 89 | 0.9 | 89 | 70 | 0.05 | 21.2 | ||||||||
Acquisition and divestiture-related items(3) | — | (11) | 0.1 | 50 | 0.5 | 50 | 41 | 0.03 | 18.2 | ||||||||
(Gain)/loss on minority investments(4) | — | — | — | — | — | (64) | (64) | (0.05) | (0.1) | ||||||||
Certain tax adjustments, net(5) | — | — | — | — | — | — | 5 | — | — | ||||||||
Non-GAAP | $ 9,756 | $ 3,396 | 65.2 % | $ 2,316 | 23.7 % | $ 2,257 | $ 1,860 | $ 1.45 | 17.2 % | ||||||||
Currency impact | (57) | (21) | — | (27) | (0.1) | (0.02) | |||||||||||
Currency Adjusted | $ 9,699 | $ 3,375 | 65.2 % | $ 2,290 | 23.6 % | $ 1.43 | |||||||||||
Three months ended | |||||||||||||||||
(in millions, except per share data) | Net | Cost of | Gross | Operating | Operating | Income | Net Income | Diluted | Effective | ||||||||
GAAP | $ 8,578 | $ 3,001 | 65.0 % | $ 1,445 | 16.8 % | $ 1,302 | $ 1,040 | $ 0.81 | 19.6 % | ||||||||
Non-GAAP Adjustments: | |||||||||||||||||
Amortization of intangible assets(6) | — | — | — | 459 | 5.5 | 459 | 374 | 0.29 | 18.5 | ||||||||
Restructuring and associated costs(2) | — | (16) | 0.1 | 67 | 0.8 | 67 | 51 | 0.04 | 22.4 | ||||||||
Acquisition and divestiture-related items(3) | — | (7) | — | 58 | 0.7 | 58 | 48 | 0.04 | 17.2 | ||||||||
Certain litigation charges, net | — | — | — | 27 | 0.3 | 27 | 21 | 0.02 | 22.2 | ||||||||
(Gain)/loss on minority investments(4) | — | — | — | — | — | 113 | 107 | 0.08 | 6.2 | ||||||||
Other(7) | (39) | — | (0.2) | (39) | (0.5) | (39) | (30) | (0.02) | 20.5 | ||||||||
Certain tax adjustments, net(5) | — | — | — | — | — | — | 16 | 0.01 | — | ||||||||
Non-GAAP | $ 8,539 | $ 2,979 | 65.1 % | $ 2,016 | 23.6 % | $ 1,987 | $ 1,626 | $ 1.26 | 17.8 % | ||||||||
See description of non-GAAP financial measures contained in the press release dated | |
(1) | The data in this schedule has been intentionally rounded to the nearest million or |
(2) | The charges primarily relate to employee termination benefits, facility related and contract termination costs, and asset write offs. |
(3) | The charges primarily include business combination costs, changes in fair value of contingent consideration, and exit of business-related charges. Exit of business-related charges primarily relate to the impending separation of the Diabetes Business and costs associated with the Company's |
(4) | We exclude unrealized and realized gains and losses on our minority investments as we do not believe that these components of income or expense have a direct correlation to our ongoing or future business operations. |
(5) | The net charges for the three months ended |
(6) | The Company recognized |
(7) | Reflects adjustments to the Company's Italian payback accruals resulting from the |
MEDTRONIC PLC | |||||||||||||||
GAAP TO NON-GAAP RECONCILIATIONS(1) | |||||||||||||||
(Unaudited) | |||||||||||||||
Three months ended | |||||||||||||||
(in millions) | SG&A | SG&A | R&D | R&D | Other | Other | Other Non- | ||||||||
GAAP | $ 9,756 | $ 3,198 | 32.8 % | $ 771 | 7.9 % | $ 123 | 1.3 % | $ (190) | |||||||
Non-GAAP Adjustments: | |||||||||||||||
Restructuring and associated costs(2) | — | (10) | (0.1) | — | — | — | — | — | |||||||
Acquisition and divestiture-related items(3) | — | (26) | (0.3) | — | — | (13) | (0.1) | — | |||||||
(Gain)/loss on minority investments(4) | — | — | — | — | — | — | — | 64 | |||||||
Non-GAAP | $ 9,756 | $ 3,162 | 32.4 % | $ 771 | 7.9 % | $ 110 | 1.1 % | $ (127) | |||||||
See description of non-GAAP financial measures contained in the press release dated | |
(1) | The data in this schedule has been intentionally rounded to the nearest million, and, therefore, may not sum. |
(2) | The charges primarily relate to employee termination benefits, facility related and contract termination costs, and asset write offs. |
(3) | The charges primarily include business combination costs, changes in fair value of contingent consideration, and exit of business-related charges. Exit of business-related charges primarily relate to the impending separation of the Diabetes Business and costs associated with the Company's |
(4) | We exclude unrealized and realized gains and losses on our minority investments as we do not believe that these components of income or expense have a direct correlation to our ongoing or future business operations. |
MEDTRONIC PLC | |||
GAAP TO NON-GAAP RECONCILIATIONS(1) | |||
(Unaudited) | |||
Three months ended | |||
(in millions) | |||
Net cash provided by operating activities | $ 1,793 | $ 1,088 | |
Additions to property, plant, and equipment | (503) | (504) | |
Free Cash Flow(2) | $ 1,290 | $ 584 | |
See description of non-GAAP financial measures contained in the press release dated | |
(1) | The data in this schedule has been intentionally rounded to the nearest million, and, therefore, may not sum. |
(2) | Free cash flow represents operating cash flows less property, plant, and equipment additions. |
MEDTRONIC PLC | |||
CONDENSED CONSOLIDATED STATEMENTS OF CASH FLOWS | |||
(Unaudited) | |||
Three months ended | |||
(in millions) | |||
Operating Activities: | |||
Net income | $ 1,479 | $ 1,047 | |
Adjustments to reconcile net income to net cash provided by operating activities: | |||
Depreciation and amortization | 729 | 748 | |
Provision for credit losses | 25 | 28 | |
Deferred income taxes | 127 | 167 | |
Stock-based compensation | 125 | 86 | |
Other, net | (29) | 159 | |
Change in operating assets and liabilities, net of acquisitions and divestitures: | |||
Accounts receivable, net | 224 | 288 | |
Inventories | (240) | (373) | |
Accounts payable and accrued liabilities | (531) | (598) | |
Other operating assets and liabilities | (118) | (464) | |
Net cash provided by operating activities | 1,793 | 1,088 | |
Investing Activities: | |||
Acquisitions, net of cash acquired | (1,162) | — | |
Additions to property, plant, and equipment | (503) | (504) | |
Purchases of investments | (2,190) | (2,100) | |
Sales and maturities of investments | 2,209 | 2,010 | |
Other investing activities, net | 26 | (125) | |
Net cash used in investing activities | (1,619) | (719) | |
Financing Activities: | |||
Change in current debt obligations, net | 812 | 649 | |
Payments on long-term debt | — | (1,162) | |
Dividends to shareholders | (921) | (910) | |
Issuance of ordinary shares | 20 | 95 | |
Repurchase of ordinary shares | (267) | (123) | |
Other financing activities, net | 13 | 70 | |
Net cash used in financing activities | (343) | (1,381) | |
Effect of exchange rate changes on cash and cash equivalents | (89) | 67 | |
Net change in cash and cash equivalents | (258) | (945) | |
Cash and cash equivalents at beginning of period | 1,949 | 2,218 | |
Cash and cash equivalents at end of period | $ 1,691 | $ 1,273 | |
Supplemental Cash Flow Information | |||
Cash paid for: | |||
Income taxes | $ 199 | $ 402 | |
Interest | 83 | 81 | |
The data in this schedule has been intentionally rounded to the nearest million, and, therefore, may not sum. |


 View original content to download multimedia:https://www.prnewswire.com/news-releases/medtronic-reports-first-quarter-fiscal-2027-results-delivers-broad-based-portfolio-performance-and-raises-fiscal-2027-guidance-302865648.html
SOURCE Medtronic plc