


Pega Drives Cash Flow and Releases AI Innovation in Q2 2026
- Pega Cloud Annual Contract Value (ACV) increases 22% year over year
- ACV grows 7% year over year (8% in constant currency)
- Cash flow from operations and free cash flow both exceed $285M in first half of 2026
- Clients react with enthusiasm to Pega’s ‘no per-token cost’
WALTHAM, Mass.--(BUSINESS WIRE)-- Pegasystems Inc. (NASDAQ: PEGA), the Enterprise Transformation Company™, released its financial results for the second quarter of 2026.
This press release features multimedia. View the full release here: https://www.businesswire.com/news/home/20260721204149/en/
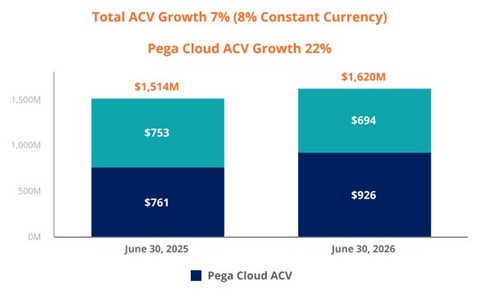
Total ACV Growth and Pega Cloud ACV Growth
"Pega Infinity™ 26 uniquely deploys the power of AI with predictable outcomes and predicable costs by applying agents at design time to optimize run-time token use,” said Alan Trefler, founder and CEO, Pega. "Letting language models do everything is risky and expensive, and using AI to write mountains of code creates significant barriers to the ongoing change that enterprise clients require. Pega structures business applications in a way that makes sense to business and IT to Build for Change®.”
"Pega generated record first-half cash flow and returned substantial capital to shareholders,” said Ken Stillwell, COO and CFO, Pega. “As the market shifts from AI experimentation to tokenomics and reliable business outcomes, that evolution plays directly to Pega’s strengths, and we remain confident in our strategy to capitalize on the opportunity ahead.”
Financial and performance metrics (1)
Unprecedented changes in the AI market caused clients to delay their purchasing decisions. As a result, our ACV growth rate significantly slowed during the six months ended June 30, 2026, as compared to the same period last year. These factors may continue to adversely affect the ACV growth rate for the rest of the year.
Reconciliation of ACV and Constant Currency ACV
(in millions, except percentages) |
June 30, 2025 |
|
June 30, 2026 |
|
1-Year Change |
|||
ACV |
$ |
1,514 |
|
$ |
1,620 |
|
7 |
% |
Impact of changes in foreign exchange rates |
|
— |
|
|
10 |
|
|
|
Constant currency ACV |
$ |
1,514 |
|
$ |
1,630 |
|
8 |
% |
Note: Constant currency ACV is calculated by applying the June 30, 2025 foreign exchange rates to current period shown. |
||||||||
Cash Flow Growth
As a result of the factors discussed under ACV above, our cash flow generation may continue to be adversely affected for the rest of the year.
(Dollars in thousands, except per share amounts) |
Three Months Ended June 30, |
|
|
|
Six Months Ended June 30, |
|
|
||||||||||
2026 |
|
2025 |
|
Change |
|
2026 |
|
2025 |
|
Change |
|||||||
Total revenue |
$ |
420,716 |
|
$ |
384,512 |
|
9 |
% |
|
$ |
850,689 |
|
$ |
860,145 |
|
(1 |
)% |
Net income - GAAP |
$ |
13,334 |
|
$ |
30,077 |
|
(56 |
)% |
|
$ |
46,098 |
|
$ |
115,499 |
|
(60 |
)% |
Net income - non-GAAP |
$ |
59,533 |
|
$ |
50,151 |
|
19 |
% |
|
$ |
142,601 |
|
$ |
190,693 |
|
(25 |
)% |
Diluted earnings per share - GAAP |
$ |
0.08 |
|
$ |
0.17 |
|
(53 |
)% |
|
$ |
0.26 |
|
$ |
0.63 |
|
(59 |
)% |
Diluted earnings per share - non-GAAP |
$ |
0.35 |
|
$ |
0.28 |
|
25 |
% |
|
$ |
0.81 |
|
$ |
1.04 |
|
(22 |
)% |
(Dollars in thousands) |
Three Months Ended June 30, |
|
Change |
|
Six Months Ended June 30, |
|
Change |
||||||||||||||||||||||||||||||
2026 |
|
2025 |
|
|
2026 |
|
2025 |
|
|||||||||||||||||||||||||||||
Pega Cloud |
$ |
213,934 |
51 |
% |
|
$ |
166,743 |
43 |
% |
|
$ |
47,191 |
|
28 |
% |
|
$ |
418,965 |
49 |
% |
|
$ |
317,866 |
37 |
% |
|
$ |
101,099 |
|
32 |
% |
||||||
Maintenance |
|
74,528 |
18 |
% |
|
|
79,271 |
21 |
% |
|
|
(4,743 |
) |
(6 |
)% |
|
|
149,845 |
18 |
% |
|
|
155,639 |
18 |
% |
|
|
(5,794 |
) |
(4 |
)% |
||||||
Subscription services |
|
288,462 |
69 |
% |
|
|
246,014 |
64 |
% |
|
|
42,448 |
|
17 |
% |
|
|
568,810 |
67 |
% |
|
|
473,505 |
55 |
% |
|
|
95,305 |
|
20 |
% |
||||||
Subscription license |
|
82,028 |
19 |
% |
|
|
80,674 |
21 |
% |
|
|
1,354 |
|
2 |
% |
|
|
176,880 |
21 |
% |
|
|
268,395 |
31 |
% |
|
|
(91,515 |
) |
(34 |
)% |
||||||
Subscription |
|
370,490 |
88 |
% |
|
|
326,688 |
85 |
% |
|
|
43,802 |
|
13 |
% |
|
|
745,690 |
88 |
% |
|
|
741,900 |
86 |
% |
|
|
3,790 |
|
1 |
% |
||||||
Consulting |
|
50,226 |
12 |
% |
|
|
57,824 |
15 |
% |
|
|
(7,598 |
) |
(13 |
)% |
|
|
104,999 |
12 |
% |
|
|
118,245 |
14 |
% |
|
|
(13,246 |
) |
(11 |
)% |
||||||
Total revenue |
$ |
420,716 |
100 |
% |
|
$ |
384,512 |
100 |
% |
|
$ |
36,204 |
|
9 |
% |
|
$ |
850,689 |
100 |
% |
|
$ |
860,145 |
100 |
% |
|
$ |
(9,456 |
) |
(1 |
)% |
||||||
Quarterly conference call
A conference call and audio-only webcast will be conducted at 8:00 a.m. EDT on Wednesday, July 22, 2026.
Members of the public and investors are invited to join the call and participate in the question and answer session by dialing 1 (833) 461-5787 (domestic) or 1 (626) 884-3620 (international) and using Conference ID 421269211, or via https://events.q4inc.com/attendee/421269211 by logging onto www.pega.com at least five minutes prior to the event's broadcast and clicking on the webcast icon in the Investors section.
Discussion of non-GAAP financial measures
Our non-GAAP financial measures should only be read in conjunction with our consolidated financial statements prepared in accordance with GAAP. We believe that these measures help investors understand our core operating results and prospects, which is consistent with how management measures and forecasts our performance without the effect of often one-time charges and other items outside our normal operations. Management uses these measures to assess the performance of the company's operations and establish operational goals and incentives. They are not a substitute for financial measures prepared under U.S. GAAP. Refer to the schedules at the end of this release for additional information, including a reconciliation of GAAP and non-GAAP measures.
Forward-looking statements
Certain statements in this press release may be "forward-looking statements” as defined in the Private Securities Litigation Reform Act of 1995, including statements about the growth and development of our business and market.
Words such as expects, anticipates, intends, plans, believes, will, could, should, estimates, may, targets, strategies, intends to, projects, positions, forecasts, guidance, likely, and usually or variations of such words and other similar expressions identify forward-looking statements. These statements represent our views only as of the date the statement was made and are based on current expectations and assumptions.
Forward-looking statements deal with future events and are subject to risks and uncertainties that are difficult to predict, including, but not limited to:
- our future financial performance and business plans;
- the adequacy of our liquidity and capital resources;
- the successful execution of investments in artificial intelligence;
- the timing of revenue recognition;
- variation in demand for our products and services;
- reliance on key personnel;
- potential legal and financial liabilities, as well as damage to our reputation, due to cyber-attacks;
- security breaches and security flaws;
- our ability to protect our intellectual property rights, costs associated with defending such rights, intellectual property rights claims, and other related claims by third parties against us, including related costs, damages, and other relief that may be granted against us;
- our ongoing litigation with Appian Corp. and associated legal proceedings;
- our client retention rate; and
- management of our growth.
These risks and others that may cause actual results to differ materially from those expressed in such forward-looking statements are described further in Part I of our Annual Report on Form 10-K for the year ended December 31, 2025, and other filings we make with the SEC.
Investors are cautioned not to place undue reliance on such forward-looking statements, and there are no assurances that the results included in such statements will be achieved. Although subsequent events may cause our view to change, except as required by applicable law, we do not undertake and expressly disclaim any obligation to publicly update or revise these forward-looking statements, whether as the result of new information, future events, or otherwise.
Any forward-looking statements in this press release represent our views as of July 21, 2026.
About Pegasystems
Pega delivers the platform to reimagine, run, and evolve the processes and decisions an enterprise can't afford to get wrong. We combine AI with proven architecture to keep mission-critical operations governed, scalable, and continuously adaptable. Since 1983, the world's largest organizations have trusted Pega to turn transformation ambition into durable results. Learn more at www.pega.com.
All trademarks are the property of their respective owners.
(1) Refer to the schedules at the end of this release for additional information, including a reconciliation of GAAP and non-GAAP measures.
PEGASYSTEMS INC. |
|||||||||||||||
UNAUDITED CONDENSED CONSOLIDATED STATEMENTS OF OPERATIONS |
|||||||||||||||
(in thousands, except per share amounts) |
|||||||||||||||
|
Three Months Ended June 30, |
|
Six Months Ended June 30, |
||||||||||||
|
|
2026 |
|
|
|
2025 |
|
|
|
2026 |
|
|
|
2025 |
|
Revenue |
|
|
|
|
|
|
|
||||||||
Subscription services |
$ |
288,462 |
|
|
$ |
246,014 |
|
|
$ |
568,810 |
|
|
$ |
473,505 |
|
Subscription license |
|
82,028 |
|
|
|
80,674 |
|
|
|
176,880 |
|
|
|
268,395 |
|
Consulting |
|
50,226 |
|
|
|
57,824 |
|
|
|
104,999 |
|
|
|
118,245 |
|
Total revenue |
|
420,716 |
|
|
|
384,512 |
|
|
|
850,689 |
|
|
|
860,145 |
|
Cost of revenue |
|
|
|
|
|
|
|
||||||||
Subscription services |
|
53,941 |
|
|
|
41,510 |
|
|
|
103,390 |
|
|
|
79,638 |
|
Subscription license |
|
267 |
|
|
|
364 |
|
|
|
738 |
|
|
|
752 |
|
Consulting |
|
53,821 |
|
|
|
67,700 |
|
|
|
110,655 |
|
|
|
131,634 |
|
Total cost of revenue |
|
108,029 |
|
|
|
109,574 |
|
|
|
214,783 |
|
|
|
212,024 |
|
Gross profit |
|
312,687 |
|
|
|
274,938 |
|
|
|
635,906 |
|
|
|
648,121 |
|
Operating expenses |
|
|
|
|
|
|
|
||||||||
Selling and marketing |
|
165,408 |
|
|
|
147,131 |
|
|
|
321,011 |
|
|
|
285,200 |
|
Research and development |
|
84,168 |
|
|
|
78,784 |
|
|
|
166,215 |
|
|
|
153,070 |
|
General and administrative |
|
43,740 |
|
|
|
31,788 |
|
|
|
92,313 |
|
|
|
65,616 |
|
Restructuring |
|
2,735 |
|
|
|
(44 |
) |
|
|
2,582 |
|
|
|
(33 |
) |
Total operating expenses |
|
296,051 |
|
|
|
257,659 |
|
|
|
582,121 |
|
|
|
503,853 |
|
Income from operations |
|
16,636 |
|
|
|
17,279 |
|
|
|
53,785 |
|
|
|
144,268 |
|
Foreign currency transaction (loss) gain |
|
(1,364 |
) |
|
|
(14,008 |
) |
|
|
486 |
|
|
|
(19,333 |
) |
Interest income |
|
2,500 |
|
|
|
3,248 |
|
|
|
5,454 |
|
|
|
8,583 |
|
Interest expense |
|
(45 |
) |
|
|
(1 |
) |
|
|
(89 |
) |
|
|
(1,028 |
) |
(Loss) on capped call transactions |
|
— |
|
|
|
— |
|
|
|
— |
|
|
|
(223 |
) |
Other income (loss), net |
|
786 |
|
|
|
18,729 |
|
|
|
(1,418 |
) |
|
|
19,290 |
|
Income before provision for (benefit from) income taxes |
|
18,513 |
|
|
|
25,247 |
|
|
|
58,218 |
|
|
|
151,557 |
|
Provision for (benefit from) income taxes |
|
5,179 |
|
|
|
(4,830 |
) |
|
|
12,120 |
|
|
|
36,058 |
|
Net income |
$ |
13,334 |
|
|
$ |
30,077 |
|
|
$ |
46,098 |
|
|
$ |
115,499 |
|
Earnings per share |
|
|
|
|
|
|
|
||||||||
Basic |
$ |
0.08 |
|
|
$ |
0.18 |
|
|
$ |
0.28 |
|
|
$ |
0.67 |
|
Diluted |
$ |
0.08 |
|
|
$ |
0.17 |
|
|
$ |
0.26 |
|
|
$ |
0.63 |
|
Weighted-average number of common shares outstanding |
|
|
|
|
|
|
|
||||||||
Basic |
|
165,613 |
|
|
|
170,776 |
|
|
|
167,206 |
|
|
|
171,287 |
|
Diluted |
|
171,765 |
|
|
|
182,160 |
|
|
|
175,294 |
|
|
|
185,477 |
|
PEGASYSTEMS INC. |
|||||
UNAUDITED CONDENSED CONSOLIDATED BALANCE SHEETS |
|||||
(in thousands) |
|||||
|
June 30, 2026 |
|
December 31, 2025 |
||
Assets |
|
|
|
||
Current assets: |
|
|
|
||
Cash and cash equivalents |
$ |
185,110 |
|
$ |
212,447 |
Marketable securities |
|
176,797 |
|
|
213,352 |
Total cash, cash equivalents, and marketable securities |
|
361,907 |
|
|
425,799 |
Accounts receivable, net |
|
143,213 |
|
|
264,713 |
Unbilled receivables, net |
|
154,029 |
|
|
166,478 |
Other current assets |
|
102,559 |
|
|
121,305 |
Total current assets |
|
761,708 |
|
|
978,295 |
Long-term unbilled receivables, net |
|
77,947 |
|
|
102,544 |
Goodwill |
|
81,265 |
|
|
81,506 |
Long-term deferred income taxes |
|
176,903 |
|
|
175,472 |
Other long-term assets |
|
286,220 |
|
|
294,027 |
Total assets |
$ |
1,384,043 |
|
$ |
1,631,844 |
Liabilities and stockholders’ equity |
|
|
|
||
Current liabilities: |
|
|
|
||
Accounts payable |
$ |
52,964 |
|
$ |
12,924 |
Accrued expenses |
|
92,295 |
|
|
44,847 |
Accrued compensation and related expenses |
|
87,583 |
|
|
148,797 |
Deferred revenue |
|
462,532 |
|
|
509,275 |
Other current liabilities |
|
23,886 |
|
|
21,935 |
Total current liabilities |
|
719,260 |
|
|
737,778 |
Long-term operating lease liabilities |
|
56,996 |
|
|
60,825 |
Other long-term liabilities |
|
47,403 |
|
|
45,860 |
Total liabilities |
|
823,659 |
|
|
844,463 |
Total stockholders’ equity |
|
560,384 |
|
|
787,381 |
Total liabilities and stockholders’ equity |
$ |
1,384,043 |
|
$ |
1,631,844 |
PEGASYSTEMS INC. |
|||||||
UNAUDITED CONDENSED CONSOLIDATED STATEMENTS OF CASH FLOWS |
|||||||
(in thousands) |
|||||||
|
Six Months Ended June 30, |
||||||
|
|
2026 |
|
|
|
2025 |
|
Net income |
$ |
46,098 |
|
|
$ |
115,499 |
|
Adjustments to reconcile net income to cash provided by operating activities |
|
|
|
||||
Non-cash items |
|
125,635 |
|
|
|
123,170 |
|
Change in operating assets and liabilities, net |
|
126,492 |
|
|
|
51,827 |
|
Cash provided by operating activities |
|
298,225 |
|
|
|
290,496 |
|
Cash provided by investing activities |
|
25,832 |
|
|
|
212,995 |
|
Cash (used in) financing activities |
|
(349,030 |
) |
|
|
(646,316 |
) |
Effect of exchange rate changes on cash, cash equivalents, and restricted cash |
|
(2,299 |
) |
|
|
7,407 |
|
Net (decrease) in cash, cash equivalents, and restricted cash |
|
(27,272 |
) |
|
|
(135,418 |
) |
Cash, cash equivalents, and restricted cash, beginning of period |
|
216,360 |
|

|
|
341,529 |
|
Cash, cash equivalents, and restricted cash, end of period |
$ |
189,088 |
|
|
$ |
206,111 |
|
PEGASYSTEMS INC. |
|||||||||||||||||||||
RECONCILIATION OF SELECTED GAAP AND NON-GAAP MEASURES |
|||||||||||||||||||||
(in thousands, except percentages and per share amounts) |
|||||||||||||||||||||
|
Three Months Ended June 30, |
|
Six Months Ended June 30, |
||||||||||||||||||
|
2026 |
|
|
|
2025 |
|
|
Change |
|
|
2026 |
|
|
|
2025 |
|
|
Change |
|||
Net income - GAAP |
$ |
13,334 |
|
|
$ |
30,077 |
|
|
(56 |
)% |
|
$ |
46,098 |
|
|
$ |
115,499 |
|
|
(60 |
)% |
Stock-based compensation (1) |
|
36,226 |
|
|
|
36,730 |
|
|
|
|
|
82,041 |
|
|
|
78,155 |
|
|
|
||
Legal fees |
|
17,950 |
|
|
|
6,409 |
|
|
|
|
|
37,914 |
|
|
|
12,953 |
|
|
|
||
Amortization of intangible assets |
|
237 |
|
|
|
675 |
|
|
|
|
|
1,020 |
|
|
|
1,376 |
|
|
|
||
Restructuring |
|
2,735 |
|
|
|
(44 |
) |
|
|
|
|
2,582 |
|
|
|
(33 |
) |
|
|
||
Foreign currency transaction loss (gain) |
|
1,364 |
|
|
|
14,008 |
|
|
|
|
|
(486 |
) |
|
|
19,333 |
|
|
|
||
Interest on convertible senior notes |
|
— |
|
|
|
— |
|
|
|
|
|
— |
|
|
|
394 |
|
|
|
||
Capped call transactions |
|
— |
|
|
|
— |
|
|
|
|
|
— |
|
|
|
223 |
|
|
|
||
Other |
|
(700 |
) |
|
|
(18,729 |
) |
|
|
|
|
1,533 |
|
|
|
(19,480 |
) |
|
|
||
Income taxes (2) |
|
(11,613 |
) |
|
|
(18,975 |
) |
|
|
|
|
(28,101 |
) |
|
|
(17,727 |
) |
|
|
||
Net income - non-GAAP |
$ |
59,533 |
|
|
$ |
50,151 |
|
|
19 |
% |
|
$ |
142,601 |
|
|
$ |
190,693 |
|
|
(25 |
)% |
|
|
|
|
|
|
|
|
|
|
|
|
||||||||||
Diluted earnings per share - GAAP |
$ |
0.08 |
|
|
$ |
0.17 |
|
|
(53 |
)% |
|
$ |
0.26 |
|
|
$ |
0.63 |
|
|
(59 |
)% |
non-GAAP adjustments |
|
0.27 |
|
|
|
0.11 |
|
|
|
|
|
0.55 |
|
|
|
0.41 |
|
|
|
||
Diluted earnings per share - non-GAAP |
$ |
0.35 |
|
|
$ |
0.28 |
|
|
25 |
% |
|
$ |
0.81 |
|
|
$ |
1.04 |
|
|
(22 |
)% |
|
|
|
|
|
|
|
|
|
|
|
|
||||||||||
Diluted weighted-average number of common shares outstanding - GAAP |
|
171,765 |
|
|
|
182,160 |
|
|
(6 |
)% |
|
|
175,294 |
|
|
|
185,477 |
|
|
(5 |
)% |
Capped call transactions |
|
— |
|
|
|
— |
|
|
|
|
|
— |
|
|
|
(2,412 |
) |
|
|
||
Diluted weighted-average number of common shares outstanding - non-GAAP |
|
171,765 |
|
|
|
182,160 |
|
|
(6 |
)% |
|
|
175,294 |
|
|
|
183,065 |
|
|
(4 |
)% |
Our non-GAAP financial measures reflect the following adjustments:
- Stock-based compensation: We have excluded stock-based compensation from our non-GAAP operating expenses and profitability measures. Although stock-based compensation is a key incentive offered to our employees, and we believe such compensation contributed to our revenues recognized during the periods presented and is expected to contribute to our future revenues, we continue to evaluate our business performance, excluding stock-based compensation.
- Legal fees: Legal and related fees arising from proceedings outside the ordinary course of business. We believe excluding these amounts from our non-GAAP financial measures is useful to investors as the types of events giving rise to them are not representative of our core business operations and ongoing operational performance.
- Amortization of intangible assets: We have excluded the amortization of intangible assets from our non-GAAP operating expenses and profitability measures. Amortization of intangible assets fluctuates in amount and frequency and is significantly affected by the timing and size of acquisitions. Investors should note that intangible assets contributed to our revenues recognized during the periods presented and are expected to contribute to future revenues. Amortization of intangible assets is likely to recur in future periods. We believe excluding these amounts provides a useful comparison of our operational performance in different periods.
- Restructuring: We have excluded restructuring from our non-GAAP financial measures. Restructuring fluctuates in amount and frequency and is significantly affected by the timing and size of our restructuring activities. We believe excluding these amounts from our non-GAAP financial measures is useful to investors as these amounts are not representative of our core business operations and ongoing operational performance.
- Foreign currency transaction loss (gain): We have excluded foreign currency transaction gains and losses from our non-GAAP profitability measures. Foreign currency transaction gains and losses fluctuate in amount and frequency and are significantly affected by foreign exchange market rates. Foreign currency transaction gains and losses are likely to recur in future periods. We believe excluding these amounts provides a useful comparison of our operational performance in different periods.
- Interest on convertible senior notes: In February 2020, we issued convertible senior notes (the “Notes”), due March 1, 2025, in a private placement. The Notes accrued interest at an annual rate of 0.75%, paid semi-annually in arrears on March 1 and September 1. The outstanding Notes were repaid in their entirety at maturity. We believe that excluding the amortization of issuance costs provides a useful comparison of our operational performance in different periods.
- Capped call transactions: We have excluded gains and losses related to our capped call transactions held at fair value under U.S. GAAP. The capped call transactions were expected to reduce common stock dilution and/or offset any potential cash payments we must make, other than for principal and interest, upon conversion of the Notes. We believe excluding these amounts from our non-GAAP financial measures is useful to investors as the types of events giving rise to them are not representative of our core business operations and ongoing operational performance.
- Other: We have excluded gains and losses from our venture investments and other one-time, non-operating items. We believe excluding these amounts from our non-GAAP financial measures is useful to investors as the types of events giving rise to them are not representative of our core business operations and ongoing operational performance.
-
Diluted weighted-average number of common shares outstanding:
-
Capped call transactions: In periods of GAAP net income, the shares calculated by applying the if-converted method related to our Notes are included in the diluted weighted-average shares outstanding if they are dilutive. The capped call transactions were expected to reduce common stock dilution and/or offset any potential cash payments we must make, other than for principal and interest, upon conversion of the Notes. We believe that including the expected impact of the capped call transactions in our non-GAAP financial measures provides a useful comparison of our operational performance in different periods.
-
Capped call transactions: In periods of GAAP net income, the shares calculated by applying the if-converted method related to our Notes are included in the diluted weighted-average shares outstanding if they are dilutive. The capped call transactions were expected to reduce common stock dilution and/or offset any potential cash payments we must make, other than for principal and interest, upon conversion of the Notes. We believe that including the expected impact of the capped call transactions in our non-GAAP financial measures provides a useful comparison of our operational performance in different periods.
(1) Stock-based compensation:
|
Three Months Ended June 30, |
|
Six Months Ended June 30, |
||||||||||||
(Dollars in thousands) |
|
2026 |
|
|
|
2025 |
|
|
|
2026 |
|
|
|
2025 |
|
Cost of revenue |
$ |
6,752 |
|
|
$ |
7,288 |
|
|
$ |
14,628 |
|
|
$ |
15,111 |
|
Selling and marketing |
|
14,555 |
|
|
|
14,378 |
|
|
|
33,009 |
|
|
|
30,159 |
|
Research and development |
|
7,943 |
|
|
|
7,490 |
|
|
|
17,962 |
|
|
|
15,875 |
|
General and administrative |
|
6,976 |
|
|
|
7,574 |
|
|
|
16,442 |
|
|
|
17,010 |
|
|
$ |
36,226 |
|
|
$ |
36,730 |
|
|
$ |
82,041 |
|
|
$ |
78,155 |
|
Income tax benefit |
$ |
(7,091 |
) |
|
$ |
(566 |
) |
|
$ |
(16,255 |
) |
|
$ |
(1,153 |
) |
(2) Effective income tax rates:
|
Six Months Ended June 30, |
||||
|
2026 |
|
2025 |
||
GAAP |
21 |
% |
|
24 |
% |
non-GAAP |
22 |
% |
|
22 |
% |
Our GAAP effective income tax rate is subject to significant fluctuations due to several factors, including our stock-based compensation plans, research and development tax credits, and the valuation allowance on our deferred tax assets in the U.S. and U.K. We determine our non-GAAP income tax rate using applicable rates in taxing jurisdictions and assessing certain factors, including historical and forecasted earnings by jurisdiction, discrete items, and ability to realize tax assets. We believe it is beneficial for our management to review our non-GAAP results consistent with our annual plan’s effective income tax rate as established at the beginning of each year, given tax rate volatility.
PEGASYSTEMS INC. |
||||||||||
RECONCILIATION OF FREE CASH FLOW (1) AND OTHER METRICS |
||||||||||
(in thousands, except percentages) |
||||||||||
|
Six Months Ended June 30, |
|
Change |
|||||||
|
2026 |
|
|
|
2025 |
|
|
|||
Cash provided by operating activities |
$ |
298,225 |
|
|
|
290,496 |
|
|
3 |
% |
Investment in property and equipment |
|
(9,967 |
) |
|
|
(4,015 |
) |
|
|
|
Free cash flow (1) |
$ |
288,258 |
|
|
$ |
286,481 |
|
|
1 |
% |
|
|
|
|
|
|
|||||
Supplemental information (2) |
|
|
|
|
|
|||||
Legal fees |
$ |
9,188 |
|
|
$ |
10,020 |
|
|
|
|
Restructuring |
|
11,449 |
|
|
|
1,354 |
|
|
|
|
Interest paid on convertible senior notes |
|
— |
|
|
|
1,754 |
|
|
|
|
Other |
|
(689 |
) |
|
|
— |
|
|
|
|
Income taxes, net of refunds |
|
10,842 |
|
|
|
(702 |
) |
|
|
|
|
$ |
30,790 |
|
|
$ |
12,426 |
|
|
|
|
(1) |
Our non-GAAP free cash flow is defined as cash provided by operating activities less investment in property and equipment. Investment in property and equipment fluctuates in amount and frequency and is significantly affected by the timing and size of investments in our facilities and equipment. We provide information on free cash flow to enable investors to assess our ability to generate cash without incurring additional external financings. This information is not a substitute for financial measures prepared under U.S. GAAP. |
|
(2) |
The supplemental information below identifies certain items included in operating cash flow that may affect comparability between periods. |
|
|
PEGASYSTEMS INC. |
||||||||||||||
ANNUAL CONTRACT VALUE |
||||||||||||||
(in thousands, except percentages) |
||||||||||||||
Annual contract value (“ACV”) - ACV represents the annualized value of our active contracts as of the measurement date. The contract's total value is divided by its duration in years to calculate ACV. ACV is a performance measure that we believe provides useful information to our management and investors. |
||||||||||||||
|
June 30, 2026 |
|
June 30, 2025 |
|
Change |
|
Constant Currency Change |
|||||||
Pega Cloud |
$ |
926,290 |
|
$ |
761,051 |
|
$ |
165,239 |
|
22 |
% |
|
22 |
% |
Maintenance |
|
271,328 |
|
|
301,375 |
|
|
(30,047 |
) |
(10 |
)% |
|
(9 |
)% |
Subscription services |
|
1,197,618 |
|
|
1,062,426 |
|
|
135,192 |
|
13 |
% |
|
13 |
% |
Subscription license |
|
422,316 |
|
|
451,591 |
|
|
(29,275 |
) |
(6 |
)% |
|
(6 |
)% |
|
$ |
1,619,934 |
|
$ |
1,514,017 |
|
$ |
105,917 |
|
7 |
% |
|
8 |
% |
PEGASYSTEMS INC. |
|||||||||||||||||||||
BACKLOG |
|||||||||||||||||||||
(in thousands, except percentages) |
|||||||||||||||||||||
Remaining performance obligations (“Backlog”) - Expected future revenue from existing non-cancellable contracts: |
|||||||||||||||||||||
As of June 30, 2026: |
|||||||||||||||||||||
|
Subscription services |
|
Subscription license |
|
Consulting |
|
Total |
||||||||||||||
Pega Cloud |
|
Maintenance |
|
|
|
||||||||||||||||
1 year or less |
$ |
704,447 |
|
|
$ |
198,492 |
|
|
$ |
42,537 |
|
|
$ |
47,220 |
|
|
$ |
992,696 |
|
49 |
% |
1-2 years |
|
393,855 |
|
|
|
82,004 |
|
|
|
1,546 |
|
|
|
3,747 |
|
|
|
481,152 |
|
24 |
% |
2-3 years |
|
222,052 |
|
|
|
50,070 |
|
|
|
7,583 |
|
|
|
899 |
|
|
|
280,604 |
|
14 |
% |
Greater than 3 years |
|
241,679 |
|
|
|
20,480 |
|
|
|
958 |
|
|
|
1,062 |
|
|
|
264,179 |
|
13 |
% |
|
$ |
1,562,033 |
|
|
$ |
351,046 |
|
|
$ |
52,624 |
|
|
$ |
52,928 |
|
|
$ |
2,018,631 |
|
100 |
% |
% of Total |
|
77 |
% |
|
|
17 |
% |
|
|
3 |
% |
|
|
3 |
% |
|
|
100 |
% |
|
|
Change since June 30, 2025 |
|
|
|
|
|
|
|
|
|
||||||||||||
|
$ |
240,835 |
|
|
$ |
(45,683 |
) |
|
$ |
(21,826 |
) |
|
$ |
9,976 |
|
|
$ |
183,302 |
|
|
|
|
|
18 |
% |
|
|
(12 |
)% |
|
|
(29 |
)% |
|
|
23 |
% |
|
|
10 |
% |
|
|
As of June 30, 2025:
|
Subscription services |
|
Subscription license |
|
Consulting |
|
Total |
||||||||||||||
Pega Cloud |
|
Maintenance |
|
|
|
||||||||||||||||
1 year or less |
$ |
603,683 |
|
|
$ |
220,954 |
|
|
$ |
62,222 |
|
|
$ |
39,798 |
|
|
$ |
926,657 |
|
51 |
% |
1-2 years |
|
334,586 |
|
|
|
79,345 |
|
|
|
4,262 |
|
|
|
2,846 |
|
|
|
421,039 |
|
23 |
% |
2-3 years |
|
172,513 |
|
|
|
49,587 |
|
|
|
746 |
|
|
|
252 |
|
|
|
223,098 |
|
12 |
% |
Greater than 3 years |
|
210,416 |
|
|
|
46,843 |
|
|
|
7,220 |
|
|
|
56 |
|
|
|
264,535 |
|
14 |
% |
|
$ |
1,321,198 |
|
|
$ |
396,729 |
|
|
$ |
74,450 |
|
|
$ |
42,952 |
|
|
$ |
1,835,329 |
|
100 |
% |
% of Total |
|
72 |
% |
|
|
22 |
% |
|
|
4 |
% |
|
|
2 |
% |
|
|
100 |
% |
|
|
PEGASYSTEMS INC. |
||||||||
RECONCILIATION OF GAAP BACKLOG AND CONSTANT CURRENCY BACKLOG |
||||||||
(in millions, except percentages) |
||||||||
|
June 30, 2025 |
|
June 30, 2026 |
|
1 Year Growth Rate |
|||
Backlog - GAAP |
$ |
1,835 |
|
$ |
2,019 |
|
10 |
% |
Impact of changes in foreign exchange rates |
|
— |
|
|
20 |
|
|
|
Constant currency backlog |
$ |
1,835 |
|
$ |
2,039 |
|
11 |
% |
Note: Constant currency backlog is calculated by applying the June 30, 2025 foreign exchange rates to current period shown. |
||||||||
View source version on businesswire.com: https://www.businesswire.com/news/home/20260721204149/en/
Press contact:
Ilena Ryan
Director of PR
[email protected]
617-866-6722
Investor contact:
Peter Welburn
VP, Corporate Development & Investor Relations
[email protected]
617-498-8968
Source: Pegasystems Inc.