
Fisker Inc. Announces First Quarter 2023 Financial Results
- Company delivers first Fisker Ocean Ones in Copenhagen, Denmark and Munich, Germany, establishing delivery process to early customers.
- Fisker inaugurated its first two customer locations in April at the Vienna and Copenhagen Centers+, which were followed by the opening of two Fisker showrooms in Munich, one at Motorworld plus our flagship Lounge; the Los Angeles flagship Lounge is expected to open later this month. Additional locations to be opened across Europe and US throughout 2023.
- US EPA testing completed for the Fisker Ocean Extreme; Fisker expects to receive EPA and CARB approvals later this month and then start US deliveries in June.
- Q1 2023 operational results consistent with company expectations. Ended quarter with a solid cash and cash equivalents balance of $652.5 million. This excludes $22 million of pending VAT receivables.
- Fisker Ocean awareness and recognition continues to expand; Fisker recently won the prestigious German Red Dot award for product design. Fisker Ocean and PEAR reservations and orders total over 70,000 as of May 8, 2023.
- Four-stage production plan shifts to right based on current homologation and supply chain timelines. Fisker plans to produce 1,400-1,700 vehicles in Q2, provided all partners deliver. Fisker expects to have a steep ramp up in Q3, followed by a monthly run rate of approximately 6,000 vehicles for the rest of the year, and forecasts 32,000-36,000 units produced in calendar 2023.
LOS ANGELES--(BUSINESS WIRE)-- Fisker Inc. (NYSE: FSR) (“Fisker”), driven by a mission to create the world’s most emotional and sustainable electric vehicles, today announced its financial results for the first quarter ended March 31, 2023.
This press release features multimedia. View the full release here: https://www.businesswire.com/news/home/20230509005561/en/
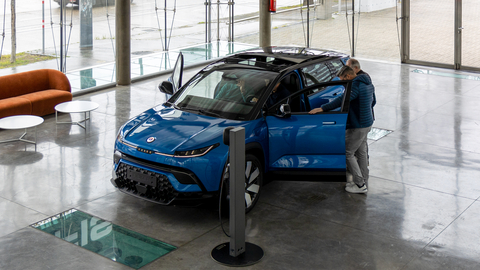
Company delivers first Fisker Ocean Ones in Copenhagen, Denmark and Munich, Germany, establishing delivery process to early customers. (Photo: Business Wire)
“It has been a fantastic weekend to have kicked off customer deliveries and opened our flagship Lounge in Munich yesterday. Now we are entering into a new era, becoming a revenue generating car company!” stated Henrik Fisker, Chairman and Chief Executive Officer of Fisker.
Recent Updates:
- First customer vehicle delivered in Copenhagen, Denmark on May 5, 2023 capitalizing on its dual-homologation strategy in Europe and the US where the class-leading Fisker Ocean has a large global total addressable market. Fisker completed the US National Highway Traffic Safety Administration (NHTSA) FMVSS self-certification and EPA completed its confirmatory testing; Fisker expects to receive the remaining approvals from the EPA (COC) and the California Air Resources Board (CARB EO) later this month. US deliveries to commence after US EPA certification.
- The Fisker Ocean Extreme achieved a combined WLTP range of up to 707 km/440 UK miles with 20-inch wheels/tires equipped, exceeding previous estimates and indicating that the Fisker Ocean Extreme, including the limited edition Fisker Ocean One, has the longest range of any battery electric SUV sold in Europe today.
- Four-stage supplier ramp up and vehicle assembly plan shifts to right on current homologation and supplier readiness timelines. 2023-to-date, Fisker has manufactured 55 engineering, marketing, and customer vehicles to start the registration and delivery process in Germany and Denmark. Production will ramp up next week and European deliveries are expected to pick up shortly after. Activated fleet of testing and validation vehicles in many regions of the world, focused on validating customer functions and features to continuously improve the customer experience; vehicles are fully connected and may receive software updates. A significant focus has been preparing for high quality vehicle assembly, with inline commissioning and automated end of line testing, so Fisker can achieve a maximum monthly run rate of 6,000 vehicles towards the end of Q3 into Fisker’s stage 4 plan. Fisker adjusts its annual production forecast to 32,000-36,000 units and expects to produce 1,400-1,700 customer vehicles in Q2, provided all partners deliver. This adjustment reflects updated homologation timing, supply chain maturity and ramp readiness progress.
- Deftpower named as European public charging platform provider, which complements Fisker’s Allego partnership in Europe, and when combined with Chargepoint’s network in North America, provides Fisker Ocean customers with access to over 600,000 charging points.
- Fisker partnered with Ample to deliver battery swappable Fisker Ocean vehicles for fleet customers by Q1 2024. Ample’s battery-swapping system will bring a new level of affordability to the Fisker Ocean and will help further Fisker’s long-term strategy to increase scale and adoption of its EVs in the US and Europe.
- Fisker Ocean reservations and orders approximated 65,000 as of May 8, 2023. During the first quarter, Fisker was disciplined with its marketing spend amidst the ongoing macro turbulence. PEAR reservations exceeded 6,000 as of May 8, 2023.
- Fisker Ocean world tour continued, including events in France (Autonomy Mobility World Expo), Norway (Nordic EV Summit), the United Kingdom (Fully Charged Live UK), and the United States (Qualtrics X4 Summit).
- Delivered a new version of our Web application and iOS App, including an updated interactive configurator. The new Fisker Web and Apps offer a more intuitive experience exploring and buying a Fisker EV. These products are available in multiple languages and will be continually updated.
- The Fisker Ocean won the internationally recognized Red Dot award for outstanding product design. The Fisker Ocean was evaluated on four key design qualities: product function, aesthetics, ease of use, and responsibility / sustainability – and was awarded Best Electric Vehicle 2023.
- Fisker continues to bolster its internal technical capabilities and our global team totals more than 900 as of May 8, 2023.
- Fisker will be adding an optional “hard core” off-road package called Force E, which can be applied to AWD Oceans after purchase. This will move the Ocean into a new market segment, with few direct EV competitors at its price point. The Force E is expected to be available in Q4 this year. Images will be released later today.
- PEAR development continues. Fisker has now reduced the parts count by 25% through a new process we call “steel ++”. As we are finalizing our battery partners, launch of PEAR production will shift into 2025.
- Fisker is planning its inaugural Investor Product Day event this summer, where it will showcase several new models that will be part of Fisker’s goal to produce 1 million vehicles in 2027.
First Quarter 2023 Financial Highlights:
- Cash and cash equivalents of $652.5 million as of March 31, 2023; this excludes $22 million of pending VAT receivables. Approximately $47 million raised from Fisker’s $350 million at-the-market (ATM) equity program during the first quarter of 2023.
- Loss from operations totaled $121.6 million, which includes higher Q1 R&D expenses milestones that are not expected to repeat.
- Net loss totaled $120.6 million and $0.38 loss per share.
- Net cash used in operating activities totaled $83.7 million and capital expenditures totaled $45.7 million.
- Weighted average shares outstanding totaled 321.0 million for the three months ended March 31, 2023.
2023 Business Outlook
Four-stage supplier ramp up and vehicle assembly plan moves to right on updated homologation timing. Fisker expects to produce 1,400-1,700 vehicles in Q2, provided Fisker’s suppliers and partners can support this volume and ramp; Fisker also revises calendar 2023 production volume guidance to 32,000-36,000 vehicles. The following information reflects Fisker’s expectations for key non-GAAP operating expenses and capital expenditures for full-year 2023. Fisker is projecting the total of these items to be within a range of $535 million to $610 million, consistent with its prior expectations last provided in the Q4 and Full Year 2022 Earnings Release. Fisker anticipates an 8-12% gross margin range for full year 2023 and potentially positive adjusted EBITDA1, provided input costs do not change dramatically.
| Key Expense Item | USD, millions |
||
| Research & Development (Non-GAAP)1 | $ |
160 - 190 |
|
| Selling, General, and Administrative (Non-GAAP)1 | $ |
130 - 160 |
|
| Capital Expenditures | $ |
245 - 260 |
|
| Total | $ |
535 - 610 |
|
1Excludes stock-based compensation expense. A reconciliation to the corresponding GAAP amount is not provided as the quantification of stock-based compensation excluded from the non-GAAP measure, which may be significant, cannot be reasonably calculated or predicted without unreasonable efforts. The Non-GAAP adjustment for stock-based compensation expense requires additional inputs such as number of shares granted and market price volatilities that are not currently ascertainable and cannot be reasonably estimated.
Conference Call Information
Fisker Inc. will host a conference call to discuss the results at 5:00 a.m. Pacific Time (8:00 a.m. Eastern Time) today, May 9, 2023. The live audio webcast will be accessible on Fisker’s Investor Relations website at https://investors.fiskerinc.com. A recording of the webcast will also be available following the conference call.
Use of Non-GAAP Financial Measures (Unaudited)
This press release and the accompanying tables references certain non-generally accepted accounting principles in the United States (GAAP) financial measures, including non-GAAP adjusted loss from operations, non-GAAP selling, general, and administrative expense, non-GAAP research and development expense and non-GAAP total operating expenses. These non-GAAP financial measures differ from their directly comparable GAAP financial measures due to adjustments made to exclude stock-based compensation expense. None of these non-GAAP financial measures is a substitute for or superior to measures of financial performance prepared in accordance with GAAP and should not be considered as an alternative to any other performance measures derived in accordance with GAAP.
Fisker believes that presenting these non-GAAP financial measures provides useful supplemental information to investors about Fisker in understanding and evaluating its operating results, enhancing the overall understanding of its past performance and future prospects, and allowing for greater transparency with respect to key financial metrics used by its management in financial and operational-decision making. However, there are a number of limitations related to the use of non-GAAP measures and their nearest GAAP equivalents. For example, other companies may calculate non-GAAP measures differently, or may use other measures to calculate their financial performance, and therefore any non-GAAP measures Fisker uses may not be directly comparable to similarly titled measures of other companies. Therefore, both GAAP financial measures of Fisker’s financial performance and the respective non-GAAP measures should be considered together. Please see the reconciliation of non-GAAP financial measures to the most directly comparable GAAP measure in the tables below.
Disclosure Information
Fisker uses the investor relations section on its website as a means of complying with its disclosure obligations under Regulation FD. It also uses various social media channels as a means of disclosing information about Fisker and its products to its customers, investors and the public (e.g., @fiskerinc on Twitter, Facebook, Instagram, YouTube, TikTok and LinkedIn). Accordingly, investors should monitor Fisker’s investor relations website and these social media channels in addition to following Fisker’s press releases, SEC filings, and public conference calls and webcasts.
About Fisker Inc.
California-based Fisker Inc. is revolutionizing the automotive industry by developing the most emotionally desirable and eco-friendly electric vehicles on Earth. Passionately driven by a vision of a clean future for all, the company is on a mission to become the No. 1 e-mobility service provider with the world’s most sustainable vehicles. To learn more, visit www.FiskerInc.com – and enjoy exclusive content across Fisker’s social media channels: Facebook, Instagram, Twitter, YouTube, and LinkedIn.
Download the revolutionary new Fisker mobile app from the App Store or Google Play store.
Forward-Looking Statements
This press release includes forward-looking statements, which are subject to the “safe harbor” provisions of the U.S. Private Securities Litigation Reform Act of 1995. These statements may be identified by words such as “feel,” “believes,” expects,” “estimates,” “projects,” “intends,” “should,” “is to be,” or the negative of such terms, or other comparable terminology and include, among other things, the statements quoted by our Chief Executive Officer, the timing of start of production and delivery of the Fisker Ocean or the Fisker PEAR, the sufficiency of our cash to fund production launch of the Fisker Ocean, and statements regarding Fisker’s future performance under “2023 Business Outlook,” the reported financial results for the first quarter of 2023, which are subject to completion of Fisker’s internal review, and other future events that involve risks and uncertainties. Such forward-looking statements are not guarantees of future performance and are subject to risks and uncertainties, which could cause actual results to differ materially from the forward-looking statements contained herein due to many factors, including, but not limited to: Fisker’s limited operating history; Fisker’s ability to enter into additional manufacturing and other contracts with Magna, or other OEMs or tier-one suppliers in order to execute on its business plan; the risk that OEM and supply partners do not meet agreed upon timelines or experience capacity constraints; Fisker may experience significant delays in the design, manufacture, regulatory approval, launch and financing of its vehicles; Fisker’s ability to execute its business model, including market acceptance of its planned products and services; Fisker’s inability to retain key personnel and to hire additional personnel; competition in the electric vehicle market; Fisker’s inability to develop a sales distribution network; and the ability to protect its intellectual property rights; and those factors discussed in Fisker’s Annual Report on Form 10-K, under the heading “Risk Factors,” filed with the Securities and Exchange Commission (the “SEC”), as supplemented by Quarterly Reports on Form 10-Q, and other reports and documents Fisker files from time to time with the SEC. Any forward-looking statements speak only as of the date on which they are made, and Fisker undertakes no obligation to update any forward-looking statement to reflect events or circumstances after the date of this press release.
First Quarter 2023 Financial Results |
||||||||||||
Fisker Inc. and Subsidiaries Unaudited Condensed Consolidated Statements of Operations (amounts in thousands, except share and per share data) |
||||||||||||
| Three Months Ended | ||||||||||||
| March 31, 2023 | December 31, 2022 | March 31, 2022 | ||||||||||
| Revenue | $ |
198 |
|
$ |
306 |
|
$ |
12 |
|
|||
| Costs of goods sold |
|
164 |
|
|
238 |
|
|
11 |
|
|||
| Gross margin |
|
34 |
|
|
68 |
|
|
1 |
|
|||
| Operating costs and expenses: | ||||||||||||
| Selling, general and administrative (1) |
|
44,648 |
|
|
44,802 |
|
|
21,992 |
|
|||
| Research and development (2) |
|
76,999 |
|
|
133,400 |
|
|
101,460 |
|
|||
| Total operating costs and expenses |
|
121,647 |
|
|
178,202 |
|
|
123,452 |
|
|||
| Loss from operations |
|
(121,613 |
) |
|
(178,134 |
) |
|
(123,451 |
) |
|||
| Other income (expense): | ||||||||||||
| Other income (expense) |
|
(45 |
) |
|
433 |
|
|
(371 |
) |
|||
| Interest income |
|
6,894 |
|
|
5,685 |
|
|
265 |
|
|||
| Interest expense |
|
(4,601 |
) |
|
(4,599 |
) |
|
(4,383 |
) |
|||
| Unrealized gain/(loss) recognized on equity securities |
|
(730 |
) |
|
(1,220 |
) |
|
5,120 |
|
|||
| Foreign currency gain/(loss) |
|
(401 |
) |
|
7,916 |
|
|
746 |
|
|||
| Total other income (expense) |
|
1,117 |
|
|
8,215 |
|
|
1,377 |
|
|||
| Net loss before income taxes |
|
(120,496 |
) |
|
(169,919 |
) |
|
(122,074 |
) |
|||
| Provision for income taxes |
|
(59 |
) |
|
(185 |
) |
|
- |
|
|||
| Net loss | $ |
(120,555 |
) |
$ |
(170,104 |
) |
$ |
(122,074 |
) |
|||
| Basic and Diluted net loss per share | $ |
(0.38 |
) |
$ |
(0.54 |
) |
$ |
(0.41 |
) |
|||
| Basic and Diluted weighted average common shares outstanding |
|
320,983,589 |
|
|
314,891,794 |
|
|
296,508,619 |
|
|||
| (1) Selling, general and administrative reconciliation | ||||||||||||
| GAAP selling, general and administrative | $ |
44,648 |
|
$ |
44,802 |
|
$ |
21,992 |
|
|||
| Stock-based compensation benefit/(expense) |
|
657 |
|
|
(762 |
) |
|
(1,773 |
) |
|||
| Non-GAAP selling, general and administrative | $ |
45,305 |
|
$ |
44,040 |
|
$ |
20,219 |
|
|||
| (2) Research and development reconciliation | ||||||||||||
| GAAP research and development | $ |
76,999 |
|
$ |
133,400 |
|
$ |
101,460 |
|
|||
| Stock-based compensation benefit/(expense) |
|
985 |
|
|
(1,414 |
) |
|
(3,292 |
) |
|||
| Non-GAAP research and development | $ |
77,984 |
|
$ |
131,986 |
|
$ |
98,168 |
|
|||
Fisker Inc. and Subsidiaries Unaudited Condensed Consolidated Balance Sheets (amounts in thousands, except share and per share data) |
||||||
| As of: | ||||||
| March 31, 2023 | December 31, 2022 | |||||
| Current assets: | ||||||
| Cash and cash equivalents | $ |
652,534 |
$ |
736,549 |
||
| Restricted cash |
|
4,624 |
|
- |
||
| Prepaid expenses and other current assets |
|
126,305 |
|
91,765 |
||
| Equity investment |
|
2,410 |
|
3,140 |
||
| Total current assets |
|
785,873 |
|
831,454 |
||
| Non-current assets: | ||||||
| Property and equipment, net |
|
420,607 |
|
387,137 |
||
| Intangible assets |
|
241,322 |
|
246,922 |
||
| Right of use asset, net |
|
38,680 |
|
33,424 |
||
| Other non-current assets |
|
18,064 |
|
16,489 |
||
| Total noncurrent assets |
|
718,673 |
|
683,972 |
||
| Total assets | $ |
1,504,546 |
$ |
1,515,426 |
||
| Current liabilities: | ||||||
| Accounts payable | $ |
68,317 |
$ |
58,871 |
||
| Accrued expenses |
|
310,710 |
|
264,925 |
||
| Lease liabilities (short term) |
|
7,323 |
|
7,085 |
||
| Total current liabilities |
|
386,350 |
|
330,881 |
||
| Non-current liabilities: | ||||||
| Customer deposits |
|
15,669 |
|
15,334 |
||
| Lease liabilities |
|
33,587 |
|
27,884 |
||
| Convertible notes |
|
661,250 |
|
660,822 |
||
| Total non-current liabilities |
|
710,506 |
|
704,040 |
||
| Total liabilities |
|
1,096,856 |
|
1,034,921 |
||
| Stockholder's equity |
|
407,690 |
|
480,505 |
||
| Total liabilities and equity | $ |
1,504,546 |
$ |
1,515,426 |
||
Fisker Inc. and Subsidiaries Unaudited Condensed Consolidated Statements of Cash Flows (amounts in thousands, except share and per share data) |
||||||||
| Three Months Ended March 31, | ||||||||
2023 |
2022 |
|||||||
| Cash flows from Operating Activities | ||||||||
| Net loss | $ |
(120,555 |
) |
$ |
(122,074 |
) |
||
| Stock-based compensation |
|
(1,642 |
) |
|
5,065 |
|
||
| Depreciation and Amortization |
|
9,150 |
|
|
379 |
|
||
| Accretion of debt issuance costs |
|
428 |
|
|
204 |
|
||
| Unrealized (gain)/loss recognized on equity securities |
|
730 |
|
|
(5,120 |
) |
||
| Change in operating assets and liabilities |
|
25,208 |
|
|
15,402 |
|
||
| Other operating activities |
|
2,939 |
|
|
156 |
|
||
| Net cash used in operating activities |
|
(83,742 |
) |
|
(105,988 |
) |
||
| Cash flows from Investing Activities | ||||||||
| Purchase of equity securities |
|
- |
|
|
(10,000 |
) |
||
| Purchase of property and equipment |
|
(45,748 |
) |
|
(45,750 |
) |
||
| Net cash used in investing activities |
|
(45,748 |
) |
|
(55,750 |
) |
||
| Cash flows from Financing Activities | ||||||||
| Proceeds from exercise of stock options |
|
2,788 |
|
|
1,861 |
|
||
| Proceeds from stock issuance under "At-the-market" offering |
|
47,986 |
|
|
- |
|
||
| Payments for "At-the-market" issuance costs |
|
(675 |
) |
|
- |
|
||
| Net cash provided by financing activities |
|
50,099 |
|
|
1,861 |
|
||
| Net increase / (decrease) in cash and cash equivalents |
|
(79,391 |
) |
|
(159,877 |
) |
||
| Cash and cash equivalents, beginning of period |
|
736,549 |
|
|
1,202,439 |
|
||
| Cash, cash equivalents and restricted cash, end of period | $ |
657,158 |
|
$ |
1,042,562 |
|
||
Source: Fisker Inc.
View source version on businesswire.com: https://www.businesswire.com/news/home/20230509005561/en/
Fisker Inc. Communications
Frank Boroch, VP, Investor Relations & Treasury
[email protected]
Matthew DeBord, Sr. Director, Communications Strategy & Storytelling
[email protected]
Source: Fisker Inc.