
Form 8-K Ally Financial Inc. For: Jul 19
Exhibit 99.1

News release: IMMEDIATE RELEASE
Ally Financial Reports Second Quarter 2022 Financial Results
|
$1.40 GAAP EPS
|
14.7% RETURN ON COMMON EQUITY
|
$634 million PRE-TAX INCOME
|
$2.08 billion GAAP TOTAL NET REVENUE
| |||
|
$1.76 ADJUSTED EPS1
|
23.2% CORE ROTCE1
|
$780 million CORE PRE-TAX INCOME1
|
$2.22 billion ADJUSTED TOTAL NET REVENUE 1
|

|
• Established leader in dealer financial services offering comprehensive suite of auto finance and insurance products | |||
| – Consumer auto originations of $13.3 billion, from 3.3 million decisioned applications | Highest quarterly originations since 2006 | ||||
| – 7.8% Estimated Retail Auto Originated Yield1 | 54 bps of retail net charge-offs, reflecting strength in credit and used values | ||||
| – Insurance written premiums of $262 million | $5.8 billion investment management portfolio | ||||
| • Leading, digital-first Ally Bank platform generating strong growth across consumer and commercial product suite | ||||
| – Retail balances of $131.2 billion, down 4% quarter over quarter (QoQ) driven by elevated tax outflows; up 1% YoY | ||||
| – Retail deposit customers of 2.5 million, up 6% year over year (YoY), grew for the 53rd consecutive quarter | ||||
| – Ally Home® direct-to-consumer mortgage originations of $0.9 billion | Lower originations reflecting higher interest rate environment | ||||
| – Ally Invest net customer assets of $13.5 billion, down 18% YoY due to market trends | 518K active accounts, up 5% YoY | ||||
| – Ally Lending gross originations of $591 million, up 98% YoY | 382K active borrowers, up 78% YoY and 3.2K merchants, up 26% YoY | ||||
| – Ally Credit Card balances of $1.2 billion, up 93% YoY2 | 908K active cardholders, up 58% YoY2 | ||||
| – Corporate Finance held-for-investment portfolio of $8.5 billion, up 38% YoY | Deep expertise, disciplined risk management | ||||
| • Preliminary Stress Capital Buffer of 250 basis points based on CCAR 2022 results | Declined 100 bps versus CCAR 2020 | ||||
| • Announced 3Q 2022 common dividend of $0.30 per share | Completed $600 million of share repurchases in the second quarter | ||||
|
|
“Despite macro headwinds and market uncertainty, Ally delivered strong operational results again this quarter, including net financing revenues growing for the eighth consecutive quarter and net interest margin exceeding four percent for the first time in company history. Our teams remain focused on controlling what we can control – primarily taking care of our customers across all our businesses. Our scale and ability to adapt to changing conditions allowed Ally to generate the strongest quarter of retail auto originations in sixteen years while increasing expected risk-adjusted yields. Newer businesses like Ally Credit Card are steadily growing and helping offset more cyclical businesses, like Ally Home,” said Ally Chief Executive Officer Jeffrey Brown.
| |||
| “We continue to closely monitor changes in the environment and remain nimble. The investments we’ve made in our underwriting and servicing operations, including adding teammates and enhancing technology, continues to give us confidence in our performance, despite the potential for recessionary conditions. Broadly speaking, we have fine-tuned our expense focus even further to ensure we remain well positioned. Recent CCAR results reaffirm our strong capital position and resilient balance sheet. We will continue to leverage our proven ability to lead, adapt and innovate, to ensure we deliver on our long-term strategic priorities and the thoughtful evolution of our company irrespective of the environment we face.” | ||||

|
Second Quarter 2022 Financial Results |
||||||||||||||
| Increase / (Decrease) vs. | ||||||||||||||||||||
| ($ millions except per share data) |
2Q 22 | 1Q 22 | 2Q 21 | 1Q 22 |
2Q 21 | |||||||||||||||
| GAAP Net Income Attributable to Common Shareholders |
$ | 454 | $ | 627 | $ | 900 | (28 | )% | (50 | )% | ||||||||||
| Core Net Income Attributable to Common Shareholders1 |
$ | 570 | $ | 687 | $ | 868 | (17 | )% | (34 | )% | ||||||||||
| GAAP Earning per Common Share |
$ | 1.40 | $ | 1.86 | $ | 2.41 | (25 | )% | (42 | )% | ||||||||||
| Adjusted EPS1 |
$ | 1.76 | $ | 2.03 | $ | 2.33 | (14 | )% | (24 | )% | ||||||||||
| Return on GAAP Shareholder’s Equity |
14.7 | % | 18.0 | % | 24.1 | % | (19 | )% | (39 | )% | ||||||||||
| Core ROTCE1 |
23.2 | % | 23.6 | % | 26.7 | % | (2 | )% | (13 | )% | ||||||||||
| GAAP Common Shareholder’s Equity per Share |
$ | 37.28 | $ | 39.99 | $ | 41.93 | (7 | )% | (11 | )% | ||||||||||
| Adjusted Tangible Book Value per Share1 |
$ | 32.16 | $ | 35.04 | $ | 38.83 | (8 | )% | (17 | )% | ||||||||||
| GAAP Total Net Revenue |
$ | 2,076 | $ | 2,135 | $ | 2,085 | (3 | )% | — | % | ||||||||||
| Adjusted Total Net Revenue1 |
$ | 2,222 | $ | 2,210 | $ | 2,145 | 1 | % | 4 | % | ||||||||||
|
Pre-Provision Net Revenue1 |
$ | 938 | $ | 1,013 | $ | 1,010 | (7 | )% | (7 | )% | ||||||||||
| Core Pre-Provision Net Revenue1 |
$ | 1,084 | $ | 1,088 | $ | 1,070 | — | % | 1 | % | ||||||||||
1 The following are non-GAAP financial measures which Ally believes are important to the reader of the Consolidated Financial Statements, but which are supplemental to and not a substitute for GAAP measures: Adjusted Earnings per Share (Adjusted EPS), Adjusted Total Net Revenue, Core Pre-Tax Income, Core Net Income Attributable to Common Shareholders, Pre-Provision Net Revenue (PPNR), Core Pre-Provision Net Revenue (Core PPNR), Core OID, Core Return on Tangible Common Equity (Core ROTCE), Estimated Retail Auto Originated Yield, Tangible Common Equity, Net Financing Revenue (excluding Core OID) and Adjusted Tangible Book Value per Share (Adjusted TBVPS). These measures are used by management and we believe are useful to investors in assessing the company’s operating performance and capital. Refer to the Definitions of Non-GAAP Financial Measures and Other Key Terms, and Reconciliation to GAAP later in this release.
2 The YoY variances shown were calculated using information provided by Fair Square relating to periods prior to the closing of our acquisition of Fair Square on December 1, 2021.

| Discussion of First Quarter 2022 Results | ||||||
|
Net income attributable to common shareholders was $454 million in the quarter, compared to $900 million in the second quarter of 2021, as higher net financing revenue was more than offset by higher provision for credit losses, lower other revenue and higher noninterest expenses.
Net financing revenue was $1.76 billion, up $217 million year over year, driven by continued strength in auto pricing and origination volumes, lower funding costs and the deployment of excess cash.
Other revenue decreased $226 million year over year to $312 million, largely due to a $136 million decrease in the fair value of equity securities in the quarter compared to a $19 million increase in the prior-year quarter. Adjusted other revenueA, excluding the change in fair value of equity securities, decreased $140 million year over year to $448 million due to corporate investment gains in the prior period which did not repeat.
Net interest margin (“NIM”) of 4.04%, including Core OIDB of 2 bps, increased 49 bps year over year. Excluding Core OIDB , NIM was 4.06%, up 49 bps year over year, primarily due to lower excess cash, lower funding costs, and larger contributions from Ally Lending and Ally Card, partially offset by normalizing lease yields.
Provision for credit losses increased $336 million year over year to $304 million, reflecting CECL reserve build attributable to robust retail auto origination volume compared to reserve release activity in the prior year.
Noninterest expense increased $63 million year over year due to the addition of credit card operations and continued investments in business growth, talent and technology.
| ||||||
AAdjusted other revenue is a non-GAAP financial measure. Adjusted for (i) repositioning items related to loss on extinguishment of debt associated with the redemption of TRUPs and (ii) change in the fair value of equity securities due to the implementation of ASU 2016-01 which requires change in the fair value of equity securities to be recognized in current period net income as compared to periods prior to 1/1/2018 in which such adjustments were recognized through other comprehensive income, a component of equity.
BRepresents a non-GAAP financial measure. Refer to definitions of Non-GAAP Financial Measures and Other Key Terms later in this release.
|
Second Quarter 2022 Financial Results |
||||||||||||||||
| Increase/(Decrease) vs. | ||||||||||||||||||||
| ($ millions except per share data) | 2Q 22 | 1Q 22 | 2Q 21 | 1Q 22 | 2Q 21 | |||||||||||||||
| Net Financing Revenue (excluding Core OID)1 |
$ | 1,774 | $ | 1,703 | $ | 1,556 | $ | 71 | $ | 218 | ||||||||||
| Core OID |
(10 | ) | (10 | ) | (9 | ) | — | (1 | ) | |||||||||||
| (a) Net Financing Revenue |
1,764 | 1,693 | 1,547 | 71 | 217 | |||||||||||||||
| Adjusted Other Revenue2 |
448 | 508 | 588 | (59 | ) | (140 | ) | |||||||||||||
| Change in Fair Value of Equity Securities2 |
(136 | ) | (66 | ) | 19 | (71 | ) | (156 | ) | |||||||||||
| (b) Other Revenue |
312 | 442 | 538 | (130 | ) | (226 | ) | |||||||||||||
| (c) Provision for Credit Losses |
304 | 167 | (32 | ) | 137 | 336 | ||||||||||||||
| (d) Noninterest Expense |
1,138 | 1,122 | 1,075 | 16 | 63 | |||||||||||||||
| Pre-Tax Income (a+b-c-d) |
$ | 634 | $ | 846 | $ | 1,042 | $ | (212 | ) | $ | (408 | ) | ||||||||
| Income Tax Expense |
152 | 191 | 143 | (39 | ) | 9 | ||||||||||||||
| Net Income from Discontinued Operations |
— | — | 1 | — | (1 | ) | ||||||||||||||
| Net Income |
$ | 482 | $ | 655 | $ | 900 | $ | (173 | ) | $ | (418 | ) | ||||||||
| Preferred Dividends |
28 | 28 | — | — | 28 | |||||||||||||||
| Net Income Attributable to Common Shareholders |
$ | 454 | $ | 627 | $ | 900 | $ | (173 | ) | $ | (446 | ) | ||||||||
| GAAP EPS (diluted) |
$ | 1.40 | $ | 1.86 | $ | 2.41 | $ | (0.45 | ) | $ | (1.01 | ) | ||||||||
| Core OID, Net of Tax |
0.02 | 0.02 | 0.02 | — | 0.01 | |||||||||||||||
| Change in Fair Value of Equity Securities, Net of Tax |
0.33 | 0.15 | (0.04 | ) | 0.18 | 0.37 | ||||||||||||||
| Repositioning, Discontinued Ops, and Other, Net of Tax4 |
— | — | 0.14 | — | (0.14 | ) | ||||||||||||||
| Significant Discrete Tax Items5 |
— | — | (0.21 | ) | — | 0.21 | ||||||||||||||
| Adjusted EPS6 |
$ | 1.76 | $ | 2.03 | $ | 2.33 | $ | (0.27 | ) | $ | (0.57 | ) | ||||||||
| (1) | Represents a non-GAAP financial measure. Adjusted for Core OID. Refer to the Definitions of Non-GAAP Financial Measures and Other Key Terms and Reconciliation to GAAP later in this press release. |
| (2) | Represents a non-GAAP financial measure. Adjusted for change in the fair value of equity securities due to the implementation of ASU 2016-01, which requires change in the fair value of equity securities to be recognized in current period net income as compared to periods prior to 1/1/2018 in which such adjustments were recognized through other comprehensive income, a component of equity. |
| (3) | Represents a non-GAAP financial measure. Adjusted for Day 1 activity from the Fair Square Financial acquisition. |
| (4) | Repositioning, net of tax in 2Q 2021 includes a $70 million charge related to loss on extinguishment of debt associated with the redemption of TRUPs. |
| (5) | Significant discrete tax items reflect $78 million release of valuation allowance on foreign tax credit carryforwards during the second quarter of 2021. |
| (6) | Represents a non-GAAP financial measure. Refer to the Definitions of Non-GAAP Financial Measures and Other Key Terms and Reconciliation to GAAP later in this press release. |
2
|
Pre-Tax Income by Segment |
||||||||||||||||
| Increase/(Decrease) vs. | ||||||||||||||||||||
| ($ millions) |
2Q 22 | 1Q 22 | 2Q 21 | 1Q 22 |
2Q 21 | |||||||||||||||
| Automotive Finance |
$ | 600 | $ | 725 | $ | 917 | $ | (125 | ) | $ | (317 | ) | ||||||||
| Insurance |
(122 | ) | 13 | 87 | (135 | ) | (209 | ) | ||||||||||||
| Dealer Financial Services |
$ | 478 | $ | 738 | $ | 1,004 | $ | (260 | ) | $ | (526 | ) | ||||||||
| Corporate Finance |
60 | 64 | 95 | (4 | ) | (35 | ) | |||||||||||||
| Mortgage Finance |
6 | 11 | — | (5 | ) | 6 | ||||||||||||||
| Corporate and Other |
90 | 33 | (57 | ) | 57 | 147 | ||||||||||||||
| Pre-Tax Income from Continuing Operations |
$ | 634 | $ | 846 | $ | 1,042 | $ | (212 | ) | $ | (408 | ) | ||||||||
| Core OID1 |
10 | 10 | 9 | — | 1 | |||||||||||||||
| Change in Fair Value of Equity Securities2 |
136 | 66 | (19 | ) | 71 | 156 | ||||||||||||||
| Repositioning and Other3 |
— | — | 70 | — | (70 | ) | ||||||||||||||
| Core Pre-Tax Income4 |
$ | 780 | $ | 921 | $ | 1,102 | $ | (141 | ) | $ | (321 | ) | ||||||||
| (1) | Core OID for all periods shown is applied to the pre-tax income of the Corporate and Other segment. Refer to the Definitions of Non-GAAP Financial Measures and Other Key Terms and Reconciliation to GAAP later in this release. |
| (2) | Change in fair value of equity securities impacts the Insurance and Corporate Finance segments. Reflects equity fair value adjustments related to ASU 2016-01 which requires change in the fair value of equity securities to be recognized in current period net income as compared to periods prior to 1/1/2018 in which such adjustments were recognized through other comprehensive income, a component of equity. |
| (3) | Repositioning, net of tax in 2Q 2021 includes a $70 million charge related to loss on extinguishment of debt associated with the redemption of TRUPs |
| (4) | Core pre-tax income is a non-GAAP financial measure that adjusts pre-tax income from continuing operations for Core OID, equity fair value adjustments related to ASU 2016-01, and repositioning and other primarily related to the loss on extinguishment of debt associated with the redemption of TRUPs. Management believes core pre-tax income can help the reader better understand the operating performance of the core businesses and their ability to generate earnings. Refer to the Definitions of Non-GAAP Financial Measures and Other Key Terms later in this release. |
| Discussion of Segment Results | ||||||
|
Auto Finance
Pre-tax income of $600 million was down $317 million year over year, primarily due to higher provision expense to support origination volume and higher noninterest expense.
Net financing revenue of $1,301 million was $32 million lower year over year, driven by lower lease gains, partially offset by higher retail auto portfolio balances. Ally’s retail auto portfolio yield, excluding the impact of hedges, decreased 7 bps year over year to 6.85% due to elevated pre-payment activity, partially offset by higher originated yields.
Provision for credit losses was $228 million, increasing $251 million year over year, driven by reserve build to support strong retail originations and reserve release activity in the prior year period. The retail auto net charge-off rate was 0.54%, up 57 bps year over year.
Consumer auto originations increased to $13.3 billion from $12.9 billion in the prior-year period, which included $9.1 billion of used retail volume, or 69% of total originations, $3.3 billion of new retail volume, and $0.9 billion of leases. Estimated retail auto originated yieldC of 7.8% in the quarter was up 68 bps year over year.
End-of-period auto earning assets increased $7.1 billion year over year from $101.8 billion to $108.8 billion, due to an increase in both consumer and commercial auto earning assets. End-of-period consumer auto earning assets were up $6.2 billion year over year, driven by growth in retail loans. End-of-period commercial earning assets of $16.1 billion were $0.9 billion higher year over year.
Insurance
Pre-tax loss of $122 million compared to pre-tax income of $87 million in the prior year, primarily due to a $136 million decrease in the fair value of equity securitiesD in the quarter compared to a $20 million increase in the prior-year quarter. Core pre-tax incomeE decreased $53 million year over year to $14 million, due to lower equity investment gains and higher weather losses.
Written premiums were $262 million, down $39 million year over year, driven by lower vehicle sales and lower dealer inventory levels.
Total investment income, excluding a $136 million decrease in the fair value of equity securities during the quarterD, was $29 million, down $27 million year over year, as elevated realized gains in the prior year did not repeat.
| ||||||
CRepresents a non-GAAP financial measure. Refer to the Definitions of Non-GAAP Financial Measures and Other Key Terms and Reconciliation to GAAP later in this release.
DASU 2016-01 requires change in the fair value of equity securities to be recognized in current period net income as compared to periods prior to 1/1/2018 in which such adjustments were recognized through other comprehensive income, a component of equity.
ERepresents a non-GAAP financial measure. Excludes equity fair value adjustments related to ASU 2016-01 which requires change in the fair value of equity securities to be recognized in current period net income as compared to periods prior to 1/1/2018 in which such adjustments were recognized through other comprehensive income, a component of equity. Refer to the definitions of Non-GAAP Financial Measures and Other Key Terms and Reconciliation to GAAP later in this release.
3
| Discussion of Segment Results | ||||
|
Corporate Finance
Pre-tax income of $60 million in the quarter was $35 million lower year over year, as higher provision expense and a moderation of other revenue from elevated levels in the prior year period more than offset the impact of portfolio growth.
Net financing revenue was flat year over year at $77 million. Other revenue decreased $15 million year over year to $19 million due to elevated investment gains in the prior year.
Provision for credit losses was $8 million, increasing $21 million from the prior-year period due to higher reserves for specific exposures and a recovery recorded in the prior year period. Overall, the portfolio continues to reflect strong credit performance.
The held-for-investment loan portfolio increased 38% year over year from $6.2 billion to $8.5 billion.
Mortgage Finance
Pre-tax income of $6 million was up $6 million year over year, driven by higher net financing revenue offset by lower other revenue and higher noninterest expense.
Net financing revenue was up $33 million year over year to $56 million, reflecting growth in asset balances and normalizing prepayment activity. Other revenue decreased $18 million year over year to $4 million, primarily driven by lower gain on sale margins and elimination of origination fees. Noninterest expense increased $9 million as the business continues to scale.
Direct-to-consumer originations totaled $0.9 billion in the quarter, down 60% year over year given the contraction in the overall mortgage market.
Existing Ally Bank deposit customers accounted for 43% of the quarter’s direct-to-consumer origination volume.
| ||||
|
Capital, Liquidity & Deposits |
||||||||||
|
Capital
Ally paid a $0.30 per share quarterly common dividend, which was up 58% year over year. Additionally, Ally completed $600 million of share repurchases in the second quarter, including shares withheld to cover income taxes owed by participants related to share-based incentive plans. Ally’s board of directors approved a $0.30 per share common dividend for the third quarter of 2022.
Ally’s Common Equity Tier 1 (CET1) capital ratio decreased from 10.0% to 9.6% quarter over quarter while risk weighed assets (RWA) increased from $149.0 billion to $152.2 billion, primarily driven by retail auto growth. The decline in CET1 was the result of aforementioned RWA growth, as well as share repurchase and dividend activity that offset strong net income generation.
Liquidity & Funding
Consolidated cash and cash equivalentsF totaled $3.7 billion at quarter-end, up from $3.6 billion at the end of the first quarter. Total liquidityG was $28.3 billion at quarter-end.
Deposits represented 85% of Ally’s funding portfolio at quarter-end.
Deposits
Retail deposits increased to $131.2 billion at quarter-end, up $1.9 billion year over year and down $4.8 billion quarter over quarter. Total deposits increased $1.3 billion year over year to $140.4 billion and Ally maintained industry-leading customer retention at 96%.
The average retail portfolio deposit rate was 0.71% for the quarter, up 2 bps year over year and up 12 bps quarter over quarter.
Ally’s retail deposit customer base grew 6% year over year, totaling 2.5 million customers at quarter-end. Millennials and younger customers continue to comprise the largest generation segment of new customers, accounting for 69% of new customers in the quarter. Approximately 9% of deposit customers maintained an Ally Invest or Ally Home relationship at quarter-end.
| ||||||||||
FCash & cash equivalents may include the restricted cash accumulation for retained notes maturing within the following 30 days and returned to Ally on the distribution date.
GTotal liquidity includes cash & cash equivalents, highly liquid securities and current committed unused borrowing capacity. See page 18 of the Financial Supplement for more details.
4
|
Definitions of Non-GAAP Financial Measures and Other Key Terms |
||||||||||||||
Ally believes the non-GAAP financial measures defined here are important to the reader of the Consolidated Financial Statements, but these are supplemental to and not a substitute for GAAP measures. See Reconciliation to GAAP below for calculation methodology and details regarding each measure.
Adjusted Earnings per Share (Adjusted EPS) is a non-GAAP financial measure that adjusts GAAP EPS for revenue and expense items that are typically strategic in nature or that management otherwise does not view as reflecting the operating performance of the company. Management believes Adjusted EPS can help the reader better understand the operating performance of the core businesses and their ability to generate earnings. In the numerator of Adjusted EPS, GAAP net income attributable to common shareholders is adjusted for the following items: (1) excludes discontinued operations, net of tax, as Ally is primarily a domestic company and sales of international businesses and other discontinued operations in the past have significantly impacted GAAP EPS, (2) adds back the tax-effected non-cash Core OID, (3) adjusts for tax-effected repositioning and other which are primarily related to the extinguishment of high cost legacy debt, strategic activities and significant other one-time items, (4) excludes equity fair value adjustments (net of tax) related to ASU 2016-01 which requires change in the fair value of equity securities to be recognized in current period net income as compared to periods prior to 1/1/18 in which such adjustments were recognized through other comprehensive income, a component of equity, (5) excludes significant discrete tax items that do not relate to the operating performance of the core businesses and adjusts for preferred stock capital actions (e.g., Series A and Series G) that have been taken by the company to normalize its capital structure, as applicable for respective periods.
Adjusted Efficiency Ratio is a non-GAAP financial measure that management believes is helpful to readers in comparing the efficiency of its core banking and lending businesses with those of its peers. In the numerator of Adjusted Efficiency Ratio, total noninterest expense is adjusted for Rep and warrant expense, Insurance segment expense, and repositioning and other which are primarily related to the extinguishment of high cost legacy debt, strategic activities and significant other one-time items, as applicable for respective periods. In the denominator, total net revenue is adjusted for Core OID and Insurance segment revenue. See Reconciliation to GAAP on page 7 for calculation methodology and details.
Adjusted Tangible Book Value per Share (Adjusted TBVPS) is a non-GAAP financial measure that reflects the book value of equity attributable to shareholders even if Core OID balance were accelerated immediately through the financial statements. As a result, management believes Adjusted TBVPS provides the reader with an assessment of value that is more conservative than GAAP common shareholder’s equity per share. Adjusted TBVPS generally adjusts common equity for: (1) goodwill and identifiable intangibles, net of DTLs, (2) tax-effected Core OID balance to reduce tangible common equity in the event the corresponding discounted bonds are redeemed/tendered and (3) Series G discount which reduces tangible common equity as the company has normalized its capital structure, as applicable for respective periods.
Note: In December 2017, tax-effected Core OID balance was adjusted from a statutory U.S. Federal tax rate of 35% to 21% (“rate”) as a result of changes to U.S. tax law. The adjustment conservatively increased the tax-effected Core OID balance and consequently reduced Adjusted TBVPS as any acceleration of the non-cash charge in future periods would flow through the financial statements at a 21% rate versus a previously modeled 35% rate. See Reconciliation to GAAP on page 7 for calculation methodology and details.
Core Net Income Attributable to Common Shareholders is a non-GAAP financial measure that serves as the numerator in the calculations of Adjusted EPS and Core ROTCE and that, like those measures, is believed by management to help the reader better understand the operating performance of the core businesses and their ability to generate earnings. Core Net Income Attributable to Common Shareholders adjusts GAAP net income attributable to common shareholders for discontinued operations net of tax, tax-effected Core OID expense, tax-effected repositioning and other primarily related to the extinguishment of high-cost legacy debt and strategic activities and significant other, preferred stock capital actions, significant discrete tax items and tax-effected changes in equity investments measured at fair value, as applicable for respective periods. See Reconciliation to GAAP on page 6 for calculation methodology and details.
Core Original Issue Discount (Core OID) Amortization Expense is a non-GAAP financial measure for OID, and is believed by management to help the reader better understand the activity removed from: Core pre-tax income (loss), Core net income (loss) attributable to common shareholders, Adjusted EPS, Core ROTCE, Adjusted efficiency ratio, Adjusted total net revenue, and Net financing revenue (excluding Core OID). Core OID is primarily related to bond exchange OID which excludes international operations and future issuances. See page 7 for calculation methodology and details.
Core Outstanding Original Issue Discount Balance (Core OID balance) is a non-GAAP financial measure for outstanding OID and is believed by management to help the reader better understand the balance removed from Core ROTCE and Adjusted TBVPS. Core OID balance is primarily related to bond exchange OID which excludes international operations and future issuances. See page 7 for calculation methodology and details.
Core Pre-Tax Income is a non-GAAP financial measure that adjusts pre-tax income from continuing operations by excluding (1) Core OID, and (2) equity fair value adjustments related to ASU 2016-01 which requires change in the fair value of equity securities to be recognized in current period net income as compared to periods prior to 1/1/18 in which such adjustments were recognized through other comprehensive income, a component of equity, and (3) Repositioning and other which are primarily related to the extinguishment of high cost legacy debt, strategic activities and significant other one-time items, as applicable for respective periods. Management believes Core Pre-Tax Income can help the reader better understand the operating performance of the core businesses and their ability to generate earnings. See the Pre-Tax Income by Segment Table on page 3 for calculation methodology and details.
Core Pre-Provision Net Revenue (Core PPNR) is a non-GAAP financial measure calculated by adjusting Core pre-tax income to add back provision for credit losses. Management believes that Core PPNR is a helpful financial metric because it enables the reader to assess the core businesses ability to generate earnings to cover credit losses and as it is utilized by Federal Reserve’s approach to modeling within the Supervisory Stress Test Framework that generally follows U.S. generally accepted accounting principles (GAAP) and includes a calculation of PPNR as a component of projected pre-tax net income. See page 8 for calculation methodology and details.
Core Return on Tangible Common Equity (Core ROTCE) is a non-GAAP financial measure that management believes is helpful for readers to better understand the ongoing ability of the company to generate returns on its equity base that supports core operations. For purposes of this calculation, tangible common equity is adjusted for Core OID balance and net DTA. Ally’s Core net income attributable to common shareholders for purposes of calculating Core ROTCE is based on the actual effective tax rate for the period adjusted for significant discrete tax items including tax reserve releases, which aligns with the methodology used in calculating adjusted earnings per share.
(1) In the numerator of Core ROTCE, GAAP net income attributable to common shareholders is adjusted for discontinued operations net of tax, tax-effected Core OID, tax-effected repositioning and other which are primarily related to the extinguishment of high cost legacy debt, strategic activities and significant other one-time items, fair value adjustments (net of tax) related to ASU 2016-01 which requires change in the fair value of equity securities to be recognized in current period net income as compared to periods prior to 1/1/18 in which such adjustments were recognized through other comprehensive income, a component of equity, significant discrete tax items, and preferred stock capital actions, as applicable for respective periods.
(2) In the denominator, GAAP shareholder’s equity is adjusted for goodwill and identifiable intangibles net of DTL, Core OID balance, and net DTA.
Corporate and Other primarily consists of activity related to centralized corporate treasury activities such as management of the cash and corporate investment securities and loan portfolios, short- and long-term debt, retail and brokered deposit liabilities, derivative instruments, the amortization of the discount associated with new debt issuances and bond exchanges, and the residual impacts of our corporate FTP and treasury ALM activities. Corporate and Other also includes certain equity investments, the management of our legacy mortgage portfolio, and reclassifications and eliminations between the reportable operating segments. Subsequent to June 1, 2016, the revenue and expense activity associated with Ally Invest was included within the Corporate and Other segment. Subsequent to October 1, 2019, the revenue and expense activity associated with Ally Lending was included within the Corporate and Other segment. Subsequent to December 1, 2021, the revenue and expense activity associated with Fair Square was included within the Corporate and Other segment.
Estimated impact of CECL on regulatory capital per final rule issued by U.S. banking agencies - In December 2018, the FRB and other U.S. banking agencies approved a final rule to address the impact of CECL on regulatory capital by allowing BHCs and banks, including Ally, the option to phase in the day-one impact of CECL over a three-year period. In March 2020, the FRB and other U.S. banking agencies issued an interim final rule that became effective on March 31, 2020 and provided an alternative option for banks to temporarily delay the impacts of CECL, relative to the incurred loss methodology for estimating the allowance for loan losses, on regulatory capital. A final rule that was largely unchanged from the March 2020 interim final rule was issued by the FRB and other U.S. banking agencies in August 2020, and became effective in September 2020. For regulatory capital purposes, these rules permitted us to delay recognizing the estimated impact of CECL on regulatory capital until after a two-year deferral period, which for us extended through December 31, 2021. Beginning on January 1, 2022, we are required to phase in 25% of the previously deferred estimated capital impact of CECL, with an additional 25% to be phased in at the beginning of each subsequent year until fully phased in by the first quarter of 2025. Under these rules, firms that adopt CECL and elect the five-year transition will calculate the estimated impact of CECL on regulatory capital as the day-one impact of adoption plus 25% of the subsequent change in allowance during the two-year deferral period, which according to the final rule approximates the impact of CECL relative to an incurred loss model. We adopted this transition option during the first quarter of 2020, and beginning January 1, 2022, are phasing in the regulatory capital impacts of CECL based on this five-year transition period.
5
Estimated Retail Auto Originated Yield is a forward-looking non-GAAP financial measure determined by calculating the estimated average annualized yield for loans originated during the period. At this time there currently is no comparable GAAP financial measure for Estimated Retail Auto Originated Yield and therefore this forecasted estimate of yield at the time of origination cannot be quantitatively reconciled to comparable GAAP information.
Net Charge-Off Ratios are calculated as annualized net charge-offs divided by average outstanding finance receivables and loans excluding loans measured at fair value and loans held-for-sale.
Tangible Common Equity is a non-GAAP financial measure that is defined as common stockholders’ equity less goodwill and identifiable intangible assets, net of deferred tax liabilities. Ally considers various measures when evaluating capital adequacy, including tangible common equity. Ally believes that Tangible Common Equity is important because we believe readers may assess our capital adequacy using this measure. Additionally, presentation of this measure allows readers to compare certain aspects of our capital adequacy on the same basis to other companies in the industry. For purposes of calculating Core Return on Tangible Common Equity (Core ROTCE), Tangible Common Equity is further adjusted for Core OID balance and net deferred tax asset. See page 6 for calculation methodology & details.
| U.S. Consumer Auto Originations | ||
| New Retail – standard and subvented rate new vehicle loans | Used Retail – used vehicle loans | |
| Growth – total originations from non-GM/Stellantis dealers and direct-to-consumer loans | Lease – new vehicle lease originations |
|
Reconciliation to GAAP |
||||||||||||||
| Adjusted Earnings per Share |
||||||||||||||||
| Numerator ($ millions) | 2Q 22 | 1Q 22 | 2Q 21 | |||||||||||||
| GAAP Net Income Attributable to Common Shareholders |
$ | 454 | $ | 627 | $ | 900 | ||||||||||
| Discontinued Operations, Net of Tax |
— | — | (1 | ) | ||||||||||||
| Core OID |
10 | 10 | 9 | |||||||||||||
| Repositioning and Other |
— | — | 70 | |||||||||||||
| Change in the Fair Value of Equity Securities |
136 | 66 | (19 | ) | ||||||||||||
| Tax on: Core OID & Change in Fair Value of Equity Securities (21% starting 1Q18) |
(31 | ) | (16 | ) | (13 | ) | ||||||||||
| Significant Discrete Tax Items |
— | — | (78 | ) | ||||||||||||
| Core Net Income Attributable to Common Shareholders |
[a] | $ | 570 | $ | 687 | $ | 868 | |||||||||
| Denominator |
||||||||||||||||
| Weighted-Average Common Shares Outstanding - (Diluted, thousands) |
[b] | 324,027 | 337,812 | 373,029 | ||||||||||||
| Adjusted EPS |
[a] ÷ [b] | $ | 1.76 | $ | 2.03 | $ | 2.33 | |||||||||
| Core Return on Tangible Common Equity (ROTCE) |
||||||||||||||||
| Numerator ($ millions) | 2Q 22 | 1Q 22 | 2Q 21 | |||||||||||||
| GAAP Net Income Attributable to Common Shareholders |
$ | 454 | $ | 627 | $ | 900 | ||||||||||
| Discontinued Operations, Net of Tax |
— | — | (1 | ) | ||||||||||||
| Core OID |
10 | 10 | 9 | |||||||||||||
| Repositioning and Other |
— | — | 70 | |||||||||||||
| Change in Fair Value of Equity Securities |
136 | 66 | (19 | ) | ||||||||||||
| Tax on: Core OID & Change in Fair Value of Equity Securities (21% starting 1Q18) |
(31 | ) | (16 | ) | (13 | ) | ||||||||||
| Significant Discrete Tax Items |
— | — | (78 | ) | ||||||||||||
| Core Net Income Attributable to Common Shareholders |
[a] | $ | 570 | $ | 687 | $ | 868 | |||||||||
| Denominator (Average, $ millions) |
||||||||||||||||
| GAAP Shareholder’s Equity |
$ | 14,699 | $ | 16,232 | $ | 16,078 | ||||||||||
| Preferred Equity |
(2,324 | ) | (2,324 | ) | (1,162 | ) | ||||||||||
| GAAP Common Shareholder’s Equity |
$ | 12,375 | 13,908 | $ | 14,916 | |||||||||||
| Goodwill & Identifiable Intangibles, Net of Deferred Tax Liabilities (DTLs) |
(926 | ) | (937 | ) | (376 | ) | ||||||||||
| Tangible Common Equity |
$ | 11,449 | $ | 12,971 | $ | 14,540 | ||||||||||
| Core OID Balance |
(868 | ) | (878 | ) | (985 | ) | ||||||||||
| Net Deferred Tax Asset (DTA) |
(758 | ) | (437 | ) | (571 | ) | ||||||||||
| Normalized Common Equity |
[b] | $ | 9,822 | $ | 11,656 | $ | 12,984 | |||||||||
| Core Return on Tangible Common Equity |
[a] ÷ [b] | 23.2 | % | 23.6 | % | 26.7 | % | |||||||||
6
| Adjusted Tangible Book Value per Share |
||||||||||||||||
| Numerator ($ millions) | 2Q 22 | 1Q 22 | 2Q 21 | |||||||||||||
| GAAP Shareholder’s Equity |
$ | 13,984 | $ | 15,413 | $ | 17,530 | ||||||||||
| Preferred Equity |
(2,324 | ) | (2,324 | ) | (2,324 | ) | ||||||||||
| GAAP Common Shareholder’s Equity |
$ | 11,660 | $ | 13,089 | $ | 15,206 | ||||||||||
| Goodwill and Identifiable Intangible Assets, Net of DTLs |
(920 | ) | (932 | ) | (374 | ) | ||||||||||
| Tangible Common Equity |
10,740 | 12,157 | 14,832 | |||||||||||||
| Tax-effected Core OID Balance (21% starting in 4Q17) |
(682 | ) | (690 | ) | (752 | ) | ||||||||||
| Adjusted Tangible Book Value |
[a] | $ | 10,058 | $ | 11,468 | $ | 14,081 | |||||||||
| Denominator |
||||||||||||||||
| Issued Shares Outstanding (period-end, thousands) |
[b] | 312,781 | 327,306 | 362,639 | ||||||||||||
| Metric |
||||||||||||||||
| GAAP Common Shareholder’s Equity per Share |
$ | 37.28 | $ | 39.99 | $ | 41.93 | ||||||||||
| Goodwill and Identifiable Intangible Assets, Net of DTLs per Share |
(2.94 | ) | (2.85 | ) | (1.03 | ) | ||||||||||
| Tangible Common Equity per Share |
$ | 34.34 | $ | 37.14 | $ | 40.90 | ||||||||||
| Tax-effected Core OID Balance (21% starting in 4Q17) per Share |
(2.18 | ) | (2.11 | ) | (2.07 | ) | ||||||||||
| Adjusted Tangible Book Value per Share |
[a] ÷ [b] | $ | 32.16 | $ | 35.04 | $ | 38.83 | |||||||||
| Adjusted Efficiency Ratio |
||||||||||||||||
| Numerator ($ millions) | 2Q 22 | 1Q 22 | 2Q 21 | |||||||||||||
| GAAP Noninterest Expense |
$ | 1,138 | $ | 1,122 | $ | 1,075 | ||||||||||
| Insurance Expense |
(300 | ) | (274 | ) | (272 | ) | ||||||||||
| Adjusted Noninterest Expense for Adjusted Efficiency Ratio |
[a] | $ | 838 | $ | 848 | $ | 803 | |||||||||
| Denominator ($ millions) |
||||||||||||||||
| Total Net Revenue |
$ | 2,076 | $ | 2,135 | $ | 2,085 | ||||||||||
| Core OID |
10 | 10 | 9 | |||||||||||||
| Repositioning Items |
— | — | (70 | ) | ||||||||||||
| Insurance Revenue |
(178 | ) | (287 | ) | (359 | ) | ||||||||||
| Adjusted Net Revenue for Adjusted Efficiency Ratio |
[b] | $ | 1,908 | $ | 1,858 | $ | 1,805 | |||||||||
| Adjusted Efficiency Ratio |
[a] ÷ [b] | 43.9 | % | 45.6 | % | 44.5 | % | |||||||||
| Original Issue Discount Amortization Expense ($ millions) |
|
|||||||||||||||
| 2Q 22 | 1Q 22 | 2Q 21 | ||||||||||||||
| Core Original Issue Discount (Core OID) Amortization Expense |
|
$ | 10 | $ | 10 | $ | 9 | |||||||||
| Other OID |
2 | 3 | 3 | |||||||||||||
| GAAP Original Issue Discount Amortization Expense |
$ | 13 | $ | 13 | $ | 12 | ||||||||||
| Outstanding Original Issue Discount Balance ($ millions) |
|
|||||||||||||||
| 2Q 22 | 1Q 22 | 2Q 21 | ||||||||||||||
| Core Outstanding Original Issue Discount Balance (Core OID Balance) |
$ | (863 | ) | $ | (873 | ) | $ | (952 | ) | |||||||
| Other Outstanding OID Balance |
(39 | ) | (37 | ) | (32 | ) | ||||||||||
| GAAP Outstanding Original Issue Discount Balance |
$ | (901 | ) | $ | (911 | ) | $ | (983 | ) | |||||||
7
| $ in millions | ||||||||||||||||
| Net Financing Revenue (ex. Core OID) | 2Q 22 | 1Q 22 | 2Q 21 | |||||||||||||
| GAAP Net Financing Revenue |
[w] | $ | 1,764 | $ | 1,693 | $ | 1,547 | |||||||||
| Core OID |
10 | 10 | 9 | |||||||||||||
| Net Financing Revenue (ex. Core OID) |
[a] | $ | 1,774 | $ | 1,703 | $ | 1,556 | |||||||||
| Adjusted Other Revenue |
2Q 22 | 1Q 22 | 2Q 21 | |||||||||||||
| GAAP Other Revenue |
[x] | $ | 312 | $ | 442 | $ | 538 | |||||||||
| Accelerated OID & repositioning items |
— | — | 70 | |||||||||||||
| Change in Fair Value of Equity Securities |
136 | 66 | (19 | ) | ||||||||||||
| Adjusted Other Revenue |
[b] | $ | 448 | $ | 508 | $ | 588 | |||||||||
| Adjusted Total Net Revenue |
2Q 22 | 1Q 22 | 2Q 21 | |||||||||||||
| Adjusted Total Net Revenue |
[a]+[b] | $ | 2,222 | $ | 2,210 | $ | 2,145 | |||||||||
| Adjusted Provision for Credit Losses |
2Q 22 | 1Q 22 | 2Q 21 | |||||||||||||
| GAAP Provision for Credit Losses |
[y | ] | $ | 304 | $ | 167 | $ | (32 | ) | |||||||
| Adjusted Provision for Credit Losses |
[c] | $ | 304 | $ | 167 | $ | (32 | ) | ||||||||
| Adjusted NIE (ex. Repositioning) |
2Q 22 | 1Q 22 | 2Q 21 | |||||||||||||
| GAAP Noninterest Expense |
[z] | $ | 1,138 | $ | 1,122 | $ | 1,075 | |||||||||
| Adjusted NIE (ex. Repositioning) |
[d] | $ | 1,138 | $ | 1,122 | $ | 1,075 | |||||||||
| Core Pre-Tax Income | 2Q 22 | 1Q 22 | 2Q 21 | |||||||||||||
| Pre-Tax Income |
[w]+[x]-[y]-[z] | $ | 634 | $ | 846 | $ | 1,042 | |||||||||
| Core Pre-Tax Income |
[a]+[b]-[c]-[d] | $ | 780 | $ | 921 | $ | 1,102 | |||||||||
| Core Pre-Provision Net Revenue (Core PPNR) |
2Q 22 | 1Q 22 | 2Q 21 | |||||||||||||
| Pre-Provision Net Revenue |
[w]+[x]-[z] | $ | 938 | $ | 1,013 | $ | 1,010 | |||||||||
| Core Pre-Provision Net Revenue |
[a]+[b]-[d] | $ | 1,084 | $ | 1,088 | $ | 1,070 | |||||||||
|
|
||||||||||||||||
Insurance Non-GAAP Walk to Core Pre-Tax Income
| ($ millions) | 2Q 2022 | 2Q 2021 | ||||||||||||||||||||||||||||||
| GAAP | Core OID | Change in the fair value of equity securities |
Non-GAAP1 | GAAP | Core OID | Change in the fair value of equity securities |
Non-GAAP1 | |||||||||||||||||||||||||
| Insurance | ||||||||||||||||||||||||||||||||
| Premiums, Service Revenue Earned and Other |
$ | 285 | $ | — | $ | — | $ | 285 | $ | 283 | $ | — | $ | — | $ | 283 | ||||||||||||||||
| Losses and Loss Adjustment Expenses |
89 | — | — | 89 | 74 | — | — | 74 | ||||||||||||||||||||||||
| Acquisition and Underwriting Expenses |
211 | — | — | 211 | 198 | — | — | 198 | ||||||||||||||||||||||||
| Investment Income and Other |
(107 | ) | — | 136 | 29 | 76 | — | (20 | ) | 56 | ||||||||||||||||||||||
| Pre-Tax Income from Continuing Operations |
$ | (122 | ) | $ | — | $ | 136 | $ | 14 | $ | 87 | $ | — | $ | (20 | ) | $ | 67 | ||||||||||||||
1Non-GAAP line items walk to Core Pre-Tax Income, a non-GAAP financial measure that adjusts Pre-Tax Income.
8
|
Additional Financial Information |
||||||||||||||
For additional financial information, the second quarter 2022 earnings presentation and financial supplement are available in the Events & Presentations section of Ally’s Investor Relations Website at http://www.ally.com/about/investor/events-presentations/.
About Ally Financial
Ally Financial Inc. (NYSE: ALLY) is a digital financial services company committed to its promise to “Do It Right” for its consumer, commercial and corporate customers. Ally is composed of an industry-leading independent auto finance and insurance operation, an award-winning digital direct bank (Ally Bank, Member FDIC and Equal Housing Lender, which offers mortgage lending, point-of-sale personal lending, and a variety of deposit and other banking products), a consumer credit card business, a corporate finance business for equity sponsors and middle-market companies, and securities brokerage and investment advisory services. Our brand conviction is that we are all better off with an ally, and our focus is on helping our customers achieve their strongest financial well-being, a notion personalized to what is important to them. For more information, please visit www.ally.com and follow @allyfinancial.
For more information and disclosures about Ally, visit https://www.ally.com/#disclosures.
For further images and news on Ally, please visit http://media.ally.com.
Forward-Looking Statements
This earnings release and related communications should be read in conjunction with the financial statements, notes, and other information contained in our Annual Reports on Form 10-K, Quarterly Reports on Form 10-Q, and Current Reports on Form 8-K. This information is preliminary and based on company and third-party data available at the time of the release or related communication.
This earnings release and related communications contain forward-looking statements within the meaning of the Private Securities Litigation Reform Act of 1995. These statements can be identified by the fact that they do not relate strictly to historical or current facts — such as statements about the outlook for financial and operating metrics and performance and future capital allocation and actions. Forward-looking statements often use words such as “believe,” “expect,” “anticipate,” “intend,” “pursue,” “seek,” “continue,” “estimate,” “project,” “outlook,” “forecast,” “potential,” “target,” “objective,” “trend,” “plan,” “goal,” “initiative,” “priorities,” or other words of comparable meaning or future-tense or conditional verbs such as “may,” “will,” “should,” “would,” or “could.” Forward-looking statements convey our expectations, intentions, or forecasts about future events, circumstances, or results. All forward-looking statements, by their nature, are subject to assumptions, risks, and uncertainties, which may change over time and many of which are beyond our control. You should not rely on any forward-looking statement as a prediction or guarantee about the future.
Actual future objectives, strategies, plans, prospects, performance, conditions, or results may differ materially from those set forth in any forward looking statement. Some of the factors that may cause actual results or other future events or circumstances to differ from those in forward looking statements are described in our Annual Report on Form 10-K for the year ended December 31, 2021, our subsequent Quarterly Reports on Form 10-Q or Current Reports on Form 8-K, or other applicable documents that are filed or furnished with the U.S. Securities and Exchange Commission (collectively, our “SEC filings”). Any forward-looking statement made by us or on our behalf speaks only as of the date that it was made. We do not undertake to update any forward-looking statement to reflect the impact of events, circumstances, or results that arise after the date that the statement was made, except as required by applicable securities laws. You, however, should consult further disclosures (including disclosures of a forward-looking nature) that we may make in any subsequent SEC filings.
This earnings release and related communications contain specifically identified non-GAAP financial measures, which supplement the results that are reported according to generally accepted accounting principles (“GAAP”). These non-GAAP financial measures may be useful to investors but should not be viewed in isolation from, or as a substitute for, GAAP results. Differences between non-GAAP financial measures and comparable GAAP financial measures are reconciled in the release.
Unless the context otherwise requires, the following definitions apply. The term “loans” means the following consumer and commercial products associated with our direct and indirect financing activities: loans, retail installment sales contracts, lines of credit, and other financing products excluding operating leases. The term “operating leases” means consumer- and commercial-vehicle lease agreements where Ally is the lessor and the lessee is generally not obligated to acquire ownership of the vehicle at lease-end or compensate Ally for the vehicle’s residual value. The terms “lend,” “finance,” and “originate” mean our direct extension or origination of loans, our purchase or acquisition of loans, or our purchase of operating leases as applicable. The term “consumer” means all consumer products associated with our loan and operating-lease activities and all commercial retail installment sales contracts. The term “commercial” means all commercial products associated with our loan activities, other than commercial retail installment sales contracts. The term “partnerships” means business arrangements rather than partnerships as defined by law.
| Contacts: |
||
| Sean Leary | Peter Gilchrist | |
| Ally Investor Relations | Ally Communications (Media) | |
| 704-444-4830 | 704-644-6299 | |
| [email protected] | [email protected] |
9

2Q 2022 Preliminary Results Exhibit 99.2 Ally Financial Inc. 2Q 2022 Earnings Review July 19, 2022 Contact Ally Investor Relations at (866) 710-4623 or [email protected] 1

2Q 2022 Preliminary Results Forward-Looking Statements and Additional Information This presentation and related communications should be read in conjunction with the financial statements, notes, and other information contained in our Annual Reports on Form 10-K, Quarterly Reports on Form 10-Q, and Current Reports on Form 8-K. This information is preliminary and based on company and third-party data available at the time of the presentation or related communication. This presentation and related communications contain forward-looking statements within the meaning of the Private Securities Litigation Reform Act of 1995. These statements can be identified by the fact that they do not relate strictly to historical or current facts—such as statements about the outlook for financial and operating metrics and performance and future capital allocation and actions. Forward-looking statements often use words such as “believe,” “expect,” “anticipate,” “intend,” “pursue,” “seek,” “continue,” “estimate,” “project,” “outlook,” “forecast,” “potential,” “target,” “objective,” “trend,” “plan,” “goal,” “initiative,” “priorities,” or other words of comparable meaning or future-tense or conditional verbs such as “may,” “will,” “should,” “would,” or “could.” Forward-looking statements convey our expectations, intentions, or forecasts about future events, circumstances, or results. All forward-looking statements, by their nature, are subject to assumptions, risks, and uncertainties, which may change over time and many of which are beyond our control. You should not rely on any forward-looking statement as a prediction or guarantee about the future. Actual future objectives, strategies, plans, prospects, performance, conditions, or results may differ materially from those set forth in any forward-looking statement. Some of the factors that may cause actual results or other future events or circumstances to differ from those in forward-looking statements are described in our Annual Report on Form 10-K for the year ended December 31, 2021, our subsequent Quarterly Reports on Form 10-Q or Current Reports on Form 8-K, or other applicable documents that are filed or furnished with the U.S. Securities and Exchange Commission (collectively, our “SEC filings”). Any forward-looking statement made by us or on our behalf speaks only as of the date that it was made. We do not undertake to update any forward-looking statement to reflect the impact of events, circumstances, or results that arise after the date that the statement was made, except as required by applicable securities laws. You, however, should consult further disclosures (including disclosures of a forward-looking nature) that we may make in any subsequent SEC filings. This presentation and related communications contain specifically identified non-GAAP financial measures, which supplement the results that are reported according to U.S. generally accepted accounting principles (“GAAP”). These non-GAAP financial measures may be useful to investors but should not be viewed in isolation from, or as a substitute for, GAAP results. Differences between non-GAAP financial measures and comparable GAAP financial measures are reconciled in the presentation. Unless the context otherwise requires, the following definitions apply. The term “loans” means the following consumer and commercial products associated with our direct and indirect financing activities: loans, retail installment sales contracts, lines of credit, and other financing products excluding operating leases. The term “operating leases” means consumer- and commercial-vehicle lease agreements where Ally is the lessor and the lessee is generally not obligated to acquire ownership of the vehicle at lease-end or compensate Ally for the vehicle’s residual value. The terms “lend,” “finance,” and “originate” mean our direct extension or origination of loans, our purchase or acquisition of loans, or our purchase of operating leases, as applicable. The term “consumer” means all consumer products associated with our loan and operating-lease activities and all commercial retail installment sales contracts. The term “commercial” means all commercial products associated with our loan activities, other than commercial retail installment sales contracts. The term “partnerships” means business arrangements rather than partnerships as defined by law. 2

2Q 2022 Preliminary Results GAAP & Core Results: Quarterly ($ millions, except per share data) 2Q 22 1Q 22 4Q 21 3Q 21 2Q 21 GAAP net income attributable to common shareholders (NIAC) $ 454 $ 627 $ 624 $ 683 $ 900 (1)(2) $ 570 $ 687 $ 705 $ 782 $ 868 Core net income attributable to common shareholders GAAP earnings per common share (EPS) (basic or diluted as applicable, NIAC) $ 1.40 $ 1.86 $ 1.79 $ 1.89 $ 2.41 (1)(3) $ 1.76 $ 2.03 $ 2.02 $ 2.16 $ 2.33 Adjusted EPS Return on GAAP common shareholders' equity 14.7% 18.0% 16.8% 18.1% 24.1% (1)(4) Core ROTCE 23.2% 23.6% 22.1% 24.2% 26.7% GAAP common shareholders' equity per share $ 37.28 $ 39.99 $ 43.58 $ 42.81 $ 41.93 (1)(5) Adjusted tangible book value per share (Adjusted TBVPS) $ 32.16 $ 35.04 $ 38.73 $ 39.72 $ 38.83 Efficiency ratio 54.8% 52.6% 49.6% 50.5% 51.6% (1)(6) Adjusted efficiency ratio 43.9% 45.6% 44.4% 41.7% 44.5% GAAP total net revenue $ 2,076 $ 2,135 $ 2,199 $ 1,985 $ 2,085 (1)(7) Adjusted total net revenue $ 2,222 $ 2,210 $ 2,197 $ 2,110 $ 2,145 (1)(8) $ 938 $ 1,013 $ 1,109 $ 983 $ 1,010 Pre-provision net revenue (1)(8) Core pre-provision net revenue $ 1,084 $ 1,088 $ 1,107 $ 1,108 $ 1,070 Effective tax rate 24.0% 22.6% 26.8% 21.5% 13.7% (1) The following are non-GAAP financial measures which Ally believes are important to the reader of the Consolidated Financial Statements, but which are supplemental to and not a substitute for GAAP measures: Adjusted earnings per share (Adjusted EPS), Core pre-tax income (loss), Core pre-provision net revenue (Core PPNR), Core net income (loss) attributable to common shareholders, Core return on tangible common equity (Core ROTCE), Adjusted efficiency ratio, Adjusted total net revenue, Net financing revenue (excluding Core OID), Adjusted other revenue, Adjusted noninterest expense, Core original issue discount (Core OID) amortization expense, Core outstanding original issue discount balance (Core OID balance), and Adjusted tangible book value per share (Adjusted TBVPS). These measures are used by management, and we believe are useful to investors in assessing the company’s operating performance and capital. Refer to the Definitions of Non-GAAP Financial Measures and Other Key Terms, and Reconciliation to GAAP later in this document. (2) Core net income attributable to common shareholders is a non-GAAP financial measure. See page 29 for definition and 34 for calculation methodology. (3) Adjusted earnings per share (Adjusted EPS) is a non-GAAP financial measure. See page 34 for definition and calculation methodology. (4) Core return on tangible common equity (Core ROTCE) is a non-GAAP financial measure. See page 36 for definition and calculation methodology. (5) Adjusted tangible book value per share (Adjusted TBVPS) is a non-GAAP financial measure. See page 35 for definition and calculation methodology. (6) Adjusted efficiency ratio is a non-GAAP financial measure. See page 37 for definition and calculation methodology. (7) Adjusted total net revenue is a non-GAAP financial measure. See page 39 for calculation methodology. (8) Pre-provision net revenue (PPNR) and Core pre-provision net revenue (Core PPNR) are non-GAAP financial measures. See page 39 for definition and calculation methodology. 3

2Q 2022 Preliminary Results Purpose-Driven Culture & Priorities ‘Do It Right’ Culture and Values customers Relentless focus on our dealers, consumers & commercial clients digitally employees Ongoing prioritization of our financially teammates and their well-being personally communities Driving meaningful and lasting change through our actions and the Ally Charitable Foundation driving long-term, enhanced value for ALL stakeholders 4

2Q 2022 Preliminary Results 2Q 2022 Highlights Focused Execution Leading, Growing Businesses Durable Returns $1.76 23.2% $2.2B 9.6% Adjusted Total CET1 Adjusted Core (1) (1) (1) Net Revenue Capital Ratio ROTCE EPS • Consistent execution across Ally’s Auto, Insurance and Digital bank platforms, strengthening leading market position • Strong 2Q originations driving increased provision expense from CECL reserves • CCAR 2022: preliminary stress capital buffer of 250bps, ↓100bps | Strong capital and liquidity position Auto & Insurance • Consumer auto originations of $13.3B sourced from 3.3M applications | Highest quarterly origination volume since 2006 2 • 7.8% estimated retail auto originated yield, up 75bps from prior quarter | 54bps of retail auto net-charge offs • Insurance written premiums of $262M | $5.8B investment management portfolio Ally Bank • Deposits: $131.2B of retail deposits, ↓4% QoQ driven by elevated tax outflows; ↑1% YoY | 2.5M retail depositors, ↑6% YoY • Ally Home®: $0.9B originations, ↓60% YoY, reflecting higher interest rate environment | $18.9B HFI balance, ↑39% YoY • Ally Invest: $13.5B net customer assets, ↓18% YoY, driven by market trends | 518k active accounts, ↑5% YoY • Ally Lending: $591M gross originations, ↑98% YoY | 382k active borrowers, ↑78% YoY | 3.2k active merchants, ↑26% YoY 3 3 • Ally Credit Card: $1.2B credit card loan balances, ↑93% YoY | 908k active customers, ↑58% YoY • Corporate Finance: $8.5B HFI loan portfolio, ↑ 38% YoY | Deep expertise, disciplined risk management and steady returns (1) Represents a non-GAAP financial measure. See pages 34, 36, and 39 for calculation methodology and details. (2) Estimated Retail Auto Originated Yield is a forward-looking non-GAAP financial measure. See page 31 for details. (3) The YoY variances shown were calculated using information provided by Fair Square relating to periods prior to the closing of our acquisition of Fair Square on 12/1/21. Note: Ally Bank, Member FDIC and Equal Housing Lender, which offers mortgage lending, point-of-sale personal lending, and a variety of deposit and other banking products, a consumer credit card business, a corporate finance business for equity sponsors and middle-market companies, and securities and brokerage and investment advisory services. 5

2Q 2022 Preliminary Results Strong Value Proposition Product growth and customer expansion through differentiated products and services Proven Scale & Growing Digital-First Driving Deeper Value 99% >10.5 MILLION 9 out of 10 2 1 bank digital interactions new deposit customers customers 3 (deposits and invest) engaging with core product features multi-product customers have #1 95% 4 5 2X largest all-digital bank account openings completed digitally >2.5 million deposit customers more money with us (deposits, invest and credit card) smart savings tool customers #1 100% 6 prime auto lender 2X all-digital auto auction platform >22k dealer relationships more likely to open another ally product 4,000+ ~50% >70% underwriting, servicing and operations less attrition for customers of consumer auto collections associates in auto finance using smart savings tools treated digitally Constant evolution of seamless, integrated experiences See page 32 for footnotes. Note: Ally Bank, Member FDIC and Equal Housing Lender, which offers mortgage lending, point-of-sale personal lending, and a variety of deposit and other banking products, a consumer credit card business, a corporate finance business for equity sponsors and middle-market companies, and securities and brokerage and investment advisory services. 6

2Q 2022 Preliminary Results Consumer Snapshot Positioning for uncertain outlook; consumer trends normalizing from strong starting point Ally Savings Account Balance & Portfolio Mix by Average Monthly Ally Consumer Auto Applications Income Segment by Income Segment Change in avg. OSA balance (1Q’20 to 2Q’22) % change (2019 to 1H 2022) >$50K >$50K (83%) Total <$50K (17%) Total <$50K Retail Auto Originations & 30+ Day Delinquencies by Retail Auto Frequency of Default Ratio & Portfolio Income Decile Severity Retail Auto Avg. Income ~$105K Portfolio Net (2Q’22 originations) Severity % 1 2Q’19 DQs COVID-19 1 2Q’22 DQs deferral Annualized program Unit Loss active 2Q’22 Frequency of Originations Default Ratio (1) Ally serviced portfolio. Accruing contracts only. 7

2Q 2022 Preliminary Results Balance Sheet Foundation Common Equity Tier 1 (CET1) Allowance For Loan Losses ($ billions) ($ billions) CET1 % 2Q’22 ~$4.0B excess above 7% (Reg. Min. + prelim SCB) CET1 > 4.5% Reg. Min. 4.5% Reg. Min. Note: For more details on the final rules to address the impact of CECL on regulatory capital by allowing BHCs and banks, including Ally, to delay and subsequently phase-in its impact, see page 31 for details. Funding Liquidity Composition ($ billions) (1) (1) Highly liquid securities include unencumbered UST, Agency debt , Agency MBS and highly liquid corporates. 8

2Q 2022 Preliminary Results 2Q 2022 Financial Results 2Q 22 Consolidated Income Statement 1Q 22 2Q 21 1Q 22 2Q 21 ($ millions, except per share data) (1) $ 1,774 $ 1,703 $ 1,556 $ 71 $ 218 Net financing revenue (ex. Core OID) (1) (10) (10) (9) ( 0) (1) Core OID Net financing revenue $ 1,764 $ 1 ,693 $ 1 ,547 $ 71 $ 217 (1) 448 508 588 (59) (140) Adjusted other revenue (2) (136) (66) (50) (71) (86) Repositioning & change in fair value of equity securities Other revenue 312 442 538 (130) (226) Net charge-offs 153 133 (6) 20 159 Provision build / (release) 151 34 (26) 117 177 Provision for credit losses 304 167 (32) 137 336 Noninterest expense 1,138 1,122 1,075 16 63 Pre-tax income $ 634 $ 846 $ 1,042 $ (212) $ (408) Income tax expense 152 191 143 (39) 9 Net income / (loss) from discontinued operations - - 1 - ( 1) Net income $ 482 $ 655 $ 900 $ (173) $ (418) Preferred stock dividends 28 28 - - 28 Net income attributable to common stockholders $ 454 $ 627 $ 900 $ (1 73) $ (4 46) GAAP EPS (diluted) $ 1.40 $ 1.86 $ 2.41 $ (0.45) $ (1.01) (1) 0 .02 0.02 0.02 0 .00 0.01 Core OID, net of tax Change in fair value of equity securities, net of tax 0.33 0 .15 (0.04) 0.18 0.37 (3) - - 0 .14 - ( 0.14) Repositioning, discontinued ops., and other, net of tax Significant discrete tax items - - (0.21) - 0.21 (4) $ 1.76 $ 2.03 $ 2.33 $ (0.27) $ (0.57) Adjusted EPS (1) Represents a non-GAAP financial measure. For calculation methodology see page 39. (2) See page 38 for details and calculation methodology. (3) Represents a non-GAAP financial measure. For calculation methodology see pages 34 and 38. (4) Represents a non-GAAP financial measure. For calculation methodology see page 34. 9

2Q 2022 Preliminary Results Balance Sheet & Net Interest Margin 2Q 22 1Q 22 2Q 21 Average Average Average Balance Yield Balance Yield Balance Yield ($ millions) Retail Auto Loan $ 7 9,695 6.82% $ 78,224 6.61% $ 7 4,662 6.70% Retail Auto Loan (ex. hedge impact) 6.85% 6.75% 6.92% Auto Lease (net of depreciation) 10,615 6.66% 10,878 6.96% 10,355 11.67% Commercial Auto 16,211 3.65% 16,404 3.32% 16,332 3.60% Corporate Finance 8,351 5.02% 8,045 4.76% 6,383 5.37% (1) 18,980 3.01% 18,228 2.94% 13,179 2.80% Mortgage (2) 1,346 11.94% 1,100 12.62% 537 14.44% Consumer Other - Ally Lending (3) 1,093 19.71% 981 18.75% - - Consumer Other - Ally Credit Card Cash and Cash Equivalents 3,761 0.61% 4,027 0.15% 16,564 0.10% (4) 35,050 2.35% 37,025 2.09% 36,784 1.63% Investment Securities & Other Earning Assets $ 175,103 5.11% $ 174,911 4.86% $ 1 74,796 4.69% (4) 136,663 5.93% 134,220 5.76% 121,770 6.24% Total Loans and Leases (5) $ 139,814 0.76% $ 141,557 0.61% $ 139,382 0.77% Deposits (6) 9,674 5.04% 9,976 5.12% 11,737 5.33% Unsecured Debt Secured Debt 1,154 6.61% 1,089 6.36% 2,618 4.44% (7) 11,966 1.75% 7,203 2.11% 5,044 2.81% Other Borrowings (6) $ 1 62,608 1.12% $ 159,826 0.99% $ 1 58,781 1.23% Funding Sources (6) 4.06% 3.95% 3.57% NIM (ex. Core OID) NIM (as reported) 4.04% 3.93% 3.55% (1) Mortgage includes held-for-investment (HFI) loans from the Mortgage Finance segment and the HFI legacy mortgage portfolio in run-off at the Corporate and Other segment. (2) Unsecured lending from point-of-sale financing. (3) Credit Card lending portfolio. (4) Includes Community Reinvestment Act and other held-for-sale (HFS) loans. (5) Includes retail, brokered, and other deposits (inclusive of sweep deposits, mortgage escrow and other deposits). (6) Represents a non-GAAP financial measure. Excludes Core OID and Core OID balance. See page 39 for calculation methodology. (7) Includes FHLB borrowings and Repurchase Agreements. 10

2Q 2022 Preliminary Results Capital • 2Q 2022 CET1 ratio of 9.6% Capital Ratios and Risk-Weighted Assets – Strong earnings supporting loan growth across portfolios • Consistent, strong shareholder distributions Total Capital – Executed $600 million of repurchases in 2Q (~$1.2B YTD) Ratio Tier 1 Ratio – Announced 3Q common dividend of $0.30 per share CET1 Ratio • CCAR results demonstrate strength and resilience of Ally’s Risk balance sheet, and ability to withstand severe macro Weighted Assets ($B) economic stress – Ally’s CET1 FRB operating requirement of 7.0%, effective in October – Regulatory minimum CET1 of 4.5%; SCB of 2.5% (↓100bps) Note: For more details on the final rules to address the impact of CECL on regulatory capital by allowing BHCs and banks, including Ally, to delay and subsequently phase-in its impact, see page 31 for details. Common Shares Outstanding Dividend Per Share (# millions) Note: Repurchased common shares include shares withheld to cover income taxes owed by participants related to share-based incentive plans. 11

2Q 2022 Preliminary Results Asset Quality: Key Metrics Consolidated Net Charge-Offs (NCOs) Net Charge-Off Activity ($ millions) 2Q 21 3Q 21 4Q 21 1Q 22 2Q 22 Retail Auto $ (5) $ 51 $ 94 $ 113 $ 108 Commercial Auto - - - (1) (1) Annualized NCO Rate Mortgage Finance 1 - - - (1) Corporate Finance (4) - 1 - 26 NCOs ($M) Ally Lending 4 5 9 15 13 (1) Ally Credit Card - - 2 8 11 ($6) (2) Corp/Other (2) (2) (3) (2) (3) Total $ (6) $ 54 $ 103 $ 133 $ 153 Note: Ratios exclude loans measured at fair value and loans held-for-sale. See page 31 for definition. (1) 4Q’21 Ally Credit Card NCOs represent December 2021 activity only (2) Corp/Other includes legacy Mortgage HFI portfolio. Retail Auto Delinquencies Retail Auto Net Charge-Offs (NCOs) Days Past Due (“DPD”) 2Q’22 ↑ 30+ DPD driven by seasonality and continued normalization 30+ DPD Delinquency Rate 60+ DPD Delinquency Rate Annualized NCO Rate NCOs ($M) 60+ Delinquent Contracts ($M) ($5) See page 31 for definition. Note: Includes accruing contracts only. 12

2Q 2022 Preliminary Results Asset Quality: Coverage & Reserves Consolidated Coverage Retail Auto Coverage ($ billions) ($ billions) Reserve (%) Reserve (%) Reserve ($) Reserve ($) Note: Coverage rate calculations exclude fair value adjustment for loans in hedge accounting relationships. Note: Coverage rate calculations exclude fair value adjustment for loans in hedge accounting relationships. Consolidated QoQ Reserve Walk ($ millions) Net Charge- ∆ In Portfolio All 2Q’22 1Q’22 1 2 3 off Activity Size Other Reserve Reserve ($153) 2Q’22 NCOs ($14) $163 Loan Growth Includes macroeconomic $3,301 $3,450 $153 Replenished trends Increases in 2Q reserves primarily driven by strong origination volume, positioning Ally for long-term, accretive returns 13

2Q 2022 Preliminary Results Ally Bank: Deposit & Customer Trends • Total deposits of 140.4 billion, up $1.3 billion YoY Total Deposits: Retail & Brokered ($ billions; EoP) – Retail deposits of $131.2 billion, down $4.8 billion QoQ; up $1.9 billion YoY – 2Q retail deposit balance decline driven by elevated tax outflows, Brokered / Other reflective of industry-wide trends ▪ Continue to expect full year 2022 retail deposit growth Customer Retention 96% 96% 96% 96% 96% 96% Rate • 2.5 million retail deposit customers, up 6% YoY Retail Balances rd – Ally’s 53 consecutive quarter of growth Avg. Retail Portfolio Interest Rate – 69% of new 2Q customers were from millennial or younger generations Note: Brokered / Other includes sweep deposits, mortgage escrow and other deposits. See page 31 for Customer Retention Rate definition. Numbers may not foot due to rounding. Retail Deposit Customer Trends Ally Bank: Multi-Product Relationship Customers Deposit Customers with an Ally Invest or Ally Home relationship Total Customers 2.5M Net New Customers per Quarter 1.1M 14

2Q 2022 Preliminary Results Ally Bank: Leading, Growing & Diversified $ # 2.5M 53 131B 13+ 1 Largest All-Digital, Ally Bank Consecutive Quarters Retail Deposit Consecutive Years of (1) Direct U.S. Bank Deposit Customers of Customer Growth Balances Retail Deposit Growth Brokerage & Wealth: Ally Invest • Momentum in newly acquired consumer businesses Net Customer Assets ($ in billions) | Depositors drove ~70% of account growth in 2Q’22 with opportunity for meaningful growth in earning Acquired: 2Q’16 assets and risk adjusted returns 20% CAGR – Complementary, digitally-based products and services to provide seamless, integrated customer experiences – Differentiated value proposition drives increased engagement and retention, positioning Ally for growth Net Funded Accounts (k) – Leveraging strength of Ally brand, marketing and balance sheet to scale efficiently Point-of-Sale: Ally Lending Credit Card: Ally Credit Card EoP Portfolio Balances ($ in billions) | 3.2k merchant relationships; 31% CAGR EoP Portfolio Balances ($ in billions) | ~63% Customer CAGR since 2017 Acquired: 4Q’19 Acquired: 4Q’21 119% CAGR +93% See page 32 for footnotes. Note: Ally Bank, Member FDIC and Equal Housing Lender, which offers mortgage lending, point-of-sale personal lending, and a variety of deposit and other banking products, a consumer credit card business, a corporate finance business for equity sponsors and middle-market companies, and securities and brokerage and investment advisory services. 15

2Q 2022 Preliminary Results Auto Finance Inc / (Dec) v. • Auto pre-tax income of $600 million Key Financials ($ millions) 2Q 22 1Q 22 2Q 21 – Pre-tax income, down $125 million QoQ, primarily driven by higher Net financing revenue $ 1,301 $ 6 $ ( 32) provision for credit losses from robust consumer origination volume Total other revenue 72 4 11 Total net revenue 1,373 10 (21) – Ending earning assets of $108.8 billion, increased $7.1 billion YoY, largely driven by retail auto loan growth Provision for credit losses 228 124 251 (1) Noninterest expense 545 11 45 • Strong pricing and credit trends reflect dealer Pre-tax income $ 600 $ (125) $ (317) engagement, deep expertise in underwriting and servicing U.S. auto earning assets (EOP) $ 1 08,816 $ 1,529 $ 7,055 • Used vehicle values stayed elevated, driven by continued Key Statistics strength in consumer demand and low vehicle supply Remarketing gains ($ millions) $ 50 $ (0) $ ( 78) Average gain per vehicle $ 1,671 $ 31 $ (2,013) – Elevated prepayment activity remains a headwind to portfolio yield Off-lease vehicles terminated (# units) 29,665 (823) (5,103) – Lease buyout trends continue to limit remarketing gains Application Volume (# thousands) 3,296 128 (232) Retail Auto Yield Trends Lease Portfolio Trends Lessee & Dealer Estimated Buyout % Originated (2) Yield Manheim ↑ ~60% Used Vehicle Portfolio vs. 2Q’19 Value Index Yield (ex. Hedge) Remarketing Gains ($ millions) NCO Rate Avg. Gain / Unit 0.95% (0.03%) 0.27% 0.48% 0.58% 0.54% $776 $3,684 $2,495 $2,339 $1,640 $1,671 See page 32 for additional footnotes. (2) Estimated Retail Auto Originated Yield is a forward-looking non-GAAP financial measure. See page 31 for details. 16

2Q 2022 Preliminary Results Used Vehicle Value Dynamics Limited supply and strong demand has driven used vehicle values +~60% vs. 2019 with offsetting impacts across Ally P&L 2Q Pre-tax Impact H / (L) vs. 2019 + Favorable charge-off severity Retail NCOs ~$50M driven by ↑ auction proceeds Strong auction proceeds and ~$45M Net Lease Revenue ↓ depreciation, net of ↑ lessee buyouts Low new vehicle inventories Commercial Floorplan ~$45M driving ↓~$10B earning assets Prepayment impacts of increased used ~$50M Retail Portfolio Yield demand + positive vehicle equity - As market conditions gradually normalize, driven by improvement in supply chains and new vehicle supply, natural hedges expected to limit overall profitability impact 17 Used Vehicle Value Impact (Used vehicle values ↑~60 % 2Q’22 avg. vs. 2Q’19 avg.)

2Q 2022 Preliminary Results Auto Finance: Agile Market Leader # # # # Leading 1 1 1 1 Prime Auto Bank Floorplan Bank Retail Auto Dealer Satisfaction Insurance Provider (1) (2) (3) (4) Lender Lender Loan Outstandings J.D. Power Award (F&I, P&C Products) Dealer Relationships & Consumer Applications Auto Balance Sheet Trends ($ billions) ($ billions; EoP) Active U.S. Dealer (5) Relationships Lease Retail U.S. Consumer Applications 6.5M Commercial YTD Auto Consumer Originations Consumer Origination Mix ($ billions; % of $ originations) (% of $ originations) Retail Weighted Avg. Lease FICO New Growth Used Stellantis Nonprime % of GM Total Retail See page 32 for footnotes. 18

2Q 2022 Preliminary Results Insurance Inc / (Dec) v. • Insurance pre-tax loss of $122 million and core pre-tax Key Financials ($ millions) 2Q 22 1Q 22 2Q 21 income of $14 million Premiums, service revenue earned and other $ 285 1 $ 2 VSC Losses 38 5 5 – $285 million of earned premiums represents highest 2Q since IPO Weather Losses 26 24 11 Other Losses 25 2 (1) – Higher YoY losses driven by weather, as 2Q’21 represented the Losses and loss adjustment expenses 89 31 15 lowest 2Q weather losses since IPO (2) Acquisition and underwriting expenses 211 (5) 13 Total underwriting income (15) (25) (26) – Investment income of $29 million, lower YoY and QoQ, driven by (1) Investment income and other (adjusted) 29 (34) (27) elevated investment gains in prior periods (1) Core pre-tax income $ 14 $ (59) $ ( 53) (3) Change in fair value of equity securities ( 136) (76) ( 156) • Written premiums of $262 million in 2Q 2022, down 13% YoY, reflecting lower unit sales and inventory levels Pre-tax income loss $ (122) $ (135) $ (209) Total assets (EOP) $ 8,819 $ (401) $ (575) Key Statistics - Insurance Ratios 2Q 22 1Q 22 2Q 21 Loss ratio 31.2% 20.5% 26.3% Underwriting expense ratio 74.8% 76.0% 70.4% Combined ratio 106.0% 96.5% 96.7% Insurance Losses Insurance Written Premiums ($ millions) ($ millions) P&C Premium Other Losses Weather Losses F&I Premium VSC Losses (1) Represents a non-GAAP financial measure. See page 38 for calculation methodology and details. Note: F&I: Finance and insurance products and other. P&C: Property and 19 For additional footnotes see page 33. casualty insurance products.

2Q 2022 Preliminary Results Corporate Finance Inc / (Dec) v. • Corporate Finance pre-tax income of $60 million Key Financials ($ millions) 2Q 22 1Q 22 2Q 21 – Provision increase YoY driven by higher specific reserves and a Net financing revenue $ 77 $ (6) $ - recovery in the prior year (1) Adjusted total other revenue 19 (10) (15) (1) Adjusted total net revenue 96 (16) (15) – Other revenue down YoY driven by equity investment gains that did Provision for credit losses 8 2 21 not repeat and lower syndication fee income (2) Noninterest expense 28 (9) - • Held-for-investment loans of $8.5B, up 38% YoY (1) Core pre-tax income $ 60 $ (9) $ ( 36) (3) – YoY increase driven by strong origination volume while maintaining Change in fair value of equity securities 0 5 1 Pre-tax income credit discipline $ 60 $ (4) $ ( 35) Total assets (EOP) $ 8,890 $ 804 $ 2,644 • High quality, 100% floating-rate lending portfolio – Comprised of 57% asset-based loans with 99.9% in first lien position HFI Loans and Unfunded Commitments Diversified Loan Portfolio ($ billions; EoP) (as of 6/30/22) Unfunded Commitments HFI Loans Note: Balances exclude HFS loans and include signed commitment letters. HFI loans shown net of deferred fees (1) Represents a non-GAAP financial measure. See page 38 for calculation methodology and details. For additional footnotes see page 33. 20

2Q 2022 Preliminary Results Mortgage Finance Inc / (Dec) v. • Mortgage pre-tax income of $6 million Key Financials ($ millions) 2Q 22 1Q 22 2Q 21 – Net financing revenue, up $33 million YoY, reflecting growth in Net financing revenue $ 56 $ 3 $ 33 asset balances and decelerating prepayment activity Total other revenue 4 (10) (18) – Other revenue, down YoY and QoQ, driven by decreased gain Total net revenue $ 60 $ (7) $ 15 on sale margins and lower HFS units Provision for credit losses - - - (1) Noninterest expense 54 (2) 9 • Direct-to-Consumer (DTC) originations of $0.9 billion in Pre-tax income 2Q 2022, down 60% YoY, driven by market conditions $ 6 $ (5) $ 6 Total assets (EOP) $ 19,126 $ 530 $ 5,261 – Refinance activity down 80% QoQ and 87% YoY – 43% of 2Q originations from existing depositors Mortgage Finance HFI Portfolio 2Q 22 1Q 22 2Q 21 Net Carry Value ($ billions) $ 18.9 $ 18.4 $ 13.6 • Partnership model limits operational volatility from (2) 53.7% 55.7% 58.8% Wtd. Avg. LTV/CLTV changes in industry volume Refreshed FICO 779 776 776 Mortgage: Held-for-Investment Assets Mortgage: Direct-to-Consumer Originations ($ billions) ($ billions) DTC DTC HFS Bulk DTC HFI Bulk $0.0 $1.7 $1.2 $0.7 $0.8 $0.8 See page 33 for footnotes. 21

2Q 2022 Preliminary Results Strategic Priorities ‘Do It Right’ Purpose-Driven Culture Optimizing leading Auto, Insurance & Ally Bank products & platforms Engaging customers with newer products across scalable platforms Differentiating through deep expertise & digital-first capabilities Driving disciplined risk management & accretive capital deployment Delivering sustainable, enhanced results and value for ALL stakeholders 22

2Q 2022 Preliminary Results Supplemental 23

2Q 2022 Preliminary Results Supplemental Results by Segment Core pre-tax income Walk Inc / (Dec) v. ($ millions) Segment Detail 2Q 22 1Q 22 2Q 21 1Q 22 2Q 21 Automotive Finance $ 600 $ 725 $ 917 $ (1 25) $ (3 17) Insurance (1 22) 13 87 (135) (209) Dealer Financial Services $ 478 $ 738 $ 1 ,004 $ (260) $ (5 26) Corporate Finance 60 64 95 (4 ) (35) Mortgage Finance 6 11 - (5 ) 6 Corporate and Other 90 33 (5 7) 57 147 $ (2 12) $ (4 08) Pre-tax income from continuing operations $ 634 $ 846 $ 1 ,042 (1) Core OID 10 10 9 0 1 (2) Change in fair value of equity securities 136 66 (1 9) 71 156 (3) Repositioning and other - - 70 - (70) (1) $ (141) $ (321) $ 780 $ 921 $ 1 ,102 Core pre-tax income (1) Represents a non-GAAP financial measure. See pages 38 and 39 for calculation methodology and details. See page 33 for additional footnotes. 24

2Q 2022 Preliminary Results Supplemental Funding Profile Details Funding Mix Deposit Mix Unsecured FHLB / Other Brokered / Other Secured Retail CD Deposits MMA/OSA/ Checking Note: Totals may not foot due to rounding. Note: Other includes sweep deposits, mortgage escrow and other deposits. Totals may not foot due to rounding. (1) Unsecured Long-Term Debt Maturities Wholesale Funding Issuance ($ billions) ($ billions) Maturity Weighted Avg. Principal Amount (2) Outstanding Date Coupon 2023 2.09% $ 2.00 2024 4.48% $ 1.45 (3) 2025+ 6.01% $ 6.29 (1) Excludes retail notes and perpetual preferred equity; as of 6/30/2022. Note: Term ABS shown includes funding amounts (notes sold) at new issue and does not include private (2) Reflects notional value of outstanding bond. Excludes total GAAP OID and capitalized transaction costs. offerings sold later. Excludes $2.35 billion of preferred equity issued in 2021. Totals may not foot due to (3) Weighted average coupon based on notional value and corresponding coupon for all unsecured bonds as of rounding. January 1st of the respective year. Does not reflect weighted average interest expense for the respective year. 25

2Q 2022 Preliminary Results Supplemental Corporate and Other ($ millions) Inc / (Dec) v. • Pre-tax income of $90 million, Core pre-tax income of Key Financials 2Q 22 1Q 22 2Q 21 $101 million includes: Net financing revenue $ 310 $ 65 $ 211 Total other revenue 59 (7) ( 19) Total net revenue $ 369 $ 58 $ 192 – Higher YoY net financing revenue driven by increased yield on Provision for credit losses 68 11 64 securities portfolio and reduced cash balances Noninterest expense 211 (10) ( 19) Pre-tax income $ 90 $ 57 $ 147 (1) • Total assets down YoY primarily driven by normalized Core OID 10 0 1 (2) Repositioning and other - - (70) cash balances (3) Change in fair value of equity securities 0 (0) 1 - - (1) Core pre-tax income $ 101 $ 57 $ 79 Cash & securities $ 32,324 $ (1,343) $ (11,880) (4) Held-for-investment loans, net 2,446 298 1,146 (5) Intercompany loan (411) 161 286 (5) Other 7,331 (67) 1,335 Total assets $ 41,690 $ ( 951) $ (9,113) Ally Financial Rating Details Ally Invest 2Q 22 1Q 22 2Q 21 Net Funded Accounts (k) 518.2 517.3 494.6 Ally Financial Ratings / Upgrades Average Customer Trades Per Day (k) 33.7 40.2 48.5 LT Debt ST Debt Outlook Date Total Customer Cash Balances $ 2,027 $ 2,268 $ 2,166 Total Net Customer Assets $ 13,508 $ 16,733 $ 1 6,444 Fitch BBB- F3 Stable 3/24/2022 Moody's Baa3 P-3 Stable 8/27/2021 S&P BBB- A-3 Stable 3/25/2021 DBRS BBB R-2H Stable 2/18/2022 Ally Lending 2Q 22 1Q 22 2Q 21 Note: Ratings & Outlook as of 6/30/2022. Our borrowing costs & access to the capital markets could be negatively Gross Originations $ 591 $ 442 $ 299 impacted if our credit ratings are downgraded or otherwise fail to meet investor expectations or demands. Held-for-investment Loans (EOP) $ 1,523 $ 1,209 $ 640 Portfolio yield 11.9% 12.6% 14.4% NCO % 4.0% 5.4% 3.3% Ally Credit Card 2Q 22 1Q 22 2Q 21 Gross Receivable Growth (EOP) $ 189 $ 83 $ 99 Outstanding Balance (EOP) $ 1,225 $ 1,036 $ 634 NCO % 3.8% 3.2% 6.0% Active Cardholders (k) 908.4 8 43.8 573.4 Note: Ally Credit Card metrics are not reflected in Ally’s 2Q’21 consolidated results (1) Represents a non-GAAP financial measure. See pages 38 and 39 for calculation methodology and details. See page 33 for additional footnotes. 26

2Q 2022 Preliminary Results Supplemental Interest Rate Risk Sensitivities (1) Net Financing Revenue Sensitivity Analysis ($ millions) 2Q 22 1Q 22 (2) (2) Change in interest rates Gradual Instantaneous Gradual Instantaneous -25 bps $ ( 5) $ 26 $ 8 $ 38 +100 bps $ 26 $ (79) $ (17) $ (135) Stable rate environment n/m $ 751 n/m $ 613 (1) Net financing revenue impacts reflect a rolling 12-month view. See page 31 for additional details. (2) Gradual changes in interest rates are recognized over 12 months. 27

2Q 2022 Preliminary Results Supplemental Deferred Tax Asset (1) Deferred Tax Asset 2Q 22 1Q 22 Gross DTA Valuation Net DTA Net DTA Balance Allowance Balance Balance Net Operating Loss (Federal) $ 516 $ - $ 516 $ 660 Tax Credit Carryforwards 1,123 ( 729) 394 350 State/Local Tax Carryforwards 288 ( 137) 151 124 Other Deferred Tax Assets / (Liabilities) (179) - (179) (525) Net Deferred Tax Asset $ 1,748 $ ( 866) $ 882 $ 609 (1) GAAP does not prescribe a method for calculating individual elements of deferred taxes for interim periods; therefore, these balances are estimates. Deferred Tax Asset / (Liability) Balances ($ millions) Net GAAP DTA Balance Disallowed DTA $871 $882 $839 $609 $244 $75 $48 $6 $2 $5 2Q 21 3Q 21 4Q 21 1Q 22 2Q 22 Note: Changes to DTA in 2021 driven primarily by changes in tax depreciation election. Increase to DTA in 2022 primarily due to unrealized losses on investment securities, partially offset by pre-tax book income. 28

2Q 2022 Preliminary Results Supplemental Notes on Non-GAAP Financial Measures The following are non-GAAP financial measures which Ally believes are important to the reader of the Consolidated Financial Statements, but which are supplemental to, and not a substitute for, GAAP measures: Adjusted Earnings per Share (Adjusted EPS), Core pre-tax income, Pre-provision net revenue (PPNR) and Core pre-provision net revenue (Core PPNR), Core net income attributable to common shareholders, Core return on tangible common equity (Core ROTCE), Adjusted efficiency ratio, Adjusted total net revenue, Adjusted other revenue, Adjusted noninterest expense, Core original issue discount (Core OID) amortization expense and Core outstanding original issue discount balance (Core OID balance), Net financing revenue (excluding Core OID), and Adjusted tangible book value per share (Adjusted TBVPS). These measures are used by management, and we believe are useful to investors in assessing the company’s operating performance and capital. For calculation methodology, refer to the Reconciliation to GAAP later in this document. 1) Core pre-tax income is a non-GAAP financial measure that adjusts pre-tax income from continuing operations by excluding (1) Core OID, and (2) equity fair value adjustments related to ASU 2016-01 which requires change in the fair value of equity securities to be recognized in current period net income as compared to periods prior to 1/1/18 in which such adjustments were recognized through other comprehensive income, a component of equity (change in fair value of equity securities impacts the Insurance and Corporate Finance segments), and (3) Repositioning and other which are primarily related to the extinguishment of high cost legacy debt, strategic activities and significant other one-time items, as applicable for respective periods or businesses. Management believes core pre-tax income can help the reader better understand the operating performance of the core businesses and their ability to generate earnings. See page 38 for calculation methodology and details. 2) Core pre-provision net revenue (Core PPNR) is a non-GAAP financial measure calculated by adjusting Core pre-tax income to add back provision for credit losses. Management believes that Core PPNR is a helpful financial metric because it enables the reader to assess the core business' ability to generate earnings to cover credit losses and as it is utilized by Federal Reserve's approach to modeling within the Supervisory Stress Test Framework that generally follows U.S. generally accepted accounting principles (GAAP) and includes a calculation of PPNR as a component of projected pre-tax net income. See page 39 for calculation methodology and details. 3) Core net income attributable to common shareholders is a non-GAAP financial measure that serves as the numerator in the calculations of Adjusted EPS and Core ROTCE and that, like those measures, is believed by management to help the reader better understand the operating performance of the core businesses and their ability to generate earnings. Core net income attributable to common shareholders adjusts GAAP net income attributable to common shareholders for discontinued operations net of tax, tax-effected Core OID expense, tax-effected repositioning and other primarily related to the extinguishment of high-cost legacy debt and strategic activities and significant other, preferred stock capital actions, significant discrete tax items and tax-effected changes in equity investments measured at fair value, as applicable for respective periods. See page 34 calculation methodology and details. 4) Tangible Common Equity is a non-GAAP financial measure that is defined as common stockholders’ equity less goodwill and identifiable intangible assets, net of deferred tax liabilities. Ally considers various measures when evaluating capital adequacy, including tangible common equity. Ally believes that tangible common equity is important because we believe readers may assess our capital adequacy using this measure. Additionally, presentation of this measure allows readers to compare certain aspects of our capital adequacy on the same basis to other companies in the industry. For purposes of calculating Core return on tangible common equity (Core ROTCE), tangible common equity is further adjusted for Core OID balance and net deferred tax asset. See page 36 for more details. 5) Core original issue discount (Core OID) amortization expense is a non-GAAP financial measure for OID and is believed by management to help the reader better understand the activity removed from: Core pre-tax income (loss), Core net income (loss) attributable to common shareholders, Adjusted EPS, Core ROTCE, Adjusted efficiency ratio, Adjusted total net revenue, and Net financing revenue (excluding Core OID). Core OID is primarily related to bond exchange OID which excludes international operations and future issuances. Core OID for all periods shown is applied to the pre-tax income of the Corporate and Other segment. See page 39 calculation methodology and details. 29

2Q 2022 Preliminary Results Supplemental Notes on Non-GAAP Financial Measures 6) Core outstanding original issue discount balance (Core OID balance) is a non-GAAP financial measure for outstanding OID and is believed by management to help the reader better understand the balance removed from Core ROTCE and Adjusted TBVPS. Core OID balance is primarily related to bond exchange OID which excludes international operations and future issuances. See page 39 for calculation methodology and details. 7) Accelerated issuance expense (Accelerated OID) is the recognition of issuance expenses related to calls of redeemable debt. 30

2Q 2022 Preliminary Results Supplemental Notes on Other Financial Measures 1) Estimated Retail Auto Originated Yield is a forward-looking non-GAAP financial measure determined by calculating the estimated average annualized yield for loans originated during the period. At this time there currently is no comparable GAAP financial measure for Estimated Retail Auto Originated Yield and therefore this forecasted estimate of yield at the time of origination cannot be quantitatively reconciled to comparable GAAP information. 2) Interest rate risk modeling – We prepare our forward-looking baseline forecasts of net financing revenue taking into consideration anticipated future business growth, asset/liability positioning, and interest rates based on the implied forward curve. The analysis is highly dependent upon a variety of assumptions including the repricing characteristics of retail deposits with both contractual and non-contractual maturities. We continually monitor industry and competitive repricing activity along with other market factors when contemplating deposit pricing actions. Please see our SEC filings for more details. 3) Net charge-off ratios are calculated as annualized net charge-offs divided by average outstanding finance receivables and loans excluding loans measured at fair value and loans held-for-sale. 4) U.S. consumer auto originations ▪ New Retail – standard and subvented rate new vehicle loans ▪ Lease – new vehicle lease originations ▪ Used – used vehicle loans ▪ Growth – total originations from non-GM/Stellantis dealers and direct-to-consumer loans. Note: Stellantis N.V. (“Stellantis”) announced January 17, 2021, following completion of the merger of Peugeot S.A. (“Groupe PSA”) and Fiat Chrysler Automobiles N.V. (“FCA”) on January 16, 2021, the combined company was renamed Stellantis. ▪ Nonprime – originations with a FICO® score of less than 620 5) Customer retention rate is the annualized 3-month rolling average of 1 minus the monthly attrition rate; excludes escheatment. 6) Estimated impact of CECL on regulatory capital per final rule issued by U.S. banking agencies - In December 2018, the FRB and other U.S. banking agencies approved a final rule to address the impact of CECL on regulatory capital by allowing BHCs and banks, including Ally, the option to phase in the day-one impact of CECL over a three-year period. In March 2020, the FRB and other U.S. banking agencies issued an interim final rule that became effective on March 31, 2020 and provided an alternative option for banks to temporarily delay the impacts of CECL, relative to the incurred loss methodology for estimating the allowance for loan losses, on regulatory capital. A final rule that was largely unchanged from the March 2020 interim final rule was issued by the FRB and other U.S. banking agencies in August 2020, and became effective in September 2020. For regulatory capital purposes, these rules permitted us to delay recognizing the estimated impact of CECL on regulatory capital until after a two-year deferral period, which for us extended through December 31, 2021. Beginning on January 1, 2022, we are required to phase in 25% of the previously deferred estimated capital impact of CECL, with an additional 25% to be phased in at the beginning of each subsequent year until fully phased in by the first quarter of 2025. Under these rules, firms that adopt CECL and elect the five-year transition will calculate the estimated impact of CECL on regulatory capital as the day-one impact of adoption plus 25% of the subsequent change in allowance during the two-year deferral period, which according to the final rule approximates the impact of CECL relative to an incurred loss model. We adopted this transition option during the first quarter of 2020, and beginning January 1, 2022 are phasing in the regulatory capital impacts of CECL based on this five-year transition period. 7) Change in fair value of equity securities impacts the Insurance, Corporate Finance and Corporate Other segments. Reflects equity fair value adjustments related to ASU 2016-01 which requires change in the fair value of equity securities to be recognized in current period net income as compared to periods prior to 1/1/18 in which such adjustments were recognized through other comprehensive income, a component of equity. 31

2Q 2022 Preliminary Results Supplemental Additional Notes Page – 6 | Strong Value Proposition (1) Customers include on-balance sheet Auto, U.S. and Canadian Insurance, active Depositors, on-balance sheet Ally Home DTC Mortgage, Ally Lending, Ally Invest, and Ally Credit Card. (2) Bank digital interactions represent the percentage of Deposit and Ally Invest online and mobile logins divided by online and mobile logins and phone calls over the last 12 months. (3) Engaged bank customers are Deposit customers, acquired in the last six months, defined by several factors including multiple account ownership, and based on the frequency, intensity, or depth of interaction between customers and a product, feature, or service (e.g., smart savings tools and direct deposit). (4) Source: FDIC, FFIEC Call Reports and Company filings of branchless banks including Marcus, Discover, American Express, Synchrony. (5) New account openings completed digitally represents percentage of Deposit, Ally Invest and Credit Card applications submitted digitally versus non-digitally (i.e., through Contact Center) over the last 12 months. (6) ‘Prime Auto Lender’ - Source: PIN Navigator Data & Analytics, a business division of J.D. Power. The credit scores provided within these reports have been provided by FICO® Risk Score, Auto 08 FICO® is a registered trademark of Fair Isaac Corporation in the United States and other countries. Ally management defines retail auto market segmentation (unit based) for consumer automotive loans primarily as those loans with a FICO® Score (or an equivalent score) at origination by the following: • Super-prime 720+, Prime 620 – 719, Nonprime less than 620 Page – 15 | Ally Bank: Leading, Growing & Diversified (1) Source: FDIC, FFIEC Call Reports and Company filings of branchless banks including Marcus, Discover, American Express, Synchrony. Page – 16 | Auto Finance (1) Noninterest expense includes corporate allocations of $245 million in 2Q 2022, $248 million in 1Q 2022, and $218 million in 2Q 2021. Page – 18 | Auto Finance: Agile Market Leader (1) ‘Prime Auto Lender’ - Source: PIN Navigator Data & Analytics, a business division of J.D. Power. The credit scores provided within these reports have been provided by FICO® Risk Score, Auto 08 FICO® is a registered trademark of Fair Isaac Corporation in the United States and other countries. Ally management defines retail auto market segmentation (unit based) for consumer automotive loans primarily as those loans with a FICO® Score (or an equivalent score) at origination by the following: • Super-prime 720+, Prime 620 – 719, Nonprime less than 620 (2) ‘Bank Floorplan Lender’ - Source: Company filings, including WFC and HBAN. (3) ‘Retail Auto Loan Outstandings’ - Source: Big Wheels Auto Finance Data 2021. (4) ‘#1 Dealer Satisfaction among Non-Captive Lenders with Sub-Prime Credit’ - Source: J.D. Power. (5) ‘Active U.S. Dealers’ defined as all dealers who utilize one or more of Ally’s products including consumer & commercial lending, SmartAuction or Commercial Services Group and excludes RV Commercial & Consumer lines of business exited in 2Q 2018. 32

2Q 2022 Preliminary Results Supplemental Additional Notes Page – 19 | Insurance (2) Acquisition and underwriting expenses includes corporate allocations of $22 million in 2Q 2022, $23 million in 1Q 2022, and $20 million in 2Q 2021. (3) Change in fair value of equity securities impacts the Insurance segment. Reflects equity fair value adjustments related to ASU 2016-01 which requires change in the fair value of equity securities to be recognized in current period net income as compared to periods prior to 1/1/18 in which such adjustments were recognized through other comprehensive income, a component of equity. Page – 20 | Corporate Finance (2) Noninterest expense includes corporate allocations of $11 million in 2Q 2022, $13 million in 1Q 2022, and $9 million in 2Q 2021. (3) Change in fair value of equity securities impacts the Corporate Finance segment. Reflects equity fair value adjustments related to ASU 2016-01 which requires change in the fair value of equity securities to be recognized in current period net income as compared to periods prior to 1/1/18 in which such adjustments were recognized through other comprehensive income, a component of equity. Page – 21 | Mortgage Finance (1) Noninterest expense includes corporate allocations of $30 million in 2Q 2022, $27 million in 1Q 2022, and $21 million in 2Q 2021. (2) 1st lien only. Updated home values derived using a combination of appraisals, Broker price opinion (BPOs), Automated Valuation Models (AVMs) and Metropolitan Statistical Area (MSA) level house price indices. Page – 24 | Results by Segment (2) Change in fair value of equity securities impacts the Insurance, Corporate Finance and Corp/Other segments. Reflects equity fair value adjustments related to ASU 2016-01 which requires change in the fair value of equity securities to be recognized in current period net income as compared to periods prior to 1/1/18 in which such adjustments were recognized through other comprehensive income, a component of equity. (3) Repositioning and other which are primarily related to the extinguishment of high-cost legacy debt, strategic activities and significant other one-time items, as applicable for respective periods or businesses. Page – 26 | Corporate and Other (2) Repositioning and other which are primarily related to the extinguishment of high-cost legacy debt, strategic activities and significant other one-time items, as applicable for respective periods or businesses. (3) Change in fair value of equity securities impacts the Corporate and Other segment. Reflects equity fair value adjustments related to ASU 2016-01 which requires change in the fair value of equity securities to be recognized in current period net income as compared to periods prior to 1/1/18 in which such adjustments were recognized through other comprehensive income, a component of equity. (4) HFI legacy mortgage portfolio and HFI Ally Lending portfolio. (5) Intercompany loan related to activity between Insurance and Corporate for liquidity purposes from the wind down of the Demand Notes program. Includes loans held- for-sale. 33
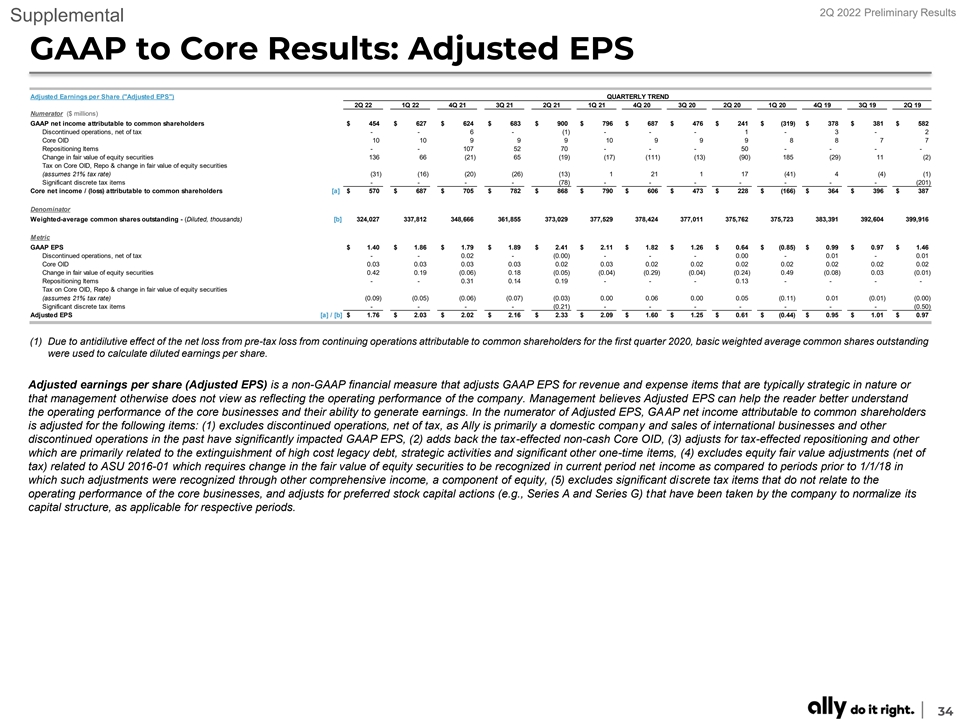
2Q 2022 Preliminary Results Supplemental GAAP to Core Results: Adjusted EPS Adjusted Earnings per Share ( Adjusted EPS ) QUARTERLY TREND 2Q 22 1Q 22 4Q 21 3Q 21 2Q 21 1Q 21 4Q 20 3Q 20 2Q 20 1Q 20 4Q 19 3Q 19 2Q 19 Numerator ($ millions) GAAP net income attributable to common shareholders $ 454 $ 627 $ 624 $ 683 $ 900 $ 796 $ 687 $ 476 $ 241 $ (319) $ 378 $ 381 $ 582 Discontinued operations, net of tax - - 6 - (1) - - - 1 - 3 - 2 Core OID 10 10 9 9 9 10 9 9 9 8 8 7 7 Repositioning Items - - 107 52 70 - - - 50 - - - - Change in fair value of equity securities 136 66 ( 21) 65 (19) ( 17) (111) (13) ( 90) 185 (29) 11 (2) Tax on Core OID, Repo & change in fair value of equity securities (assumes 21% tax rate) (31) (16) ( 20) ( 26) (13) 1 21 1 17 ( 41) 4 (4) (1) Significant discrete tax items - - - - ( 78) - - - - - - - (201) Core net income / (loss) attributable to common shareholders [a] $ 570 $ 687 $ 705 $ 782 $ 868 $ 790 $ 606 $ 473 $ 228 $ (166) $ 364 $ 396 $ 387 Denominator Weighted-average common shares outstanding - (Diluted, thousands) [b] 3 24,027 337,812 348,666 361,855 373,029 377,529 3 78,424 377,011 375,762 3 75,723 383,391 3 92,604 399,916 Metric GAAP EPS $ 1.40 $ 1.86 $ 1.79 $ 1.89 $ 2.41 $ 2.11 $ 1.82 $ 1.26 $ 0.64 $ (0.85) $ 0.99 $ 0.97 $ 1.46 Discontinued operations, net of tax - - 0.02 - (0.00) - - - 0.00 - 0.01 - 0.01 Core OID 0.03 0.03 0.03 0.03 0.02 0.03 0.02 0.02 0.02 0.02 0.02 0.02 0.02 Change in fair value of equity securities 0.42 0.19 (0.06) 0.18 (0.05) (0.04) (0.29) (0.04) (0.24) 0.49 (0.08) 0.03 (0.01) Repositioning Items - - 0.31 0.14 0.19 - - - 0.13 - - - - Tax on Core OID, Repo & change in fair value of equity securities (assumes 21% tax rate) (0.09) (0.05) (0.06) (0.07) (0.03) 0.00 0.06 0.00 0.05 (0.11) 0.01 (0.01) (0.00) Significant discrete tax items - - - - (0.21) - - - - - - - (0.50) Adjusted EPS [a] / [b] $ 1.76 $ 2.03 $ 2.02 $ 2.16 $ 2.33 $ 2.09 $ 1.60 $ 1.25 $ 0.61 $ (0.44) $ 0.95 $ 1.01 $ 0.97 (1) Due to antidilutive effect of the net loss from pre-tax loss from continuing operations attributable to common shareholders for the first quarter 2020, basic weighted average common shares outstanding were used to calculate diluted earnings per share. Adjusted earnings per share (Adjusted EPS) is a non-GAAP financial measure that adjusts GAAP EPS for revenue and expense items that are typically strategic in nature or that management otherwise does not view as reflecting the operating performance of the company. Management believes Adjusted EPS can help the reader better understand the operating performance of the core businesses and their ability to generate earnings. In the numerator of Adjusted EPS, GAAP net income attributable to common shareholders is adjusted for the following items: (1) excludes discontinued operations, net of tax, as Ally is primarily a domestic company and sales of international businesses and other discontinued operations in the past have significantly impacted GAAP EPS, (2) adds back the tax-effected non-cash Core OID, (3) adjusts for tax-effected repositioning and other which are primarily related to the extinguishment of high cost legacy debt, strategic activities and significant other one-time items, (4) excludes equity fair value adjustments (net of tax) related to ASU 2016-01 which requires change in the fair value of equity securities to be recognized in current period net income as compared to periods prior to 1/1/18 in which such adjustments were recognized through other comprehensive income, a component of equity, (5) excludes significant discrete tax items that do not relate to the operating performance of the core businesses, and adjusts for preferred stock capital actions (e.g., Series A and Series G) that have been taken by the company to normalize its capital structure, as applicable for respective periods. 34

2Q 2022 Preliminary Results Supplemental GAAP to Core Results: Adjusted TBVPS Adjusted Tangible Book Value per Share ( Adjusted TBVPS ) QUARTERLY TREND 2Q 22 1Q 22 4Q 21 3Q 21 2Q 21 1Q 21 4Q 20 3Q 20 2Q 20 1Q 20 4Q 19 3Q 19 2Q 19 Numerator ($ billions) GAAP shareholder's equity $ 14.0 $ 15.4 $ 17.1 $ 17.3 $ 17.5 $ 14.6 $ 14.7 $ 14.1 $ 13.8 $ 13.5 $ 14.4 $ 14.5 $ 14.3 less: Preferred equity ( 2.3) (2.3) (2.3) (2.3) ( 2.3) - - - - - - - - GAAP common shareholder's equity $ 11.7 $ 13.1 $ 14.7 $ 15.0 $ 15.2 $ 14.6 $ 14.7 $ 14.1 $ 13.8 $ 13.5 $ 14.4 $ 14.5 $ 14.3 Goodwill and identifiable intangibles, net of DTLs ( 0.9) ( 0.9) (0.9) (0.4) ( 0.4) (0.4) (0.4) (0.4) (0.4) ( 0.4) (0.5) (0.3) (0.3) Tangible common equity 10.7 12.2 13.8 14.6 14.8 14.2 14.3 13.7 13.4 13.1 14.0 14.2 14.0 Tax-effected Core OID balance (assumes 21% tax rate) ( 0.7) (0.7) ( 0.7) (0.7) ( 0.8) ( 0.8) ( 0.8) (0.8) (0.8) (0.8) (0.8) ( 0.8) (0.9) Adjusted tangible book value [a] $ 10.1 $ 11.5 $ 13.1 $ 13.9 $ 14.1 $ 13.4 $ 13.5 $ 12.9 $ 12.6 $ 12.2 $ 13.1 $ 13.3 $ 13.2 Denominator Issued shares outstanding (period-end, thousands) [b] 3 12,781 3 27,306 3 37,941 3 49,599 362,639 371,805 374,674 373,857 373,837 373,155 374,332 383,523 3 92,775 Metric GAAP common shareholder's equity per share $ 37.3 $ 40.0 $ 43.6 $ 42.8 $ 41.9 $ 39.3 $ 39.2 $ 37.8 $ 37.0 $ 36.2 $ 38.5 $ 37.7 $ 36.4 Goodwill and identifiable intangibles, net of DTLs per share (2.9) (2.8) ( 2.8) (1.1) ( 1.0) (1.0) (1.0) ( 1.0) ( 1.0) (1.2) ( 1.2) (0.7) ( 0.7) Tangible common equity per share 34.3 37.1 40.8 41.8 40.9 38.3 38.2 36.7 35.9 35.0 37.3 37.0 35.7 Tax-effected Core OID balance (assumes 21% tax rate) per share ( 2.2) (2.1) (2.1) (2.0) (2.1) (2.2) ( 2.2) (2.2) (2.2) (2.2) (2.2) (2.2) ( 2.2) Adjusted tangible book value per share [a] / [b] $ 32.2 $ 35.0 $ 38.7 $ 39.7 $ 38.8 $ 36.2 $ 36.1 $ 34.6 $ 33.7 $ 32.8 $ 35.1 $ 34.7 $ 33.6 Adjusted tangible book value per share (Adjusted TBVPS) is a non-GAAP financial measure that reflects the book value of equity attributable to shareholders even if Core OID balance were accelerated immediately through the financial statements. As a result, management believes Adjusted TBVPS provides the reader with an assessment of value that is more conservative than GAAP common shareholder’s equity per share. Adjusted TBVPS generally adjusts common equity for: (1) goodwill and identifiable intangibles, net of DTLs, (2) tax-effected Core OID balance to reduce tangible common equity in the event the corresponding discounted bonds are redeemed/tendered, and (3) Series G discount which reduces tangible common equity as the company has normalized its capital structure, as applicable for respective periods. Note: In December 2017, tax-effected Core OID balance was adjusted from a statutory U.S. Federal tax rate of 35% to 21% (“rate”) as a result of changes to U.S. tax law. The adjustment conservatively increased the tax-effected Core OID balance and consequently reduced Adjusted TBVPS as any acceleration of the non-cash charge in future periods would flow through the financial statements at a 21% rate versus a previously modeled 35% rate. Calculated Impact to Adjusted TBVPS from CECL Day-1 1Q 20 Numerator ($ billions) Adjusted tangible book value $ 12.2 CECL Day-1 impact to retained earnings, net of tax 1.0 Adjusted tangible book value less CECL Day-1 impact [a] $ 13.3 Denominator Issued shares outstanding (period-end, thousands) [b] 373,155 Metric Adjusted TBVPS $ 32.8 CECL Day-1 impact to retained earnings, net of tax per share 2.7 Adjusted tangible book value, less CECL Day-1 impact per share [a] / [b] $ 35.5 Ally adopted CECL on January 1, 2020. Upon implementation of CECL Ally recognized a reduction to our opening retained earnings balance of approximately $1.0 billion, net of income tax, which reflects a pre-tax increase to the allowance for loan losses of approximately $1.3 billion. This increase is almost exclusively driven by our consumer automotive loan portfolio. 35

2Q 2022 Preliminary Results Supplemental GAAP to Core Results: Core ROTCE Core Return on Tangible Common Equity ( Core ROTCE ) QUARTERLY TREND 2Q 22 1Q 22 4Q 21 3Q 21 2Q 21 1Q 21 4Q 20 3Q 20 2Q 20 1Q 20 4Q 19 3Q 19 2Q 19 Numerator ($ millions) GAAP net income attributable to common shareholders $ 454 $ 627 $ 624 $ 683 $ 900 $ 796 $ 687 $ 476 $ 241 $ (319) $ 378 $ 381 $ 582 Discontinued operations, net of tax - - 6 - (1) - - - 1 - 3 - 2 Core OID 10 10 9 9 9 10 9 9 9 8 8 7 7 Repositioning Items - - 107 52 70 - - - 50 - - - - Change in fair value of equity securities 136 66 ( 21) 65 (19) (17) (111) (13) ( 90) 185 (29) 11 (2) Tax on Core OID, Repo & change in fair value of equity securities (assumes 21% tax rate) ( 31) ( 16) ( 20) ( 26) ( 13) 1 21 1 17 ( 41) 4 (4) (1) Significant discrete tax items & other - - - - (78) - - - - - - - (201) Core net income / (loss) attributable to common shareholders [a] $ 570 $ 687 $ 705 $ 782 $ 868 $ 790 $ 606 $ 473 $ 228 $ (166) $ 364 $ 396 $ 387 Denominator (Average, $ billions) GAAP shareholder's equity $ 14.7 $ 16.2 $ 17.2 $ 17.4 $ 16.1 $ 14.7 $ 14.4 $ 14.0 $ 13.7 $ 14.0 $ 14.4 $ 14.4 $ 14.0 less: Preferred equity ( 2.3) ( 2.3) (2.3) (2.3) (1.2) - - - - - - - - GAAP common shareholder's equity $ 12.4 $ 13.9 $ 14.8 $ 15.1 $ 14.9 $ 14.7 $ 14.4 $ 14.0 $ 13.7 $ 14.0 $ 14.4 $ 14.4 $ 14.0 Goodwill & identifiable intangibles, net of deferred tax liabilities ( DTLs ) ( 0.9) (0.9) (0.7) ( 0.4) (0.4) (0.4) (0.4) ( 0.4) (0.4) ( 0.4) (0.4) (0.3) (0.3) Tangible common equity $ 11.4 $ 13.0 $ 14.2 $ 14.7 $ 14.5 $ 14.3 $ 14.0 $ 13.6 $ 13.3 $ 13.5 $ 14.1 $ 14.1 $ 13.7 Core OID balance ( 0.9) ( 0.9) ( 0.9) (0.9) ( 1.0) ( 1.0) (1.0) ( 1.0) ( 1.1) ( 1.1) (1.1) (1.1) (1.1) Net deferred tax asset ( DTA ) (0.8) (0.4) ( 0.6) ( 0.9) ( 0.6) ( 0.1) (0.1) (0.1) ( 0.2) (0.1) (0.0) (0.1) ( 0.1) Normalized common equity [b] $ 9.8 $ 11.7 $ 12.7 $ 12.9 $ 13.0 $ 13.1 $ 12.9 $ 12.4 $ 12.0 $ 12.3 $ 13.0 $ 12.9 $ 12.5 Core Return on Tangible Common Equity [a] / [b] 23.2% 23.6% 22.1% 24.2% 26.7% 24.1% 18.7% 15.2% 7.6% -5.4% 11.2% 12.3% 12.4% Core return on tangible common equity (Core ROTCE) is a non-GAAP financial measure that management believes is helpful for readers to better understand the ongoing ability of the company to generate returns on its equity base that supports core operations. For purposes of this calculation, tangible common equity is adjusted for Core OID balance and net DTA. Ally’s Core net income attributable to common shareholders for purposes of calculating Core ROTCE is based on the actual effective tax rate for the period adjusted for significant discrete tax items including tax reserve releases, which aligns with the methodology used in calculating adjusted earnings per share. (1) In the numerator of Core ROTCE, GAAP net income attributable to common shareholders is adjusted for discontinued operations net of tax, tax-effected Core OID, tax- effected repositioning and other which are primarily related to the extinguishment of high cost legacy debt, strategic activities and significant other one-time items, fair value adjustments (net of tax) related to ASU 2016-01 which requires change in the fair value of equity securities to be recognized in current period net income as compared to periods prior to 1/1/18 in which such adjustments were recognized through other comprehensive income, a component of equity, significant discrete tax items, and preferred stock capital actions, as applicable for respective periods. (2) In the denominator, GAAP shareholder’s equity is adjusted for goodwill and identifiable intangibles net of DTL, Core OID balance, and net DTA. 36

2Q 2022 Preliminary Results Supplemental GAAP to Core Results: Adjusted Efficiency Ratio Adjusted Efficiency Ratio QUARTERLY TREND 2Q 22 1Q 22 4Q 21 3Q 21 2Q 21 Numerator ($ millions) GAAP noninterest expense $ 1,138 $ 1,122 $ 1,090 $ 1,002 $ 1,075 Rep and warrant expense - - - - - Insurance expense (300) (274) (263) (273) (272) Repositioning items - - - - - Adjusted noninterest expense for efficiency ratio [a] $ 838 $ 848 $ 827 $ 729 $ 803 Denominator ($ millions) Total net revenue $ 2,076 $ 2,135 $ 2,199 $ 1,985 $ 2,085 Core OID 10 10 9 9 9 Repositioning items - - 9 52 70 Insurance revenue (178) (287) (354) (297) (359) Adjusted net revenue for the efficiency ratio [b] $ 1,908 $ 1,858 $ 1,864 $ 1,749 $ 1,805 Adjusted Efficiency Ratio [a] / [b] 43.9% 45.6% 44.4% 41.7% 44.5% Adjusted efficiency ratio is a non-GAAP financial measure that management believes is helpful to readers in comparing the efficiency of its core banking and lending businesses with those of its peers. (1) In the numerator of Adjusted efficiency ratio, total noninterest expense is adjusted for Rep and warrant expense, Insurance segment expense, and repositioning and other which are primarily related to the extinguishment of high-cost legacy debt, strategic activities and significant other one-time items, as applicable for respective periods. (2) In the denominator, total net revenue is adjusted for Core OID and Insurance segment revenue. See page 19 for the combined ratio for the Insurance segment which management uses as a primary measure of underwriting profitability for the Insurance segment. 37

2Q 2022 Preliminary Results Supplemental Non-GAAP Reconciliation: Core Income ($ millions) 2Q 22 1Q 22 2Q 21 Change in fair Change in fair Change in fair (1) (1) (1) GAAP Core OID value of equity Repositioning Non-GAAP GAAP Core OID value of equity Repositioning Non-GAAP GAAP Core OID value of equity Repositioning Non-GAAP securities securities securities Consolidated Ally Net financing revenue $ 1,764 $ 10 $ - $ - 1,774 $ 1,693 $ 10 $ - $ - 1 ,703 $ 1,547 $ 9 $ - $ - 1 ,556 Total other revenue 312 - 136 - 448 442 - 66 - 508 538 - ( 19) 70 588 Provision for credit losses 304 - - - 304 167 - - - 167 (32) - - - (32) Noninterest expense 1 ,138 - - - 1,138 1,122 - - - 1 ,122 1,075 - - - 1,075 Pre-tax income $ 634 $ 10 $ 136 $ - $ 780 $ 846 $ 10 $ 66 $ - $ 921 $ 1,042 $ 9 $ (19) $ 70 $ 1,102 Corporate / Other Net financing revenue $ 310 $ 10 $ - $ - $ 320 $ 245 $ 10 $ - $ - $ 255 $ 99 $ 9 $ - $ - $ 108 Total other revenue 59 - 0 - 59 66 - 0 - 66 78 - (1) (70) 8 Provision for credit losses 68 - - - 68 57 - - - 57 4 - - - 4 Noninterest expense 211 - - - 211 221 - - - 221 230 - - - 230 Pre-tax income $ 90 $ 10 $ 0 $ - $ 101 $ 33 $ 10 $ 0 $ - $ 43 $ (57) $ 9 $ (1) $ (70) $ (118) Insurance Premiums, service revenue earned and other $ 285 $ - $ - $ - $ 285 $ 284 $ - $ - $ - $ 284 $ 283 $ - $ - $ - $ 283 Losses and loss adjustment expenses 89 - - - 89 58 - - - 58 74 - - - 74 Acquisition and underwriting expenses 211 - - - 211 216 - - - 216 198 - - - 198 Investment income and other (107) - 136 - 29 3 - 61 - 64 76 - (20) - 56 Pre-tax income $ (122) $ - $ 136 $ - $ 14 $ 13 $ - $ 61 $ - $ 74 $ 87 $ - $ (20) $ - $ 67 Corporate Finance Net financing revenue $ 77 $ - $ - $ - $ 77 $ 83 $ - $ - $ - $ 83 $ 77 $ - $ - $ - $ 77 Total other revenue 19 - ( 0) - 19 24 - 4 - 28 33 - 1 - 34 Provision for credit losses 8 - - - 8 6 - - - 6 (13) - - - (13) Noninterest expense 28 - - - 28 37 - - - 37 28 - - - 28 Pre-tax income $ 60 $ - $ (0) $ - $ 60 $ 64 $ - $ 4 $ - $ 68 $ 95 $ - $ 1 $ - $ 96 (1) Non-GAAP line items walk to Core pre-tax income, a non-GAAP financial measure that adjusts pre-tax income. See pages 29 and 30 for definitions. Note: Equity fair value adjustments related to ASU 2016-01 requires change in the fair value of equity securities to be recognized in current period net income as compared to periods prior to 1/1/18 in which such adjustments were recognized through other comprehensive income, a component of equity. 38

2Q 2022 Preliminary Results Supplemental Non-GAAP Reconciliations Net Financing Revenue (ex. Core OID) QUARTERLY TREND ($ millions) 2Q 22 1Q 22 4Q 21 3Q 21 2Q 21 1Q 21 4Q 20 3Q 20 2Q 20 1Q 20 4Q 19 3Q 19 2Q 19 GAAP Net Financing Revenue [x] $ 1,764 $ 1,693 $ 1,654 $ 1,594 $ 1,547 $ 1,372 $ 1,303 $ 1 ,200 $ 1,054 $ 1,146 $ 1 ,156 $ 1,188 $ 1,157 Core OID 10 10 9 9 9 10 9 9 9 8 8 7 7 Net Financing Revenue (ex. Core OID) [a] $ 1,774 $ 1,703 $ 1,663 $ 1,603 $ 1,556 $ 1 ,382 $ 1,312 $ 1,209 $ 1,063 $ 1,154 $ 1 ,164 $ 1 ,195 $ 1,164 Adjusted Other Revenue QUARTERLY TREND ($ millions) 2Q 22 1Q 22 4Q 21 3Q 21 2Q 21 1Q 21 4Q 20 3Q 20 2Q 20 1Q 20 4Q 19 3Q 19 2Q 19 GAAP Other Revenue [y] $ 312 $ 442 $ 545 $ 391 $ 538 $ 565 $ 678 $ 484 $ 555 $ 266 $ 487 $ 413 $ 395 Accelerated OID & repositioning items - - 9 52 70 - - - - - - - - Change in fair value of equity securities 136 66 (21) 65 (19) (17) (111) (13) (90) 185 (29) 11 (2) Adjusted Other Revenue [b] $ 448 $ 508 $ 533 $ 507 $ 588 $ 548 $ 567 $ 471 $ 465 $ 451 $ 458 $ 424 $ 393 Adjusted NIE (ex. Repositioning) QUARTERLY TREND ($ millions) 2Q 22 1Q 22 4Q 21 3Q 21 2Q 21 1Q 21 4Q 20 3Q 20 2Q 20 1Q 20 4Q 19 3Q 19 2Q 19 GAAP Noninterest Expense [z] $ 1,138 $ 1,122 $ 1,090 $ 1,002 $ 1,075 $ 943 $ 1 ,023 $ 905 $ 985 $ 920 $ 880 $ 838 $ 881 Repositioning - - - - - - - - 50 - - - - Adjusted NIE (ex. Repositioning) [c] $ 1,138 $ 1,122 $ 1,090 $ 1,002 $ 1,075 $ 943 $ 1,023 $ 905 $ 935 $ 920 $ 880 $ 838 $ 881 Core Pre-Provision Net Revenue QUARTERLY TREND ($ millions) 2Q 22 1Q 22 4Q 21 3Q 21 2Q 21 1Q 21 4Q 20 3Q 20 2Q 20 1Q 20 4Q 19 3Q 19 2Q 19 Pre-Provision Net Revenue [x]+[y]-[z] 938 1 ,013 1 ,109 983 1,010 994 958 779 624 492 763 763 671 Core Pre-Provision Net Revenue [a]+[b]-[c] $ 1,084 $ 1,088 $ 1,107 $ 1,108 $ 1,070 $ 987 $ 856 $ 775 $ 593 $ 686 $ 742 $ 782 $ 676 Adjusted Total Net Revenue ($ millions) Adjusted Total Net Revenue [a]+[b] $ 2,222 $ 2,210 $ 2,197 $ 2,110 $ 2,145 $ 1,930 $ 1,879 $ 1,680 $ 1,528 $ 1,606 $ 1 ,622 $ 1 ,620 $ 1 ,557 Original issue discount amortization expense QUARTERLY TREND ($ millions) 2Q 22 1Q 22 4Q 21 3Q 21 2Q 21 1Q 21 4Q 20 3Q 20 2Q 20 1Q 20 4Q 19 3Q 19 2Q 19 (1) Core original issue discount (Core OID) amortization expense $ 10 $ 10 $ 9 $ 9 $ 9 $ 10 $ 9 $ 9 $ 9 $ 8 $ 8 $ 7 $ 7 Other OID 2 3 3 3 3 3 3 3 4 3 3 3 3 GAAP original issue discount amortization expense $ 13 $ 13 $ 12 $ 12 $ 12 $ 12 $ 13 $ 12 $ 12 $ 11 $ 11 $ 11 $ 10 Outstanding original issue discount balance QUARTERLY TREND ($ millions) 2Q 22 1Q 22 4Q 21 3Q 21 2Q 21 1Q 21 4Q 20 3Q 20 2Q 20 1Q 20 4Q 19 3Q 19 2Q 19 Core outstanding original issue discount balance (Core OID balance) $ (863) $ ( 873) $ ( 883) $ ( 900) $ ( 952) $ (1,018) $ (1,027) $ (1,037) $ (1,046) $ (1,055) $ (1,063) $ (1,071) $ (1,078) Other outstanding OID balance (39) (37) (40) (29) (32) (34) (37) (48) (46) (34) (37) (40) (44) GAAP outstanding original issue discount balance $ ( 901) $ ( 911) $ ( 923) $ ( 929) $ ( 983) $ (1,052) $ (1,064) $ (1,084) $ (1,092) $ (1,089) $ (1,100) $ (1,111) $ (1,122) Note: Equity fair value adjustments related to ASU 2016-01 requires change in the fair value of equity securities to be recognized in current period net income as compared to periods prior to 1/1/18 in which such adjustments were recognized through other comprehensive income, a component of equity. Core pre-provision net revenue (Core PPNR) is a non-GAAP financial measure calculated by adjusting Core pre-tax income to add back provision for credit losses. Management believes that Core PPNR is a helpful financial metric because it enables the reader to assess the core business' ability to generate earnings to cover credit losses. ‘Repositioning’ is primarily related to the extinguishment of high-cost legacy debt, strategic activities, and significant other one-time items. 39
Exhibit 99.3

SECOND QUARTER 2022
FINANCIAL SUPPLEMENT
| ALLY FINANCIAL INC. FORWARD-LOOKING STATEMENTS AND ADDITIONAL INFORMATION
|

|
This document and related communications should be read in conjunction with the financial statements, notes, and other information contained in our Annual Reports on Form 10-K, Quarterly Reports on Form 10-Q, and Current Reports on Form 8-K. This information is preliminary and based on company and third-party data available at the time of the presentation or related communication.
This document and related communications contain forward-looking statements within the meaning of the Private Securities Litigation Reform Act of 1995. These statements can be identified by the fact that they do not relate strictly to historical or current facts—such as statements about the outlook for financial and operating metrics, and future capital allocation and actions. Forward-looking statements often use words such as “believe,” “expect,” “anticipate,” “intend,” “pursue,” “seek,” “continue,” “estimate,” “project,” “outlook,” “forecast,” “potential,” “target,” “objective,” “trend,” “plan,” “goal,” “initiative,” “priorities,” or other words of comparable meaning or future-tense or conditional verbs such as “may,” “will,” “should,” “would,” or “could.” Forward-looking statements convey our expectations, intentions, or forecasts about future events, circumstances, or results. All forward-looking statements, by their nature, are subject to assumptions, risks, and uncertainties, which may change over time and many of which are beyond our control. You should not rely on any forward-looking statement as a prediction or guarantee about the future. Actual future objectives, strategies, plans, prospects, performance, conditions, or results may differ materially from those set forth in any forward-looking statement. Some of the factors that may cause actual results or other future events or circumstances to differ from those in forward-looking statements are described in our Annual Report on Form 10-K for the year ended December 31, 2021, our subsequent Quarterly Reports on Form 10-Q or Current Reports on Form 8-K, or other applicable documents that are filed or furnished with the U.S. Securities and Exchange Commission (collectively, our “SEC filings”). Any forward-looking statement made by us or on our behalf speaks only as of the date that it was made. We do not undertake to update any forward-looking statement to reflect the impact of events, circumstances, or results that arise after the date that the statement was made, except as required by applicable securities laws. You, however, should consult further disclosures (including disclosures of a forward-looking nature) that we may make in any subsequent SEC filings.
This document and related communications contain specifically identified non-GAAP financial measures, which supplement the results that are reported according to U.S. generally accepted accounting principles (“GAAP”). These non-GAAP financial measures may be useful to investors but should not be viewed in isolation from, or as a substitute for, GAAP results. Differences between non-GAAP financial measures and comparable GAAP financial measures are reconciled in the presentation.
Unless the context otherwise requires, the following definitions apply. The term “loans” means the following consumer and commercial products associated with our direct and indirect financing activities: loans, retail installment sales contracts, lines of credit, and other financing products excluding operating leases. The term “operating leases” means consumer- and commercial-vehicle lease agreements where Ally is the lessor and the lessee is generally not obligated to acquire ownership of the vehicle at lease-end or compensate Ally for the vehicle’s residual value. The terms “lend,” “finance,” and “originate” mean our direct extension or origination of loans, our purchase or acquisition of loans, or our purchase of operating leases, as applicable. The term “consumer” means all consumer products associated with our loan and operating-lease activities and all commercial retail installment sales contracts. The term “commercial” means all commercial products associated with our loan activities, other than commercial retail installment sales contracts. The term “partnerships” means business arrangements rather than partnerships as defined by law.
| 2Q 2022 Preliminary Results | 2 |
| ALLY FINANCIAL INC. TABLE OF CONTENTS
|
|
| Page(s) | ||||
| Consolidated Results | ||||
| Consolidated Financial Highlights | 4 | |||
| Consolidated Income Statement | 5 | |||
| Consolidated Period-End Balance Sheet | 6 | |||
| Consolidated Average Balance Sheet | 7 | |||
| Segment Detail | ||||
| Segment Highlights | 8 | |||
| Automotive Finance | 9-10 | |||
| Insurance | 11 | |||
| Mortgage Finance | 12 | |||
| Corporate Finance | 13 | |||
| Corporate and Other | 14 | |||
| Credit Related Information | 15-16 | |||
| Supplemental Detail | ||||
| Capital | 17 | |||
| Liquidity and Deposits | 18 | |||
| Net Interest Margin | 19 | |||
| Ally Bank Consumer Mortgage HFI Portfolios | 20 | |||
| Earnings Per Share Related Information | 21 | |||
| Adjusted Tangible Book Per Share Related Information | 22 | |||
| Core ROTCE Related Information | 23 | |||
| Adjusted Efficiency Ratio Related Information | 24 | |||
| 2Q 2022 Preliminary Results | 3 |
| ALLY FINANCIAL INC. CONSOLIDATED FINANCIAL HIGHLIGHTS
|
|
| ($ in millions, shares in thousands) | QUARTERLY TRENDS | CHANGE VS. | ||||||||||||||||||||||||||
| Selected Income Statement Data |
2Q 22 | 1Q 22 | 4Q 21 | 3Q 21 | 2Q 21 | 1Q 22 | 2Q 21 | |||||||||||||||||||||
| Net financing revenue (excluding Core |
$ | 1,774 | $ | 1,703 | $ | 1,663 | $ | 1,603 | $ | 1,556 | $ | 71 | $ | 218 | ||||||||||||||
| Core OID |
(10) | (10) | (9) | (9) | (9) | — | (1) | |||||||||||||||||||||
| Net financing revenue (as reported) |
1,764 | 1,693 | 1,654 | 1,594 | 1,547 | 71 | 217 | |||||||||||||||||||||
| Other revenue (adjusted) (1) |
448 | 508 | 533 | 507 | 588 | (59) | (140) | |||||||||||||||||||||
| Change in fair value of equity securities (2) |
(136) | (66) | 21 | (65) | 19 | (71) | (156) | |||||||||||||||||||||
| Repositioning (2) |
— | — | (9) | (52) | (70) | — | 70 | |||||||||||||||||||||
| Other revenue (as reported) |
312 | 442 | 545 | 391 | 538 | (130) | (226) | |||||||||||||||||||||
| Provision for loan losses |
304 | 167 | 210 | 76 | (32) | 137 | 336 | |||||||||||||||||||||
| Total noninterest expense (3) |
1,138 | 1,122 | 1,090 | 1,002 | 1,075 | 16 | 63 | |||||||||||||||||||||
|
|
|
|
|
|
|
|
|
|
|
|
|
|
|
|||||||||||||||
| Pre-tax income from continuing operations |
634 | 846 | 899 | 907 | 1,042 | (212) | (408) | |||||||||||||||||||||
| Income tax expense |
152 | 191 | 241 | 195 | 143 | (39) | 9 | |||||||||||||||||||||
| (Loss) income from discontinued operations, net of tax |
— | — | (6) | — | 1 | — | (1) | |||||||||||||||||||||
|
|
|
|
|
|
|
|
|
|
|
|
|
|
|
|||||||||||||||
| Net Income |
482 | 655 | 652 | 712 | 900 | (173) | (418) | |||||||||||||||||||||
| Preferred Dividends |
28 | 28 | 28 | 29 | — | — | 28 | |||||||||||||||||||||
|
|
|
|
|
|
|
|
|
|
|
|
|
|
|
|||||||||||||||
| Net income attributable to common shareholders |
$ | 454 | $ | 627 | $ | 624 | $ | 683 | $ | 900 | $ | (173) | $ | (446) | ||||||||||||||
|
|
|
|
|
|
|
|
|
|
|
|
|
|
|
|||||||||||||||
| Core Pre-Provision Net Revenue (4) |
$ | 1,084 | $ | 1,088 | $ | 1,107 | $ | 1,108 | $ | 1,070 | $ | (4) | $ | 15 | ||||||||||||||
| Selected Balance Sheet Data (Period-End) |
||||||||||||||||||||||||||||
| Total assets |
$ | 185,703 | $ | 184,297 | $ | 182,350 | $ | 179,184 | $ | 180,470 | $ | 1,406 | $ | 5,233 | ||||||||||||||
| Consumer loans |
103,683 | 99,869 | 98,226 | 95,052 | 90,649 | 3,814 | 13,034 | |||||||||||||||||||||
| Commercial loans |
24,774 | 25,496 | 24,042 | 19,419 | 21,568 | (722) | 3,206 | |||||||||||||||||||||
| Allowance for loan losses |
(3,450) | (3,301) | (3,267) | (3,148) | (3,126) | (149) | (324) | |||||||||||||||||||||
| Deposits |
140,401 | 142,475 | 141,558 | 139,444 | 139,104 | (2,074) | 1,297 | |||||||||||||||||||||
| Total equity |
13,984 | 15,413 | 17,050 | 17,289 | 17,530 | (1,429) | (3,546) | |||||||||||||||||||||
| Common Share Count |
||||||||||||||||||||||||||||
| Weighted average basic |
322,057 | 335,678 | 345,870 | 359,179 | 370,412 | (13,621) | (48,355) | |||||||||||||||||||||
| Weighted average diluted |
324,027 | 337,812 | 348,666 | 361,855 | 373,029 | (13,784) | (49,001) | |||||||||||||||||||||
| Issued shares outstanding (period-end) |
312,781 | 327,306 | 337,941 | 349,599 | 362,639 | (14,525) | (49,857) | |||||||||||||||||||||
| Per Common Share Data |
||||||||||||||||||||||||||||
| Earnings per share (basic) |
$ | 1.41 | $ | 1.87 | $ | 1.80 | $ | 1.90 | $ | 2.43 | $ | (0.46) | $ | (1.02) | ||||||||||||||
| Earnings per share (diluted) |
1.40 | 1.86 | 1.79 | 1.89 | 2.41 | (0.45) | (1.01) | |||||||||||||||||||||
| Adjusted earnings per share (1) |
1.76 | 2.03 | 2.02 | 2.16 | 2.33 | (0.27) | (0.57) | |||||||||||||||||||||
| Book value per share |
37.28 | 39.99 | 43.58 | 42.81 | 41.93 | (2.71) | (4.65) | |||||||||||||||||||||
| Tangible book value per share (5) |
34.34 | 37.14 | 40.79 | 41.75 | 40.90 | (2.81) | (6.57) | |||||||||||||||||||||
| Adjusted tangible book value per share (5) |
32.16 | 35.04 | 38.73 | 39.72 | 38.83 | (2.88) | (6.67) | |||||||||||||||||||||
| Select Financial Ratios |
||||||||||||||||||||||||||||
| Net interest margin (as reported) |
4.04% | 3.93% | 3.80% | 3.66% | 3.55% | |||||||||||||||||||||||
| Net interest margin (ex. Core OID) (1) |
4.06% | 3.95% | 3.82% | 3.68% | 3.57% | |||||||||||||||||||||||
| Cost of funds |
1.16% | 1.03% | 1.06% | 1.14% | 1.27% | |||||||||||||||||||||||
| Cost of funds (ex. Core OID) (1) |
1.12% | 0.99% | 1.03% | 1.11% | 1.23% | |||||||||||||||||||||||
| Efficiency Ratio (6) |
54.8% | 52.6% | 49.6% | 50.5% | 51.6% | |||||||||||||||||||||||
| Adjusted efficiency ratio (6) |
43.9% | 45.6% | 44.4% | 41.7% | 44.5% | |||||||||||||||||||||||
| Return on average assets |
1.0% | 1.4% | 1.4% | 1.5% | 2.0% | |||||||||||||||||||||||
| Return on average total equity |
12.4% | 15.5% | 14.5% | 15.7% | 22.4% | |||||||||||||||||||||||
| Return on average tangible common equity |
15.9% | 19.3% | 17.6% | 18.6% | 24.8% | |||||||||||||||||||||||
| Core ROTCE (7) |
23.2% | 23.6% | 22.1% | 24.2% | 26.7% | |||||||||||||||||||||||
| Capital Ratios (8) |
||||||||||||||||||||||||||||
| Common Equity Tier 1 (CET1) capital ratio |
9.6% | 10.0% | 10.3% | 11.2% | 11.3% | |||||||||||||||||||||||
| Tier 1 capital ratio |
11.1% | 11.5% | 11.9% | 12.8% | 13.1% | |||||||||||||||||||||||
| Total capital ratio |
12.7% | 13.1% | 13.5% | 14.6% | 14.8% | |||||||||||||||||||||||
| Tier 1 leverage ratio |
9.1% | 9.4% | 9.7% | 10.0% | 10.0% | |||||||||||||||||||||||
| (1) | Represents a non-GAAP financial measure. For more details refer to page 21. |
| (2) | See page 25 for methodology and detail. |
| (3) | Including but not limited to employee related expenses, commissions and provision for losses and loss adjustment expense related to the insurance business, information technology expenses, servicing expenses, facilities expenses, marketing expenses, and other professional and legal expenses. |
| (4) | Represents a non-GAAP financial measure. See page 25 for methodology and detail. |
| (5) | Represents a non-GAAP financial measure. For more details refer to page 22. |
| (6) | Represents a non-GAAP financial measure. For more details refer to page 24. |
| (7) | Represents a non-GAAP financial measure. For more details refer to page 23. |
| (8) | For more details on the final rules to address the impact of CECL on regulatory capital by allowing BHCs and banks, including Ally, to delay and subsequently phase-in its impact, see page 25. |
| 2Q 2022 Preliminary Results | 4 |
| ALLY FINANCIAL INC. CONSOLIDATED INCOME STATEMENT
|
|
| QUARTERLY TRENDS | CHANGE VS. | |||||||||||||||||||||||||||
| ($ in millions) | 2Q 22 | 1Q 22 | 4Q 21 | 3Q 21 | 2Q 21 | 1Q 22 | 2Q 21 | |||||||||||||||||||||
| Financing revenue and other interest income |
||||||||||||||||||||||||||||
| Interest and fees on finance receivables and loans |
$ | 1,842 | $ | 1,714 | $ | 1,679 | $ | 1,619 | $ | 1,588 | $ | 128 | $ | 254 | ||||||||||||||
| Interest on loans held-for-sale |
4 | 4 | 4 | 5 | 4 | — | — | |||||||||||||||||||||
| Total interest and dividends on investment securities |
195 | 183 | 162 | 150 | 143 | 12 | 52 | |||||||||||||||||||||
| Interest-bearing cash |
5 | 2 | 2 | 5 | 4 | 3 | 1 | |||||||||||||||||||||
| Other earning assets |
8 | 5 | 5 | 5 | 4 | 3 | 4 | |||||||||||||||||||||
| Operating leases |
396 | 403 | 403 | 393 | 384 | (7 | ) | 12 | ||||||||||||||||||||
|
|
|
|
|
|
|
|
|
|
|
|
|
|
|
|||||||||||||||
| Total financing revenue and other interest income |
2,450 | 2,311 | 2,255 | 2,177 | 2,127 | 139 | 323 | |||||||||||||||||||||
| Interest expense |
||||||||||||||||||||||||||||
| Interest on deposits |
263 | 211 | 226 | 245 | 268 | 52 | (5 | ) | ||||||||||||||||||||
| Interest on short-term borrowings |
19 | 5 | — | — | — | 14 | 19 | |||||||||||||||||||||
| Interest on long-term debt |
184 | 185 | 189 | 191 | 230 | (1 | ) | (46 | ) | |||||||||||||||||||
| Interest on other |
1 | — | — | 8 | — | 1 | 1 | |||||||||||||||||||||
|
|
|
|
|
|
|
|
|
|
|
|
|
|
|
|||||||||||||||
| Total interest expense |
467 | 401 | 415 | 444 | 498 | 66 | (31 | ) | ||||||||||||||||||||
| Depreciation expense on operating lease assets |
219 | 217 | 186 | 139 | 82 | 2 | 137 | |||||||||||||||||||||
|
|
|
|
|
|
|
|
|
|
|
|
|
|
|
|||||||||||||||
| Net financing revenue (as reported) |
$ | 1,764 | $ | 1,693 | $ | 1,654 | $ | 1,594 | $ | 1,547 | $ | 71 | $ | 217 | ||||||||||||||
| Other revenue |
||||||||||||||||||||||||||||
| Insurance premiums and service revenue earned |
280 | 280 | 280 | 279 | 278 | — | 2 | |||||||||||||||||||||
| Gain on mortgage and automotive loans, net |
4 | 14 | 14 | 18 | 19 | (10 | ) | (15 | ) | |||||||||||||||||||
| Loss on extinguishment of debt |
— | — | (10 | ) | (52 | ) | (73 | ) | — | 73 | ||||||||||||||||||
| Other (loss) / gain on investments, net |
(124 | ) | 5 | 73 | 24 | 65 | (129 | ) | (189 | ) | ||||||||||||||||||
| Other income, net of losses |
152 | 143 | 188 | 122 | 249 | 9 | (97 | ) | ||||||||||||||||||||
|
|
|
|
|
|
|
|
|
|
|
|
|
|
|
|||||||||||||||
| Total other revenue |
312 | 442 | 545 | 391 | 538 | (130 | ) | (226 | ) | |||||||||||||||||||
| Total net revenue |
2,076 | 2,135 | 2,199 | 1,985 | 2,085 | (59 | ) | (9 | ) | |||||||||||||||||||
| Provision for loan losses |
304 | 167 | 210 | 76 | (32 | ) | 137 | 336 | ||||||||||||||||||||
| Noninterest expense |
||||||||||||||||||||||||||||
| Compensation and benefits expense |
437 | 493 | 413 | 389 | 446 | (56 | ) | (9 | ) | |||||||||||||||||||
| Insurance losses and loss adjustment expenses |
89 | 58 | 55 | 69 | 74 | 31 | 15 | |||||||||||||||||||||
| Other operating expenses |
612 | 571 | 622 | 544 | 555 | 41 | 57 | |||||||||||||||||||||
|
|
|
|
|
|
|
|
|
|
|
|
|
|
|
|||||||||||||||
| Total noninterest expense |
1,138 | 1,122 | 1,090 | 1,002 | 1,075 | 16 | 63 | |||||||||||||||||||||
| Pre-tax income from continuing operations |
$ | 634 | $ | 846 | $ | 899 | $ | 907 | $ | 1,042 | $ | (212 | ) | $ | (408 | ) | ||||||||||||
| Income tax expense from continuing operations |
152 | 191 | 241 | 195 | 143 | (39 | ) | 9 | ||||||||||||||||||||
|
|
|
|
|
|
|
|
|
|
|
|
|
|
|
|||||||||||||||
| Net income from continuing operations |
482 | 655 | 658 | 712 | 899 | (173 | ) | (417 | ) | |||||||||||||||||||
| Income / (Loss) from discontinued operations, net of tax |
— | — | (6 | ) | — | 1 | — | (1 | ) | |||||||||||||||||||
|
|
|
|
|
|
|
|
|
|
|
|
|
|
|
|||||||||||||||
| Net income |
482 | 655 | 652 | 712 | 900 | (173 | ) | (418 | ) | |||||||||||||||||||
| Preferred Dividends |
28 | 28 | 28 | 29 | — | — | 28 | |||||||||||||||||||||
|
|
|
|
|
|
|
|
|
|
|
|
|
|
|
|||||||||||||||
| Net Income Available to Common Shareholders |
$ | 454 | $ | 627 | $ | 624 | $ | 683 | $ | 900 | $ | (173 | ) | $ | (446 | ) | ||||||||||||
|
|
|
|
|
|
|
|
|
|
|
|
|
|
|
|||||||||||||||
| Core Pre-Tax Income Walk |
||||||||||||||||||||||||||||
| Net financing revenue (ex. OID) (1) |
$ | 1,774 | $ | 1,703 | $ | 1,663 | $ | 1,603 | $ | 1,556 | $ | 71 | $ | 218 | ||||||||||||||
| Adjusted other revenue (1) |
448 | 508 | 533 | 507 | 588 | (59 | ) | (140 | ) | |||||||||||||||||||
| Provision for credit losses |
304 | 167 | 113 | 76 | (32 | ) | 137 | 336 | ||||||||||||||||||||
| Adjusted noninterest expense (1) |
1,138 | 1,122 | 1,090 | 1,002 | 1,075 | 16 | 63 | |||||||||||||||||||||
|
|
|
|
|
|
|
|
|
|
|
|
|
|
|
|||||||||||||||
| Core pre-tax income (2) |
$ | 780 | $ | 921 | $ | 994 | $ | 1,032 | $ | 1,102 | $ | (141 | ) | $ | (321 | ) | ||||||||||||
| Core OID |
(10 | ) | (10 | ) | (9 | ) | (9 | ) | (9 | ) | — | (1 | ) | |||||||||||||||
| Change in the fair value of equity securities (3) |
(136 | ) | (66 | ) | 21 | (65 | ) | 19 | (71 | ) | (156 | ) | ||||||||||||||||
| Repositioning (3) |
— | — | (107 | ) | (52 | ) | (70 | ) | — | 70 | ||||||||||||||||||
|
|
|
|
|
|
|
|
|
|
|
|
|
|
|
|||||||||||||||
| Pre-tax income from continuing operations |
$ | 634 | $ | 846 | $ | 899 | $ | 907 | $ | 1,042 | $ | (212 | ) | $ | (408 | ) | ||||||||||||
|
|
|
|
|
|
|
|
|
|
|
|
|
|
|
|||||||||||||||
| (1) | Represents a non-GAAP financial measure. For more details refer to page 21. |
| (2) | Represents a non-GAAP financial measure. See page 25 for methodology and detail. |
| (3) | See page 25 for methodology and detail. |
| 2Q 2022 Preliminary Results | 5 |
| ALLY FINANCIAL INC. CONSOLIDATED PERIOD-END BALANCE SHEET
|
|
| ($ in millions) | QUARTERLY TRENDS | CHANGE VS. | ||||||||||||||||||||||||||
| Assets | 2Q 22 | 1Q 22 | 4Q 21 | 3Q 21 | 2Q 21 | 1Q 22 | 2Q 21 | |||||||||||||||||||||
| Cash and cash equivalents |
||||||||||||||||||||||||||||
| Noninterest-bearing |
$ | 801 | $ | 470 | $ | 502 | $ | 636 | $ | 653 | $ | 331 | $ | 148 | ||||||||||||||
| Interest-bearing |
3,366 | 3,462 | 4,560 | 10,279 | 13,011 | (96 | ) | (9,645 | ) | |||||||||||||||||||
|
|
|
|
|
|
|
|
|
|
|
|
|
|
|
|
|
|
|
|
|
| ||||||||
| Total cash and cash equivalents |
4,167 | 3,932 | 5,062 | 10,915 | 13,664 | 235 | (9,497 | ) | ||||||||||||||||||||
| Investment securities (1) |
33,590 | 35,413 | 35,859 | 35,317 | 36,313 | (1,823 | ) | (2,723 | ) | |||||||||||||||||||
| Loans held-for-sale, net |
798 | 471 | 549 | 456 | 409 | 327 | 389 | |||||||||||||||||||||
| Finance receivables and loans, net |
128,457 | 125,365 | 122,268 | 114,471 | 112,217 | 3,092 | 16,240 | |||||||||||||||||||||
| Allowance for loan losses |
(3,450 | ) | (3,301 | ) | (3,267 | ) | (3,148 | ) | (3,126 | ) | (149 | ) | (324 | ) | ||||||||||||||
|
|
|
|
|
|
|
|
|
|
|
|
|
|
|
|
|
|
|
|
|
| ||||||||
| Total finance receivables and loans, net |
125,007 | 122,064 | 119,001 | 111,323 | 109,091 | 2,943 | 15,916 | |||||||||||||||||||||
| Investment in operating leases, net |
10,516 | 10,730 | 10,862 | 10,969 | 10,715 | (214 | ) | (199 | ) | |||||||||||||||||||
| Premiums receivables and other insurance assets |
2,743 | 2,730 | 2,724 | 2,752 | 2,773 | 13 | (30 | ) | ||||||||||||||||||||
| Other assets |
8,882 | 8,957 | 8,293 | 7,452 | 7,505 | (75 | ) | 1,377 | ||||||||||||||||||||
|
|
|
|
|
|
|
|
|
|
|
|
|
|
|
|
|
|
|
|
|
| ||||||||
| Total assets |
$ | 185,703 | $ | 184,297 | $ | 182,350 | $ | 179,184 | $ | 180,470 | $ | 1,406 | $ | 5,233 | ||||||||||||||
|
|
|
|
|
|
|
|
|
|
|
|
|
|
|
|
|
|
|
|
|
| ||||||||
| Liabilities |
||||||||||||||||||||||||||||
| Deposit liabilities |
||||||||||||||||||||||||||||
| Noninterest-bearing |
$ | 185 | $ | 175 | $ | 150 | $ | 167 | $ | 149 | $ | 10 | $ | 36 | ||||||||||||||
| Interest-bearing |
140,216 | 142,300 | 141,408 | 139,277 | 138,955 | (2,084 | ) | 1,261 | ||||||||||||||||||||
|
|
|
|
|
|
|
|
|
|
|
|
|
|
|
|
|
|
|
|
|
| ||||||||
| Total deposit liabilities |
140,401 | 142,475 | 141,558 | 139,444 | 139,104 | (2,074 | ) | 1,297 | ||||||||||||||||||||
| Short-term borrowings |
7,775 | 3,950 | — | — | — | 3,825 | 7,775 | |||||||||||||||||||||
| Long-term debt |
16,984 | 15,885 | 17,029 | 14,946 | 16,896 | 1,099 | 88 | |||||||||||||||||||||
| Interest payable |
270 | 302 | 210 | 422 | 365 | (32 | ) | (95 | ) | |||||||||||||||||||
| Unearned insurance premiums and service revenue |
3,490 | 3,500 | 3,514 | 3,537 | 3,536 | (10 | ) | (46 | ) | |||||||||||||||||||
| Accrued expense and other liabilities |
2,799 | 2,772 | 2,989 | 3,546 | 3,039 | 27 | (240 | ) | ||||||||||||||||||||
|
|
|
|
|
|
|
|
|
|
|
|
|
|
|
|
|
|
|
|
|
| ||||||||
| Total liabilities |
$ | 171,719 | $ | 168,884 | $ | 165,300 | $ | 161,895 | $ | 162,940 | $ | 2,835 | $ | 8,779 | ||||||||||||||
| Equity |
||||||||||||||||||||||||||||
| Common stock and paid-in capital (2) |
$ | 15,390 | $ | 15,956 | $ | 16,483 | $ | 17,050 | $ | 17,716 | $ | (566 | ) | $ | (2,326 | ) | ||||||||||||
| Preferred stock |
2,324 | 2,324 | 2,324 | 2,324 | 2,324 | — | — | |||||||||||||||||||||
| Accumulated deficit |
(721 | ) | (1,076 | ) | (1,599 | ) | (2,136 | ) | (2,726 | ) | 355 | 2,005 | ||||||||||||||||
| Accumulated other comprehensive income / (loss) |
(3,009 | ) | (1,791 | ) | (158 | ) | 51 | 216 | (1,218 | ) | (3,225 | ) | ||||||||||||||||
|
|
|
|
|
|
|
|
|
|
|
|
|
|
|
|
|
|
|
|
|
| ||||||||
| Total equity |
13,984 | 15,413 | 17,050 | 17,289 | 17,530 | (1,429 | ) | (3,546 | ) | |||||||||||||||||||
|
|
|
|
|
|
|
|
|
|
|
|
|
|
|
|
|
|
|
|
|
| ||||||||
| Total liabilities and equity |
$ | 185,703 | $ | 184,297 | $ | 182,350 | $ | 179,184 | $ | 180,470 | $ | 1,406 | $ | 5,233 | ||||||||||||||
|
|
|
|
|
|
|
|
|
|
|
|
|
|
|
|
|
|
|
|
|
| ||||||||
| (1) | Includes Held-to-maturity securities. |
| (2) | Includes Treasury stock. |
| 2Q 2022 Preliminary Results | 6 |
| ALLY FINANCIAL INC. CONSOLIDATED AVERAGE BALANCE SHEET (1)
|
|
| ($ in millions) | QUARTERLY TRENDS | CHANGE VS. | ||||||||||||||||||||||||||
| Assets | 2Q 22 | 1Q 22 | 4Q 21 | 3Q 21 | 2Q 21 | 1Q 22 | 2Q 21 | |||||||||||||||||||||
| Interest-bearing cash and cash equivalents |
$ | 3,761 | $ | 4,027 | $ | 6,532 | $ | 13,055 | $ | 16,564 | $ | (266 | ) | $ | (12,803 | ) | ||||||||||||
| Investment securities and other earning assets |
34,679 | 36,664 | 36,809 | 35,193 | 36,462 | (1,985 | ) | (1,783 | ) | |||||||||||||||||||
| Loans held-for-sale, net |
420 | 570 | 461 | 464 | 454 | (150 | ) | (34 | ) | |||||||||||||||||||
| Total finance receivables and loans, net (2) |
125,628 | 122,772 | 118,135 | 112,907 | 110,961 | 2,856 | 14,667 | |||||||||||||||||||||
| Investment in operating leases, net |
10,615 | 10,878 | 10,951 | 10,919 | 10,355 | (263 | ) | 260 | ||||||||||||||||||||
|
|
|
|
|
|
|
|
|
|
|
|
|
|
|
|
|
|
|
|
|
| ||||||||
| Total interest earning assets |
175,103 | 174,911 | 172,888 | 172,538 | 174,796 | 192 | 307 | |||||||||||||||||||||
| Noninterest-bearing cash and cash equivalents |
343 | 422 | 505 | 526 | 494 | (79 | ) | (151 | ) | |||||||||||||||||||
| Other assets |
10,510 | 9,825 | 9,568 | 9,328 | 8,978 | 685 | 1,532 | |||||||||||||||||||||
| Allowance for loan losses |
(3,339 | ) | (3,279 | ) | (3,168 | ) | (3,152 | ) | (3,172 | ) | (60 | ) | (167 | ) | ||||||||||||||
|
|
|
|
|
|
|
|
|
|
|
|
|
|
|
|
|
|
|
|
|
| ||||||||
| Total assets |
$ | 182,617 | $ | 181,879 | $ | 179,793 | $ | 179,240 | $ | 181,096 | $ | 738 | $ | 1,521 | ||||||||||||||
|
|
|
|
|
|
|
|
|
|
|
|
|
|
|
|
|
|
|
|
|
| ||||||||
| Liabilities |
||||||||||||||||||||||||||||
| Interest-bearing deposit liabilities |
||||||||||||||||||||||||||||
| Retail deposit liabilities |
$ | 132,111 | $ | 135,046 | $ | 132,706 | $ | 130,414 | $ | 128,787 | $ | (2,935 | ) | $ | 3,324 | |||||||||||||
| Other interest-bearing deposit liabilities (3) |
7,522 | 6,340 | 7,172 | 8,670 | 10,446 | 1,182 | (2,924 | ) | ||||||||||||||||||||
|
|
|
|
|
|
|
|
|
|
|
|
|
|
|
|
|
|
|
|
|
| ||||||||
| Total Interest-bearing deposit liabilities |
139,633 | 141,387 | 139,878 | 139,084 | 139,233 | (1,754 | ) | 400 | ||||||||||||||||||||
| Short-term borrowings |
5,695 | 980 | — | — | — | 4,715 | 5,695 | |||||||||||||||||||||
| Long-term debt (4) |
16,231 | 16,410 | 15,493 | 15,487 | 18,411 | (179 | ) | (2,180 | ) | |||||||||||||||||||
|
|
|
|
|
|
|
|
|
|
|
|
|
|
|
|
|
|
|
|
|
| ||||||||
| Total interest-bearing liabilities (4) |
161,559 | 158,777 | 155,371 | 154,571 | 157,644 | 2,782 | 3,915 | |||||||||||||||||||||
| Noninterest-bearing deposit liabilities |
181 | 171 | 165 | 160 | 149 | 10 | 32 | |||||||||||||||||||||
| Other liabilities |
6,408 | 6,772 | 6,731 | 6,852 | 6,802 | (364 | ) | (394 | ) | |||||||||||||||||||
|
|
|
|
|
|
|
|
|
|
|
|
|
|
|
|
|
|
|
|
|
| ||||||||
| Total liabilities |
$ | 168,148 | $ | 165,720 | $ | 162,267 | $ | 161,583 | $ | 164,595 | $ | 2,428 | $ | 3,553 | ||||||||||||||
| Equity |
||||||||||||||||||||||||||||
| Total equity |
$ | 14,469 | $ | 16,159 | $ | 17,526 | $ | 17,657 | $ | 16,501 | $ | (1,690 | ) | $ | (2,032 | ) | ||||||||||||
|
|
|
|
|
|
|
|
|
|
|
|
|
|
|
|
|
|
|
|
|
| ||||||||
| Total liabilities and equity |
$ | 182,617 | $ | 181,879 | $ | 179,793 | $ | 179,240 | $ | 181,096 | $ | 738 | $ | 1,521 | ||||||||||||||
|
|
|
|
|
|
|
|
|
|
|
|
|
|
|
|
|
|
|
|
|
| ||||||||
| (1) | Average balances are calculated using an average daily balance methodology. |
| (2) | Nonperforming finance receivables and loans are included in the average balances net of unearned income, unamortized premiums and discounts, and deferred fees and costs. |
| (3) | Includes brokered and other deposits (inclusive of sweep deposits and other deposits). |
| (4) | Includes average Core OID balance of $868 million in 2Q 2022, $878 million in 1Q 2022, $889 million in 4Q 2021, $905 in Q3 2021, and $989 million in 2Q 2021. |
| 2Q 2022 Preliminary Results | 7 |
| ALLY FINANCIAL INC. SEGMENT HIGHLIGHTS
|
|
| ($ in millions) | ||||||||||||||||||||||||||||
| QUARTERLY TRENDS | CHANGE VS. | |||||||||||||||||||||||||||
| Pre-tax Income / (Loss) | 2Q 22 | 1Q 22 | 4Q 21 | 3Q 21 | 2Q 21 | 1Q 22 | 2Q 21 | |||||||||||||||||||||
| Automotive Finance |
$ | 600 | $ | 725 | $ | 839 | $ | 825 | $ | 917 | $ | (125 | ) | $ | (317 | ) | ||||||||||||
| Insurance |
(122 | ) | 13 | 91 | 24 | 87 | (135 | ) | (209 | ) | ||||||||||||||||||
|
|
|
|
|
|
|
|
|
|
|
|
|
|
|
|
|
|
|
|
|
| ||||||||
| Dealer Financial Services |
478 | 738 | 930 | 849 | 1,004 | (260 | ) | (526 | ) | |||||||||||||||||||
| Corporate Finance |
60 | 64 | 73 | 61 | 95 | (4 | ) | (35 | ) | |||||||||||||||||||
| Mortgage Finance |
6 | 11 | 3 | 6 | — | (5 | ) | 6 | ||||||||||||||||||||
| Corporate and Other (1) |
90 | 33 | (107 | ) | (9 | ) | (57 | ) | 57 | 147 | ||||||||||||||||||
|
|
|
|
|
|
|
|
|
|
|
|
|
|
|
|
|
|
|
|
|
| ||||||||
| Pre-tax income from continuing operations |
$ | 634 | $ | 846 | $ | 899 | $ | 907 | $ | 1,042 | $ | (212 | ) | $ | (408 | ) | ||||||||||||
| Core OID (2) |
10 | 10 | 9 | 9 | 9 | — | 1 | |||||||||||||||||||||
| Change in the fair value of equity securities (3) | 136 | 66 | (21 | ) | 65 | (19 | ) | 71 | 156 | |||||||||||||||||||
| Repositioning (4) |
— | — | 107 | 52 | 70 | — | (70 | ) | ||||||||||||||||||||
|
|
|
|
|
|
|
|
|
|
|
|
|
|
|
|
|
|
|
|
|
| ||||||||
| Core pre-tax income (4) |
$ | 780 | $ | 921 | $ | 994 | $ | 1,032 | $ | 1,102 | $ | (141) | $ | (321 | ) | |||||||||||||
|
|
|
|
|
|
|
|
|
|
|
|
|
|
|
|
|
|
|
|
|
| ||||||||
| (1) | Corporate and Other includes the impact of centralized asset and liability management, corporate overhead allocation activities, the legacy mortgage portfolio, Ally Invest activity, Ally Lending activity and the Credit Card portfolio. |
| (2) | Core OID for all periods shown are applied to the pre-tax income of the Corporate and Other segment. |
| (3) | See page 25 for methodology and detail. |
| (4) | Represents a non-GAAP measure. See page 25 for methodology and detail. |
| 2Q 2022 Preliminary Results | 8 |
| ALLY FINANCIAL INC. AUTOMOTIVE FINANCE - CONDENSED FINANCIAL STATEMENTS
|
|
| ($ in millions) | ||||||||||||||||||||||||||||
| QUARTERLY TRENDS | CHANGE VS. | |||||||||||||||||||||||||||
| Income Statement |
2Q 22 | 1Q 22 | 4Q 21 | 3Q 21 | 2Q 21 | 1Q 22 | 2Q 21 | |||||||||||||||||||||
| Net financing revenue |
||||||||||||||||||||||||||||
| Consumer |
$ | 1,362 | $ | 1,302 | $ | 1,339 | $ | 1,320 | $ | 1,288 | $ | 60 | $ | 74 | ||||||||||||||
| Commercial |
142 | 129 | 116 | 112 | 125 | 13 | 17 | |||||||||||||||||||||
| Operating leases |
396 | 403 | 403 | 393 | 384 | (7 | ) | 12 | ||||||||||||||||||||
|
|
|
|
|
|
|
|
|
|
|
|
|
|
|
|
|
|
|
|
|
| ||||||||
| Total financing revenue and other interest income |
1,900 | 1,834 | 1,858 | 1,825 | 1,797 | 66 | 103 | |||||||||||||||||||||
| Interest expense |
380 | 322 | 331 | 357 | 382 | 58 | (2 | ) | ||||||||||||||||||||
| Depreciation expense on operating lease assets: |
||||||||||||||||||||||||||||
| Depreciation expense on operating lease assets (ex. remarketing) |
269 | 266 | 251 | 226 | 210 | 3 | 59 | |||||||||||||||||||||
| Remarketing gains |
50 | 50 | 65 | 86 | 128 | — | (78 | ) | ||||||||||||||||||||
|
|
|
|
|
|
|
|
|
|
|
|
|
|
|
|
|
|
|
|
|
| ||||||||
| Total depreciation expense on operating lease assets |
219 | 217 | 186 | 139 | 82 | 2 | 137 | |||||||||||||||||||||
|
|
|
|
|
|
|
|
|
|
|
|
|
|
|
|
|
|
|
|
|
| ||||||||
| Net financing revenue |
1,301 | 1,295 | 1,341 | 1,329 | 1,333 | 6 | (32 | ) | ||||||||||||||||||||
| Other revenue |
||||||||||||||||||||||||||||
|
|
|
|
|
|
|
|
|
|
|
|
|
|
|
|
|
|
|
|
|
| ||||||||
| Total other revenue |
72 | 68 | 67 | 61 | 61 | 4 | 11 | |||||||||||||||||||||
|
|
|
|
|
|
|
|
|
|
|
|
|
|
|
|
|
|
|
|
|
| ||||||||
| Total net revenue |
1,373 | 1,363 | 1,408 | 1,390 | 1,394 | 10 | (21 | ) | ||||||||||||||||||||
| Provision for credit losses |
228 | 104 | 45 | 53 | (23 | ) | 124 | 251 | ||||||||||||||||||||
| Noninterest expense |
||||||||||||||||||||||||||||
| Compensation and benefits |
152 | 168 | 146 | 136 | 144 | (16 | ) | 8 | ||||||||||||||||||||
| Other operating expenses |
393 | 366 | 378 | 376 | 356 | 27 | 37 | |||||||||||||||||||||
|
|
|
|
|
|
|
|
|
|
|
|
|
|
|
|
|
|
|
|
|
| ||||||||
| Total noninterest expense |
545 | 534 | 524 | 512 | 500 | 11 | 45 | |||||||||||||||||||||
|
|
|
|
|
|
|
|
|
|
|
|
|
|
|
|
|
|
|
|
|
| ||||||||
| Pre-tax Income |
$ | 600 | $ | 725 | $ | 839 | $ | 825 | $ | 917 | $ | (125 | ) | $ | (317 | ) | ||||||||||||
|
|
|
|
|
|
|
|
|
|
|
|
|
|
|
|
|
|
|
|
|
| ||||||||
| Memo: Net lease revenue |
||||||||||||||||||||||||||||
| Operating lease revenue |
$ | 396 | $ | 403 | $ | 403 | $ | 393 | $ | 384 | $ | (7 | ) | $ | 12 | |||||||||||||
| Depreciation expense on operating lease assets (ex. remarketing) |
269 | 266 | 251 | 226 | 210 | 3 | 59 | |||||||||||||||||||||
| Remarketing gains, net of repo valuation |
50 | 50 | 65 | 86 | 128 | — | (78 | ) | ||||||||||||||||||||
|
|
|
|
|
|
|
|
|
|
|
|
|
|
|
|
|
|
|
|
|
| ||||||||
| Total depreciation expense on operating lease assets |
219 | 217 | 186 | 139 | 82 | 2 | 137 | |||||||||||||||||||||
|
|
|
|
|
|
|
|
|
|
|
|
|
|
|
|
|
|
|
|
|
| ||||||||
| Net lease revenue |
$ | 177 | $ | 186 | $ | 217 | $ | 254 | $ | 302 | $ | (9 | ) | $ | (125 | ) | ||||||||||||
|
|
|
|
|
|
|
|
|
|
|
|
|
|
|
|
|
|
|
|
|
| ||||||||
| Balance Sheet (Period-End) |
||||||||||||||||||||||||||||
| Cash, trading and investment securities |
$ | 23 | $ | 24 | $ | 23 | $ | 23 | $ | 23 | $ | (1 | ) | $ | — | |||||||||||||
| Consumer loans |
82,191 | 79,262 | 78,289 | 77,683 | 75,827 | 2,929 | 6,364 | |||||||||||||||||||||
| Commercial loans |
16,109 | 17,295 | 16,074 | 12,587 | 15,219 | (1,186 | ) | 890 | ||||||||||||||||||||
| Allowance for loan losses |
(2,914 | ) | (2,794 | ) | (2,802 | ) | (2,851 | ) | (2,848 | ) | (120 | ) | (66 | ) | ||||||||||||||
|
|
|
|
|
|
|
|
|
|
|
|
|
|
|
|
|
|
|
|
|
| ||||||||
| Total finance receivables and loans, net |
95,386 | 93,763 | 91,561 | 87,419 | 88,198 | 1,623 | 7,188 | |||||||||||||||||||||
| Investment in operating leases, net |
10,516 | 10,730 | 10,862 | 10,969 | 10,715 | (214 | ) | (199 | ) | |||||||||||||||||||
| Other assets |
1,253 | 1,237 | 1,207 | 1,206 | 1,226 | 16 | 27 | |||||||||||||||||||||
|
|
|
|
|
|
|
|
|
|
|
|
|
|
|
|
|
|
|
|
|
| ||||||||
| Total assets |
$ | 107,178 | $ | 105,754 | $ | 103,653 | $ | 99,617 | $ | 100,162 | $ | 1,424 | $ | 7,016 | ||||||||||||||
|
|
|
|
|
|
|
|
|
|
|
|
|
|
|
|
|
|
|
|
|
| ||||||||
| 2Q 2022 Preliminary Results | 9 |
| ALLY FINANCIAL INC. AUTOMOTIVE FINANCE - KEY STATISTICS
|
|
| QUARTERLY TRENDS | CHANGE VS. | |||||||||||||||||||||||||||
| 2Q 22 | 1Q 22 | 4Q 21 | 3Q 21 | 2Q 21 | 1Q 22 | 2Q 21 | ||||||||||||||||||||||
| U.S. Consumer Originations (1) ($ in billions) |
|
|||||||||||||||||||||||||||
| Retail standard - new vehicle GM |
$ | 1.1 | $ | 0.9 | $ | 0.8 | $ | 0.9 | $ | 1.2 | $ | 0.2 | $ | (0.1 | ) | |||||||||||||
| Retail standard - new vehicle Stellantis |
0.9 | 1.0 | 1.0 | 1.1 | 1.2 | (0.1 | ) | (0.2 | ) | |||||||||||||||||||
| Retail standard - new vehicle Growth |
1.2 | 1.0 | 1.0 | 1.2 | 1.5 | 0.3 | (0.2 | ) | ||||||||||||||||||||
| Used vehicle |
9.1 | 7.6 | 7.0 | 7.8 | 7.3 | 1.5 | 1.8 | |||||||||||||||||||||
| Lease |
0.9 | 1.0 | 0.9 | 1.3 | 1.8 | (0.1 | ) | (0.9 | ) | |||||||||||||||||||
| Retail subvented |
0.0 | 0.1 | 0.1 | 0.1 | 0.0 | (0.1 | ) | 0.0 | ||||||||||||||||||||
|
|
|
|
|
|
|
|
|
|
|
|
|
|
|
|
|
|
|
|
|
| ||||||||
| Total originations |
$ | 13.3 | $ | 11.6 | $ | 10.9 | $ | 12.3 | $ | 12.9 | $ | 1.7 | $ | 0.3 | ||||||||||||||
| U.S. Consumer Originations - FICO Score |
||||||||||||||||||||||||||||
| Super prime (760-999) |
$ | 2.0 | $ | 1.8 | $ | 1.6 | $ | 1.9 | $ | 2.1 | $ | 0.3 | $ | (0.1 | ) | |||||||||||||
| High prime (720-759) |
1.7 | 1.4 | 1.3 | 1.5 | 1.6 | 0.2 | 0.1 | |||||||||||||||||||||
| Prime (660-719) |
4.3 | 3.7 | 3.5 | 4.0 | 4.2 | 0.6 | 0.1 | |||||||||||||||||||||
| Prime/Near (620-659) |
3.0 | 2.8 | 2.6 | 3.0 | 3.1 | 0.2 | (0.1 | ) | ||||||||||||||||||||
| Non-Prime (540-619) |
1.2 | 0.9 | 1.0 | 1.0 | 1.0 | 0.3 | 0.1 | |||||||||||||||||||||
| Sub-Prime (0-539) |
0.2 | 0.1 | 0.1 | 0.1 | 0.1 | 0.1 | 0.1 | |||||||||||||||||||||
| No FICO (Primarily CSG) (2) |
0.9 | 0.9 | 0.7 | 0.7 | 0.7 | (0.1 | ) | 0.1 | ||||||||||||||||||||
|
|
|
|
|
|
|
|
|
|
|
|
|
|
|
|
|
|
|
|
|
| ||||||||
| Total originations |
$ | 13.3 | $ | 11.6 | $ | 10.9 | $ | 12.3 | $ | 12.9 | $ | 1.7 | $ | 0.3 | ||||||||||||||
| U.S. Consumer Retail Originations - Average FICO |
|
|||||||||||||||||||||||||||
| New vehicle |
698 | 697 | 697 | 694 | 691 | 1 | 7 | |||||||||||||||||||||
| Used vehicle |
682 | 682 | 679 | 679 | 678 | (1 | ) | 4 | ||||||||||||||||||||
| Total retail originations |
685 | 686 | 684 | 683 | 682 | (1 | ) | 3 | ||||||||||||||||||||
| U.S. Market |
||||||||||||||||||||||||||||
| New light vehicle sales (SAAR - units in millions) |
13.4 | 14.1 | 12.9 | 13.3 | 16.9 | (0.8 | ) | (3.5 | ) | |||||||||||||||||||
| New light vehicle sales (quarterly - units in millions) |
3.5 | 3.3 | 3.2 | 3.4 | 4.4 | 0.2 | (0.9 | ) | ||||||||||||||||||||
| Dealer Engagement |
||||||||||||||||||||||||||||
| Total Active Dealers (3) |
22,408 | 21,688 | 21,076 | 20,353 | 19,650 | 720 | 2,758 | |||||||||||||||||||||
| Total Application Volume (000s) |
3,296 | 3,169 | 2,933 | 3,258 | 3,529 | 128 | (232 | ) | ||||||||||||||||||||
| Ally U.S. Commercial Outstandings EOP ($ in billions) |
|
|||||||||||||||||||||||||||
| Floorplan outstandings |
$ | 11.0 | $ | 12.4 | $ | 11.1 | $ | 7.6 | $ | 10.0 | $ | (1.4 | ) | $ | 1.0 | |||||||||||||
| Dealer loans and other |
5.1 | 4.9 | 4.9 | 5.0 | 5.2 | 0.2 | (0.1 | ) | ||||||||||||||||||||
|
|
|
|
|
|
|
|
|
|
|
|
|
|
|
|
|
|
|
|
|
| ||||||||
| Total Commercial outstandings |
$ | 16.1 | $ | 17.3 | $ | 16.1 | $ | 12.6 | $ | 15.2 | $ | (1.2 | ) | $ | 0.9 | |||||||||||||
| U.S. Off-Lease Remarketing |
||||||||||||||||||||||||||||
| Off-lease vehicles terminated - on-balance sheet (# in units) |
29,665 | 30,488 | 27,977 | 34,475 | 34,768 | (823 | ) | (5,103 | ) | |||||||||||||||||||
| Average gain per vehicle |
$ | 1,671 | $ | 1,640 | $ | 2,339 | $ | 2,495 | $ | 3,684 | $ | 31 | $ | (2,013 | ) | |||||||||||||
| Total gain ($ in millions) |
$ | 50 | $ | 50 | $ | 65 | $ | 86 | $ | 128 | $ | — | $ | (78 | ) | |||||||||||||
| (1) | Some standard rate loan originations contain manufacturer sponsored cash back rebate incentives. Some lease originations contain rate subvention. While Ally may jointly develop marketing programs for these originations, Ally does not have exclusive rights to such originations under operating agreements with manufacturers. |
| (2) | Commercial Services Group (CSG) are business customers. Average annualized credit losses of 35 - 40 bps on CSG loans from 2016 through 2Q22 |
| (3) | Active Dealers include those who utilize one or more of Ally’s products including consumer and commercial lending, SmartAuction or Commercial Services Group |
| 2Q 2022 Preliminary Results | 10 |
| ALLY FINANCIAL INC. INSURANCE - CONDENSED FINANCIAL STATEMENTS AND KEY STATISTICS
|
|
| ($ in millions) |
||||||||||||||||||||||||||||
| QUARTERLY TRENDS | CHANGE VS. | |||||||||||||||||||||||||||
| Income Statement (GAAP View) |
2Q 22 | 1Q 22 | 4Q 21 | 3Q 21 | 2Q 21 | 1Q 22 | 2Q 21 | |||||||||||||||||||||
| Net financing revenue |
||||||||||||||||||||||||||||
| Total interest and fees on finance receivables and loans(1) |
$ | 2 | $ | 3 | $ | 4 | $ | 3 | $ | 3 | $ | (1 | ) | $ | (1 | ) | ||||||||||||
| Interest and dividends on investment securities |
29 | 26 | 26 | 25 | 26 | 3 | 3 | |||||||||||||||||||||
| Interest bearing cash |
— | — | — | 1 | — | — | — | |||||||||||||||||||||
|
|
|
|
|
|
|
|
|
|
|
|
|
|
|
|
|
|
|
|
|
| ||||||||
| Total financing revenue and other interest revenue |
31 | 29 | 30 | 29 | 29 | 2 | 2 | |||||||||||||||||||||
| Interest expense |
11 | 12 | 15 | 15 | 14 | (1 | ) | (3 | ) | |||||||||||||||||||
|
|
|
|
|
|
|
|
|
|
|
|
|
|
|
|
|
|
|
|
|
| ||||||||
| Net financing revenue |
20 | 17 | 15 | 14 | 15 | 3 | 5 | |||||||||||||||||||||
| Other revenue |
||||||||||||||||||||||||||||
| Insurance premiums and service revenue earned |
280 | 280 | 280 | 279 | 278 | — | 2 | |||||||||||||||||||||
| Other gain / (loss) on investments, net |
(127 | ) | (14 | ) | 56 | 1 | 61 | (113 | ) | (188 | ) | |||||||||||||||||
| Other income, net of losses |
5 | 4 | 3 | 3 | 5 | 1 | — | |||||||||||||||||||||
|
|
|
|
|
|
|
|
|
|
|
|
|
|
|
|
|
|
|
|
|
| ||||||||
| Total other revenue |
158 | 270 | 339 | 283 | 344 | (112 | ) | (186 | ) | |||||||||||||||||||
|
|
|
|
|
|
|
|
|
|
|
|
|
|
|
|
|
|
|
|
|
| ||||||||
| Total net revenue |
178 | 287 | 354 | 297 | 359 | (109 | ) | (181 | ) | |||||||||||||||||||
| Noninterest expense |
||||||||||||||||||||||||||||
| Compensation and benefits expense |
24 | 28 | 23 | 23 | 24 | (4 | ) | — | ||||||||||||||||||||
| Insurance losses and loss adjustment expenses |
89 | 58 | 55 | 69 | 74 | 31 | 15 | |||||||||||||||||||||
| Other operating expenses |
187 | 188 | 185 | 181 | 174 | (1 | ) | 13 | ||||||||||||||||||||
|
|
|
|
|
|
|
|
|
|
|
|
|
|
|
|
|
|
|
|
|
| ||||||||
| Total noninterest expense |
300 | 274 | 263 | 273 | 272 | 26 | 28 | |||||||||||||||||||||
|
|
|
|
|
|
|
|
|
|
|
|
|
|
|
|
|
|
|
|
|
| ||||||||
| Pre-tax (loss) income |
$ | (122 | ) | $ | 13 | $ | 91 | $ | 24 | $ | 87 | $ | (135 | ) | $ | (209 | ) | |||||||||||
|
|
|
|
|
|
|
|
|
|
|
|
|
|
|
|
|
|
|
|
|
| ||||||||
| Memo: Income Statement (Managerial View) |
||||||||||||||||||||||||||||
| Insurance premiums and other income |
||||||||||||||||||||||||||||
| Insurance premiums and service revenue earned |
$ | 280 | $ | 280 | $ | 280 | $ | 279 | $ | 278 | $ | — | $ | 2 | ||||||||||||||
| Investment income (adjusted) (2) |
29 | 64 | 47 | 80 | 56 | (34 | ) | (27 | ) | |||||||||||||||||||
| Other income |
5 | 4 | 3 | 3 | 5 | 1 | — | |||||||||||||||||||||
|
|
|
|
|
|
|
|
|
|
|
|
|
|
|
|
|
|
|
|
|
| ||||||||
| Total insurance premiums and other income |
314 | 348 | 330 | 362 | 339 | (33 | ) | (25 | ) | |||||||||||||||||||
| Expense |
||||||||||||||||||||||||||||
| Insurance losses and loss adjustment expenses |
89 | 58 | 55 | 69 | 74 | 31 | 15 | |||||||||||||||||||||
| Acquisition and underwriting expenses |
||||||||||||||||||||||||||||
| Compensation and benefit expense |
24 | 28 | 23 | 23 | 24 | (4 | ) | — | ||||||||||||||||||||
| Insurance commission expense |
151 | 149 | 147 | 142 | 138 | 2 | 13 | |||||||||||||||||||||
| Other expense |
36 | 39 | 38 | 39 | 36 | (3 | ) | — | ||||||||||||||||||||
|
|
|
|
|
|
|
|
|
|
|
|
|
|
|
|
|
|
|
|
|
| ||||||||
| Total acquistion and underwriting expense |
211 | 216 | 208 | 204 | 198 | (5 | ) | 13 | ||||||||||||||||||||
|
|
|
|
|
|
|
|
|
|
|
|
|
|
|
|
|
|
|
|
|
| ||||||||
| Total expense |
300 | 274 | 263 | 273 | 272 | 26 | 28 | |||||||||||||||||||||
|
|
|
|
|
|
|
|
|
|
|
|
|
|
|
|
|
|
|
|
|
| ||||||||
| Core pre-tax income (2) |
14 | 74 | 67 | 89 | 67 | (59 | ) | (53 | ) | |||||||||||||||||||
| Change in the fair value of equity securities (2) |
(136 | ) | (61 | ) | 24 | (65 | ) | 20 | (76 | ) | (156 | ) | ||||||||||||||||
|
|
|
|
|
|
|
|
|
|
|
|
|
|
|
|
|
|
|
|
|
| ||||||||
| (Loss) income before income tax expense |
$ | (122 | ) | $ | 13 | $ | 91 | $ | 24 | $ | 87 | $ | (135 | ) | $ | (209 | ) | |||||||||||
|
|
|
|
|
|
|
|
|
|
|
|
|
|
|
|
|
|
|
|
|
| ||||||||
| Balance Sheet (Period-End) |
||||||||||||||||||||||||||||
| Cash and investment securities |
$ | 5,407 | $ | 5,651 | $ | 5,530 | $ | 5,503 | $ | 5,738 | $ | (244 | ) | $ | (331 | ) | ||||||||||||
| Intercompany loans(1) |
411 | 572 | 923 | 898 | 697 | (161 | ) | (286 | ) | |||||||||||||||||||
| Premiums receivable and other insurance assets |
2,755 | 2,741 | 2,735 | 2,761 | 2,782 | 14 | (27 | ) | ||||||||||||||||||||
| Other assets |
246 | 256 | 193 | 192 | 177 | (10 | ) | 69 | ||||||||||||||||||||
|
|
|
|
|
|
|
|
|
|
|
|
|
|
|
|
|
|
|
|
|
| ||||||||
| Total assets |
$ | 8,819 | $ | 9,220 | $ | 9,381 | $ | 9,354 | $ | 9,394 | $ | (401 | ) | $ | (575 | ) | ||||||||||||
|
|
|
|
|
|
|
|
|
|
|
|
|
|
|
|
|
|
|
|
|
| ||||||||
| Key Statistics |
||||||||||||||||||||||||||||
| Total written premiums and revenue (3) |
$ | 262 | $ | 265 | $ | 268 | $ | 295 | $ | 301 | $ | (3 | ) | $ | (39 | ) | ||||||||||||
| Loss ratio (4) |
31.2 | % | 20.5 | % | 19.5 | % | 24.4 | % | 26.3 | % | ||||||||||||||||||
| Underwriting expense ratio (5) |
74.8 | % | 76.0 | % | 73.4 | % | 72.0 | % | 70.4 | % | ||||||||||||||||||
|
|
|
|
|
|
|
|
|
|
|
|
|
|
|
|
||||||||||||||
| Combined ratio |
106.0 | % | 96.5 | % | 92.9 | % | 96.4 | % | 96.7 | % | ||||||||||||||||||
| (1) | Intercompany activity represents excess liquidity placed with corporate segment |
| (2) | Represents a non-GAAP financial measure. See page 25 for methodology and detail. |
| (3) | Written premiums are net of ceded premium for reinsurance. |
| (4) | Loss Ratio is calculated as Insurance losses and loss adjustment expenses divided by Insurance premiums and service revenue earned and Other Income, net of losses. |
| (5) | Underwriting Expense Ratio is calculated as Compensation and benefits expense and Other operating expenses divided by Insurance premiums and service revenue earned and Other Income, net of losses. |
| 2Q 2022 Preliminary Results | 11 |
| ALLY FINANCIAL INC. MORTGAGE FINANCE - CONDENSED FINANCIAL STATEMENTS
|
|
| ($ in millions) | ||||||||||||||||||||||||||||
| QUARTERLY TRENDS | CHANGE VS. | |||||||||||||||||||||||||||
| Income Statement |
2Q 22 | 1Q 22 | 4Q 21 | 3Q 21 | 2Q 21 | 1Q 22 | 2Q 21 | |||||||||||||||||||||
| Net financing revenue |
||||||||||||||||||||||||||||
| Total financing revenue and other interest income |
$ | 139 | $ | 130 | $ | 119 | $ | 106 | $ | 89 | $ | 9 | $ | 50 | ||||||||||||||
| Interest expense |
83 | 77 | 77 | 70 | 66 | 6 | 17 | |||||||||||||||||||||
|
|
|
|
|
|
|
|
|
|
|
|
|
|
|
|
|
|
|
|
|
| ||||||||
| Net financing revenue |
56 | 53 | 42 | 36 | 23 | 3 | 33 | |||||||||||||||||||||
| Gain on mortgage loans, net |
4 | 14 | 14 | 18 | 19 | (10 | ) | (15 | ) | |||||||||||||||||||
| Other income, net of losses |
— | — | (1 | ) | 1 | 3 | — | (3 | ) | |||||||||||||||||||
|
|
|
|
|
|
|
|
|
|
|
|
|
|
|
|
|
|
|
|
|
| ||||||||
| Total other revenue |
4 | 14 | 13 | 19 | 22 | (10 | ) | (18 | ) | |||||||||||||||||||
|
|
|
|
|
|
|
|
|
|
|
|
|
|
|
|
|
|
|
|
|
| ||||||||
| Total net revenue |
60 | 67 | 55 | 55 | 45 | (7 | ) | 15 | ||||||||||||||||||||
|
|
|
|
|
|
|
|
|
|
|
|
|
|
|
|
|
|
|
|
|
| ||||||||
| Provision for loan losses |
— | — | 1 | 2 | — | — | — | |||||||||||||||||||||
| Noninterest expense |
||||||||||||||||||||||||||||
| Compensation and benefits expense |
6 | 6 | 6 | 5 | 5 | — | 1 | |||||||||||||||||||||
| Other operating expense |
48 | 50 | 45 | 42 | 40 | (2 | ) | 8 | ||||||||||||||||||||
|
|
|
|
|
|
|
|
|
|
|
|
|
|
|
|
|
|
|
|
|
| ||||||||
| Total noninterest expense |
54 | 56 | 51 | 47 | 45 | (2 | ) | 9 | ||||||||||||||||||||
|
|
|
|
|
|
|
|
|
|
|
|
|
|
|
|
|
|
|
|
|
| ||||||||
| Pre-tax Income |
$ | 6 | $ | 11 | $ | 3 | $ | 6 | $ | — | $ | (5 | ) | $ | 6 | |||||||||||||
|
|
|
|
|
|
|
|
|
|
|
|
|
|
|
|
|
|
|
|
|
| ||||||||
| Balance Sheet (Period-End) |
||||||||||||||||||||||||||||
| Finance receivables and loans, net: |
||||||||||||||||||||||||||||
| Consumer loans |
$ | 18,923 | $ | 18,372 | $ | 17,644 | $ | 16,059 | $ | 13,629 | $ | 551 | $ | 5,294 | ||||||||||||||
| Allowance for loan losses |
(20 | ) | (19 | ) | (19 | ) | (17 | ) | (15 | ) | (1 | ) | (5 | ) | ||||||||||||||
|
|
|
|
|
|
|
|
|
|
|
|
|
|
|
|
|
|
|
|
|
| ||||||||
| Total finance receivables and loans, net |
18,903 | 18,353 | 17,625 | 16,042 | 13,614 | 550 | 5,289 | |||||||||||||||||||||
| Other assets |
223 | 243 | 222 | 286 | 251 | (20 | ) | (28 | ) | |||||||||||||||||||
|
|
|
|
|
|
|
|
|
|
|
|
|
|
|
|
|
|
|
|
|
| ||||||||
| Total assets |
$ | 19,126 | $ | 18,596 | $ | 17,847 | $ | 16,328 | $ | 13,865 | $ | 530 | $ | 5,261 | ||||||||||||||
|
|
|
|
|
|
|
|
|
|
|
|
|
|
|
|
|
|
|
|
|
| ||||||||
| 2Q 2022 Preliminary Results | 12 |
| ALLY FINANCIAL INC. CORPORATE FINANCE - CONDENSED FINANCIAL STATEMENTS
|
|
| ($ in millions) | ||||||||||||||||||||||||||||
| QUARTERLY TRENDS | CHANGE VS. | |||||||||||||||||||||||||||
| Income Statement |
2Q 22 | 1Q 22 | 4Q 21 | 3Q 21 | 2Q 21 | 1Q 22 | 2Q 21 | |||||||||||||||||||||
| Net financing revenue |
||||||||||||||||||||||||||||
| Total financing revenue and other interest income |
$ | 104 | $ | 95 | $ | 93 | $ | 86 | $ | 86 | $ | 9 | $ | 18 | ||||||||||||||
| Interest expense |
27 | 12 | 10 | 9 | 9 | 15 | 18 | |||||||||||||||||||||
|
|
|
|
|
|
|
|
|
|
|
|
|
|
|
|
|
|
|
|
|
| ||||||||
| Net financing revenue |
77 | 83 | 83 | 77 | 77 | (6) | — | |||||||||||||||||||||
| Total other revenue |
19 | 24 | 53 | 16 | 33 | (5) | (14) | |||||||||||||||||||||
|
|
|
|
|
|
|
|
|
|
|
|
|
|
|
|
|
|
|
|
|
| ||||||||
| Total net revenue |
96 | 107 | 136 | 93 | 110 | (11) | (14) | |||||||||||||||||||||
| Provision for loan losses |
8 | 6 | 33 | 5 | (13) | 2 | 21 | |||||||||||||||||||||
| Noninterest expense |
||||||||||||||||||||||||||||
| Compensation and benefits expense |
15 | 23 | 18 | 15 | 17 | (8) | (2) | |||||||||||||||||||||
| Other operating expense |
13 | 14 | 12 | 12 | 11 | (1) | 2 | |||||||||||||||||||||
|
|
|
|
|
|
|
|
|
|
|
|
|
|
|
|
|
|
|
|
|
| ||||||||
| Total noninterest expense |
28 | 37 | 30 | 27 | 28 | (9) | — | |||||||||||||||||||||
|
|
|
|
|
|
|
|
|
|
|
|
|
|
|
|
|
|
|
|
|
| ||||||||
| Pre-tax Income |
$ | 60 | $ | 64 | $ | 73 | $ | 61 | $ | 95 | $ | (4) | $ | (35) | ||||||||||||||
|
|
|
|
|
|
|
|
|
|
|
|
|
|
|
|
|
|
|
|
|
| ||||||||
| Change in the fair value of equity securities (1) |
(0) | 4 | 2 | (1) | 1 | (5) | (1) | |||||||||||||||||||||
|
|
|
|
|
|
|
|
|
|
|
|
|
|
|
|
|
|
|
|
|
| ||||||||
| Core pre-tax income (2) |
$ | 60 | $ | 68 | $ | 75 | $ | 60 | $ | 96 | $ | (9) | $ | (36) | ||||||||||||||
|
|
|
|
|
|
|
|
|
|
|
|
|
|
|
|
|
|
|
|
|
| ||||||||
| Balance Sheet (Period-End) |
||||||||||||||||||||||||||||
| Equity securities |
$ | 3 | $ | 3 | $ | 11 | $ | 14 | $ | 12 | $ | — | $ | (9) | ||||||||||||||
| Loans held for sale |
517 | 190 | 305 | 215 | 184 | 327 | 333 | |||||||||||||||||||||
| Commercial loans |
8,475 | 8,021 | 7,770 | 6,609 | 6,157 | 454 | 2,318 | |||||||||||||||||||||
| Allowance for loan losses |
(203) | (221) | (215) | (183) | (178) | 18 | (25) | |||||||||||||||||||||
|
|
|
|
|
|
|
|
|
|
|
|
|
|
|
|
|
|
|
|
|
| ||||||||
| Total finance receivables and loans, net |
8,272 | 7,800 | 7,555 | 6,426 | 5,979 | 472 | 2,293 | |||||||||||||||||||||
| Other assets |
98 | 93 | 79 | 74 | 71 | 5 | 27 | |||||||||||||||||||||
|
|
|
|
|
|
|
|
|
|
|
|
|
|
|
|
|
|
|
|
|
| ||||||||
| Total assets |
$ | 8,890 | $ | 8,086 | $ | 7,950 | $ | 6,729 | $ | 6,246 | $ | 804 | $ | 2,644 | ||||||||||||||
|
|
|
|
|
|
|
|
|
|
|
|
|
|
|
|
|
|
|
|
|
| ||||||||
| (1) | See page 25 for methodology and detail. |
| (2) | Represents a non-GAAP financial measure.See page 25 for methodology and detail. |
| 2Q 2022 Preliminary Results | 13 |
| ALLY FINANCIAL INC. CORPORATE AND OTHER - CONDENSED FINANCIAL STATEMENTS
|
|
| ($ in millions) | QUARTERLY TRENDS | CHANGE VS. | ||||||||||||||||||||||||||
| Income Statement |
2Q 22 | 1Q 22 | 4Q 21 | 3Q 21 | 2Q 21 | 1Q 22 | 2Q 21 | |||||||||||||||||||||
| Net financing revenue |
||||||||||||||||||||||||||||
| Total financing revenue and other interest income |
276 | 223 | 155 | 131 | 126 | 53 | 150 | |||||||||||||||||||||
|
|
|
|
|
|
|
|
|
|
|
|
|
|
|
|
|
|
|
|
|
| ||||||||
| Interest expense |
(34 | ) | (22 | ) | (18 | ) | (7 | ) | 27 | (12 | ) | (61 | ) | |||||||||||||||
|
|
|
|
|
|
|
|
|
|
|
|
|
|
|
|
|
|
|
|
|
| ||||||||
| Net financing revenue |
310 | 245 | 173 | 138 | 99 | 65 | 211 | |||||||||||||||||||||
| Other revenue |
||||||||||||||||||||||||||||
| Loss on extinguishment of debt |
— | — | (10 | ) | (52 | ) | (73 | ) | — | 73 | ||||||||||||||||||
| Other gain on investments, net |
2 | 18 | 17 | 22 | 5 | (16 | ) | (3 | ) | |||||||||||||||||||
| Other income, net of losses (1) |
57 | 48 | 66 | 42 | 146 | 9 | (89 | ) | ||||||||||||||||||||
|
|
|
|
|
|
|
|
|
|
|
|
|
|
|
|
|
|
|
|
|
| ||||||||
| Total other revenue |
59 | 66 | 73 | 12 | 78 | (7 | ) | (19 | ) | |||||||||||||||||||
|
|
|
|
|
|
|
|
|
|
|
|
|
|
|
|
|
|
|
|
|
| ||||||||
| Total net revenue |
369 | 311 | 246 | 150 | 177 | 58 | 192 | |||||||||||||||||||||
| Provision for loan losses |
68 | 57 | 131 | 16 | 4 | 11 | 64 | |||||||||||||||||||||
| Noninterest expense |
||||||||||||||||||||||||||||
| Compensation and benefits expense |
240 | 268 | 220 | 210 | 256 | (28 | ) | (16 | ) | |||||||||||||||||||
| Other operating expense (2) |
(29 | ) | (47 | ) | 2 | (67 | ) | (26 | ) | 18 | (3 | ) | ||||||||||||||||
|
|
|
|
|
|
|
|
|
|
|
|
|
|
|
|
|
|
|
|
|
| ||||||||
| Total noninterest expense |
211 | 221 | 222 | 143 | 230 | (10 | ) | (19 | ) | |||||||||||||||||||
|
|
|
|
|
|
|
|
|
|
|
|
|
|
|
|
|
|
|
|
|
| ||||||||
| Pre-tax income (loss) |
$ | 90 | $ | 33 | $ | (107 | ) | $ | (9 | ) | $ | (57 | ) | $ | 57 | $ | 147 | |||||||||||
|
|
|
|
|
|
|
|
|
|
|
|
|
|
|
|
|
|
|
|
|
| ||||||||
| Change in the fair value of equity securities (3) |
— | — | 1 | 1 | (1 | ) | — | 1 | ||||||||||||||||||||
| Core OID (4) |
10 | 10 | 9 | 9 | 9 | — | 1 | |||||||||||||||||||||
| Repositioning (3) |
— | — | 107 | 52 | 70 | — | (70 | ) | ||||||||||||||||||||
|
|
|
|
|
|
|
|
|
|
|
|
|
|
|
|
|
|
|
|
|
| ||||||||
| Core pre-tax income (4) |
$ | 101 | $ | 43 | $ | 10 | $ | 52 | $ | 21 | $ | 57 | $ | 79 | ||||||||||||||
|
|
|
|
|
|
|
|
|
|
|
|
|
|
|
|
|
|
|
|
|
| ||||||||
| Balance Sheet (Period-End) |
||||||||||||||||||||||||||||
| Cash, trading and investment securities |
$ | 32,324 | $ | 33,667 | $ | 35,357 | $ | 40,692 | $ | 44,204 | $ | (1,343 | ) | $ | (11,880 | ) | ||||||||||||
| Loans held-for-sale |
200 | 186 | 164 | 139 | 128 | 14 | 72 | |||||||||||||||||||||
| Consumer loans |
2,569 | 2,235 | 2,293 | 1,310 | 1,193 | 334 | 1,376 | |||||||||||||||||||||
| Commercial loans |
190 | 180 | 198 | 223 | 192 | 10 | (2 | ) | ||||||||||||||||||||
| Intercompany loans(5) |
(411 | ) | (572 | ) | (923 | ) | (898 | ) | (697 | ) | 161 | 286 | ||||||||||||||||
| Allowance for loan losses |
(313 | ) | (267 | ) | (231 | ) | (97 | ) | (85 | ) | (46 | ) | (228 | ) | ||||||||||||||
|
|
|
|
|
|
|
|
|
|
|
|
|
|
|
|
|
|
|
|
|
| ||||||||
| Total finance receivables and loans, net |
2,035 | 1,576 | 1,337 | 538 | 603 | 459 | 1,432 | |||||||||||||||||||||
| Other assets |
7,131 | 7,212 | 6,661 | 5,787 | 5,868 | (81 | ) | 1,263 | ||||||||||||||||||||
|
|
|
|
|
|
|
|
|
|
|
|
|
|
|
|
|
|
|
|
|
| ||||||||
| Total assets |
$ | 41,690 | $ | 42,641 | $ | 43,519 | $ | 47,156 | $ | 50,803 | $ | (951 | ) | $ | (9,113 | ) | ||||||||||||
|
|
|
|
|
|
|
|
|
|
|
|
|
|
|
|
|
|
|
|
|
| ||||||||
| Core OID Amortization |
2022 | 2023 | 2024 | 2025 | 2026 & After | |||||||||||||||||||||||
|
|
|
|
|
|
|
|
|
|
|
|
|
|
|
|
||||||||||||||
| Remaining Core OID amortization expense |
$ | 22 | $ | 49 | $ | 57 | $ | 66 | Avg = $112/yr | |||||||||||||||||||
(1) Includes the impact of centralized asset and liability management, the legacy mortgage portfolio, Ally Invest activity, and Ally Lending activity.
(2) Other operating expenses includes corporate overhead allocated to the other business segments. Amounts of corporate overhead allocated were $307 million for 2Q22, $311 million for 1Q22, $294 million for 4Q21, $290 million for 3Q21, and $268 million for 2Q21. The receiving business segment records the allocation of corporate overhead expense within other operating expenses.
(3) See page 25 for methodology and detail.
(4) Represents a non-GAAP financial measure. See page 25 for methodology and detail. (5) Intercompany loan related to activity between Insurance and Corporate for liquidity purposes.
| 2Q 2022 Preliminary Results | 14 |
| ALLY FINANCIAL INC. CREDIT RELATED INFORMATION
|
|
| $ in millions | ||||||||||||||||||||||||||||
| QUARTERLY TRENDS | CHANGE VS. | |||||||||||||||||||||||||||
| Asset Quality - Consolidated (1) |
2Q 22 | 1Q 22 | 4Q 21 | 3Q 21 | 2Q 21 | 1Q 22 | 2Q 21 | |||||||||||||||||||||
| Ending loan balance |
$ | 128,450 | $ | 125,358 | $ | 122,261 | $ | 114,463 | $ | 112,209 | $ | 3,092 | $ | 16,242 | ||||||||||||||
| 30+ Accruing DPD |
$ | 2,198 | $ | 1,684 | $ | 1,793 | $ | 1,591 | $ | 1,291 | $ | 514 | $ | 907 | ||||||||||||||
| 30+ Accruing DPD % |
1.71 | % | 1.34 | % | 1.47 | % | 1.39 | % | 1.15 | % | ||||||||||||||||||
| 60+ Accruing DPD |
$ | 491 | $ | 380 | $ | 401 | $ | 308 | $ | 247 | $ | 111 | $ | 244 | ||||||||||||||
| 60+ Accruing DPD % |
0.38 | % | 0.30 | % | 0.33 | % | 0.27 | % | 0.22 | % | ||||||||||||||||||
| Non-performing loans (NPLs) |
$ | 1,380 | $ | 1,388 | $ | 1,436 | $ | 1,285 | $ | 1,283 | $ | (8 | ) | $ | 97 | |||||||||||||
| Net charge-offs (NCOs) |
$ | 153 | $ | 133 | $ | 103 | $ | 54 | $ | (6 | ) | $ | 21 | $ | 159 | |||||||||||||
| Net charge-off rate (2) |
0.49 | % | 0.43 | % | 0.35 | % | 0.19 | % | (0.02 | )% | ||||||||||||||||||
| Provision for loan losses (3) |
$ | 304 | $ | 167 | $ | 210 | $ | 76 | $ | (32 | ) | $ | 137 | $ | 336 | |||||||||||||
| Allowance for loan losses (ALLL) |
$ | 3,450 | $ | 3,301 | $ | 3,267 | $ | 3,148 | $ | 3,126 | $ | 149 | $ | 324 | ||||||||||||||
| ALLL as % of Loans (3) (4) |
2.68 | % | 2.63 | % | 2.67 | % | 2.75 | % | 2.79 | % | ||||||||||||||||||
| ALLL as % of NPLs (3) |
250 | % | 238 | % | 227 | % | 245 | % | 244 | % | ||||||||||||||||||
| ALLL as % of NCOs (3) |
561 | % | 621 | % | 792 | % | n/m | n/m | ||||||||||||||||||||
| US Auto Delinquencies - HFI Retail Contract $‘s |
|
|||||||||||||||||||||||||||
| 30+ Delinquent contract $ |
$ | 2,061 | $ | 1,594 | $ | 1,677 | $ | 1,427 | $ | 1,218 | $ | 467 | $ | 843 | ||||||||||||||
| % of retail contract $ outstanding |
2.52 | % | 2.02 | % | 2.14 | % | 1.83 | % | 1.60 | % | ||||||||||||||||||
| 60+ Delinquent contract $ |
$ | 470 | $ | 362 | $ | 378 | $ | 298 | $ | 241 | ||||||||||||||||||
| % of retail contract $ outstanding |
0.57 | % | 0.46 | % | 0.48 | % | 0.38 | % | 0.32 | % | ||||||||||||||||||
| U.S. Auto Annualized Net Charge-Offs - HFI Retail Contract $‘s |
|
|||||||||||||||||||||||||||
| Net charge-offs |
$ | 108 | $ | 113 | $ | 94 | $ | 51 | $ | (5 | ) | $ | (5 | ) | $ | 113 | ||||||||||||
| % of avg. HFI assets (2) |
0.54 | % | 0.58 | % | 0.48 | % | 0.27 | % | (0.03 | )% | ||||||||||||||||||
| U.S. Auto Annualized Net Charge-Offs - HFI Commercial Contract $‘s |
|
|||||||||||||||||||||||||||
| Net charge-offs |
$ | (1 | ) | $ | (1 | ) | $ | 0 | $ | 0 | $ | 0 | $ | 0 | $ | (1 | ) | |||||||||||
| % of avg. HFI assets (2) |
(0.03 | )% | (0.01 | )% | (0.01 | )% | (0.01 | )% | — | % | ||||||||||||||||||
(1) Loans within this table are classified as held-for-investment recorded at amortized cost as these loans are included in our allowance for loan losses.
(2) Net charge-off ratios are calculated as annualized net charge-offs divided by average outstanding finance recievables and loans excluding loans measured at fair value, conditional repurchase loans and loans held-for-sale during the year for each loan category.
(3) ALLL coverage ratios are based on the allowance for loan losses related to loans held-for-investment excluding those loans held at fair value as a percentage of the unpaid principal balance, net of premiums and discounts.
(4) Excludes ($501) million of fair value adjustment for loans in hedge accounting relationships in 2Q22, ($350) million in 1Q22, ($37) million in 4Q21, $78 million in 3Q21 and $124 million in 2Q21.
| 2Q 2022 Preliminary Results | 15 |
| ALLY FINANCIAL INC. CREDIT RELATED INFORMATION, CONTINUED
|
|
| ($ in millions) | ||||||||||||||||||||||||||||
| Automotive Finance (1) | QUARTERLY TRENDS | CHANGE VS. | ||||||||||||||||||||||||||
| Consumer | 2Q 22 | 1Q 22 | 4Q 21 | 3Q 21 | 2Q 21 | 1Q 22 | 2Q 21 | |||||||||||||||||||||
| Allowance for loan losses |
$ | 2,885 | $ | 2,763 | $ | 2,769 | $ | 2,810 | $ | 2,802 | $ | 122 | $ | 83 | ||||||||||||||
| Total consumer loans (2) |
$ | 81,691 | $ | 78,911 | $ | 78,252 | $ | 77,761 | $ | 75,951 | $ | 2,780 | $ | 5,740 | ||||||||||||||
| Coverage ratio (3) |
3.51% | 3.49% | 3.54% | 3.62% | 3.70% | |||||||||||||||||||||||
| Commercial |
||||||||||||||||||||||||||||
| Allowance for loan losses |
$ | 30 | $ | 31 | $ | 33 | $ | 41 | $ | 46 | $ | (1) | $ | (16) | ||||||||||||||
| Total commercial loans |
$ | 16,108 | $ | 17,295 | $ | 16,074 | $ | 12,587 | $ | 15,219 | $ | (1,187) | $ | 889 | ||||||||||||||
| Coverage ratio |
0.18% | 0.18% | 0.21% | 0.32% | 0.30% | |||||||||||||||||||||||
| Mortgage (1) |
||||||||||||||||||||||||||||
| Consumer |
||||||||||||||||||||||||||||
| Mortgage Finance |
||||||||||||||||||||||||||||
| Allowance for loan losses |
$ | 20 | $ | 19 | $ | 19 | $ | 17 | $ | 15 | $ | 1 | $ | 5 | ||||||||||||||
| Total consumer loans |
$ | 18,923 | $ | 18,372 | $ | 17,644 | $ | 16,059 | $ | 13,629 | $ | 551 | $ | 5,294 | ||||||||||||||
| Coverage ratio |
0.11% | 0.10% | 0.11% | 0.11% | 0.11% | |||||||||||||||||||||||
| Mortgage - Legacy |
||||||||||||||||||||||||||||
| Allowance for loan losses |
$ | 6 | $ | 7 | $ | 8 | $ | 8 | $ | 9 | $ | (1) | $ | (3) | ||||||||||||||
| Total consumer loans |
$ | 322 | $ | 341 | $ | 368 | $ | 396 | $ | 429 | $ | (19) | $ | (107) | ||||||||||||||
| Coverage ratio |
1.92% | 2.03% | 2.05% | 2.04% | 2.16% | |||||||||||||||||||||||
| Total Mortgage |
||||||||||||||||||||||||||||
| Allowance for loan losses |
$ | 26 | $ | 26 | $ | 27 | $ | 25 | $ | 24 | $ | — | $ | 2 | ||||||||||||||
| Total consumer loans |
$ | 19,245 | $ | 18,713 | $ | 18,012 | $ | 16,455 | $ | 14,058 | $ | 532 | $ | 5,187 | ||||||||||||||
| Coverage ratio |
0.14% | 0.14% | 0.15% | 0.15% | 0.18% | |||||||||||||||||||||||
| Consumer Other - Ally Lending (1) (4) |
||||||||||||||||||||||||||||
| Allowance for loan losses |
$ | 141 | $ | 124 | $ | 102 | $ | 86 | $ | 72 | $ | 17 | $ | 69 | ||||||||||||||
| Total consumer loans |
$ | 1,516 | $ | 1,202 | $ | 1,002 | $ | 828 | $ | 632 | $ | 314 | $ | 885 | ||||||||||||||
| Coverage ratio |
9.32% | 10.32% | 10.20% | 10.34% | 11.39% | |||||||||||||||||||||||
| Consumer Other - Ally Credit Card (1) (5) |
||||||||||||||||||||||||||||
| Allowance for loan losses |
$ | 162 | $ | 134 | $ | 119 | — | — | $ | 28 | $ | 162 | ||||||||||||||||
| Total consumer loans |
$ | 1,224 | $ | 1,036 | $ | 953 | — | — | $ | 188 | $ | 1,224 | ||||||||||||||||
| Coverage ratio |
13.25% | 12.90% | 12.44% | — | — | |||||||||||||||||||||||
| Corporate Finance (1) |
||||||||||||||||||||||||||||
| Allowance for loan losses |
$ | 203 | $ | 221 | $ | 215 | $ | 183 | $ | 178 | $ | (18) | $ | 25 | ||||||||||||||
| Total commercial loans |
$ | 8,476 | $ | 8,021 | $ | 7,770 | $ | 6,609 | $ | 6,157 | $ | 455 | $ | 2,319 | ||||||||||||||
| Coverage ratio |
2.40% | 2.76% | 2.77% | 2.78% | 2.90% | |||||||||||||||||||||||
| Corporate and Other (1) |
||||||||||||||||||||||||||||
| Allowance for loan losses |
$ | 3 | $ | 2 | $ | 2 | $ | 3 | $ | 4 | $ | 1 | $ | (1) | ||||||||||||||
| Total commercial loans |
$ | 190 | $ | 180 | $ | 198 | $ | 223 | $ | 192 | $ | 10 | $ | (2) | ||||||||||||||
| Coverage ratio |
1.36% | 1.36% | 1.36% | 1.36% | 1.36% | |||||||||||||||||||||||
(1) ALLL coverage ratios are based on the domestic allowance as a percentage of finance receivables and loans reported at their gross carrying value, which includes the principal amount outstanding, net of unearned income, unamortized deferred fees reduced by costs on originated loans, unamortized premiums and discounts on purchased loans, unamortized basis adjustments arising from the designation of finance receivables and loans as the hedged item in qualifying fair value hedge relationships, and cumulative principal charge-offs. Excludes loans held at fair value.
(2) Includes ($501) million of fair value adjustment for loans in hedge accounting relationships in 2Q22, ($350) million in 1Q22, ($37) million in 4Q21, $78 million in 3Q21 and $124 million in 2Q21.
(3) Excludes ($501) million of fair value adjustment for loans in hedge accounting relationships in 2Q22, ($350) million in 1Q22, ($37) million in 4Q21, $78 million in 3Q21 and $124 million in 2Q21.
(4) Represents Health Credit Services (HCS) which Ally acquired in 4Q19 (now Ally Lending).
| 2Q 2022 Preliminary Results | 16 |
| ALLY FINANCIAL INC. CAPITAL
|
|
| ($ in billions) | QUARTERLY TRENDS | CHANGE VS. | ||||||||||||||||||||||||||
| Capital |
2Q 22 | 1Q 22 | 4Q 21 | 3Q 21 | 2Q 21 | 1Q 22 | 2Q 21 | |||||||||||||||||||||
| Risk-weighted assets |
$ | 152.2 | $ | 149.0 | $ | 146.4 | $ | 140.0 | $ | 138.8 | $ | 3.2 | $ | 13.4 | ||||||||||||||
| Common Equity Tier 1 (CET1) capital ratio |
9.6% | 10.0% | 10.3% | 11.2% | 11.3% | |||||||||||||||||||||||
| Tier 1 capital ratio |
11.1% | 11.5% | 11.9% | 12.8% | 13.1% | |||||||||||||||||||||||
| Total capital ratio |
12.7% | 13.1% | 13.5% | 14.6% | 14.8% | |||||||||||||||||||||||
| Tangible common equity / Tangible assets (1) (2) |
5.8% | 6.6% | 7.6% | 8.2% | 8.2% | |||||||||||||||||||||||
| Tangible common equity / Risk-weighted assets (1) |
7.1% | 8.2% | 9.4% | 10.4% | 10.7% | |||||||||||||||||||||||
| Shareholders’ equity |
$ | 14.0 | $ | 15.4 | $ | 17.1 | $ | 17.3 | $ | 17.5 | $ | (1.4) | $ | (3.5) | ||||||||||||||
| add: CECL phase-in adjustment |
0.9 | 0.9 | 1.2 | 1.2 | 1.1 | — | (0.2) | |||||||||||||||||||||
| less: Certain AOCI items and other adjustments |
2.1 | 0.9 | (0.8) | (0.5) | (0.6) | 1.2 | 2.7 | |||||||||||||||||||||
| Preferred equity |
(2.3) | (2.3) | (2.3) | (2.3) | (2.3) | — | — | |||||||||||||||||||||
|
|
|
|
|
|
|
|
|
|
|
|
|
|
|
|
|
|
|
|
|
| ||||||||
| Common Equity Tier 1 capital |
$ | 14.7 | $ | 14.8 | $ | 15.1 | $ | 15.7 | $ | 15.7 | $ | (0.1) | $ | (1.0) | ||||||||||||||
|
|
|
|
|
|
|
|
|
|
|
|
|
|
|
|
|
|
|
|
|
| ||||||||
| Common Equity Tier 1 capital |
$ | 14.7 | $ | 14.8 | $ | 15.1 | $ | 15.7 | $ | 15.7 | $ | (0.1) | $ | (1.0) | ||||||||||||||
| add: Preferred equity |
2.3 | 2.3 | 2.3 | 2.3 | 2.3 | — | — | |||||||||||||||||||||
| Trust preferred securities |
— | — | — | — | 0.2 | — | (0.2) | |||||||||||||||||||||
| less: Other adjustments |
— | — | (0.1) | (0.1) | (0.1) | — | 0.1 | |||||||||||||||||||||
|
|
|
|
|
|
|
|
|
|
|
|
|
|
|
|
|
|
|
|
|
| ||||||||
| Tier 1 capital |
$ | 16.9 | $ | 17.1 | $ | 17.4 | $ | 17.9 | $ | 18.2 | $ | (0.2) | $ | (1.3) | ||||||||||||||
|
|
|
|
|
|
|
|
|
|
|
|
|
|
|
|
|
|
|
|
|
| ||||||||
| Tier 1 capital |
$ | 16.9 | $ | 17.1 | $ | 17.4 | $ | 17.9 | $ | 18.2 | $ | (0.2) | $ | (1.3) | ||||||||||||||
| add: Qualifying subordinated debt |
0.6 | 0.6 | 0.6 | 0.8 | 0.8 | — | (0.2) | |||||||||||||||||||||
| Allowance for loan and lease losses includible in Tier 2 capital and other adjustments |
1.9 | 1.8 | 1.7 | 1.6 | 1.6 | 0.1 | 0.3 | |||||||||||||||||||||
|
|
|
|
|
|
|
|
|
|
|
|
|
|
|
|
|
|
|
|
|
| ||||||||
| Total capital |
$ | 19.4 | $ | 19.6 | $ | 19.7 | $ | 20.4 | $ | 20.6 | $ | (0.2) | $ | (1.2) | ||||||||||||||
|
|
|
|
|
|
|
|
|
|
|
|
|
|
|
|
|
|
|
|
|
| ||||||||
| Total shareholders’ equity |
$ | 14.0 | $ | 15.4 | $ | 17.1 | $ | 17.3 | $ | 17.5 | $ | (1.4) | $ | (3.5) | ||||||||||||||
| less: Preferred equity |
(2.3) | (2.3) | (2.3) | (2.3) | (2.3) | — | — | |||||||||||||||||||||
| Goodwill and intangible assets, net of deferred tax liabilities |
(0.9) | (0.9) | (0.9) | (0.4) | (0.4) | — | (0.5) | |||||||||||||||||||||
|
|
|
|
|
|
|
|
|
|
|
|
|
|
|
|
|
|
|
|
|
| ||||||||
| Tangible common equity (1) |
$ | 10.7 | $ | 12.2 | $ | 13.8 | $ | 14.6 | $ | 14.8 | $ | (1.5) | $ | (4.1) | ||||||||||||||
|
|
|
|
|
|
|
|
|
|
|
|
|
|
|
|
|
|
|
|
|
| ||||||||
| Total assets |
$ | 185.7 | $ | 184.3 | $ | 182.1 | $ | 179.2 | $ | 180.5 | $ | 1.4 | $ | 5.2 | ||||||||||||||
| less: Goodwill and intangible assets, net of deferred tax liabilities |
(0.9) | (0.9) | (0.9) | (0.4) | (0.4) | — | (0.5) | |||||||||||||||||||||
|
|
|
|
|
|
|
|
|
|
|
|
|
|
|
|
|
|
|
|
|
| ||||||||
| Tangible assets (2) |
$ | 184.8 | $ | 183.4 | $ | 181.2 | $ | 178.8 | $ | 180.1 | $ | 1.4 | $ | 4.7 | ||||||||||||||
|
|
|
|
|
|
|
|
|
|
|
|
|
|
|
|
|
|
|
|
|
|
| |||||||
Note: Numbers may not foot due to rounding
| (1) | Represents a non-GAAP financial measure. See page 25 for methodology and detail. |
| (2) | Represents a non-GAAP financial measure. Ally defines tangible assets as total assets less goodwill and intangible assets, net of deferred tax liabilities. |
For more details on the final rules to address the impact of CECL on regulatory capital by allowing BHCs and banks, including Ally, to delay and subsequently phase-in its impact, see page 25.
| 2Q 2022 Preliminary Results | 17 |
| ALLY FINANCIAL INC. LIQUIDITY AND DEPOSITS
|
|
| QUARTERLY TRENDS | CHANGE VS. | |||||||||||||||||||||||||||
| Consolidated Available Liquidity ($ in billions) |
2Q 22 | 1Q 22 | 4Q 21 | 3Q 21 | 2Q 21 | 1Q 22 | 2Q 21 | |||||||||||||||||||||
| Liquid cash and cash equivalents (1) |
$ | 3.7 | $ | 3.6 | $ | 4.4 | $ | 10.1 | $ | 13.0 | $ | 0.1 | $ | (9.3 | ) | |||||||||||||
| Highly liquid securities (2) |
24.6 | 25.9 | 26.8 | 26.7 | 28.4 | (1.3 | ) | (3.8 | ) | |||||||||||||||||||
| Current committed unused capacity |
— | — | — | 0.1 | 0.2 | — | (0.2 | ) | ||||||||||||||||||||
|
|
|
|
|
|
|
|
|
|
|
|
|
|
|
|||||||||||||||
| Total current available liquidity |
$ | 28.3 | $ | 29.5 | $ | 31.2 | $ | 36.9 | $ | 41.6 | $ | (1.2 | ) | $ | (13.3 | ) | ||||||||||||
|
|
|
|
|
|
|
|
|
|
|
|
|
|
|
|||||||||||||||
| Unsecured Long-Term Debt Maturity Profile |
2022 | 2023 | 2024 | 2025 | 2026 | 2027 & After | ||||||||||||||||||||||
| Consolidated remaining maturities (3) |
$ | — | $ | 2.0 | $ | 1.5 | $ | 2.3 | $ | — | $ | 4.0 | ||||||||||||||||
| Ally Bank Deposits |
||||||||||||||||||||||||||||
| Key Deposit Statistics |
||||||||||||||||||||||||||||
| Average retail CD maturity (months) |
20.7 | 20.5 | 20.3 | 20.2 | 20.1 | 0.2 | 0.6 | |||||||||||||||||||||
| Average retail deposit rate |
0.71% | 0.59% | 0.61% | 0.64% | 0.69% | |||||||||||||||||||||||
| End of Period Deposit Levels ($ in millions) |
||||||||||||||||||||||||||||
| Retail |
$ | 131,155 | $ | 135,978 | $ | 134,672 | $ | 131,590 | $ | 129,222 | $ | (4,823 | ) | $ | 1,933 | |||||||||||||
| Brokered & other |
9,246 | 6,497 | 6,886 | 7,854 | 9,882 | 2,749 | (636 | ) | ||||||||||||||||||||
|
|
|
|
|
|
|
|
|
|
|
|
|
|
|
|||||||||||||||
| Total deposits |
$ | 140,401 | $ | 142,475 | $ | 141,558 | $ | 139,444 | $ | 139,104 | $ | (2,074 | ) | $ | 1,297 | |||||||||||||
|
|
|
|
|
|
|
|
|
|
|
|
|
|
|
|||||||||||||||
| Deposit Mix |
||||||||||||||||||||||||||||
| Retail CD |
23% | 24% | 26% | 27% | 28% | |||||||||||||||||||||||
| MMA/OSA/Checking |
71% | 72% | 70% | 67% | 65% | |||||||||||||||||||||||
| Brokered |
6% | 4% | 4% | 6% | 7% | |||||||||||||||||||||||
| (1) | May include the restricted cash accumulation for retained notes maturing within the following 30 days and returned to Ally on the distribution date |
| (2) | Includes unencumbered UST, Agency debt, Agency MBS, and highly liquid Corporates |
| (3) | Excludes retail notes; as of 6/30/2022. Reflects notional value of outstanding bond. Excludes total GAAP OID and capitalized transaction costs. |
| 2Q 2022 Preliminary Results | 18 |
| ALLY FINANCIAL INC. NET INTEREST MARGIN
|
|
| ($ in millions) | QUARTERLY TRENDS | CHANGE VS. | ||||||||||||||||||||||||||
| Average Balance Details |
2Q 22 | 1Q 22 | 4Q 21 | 3Q 21 | 2Q 21 | 1Q 22 | 2Q 21 | |||||||||||||||||||||
| Retail Auto Loans |
$ | 79,695 | $ | 78,224 | $ | 77,979 | $ | 76,557 | $ | 74,662 | $ | 1,471 | $ | 5,033 | ||||||||||||||
| Auto Lease (net of dep) |
10,615 | 10,878 | 10,951 | 10,919 | 10,355 | (263) | 260 | |||||||||||||||||||||
| Dealer Floorplan |
11,372 | 11,594 | 9,539 | 8,849 | 10,825 | (222) | 547 | |||||||||||||||||||||
| Other Dealer Loans |
4,839 | 4,810 | 4,829 | 5,038 | 5,507 | 29 | (668) | |||||||||||||||||||||
| Corporate Finance |
8,351 | 8,045 | 7,147 | 6,735 | 6,383 | 306 | 1,968 | |||||||||||||||||||||
| Mortgage(1) |
18,980 | 18,228 | 17,533 | 15,125 | 13,179 | 752 | 5,801 | |||||||||||||||||||||
| Consumer Other - Ally Lending(2) |
1,346 | 1,100 | 923 | 728 | 537 | 246 | 809 | |||||||||||||||||||||
| Consumer Other - Ally Credit Card (3) |
1,093 | 981 | 309 | — | — | 112 | 1,093 | |||||||||||||||||||||
| Cash and Cash Equivalents |
3,761 | 4,027 | 6,532 | 13,055 | 16,564 | (266) | (12,803) | |||||||||||||||||||||
| Investment Securities and Other |
35,050 | 37,025 | 37,146 | 35,532 | 36,784 | (1,975) | (1,734) | |||||||||||||||||||||
|
|
|
|
|
|
|
|
|
|
|
|
|
|
|
|||||||||||||||
| Total Earning Assets |
$ | 175,103 | $ | 174,911 | $ | 172,888 | $ | 172,538 | $ | 174,796 | $ | 192 | $ | 307 | ||||||||||||||
| Interest Revenue |
2,231 | 2,094 | 2,069 | 2,038 | 2,044 | 137 | 187 | |||||||||||||||||||||
| Unsecured Debt (ex. Core OID balance) (4)(7) |
$ | 9,674 | $ | 9,976 | $ | 10,061 | $ | 9,787 | $ | 11,737 | $ | (302) | $ | (2,063) | ||||||||||||||
| Secured Debt |
1,154 | 1,089 | 1,331 | 1,675 | 2,618 | 65 | (1,464) | |||||||||||||||||||||
| Deposits (5) |
139,814 | 141,557 | 140,043 | 139,244 | 139,382 | (1,743) | 432 | |||||||||||||||||||||
| Other Borrowings (6) |
11,966 | 7,203 | 4,990 | 4,929 | 5,044 | 4,763 | 6,922 | |||||||||||||||||||||
|
|
|
|
|
|
|
|
|
|
|
|
|
|
|
|||||||||||||||
| Total Funding Sources (ex. Core OID balance) (4) |
$ | 162,608 | $ | 159,826 | $ | 156,425 | $ | 155,635 | $ | 158,781 | $ | 2,782 | $ | 3,827 | ||||||||||||||
| Interest Expense (ex. Core OID) (4) |
457 | 391 | 406 | 435 | 488 | 66 | (31) | |||||||||||||||||||||
| Net Financing Revenue (ex. Core OID) (4) |
$ | 1,774 | $ | 1,703 | $ | 1,663 | $ | 1,603 | $ | 1,556 | $ | 71 | $ | 218 | ||||||||||||||
| Net Interest Margin (yield details) |
||||||||||||||||||||||||||||
| Retail Auto Loan |
6.82% | 6.61% | 6.61% | 6.62% | 6.70% | 0.21% | 0.12% | |||||||||||||||||||||
| Retail Auto Loan (excl. hedge impact) |
6.85% | 6.75% | 6.81% | 6.84% | 6.92% | 0.10% | (0.07)% | |||||||||||||||||||||
| Auto Lease (net of dep) |
6.66% | 6.96% | 7.88% | 9.21% | 11.67% | (0.30)% | (5.01)% | |||||||||||||||||||||
| Dealer Floorplan |
3.45% | 2.97% | 2.98% | 3.18% | 3.31% | 0.48% | 0.14% | |||||||||||||||||||||
| Other Dealer Loans |
4.13% | 4.17% | 4.10% | 4.16% | 4.18% | (0.04)% | (0.05)% | |||||||||||||||||||||
| Corporate Finance |
5.02% | 4.76% | 5.15% | 5.12% | 5.37% | 0.26% | (0.35)% | |||||||||||||||||||||
| Mortgage |
3.01% | 2.94% | 2.77% | 2.83% | 2.80% | 0.07% | 0.21% | |||||||||||||||||||||
| Consumer Other - Ally Lending(2) |
11.94% | 12.62% | 12.89% | 13.86% | 14.44% | (0.68)% | (2.50)% | |||||||||||||||||||||
| Consumer Other - Ally Credit Card (3) |
19.71% | 18.75% | 18.11% | —% | —% | 0.96% | 19.71% | |||||||||||||||||||||
| Cash and Cash Equivalents |
0.61% | 0.15% | 0.14% | 0.14% | 0.10% | 0.46% | 0.51% | |||||||||||||||||||||
| Investment Securities and Other |
2.35% | 2.09% | 1.81% | 1.76% | 1.63% | 0.26% | 0.72% | |||||||||||||||||||||
|
|
|
|
|
|
|
|
|
|
|
|
|
|
|
|||||||||||||||
| Total Earning Assets |
5.11% | 4.86% | 4.75% | 4.68% | 4.69% | 0.25% | 0.42% | |||||||||||||||||||||
| Unsecured Debt (ex. Core OID & Core OID balance) (4)(7) |
5.04% | 5.12% | 5.02% | 5.19% | 5.33% | (0.08)% | (0.29)% | |||||||||||||||||||||
| Secured Debt |
6.61% | 6.36% | 5.91% | 4.29% | 4.44% | 0.25% | 2.17% | |||||||||||||||||||||
| Deposits (5) |
0.76% | 0.61% | 0.64% | 0.70% | 0.77% | 0.15% | (0.01)% | |||||||||||||||||||||
| Other Borrowings(6) |
1.75% | 2.11% | 2.59% | 3.42% | 2.81% | (0.36)% | (1.06)% | |||||||||||||||||||||
|
|
|
|
|
|
|
|
|
|
|
|
|
|
|
|||||||||||||||
| Total Funding Sources (ex. Core OID & Core OID balance) (4) |
1.12% | 0.99% | 1.03% | 1.11% | 1.23% | 0.13% | (0.11)% | |||||||||||||||||||||
| NIM (as reported) |
4.04% | 3.93% | 3.80% | 3.66% | 3.55% | 0.11% | 0.49% | |||||||||||||||||||||
| NIM (ex. Core OID & Core OID balance) (4) |
4.06% | 3.95% | 3.82% | 3.68% | 3.57% | 0.11% | 0.49% | |||||||||||||||||||||
| (1) | ‘Mortgage includes held-for-investment (HFI) loans from the Mortgage Finance segment and the HFI legacy mortgage portfolio in run-off at the Corporate and Other segment. |
| (2) | Unsecured consumer lending from point-of-sale financing. |
| (3) | Credit Card lending portfolio. 4Q’21 end of period balance was $953 million. 4Q’21 Average Balance reflects one month of active balances on-balance sheet (12/1/2021-12/31/2021) and $0 for prior months within period. |
| (4) | Represents a non-GAAP financial measure. Excludes Core OID from interest expense and Core OID balance from Unsecured Debt. |
| (5) | Includes retail, brokered, and other deposits. Other includes sweep deposits and other deposits. |
| (6) | Includes Demand Notes (terminated on 3/1/21), FHLB Borrowings, Repurchase Agreements and other. |
| (7) | Includes trust preferred securities. |
| 2Q 2022 Preliminary Results | 19 |
| ALLY FINANCIAL INC. ALLY BANK CONSUMER MORTGAGE HFI PORTFOLIOS (PERIOD-END)
|
|
| ($ in billions) | QUARTERLY TRENDS | |||||||||||||||||||
| Mortgage Finance HFI Portfolio |
2Q 22 | 1Q 22 | 4Q 21 | 3Q 21 | 2Q 21 | |||||||||||||||
| Loan Value |
||||||||||||||||||||
| Gross carry value |
$ | 18.9 | $ | 18.4 | $ | 17.6 | $ | 16.1 | $ | 13.6 | ||||||||||
| Net carry value |
$ | 18.9 | $ | 18.4 | $ | 17.6 | $ | 16.0 | $ | 13.6 | ||||||||||
| Estimated Pool Characteristics |
||||||||||||||||||||
| % Second lien |
0.0% | 0.0% | 0.0% | 0.0% | 0.0% | |||||||||||||||
| % Interest only |
0.0% | 0.0% | 0.0% | 0.0% | 0.0% | |||||||||||||||
| % 30+ Day delinquent(1)(2) |
0.7% | 0.6% | 0.8% | 1.1% | 0.8% | |||||||||||||||
| % Low/No documentation |
0.0% | 0.1% | 0.1% | 0.1% | 0.1% | |||||||||||||||
| % Non-primary residence |
4.1% | 4.0% | 3.9% | 4.3% | 4.9% | |||||||||||||||
| Refreshed FICO(3) |
779 | 776 | 776 | 776 | 776 | |||||||||||||||
| Wtd. Avg. LTV/CLTV (4) |
53.7% | 55.7% | 56.9% | 57.6% | 58.8% | |||||||||||||||
| Corporate Other Legacy Mortgage HFI Portfolio |
||||||||||||||||||||
| Loan Value |
||||||||||||||||||||
| Gross carry value |
$ | 0.3 | $ | 0.3 | $ | 0.4 | $ | 0.4 | $ | 0.4 | ||||||||||
| Net carry value |
$ | 0.3 | $ | 0.3 | $ | 0.4 | $ | 0.4 | $ | 0.4 | ||||||||||
| Estimated Pool Characteristics |
||||||||||||||||||||
| % Second lien |
13.9% | 14.7% | 15.0% | 15.6% | 16.5% | |||||||||||||||
| % Interest only |
0.1% | 0.1% | 0.1% | 0.2% | 0.1% | |||||||||||||||
| % 30+ Day delinquent(1)(2) |
7.2% | 7.1% | 7.5% | 8.1% | 6.3% | |||||||||||||||
| % Low/No documentation |
23.6% | 23.7% | 23.4% | 23.3% | 23.1% | |||||||||||||||
| % Non-primary residence |
3.3% | 3.5% | 3.5% | 3.6% | 3.2% | |||||||||||||||
| Refreshed FICO(3) |
740 | 738 | 735 | 735 | 734 | |||||||||||||||
| Wtd. Avg. LTV/CLTV (4) |
49.1% | 52.2% | 54.2% | 56.0% | 61.0% | |||||||||||||||
| 1) | MBA Delinquency buckets were used for First Lien products and OTS Delinquency buckets were used for all others. |
| 2) | %30+Day Delinquency bucket excludes loans which are current but are in bankruptcy. |
| 3) | Refreshed FICO includes the entire Bank HFI portfolio, inclusive of SBO. Previously, SBO loans had been excluded from our reporting. |
| 4) | 1st lien only. Updated home values derived using a combination of appraisals, BPOs, AVMs and MSA level house price indices. |
| 2Q 2022 Preliminary Results | 20 |
| ALLY FINANCIAL INC. EARNINGS PER SHARE RELATED INFORMATION
|
|
| ($ in millions, shares in thousands) | QUARTERLY TRENDS | CHANGE VS. | ||||||||||||||||||||||||||||
| Earnings Per Share Data |
2Q 22 | 1Q 22 | 4Q 21 | 3Q 21 | 2Q 21 | 1Q 22 | 2Q 21 | |||||||||||||||||||||||
| GAAP net income attributable to common shareholders |
$ | 454 | $ | 627 | $ | 624 | $ | 683 | $ | 900 | $ | (173 | ) | $ | (446 | ) | ||||||||||||||
| Weighted-average common shares outstanding - basic | 322,057 | 335,678 | 345,870 | 359,179 | 370,412 | (13,621 | ) | (48,355 | ) | |||||||||||||||||||||
| Weighted-average common shares outstanding - diluted | 324,027 | 337,812 | 348,666 | 361,855 | 373,029 | (13,784 | ) | (49,001 | ) | |||||||||||||||||||||
| Issued shares outstanding (period-end) |
312,781 | 327,306 | 337,941 | 349,599 | 362,639 | (14,525 | ) | (49,857 | ) | |||||||||||||||||||||
|
|
|
|
|
|
|
|
|
|
|
|
|
|
|
|
|
|
|
|
|
| ||||||||||
| Net income per share - basic |
$ | 1.41 | $ | 1.87 | $ | 1.80 | $ | 1.90 | $ | 2.43 | $ | (0.46 | ) | $ | (1.02 | ) | ||||||||||||||
|
|
|
|
|
|
|
|
|
|
|
|
|
|
|
|
|
|
|
|
|
| ||||||||||
| Net income per share - diluted |
$ | 1.40 | $ | 1.86 | $ | 1.79 | $ | 1.89 | $ | 2.41 | $ | (0.45 | ) | $ | (1.01 | ) | ||||||||||||||
|
|
|
|
|
|
|
|
|
|
|
|
|
|
|
|
|
|
|
|
|
| ||||||||||
| Adjusted Earnings per Share (“Adjusted EPS”) |
||||||||||||||||||||||||||||||
| Numerator |
||||||||||||||||||||||||||||||
| GAAP net income attributable to common shareholders |
$ | 454 | $ | 627 | $ | 624 | $ | 683 | $ | 900 | $ | (173 | ) | $ | (446 | ) | ||||||||||||||
| Discontinued operations, net of tax |
— | — | 6 | — | (1 | ) | — | 1 | ||||||||||||||||||||||
| Core OID |
10 | 10 | 9 | 9 | 9 | — | 1 | |||||||||||||||||||||||
| Change in the fair value of equity securities |
136 | 66 | (21 | ) | 65 | (19 | ) | 71 | 156 | |||||||||||||||||||||
| Core OID, repositioning & change in the fair value of equity securities tax (tax rate 21%) |
(31 | ) | (16 | ) | (20 | ) | (26 | ) | (13 | ) | (15 | ) | (18 | ) | ||||||||||||||||
| Repositioning |
— | — | 107 | 52 | 70 | — | (70 | ) | ||||||||||||||||||||||
| Significant discrete tax items |
— | — | — | — | (78 | ) | — | 78 | ||||||||||||||||||||||
|
|
|
|
|
|
|
|
|
|
|
|
|
|
|
|
|
|
|
|
|
| ||||||||||
| Core net income attributable to common shareholders (1) |
$ | 570 | $ | 687 | $ | 705 | $ | 782 | $ | 868 | $ | (117 | ) | $ | (298 | ) | ||||||||||||||
| Denominator | ||||||||||||||||||||||||||||||
| Weighted-average common shares outstanding - diluted |
324,027 | 337,812 | 348,666 | 361,855 | 373,029 | (13,784 | ) | (49,001 | ) | |||||||||||||||||||||
| Adjusted EPS (2) |
$ | 1.76 | $ | 2.03 | $ | 2.02 | $ | 2.16 | $ | 2.33 | $ | (0.27 | ) | $ | (0.57 | ) | ||||||||||||||
| Core original issue discount (Core OID) amortization expense (1) |
$ | 10 | $ | 10 | $ | 9 | $ | 9 | $ | 9 | $ | — | $ | 1 | ||||||||||||||||
| Other OID |
2 | 3 | 3 | 3 | 3 | — | — | |||||||||||||||||||||||
|
|
|
|
|
|
|
|
|
|
|
|
|
|
|
|
|
|
|
|
|
| ||||||||||
| GAAP original issue discount amortization expense |
$ | 13 | $ | 13 | $ | 12 | $ | 12 | $ | 12 | $ | — | $ | 1 | ||||||||||||||||
|
|
|
|
|
|
|
|
|
|
|
|
|
|
|
|
|
|
|
|
|
| ||||||||||
| Core outstanding original issue discount balance (Core OID balance) (1) |
$ | (863 | ) | $ | (873 | ) | $ | (883 | ) | $ | (900 | ) | $ | (952 | ) | $ | 10 | $ | 89 | |||||||||||
| Other outstanding OID balance |
(39 | ) | (37 | ) | (40 | ) | (29 | ) | (32 | ) | (1 | ) | (7 | ) | ||||||||||||||||
|
|
|
|
|
|
|
|
|
|
|
|
|
|
|
|
|
|
|
|
|
| ||||||||||
| GAAP outstanding original issue discount balance |
$ | (901 | ) | $ | (911 | ) | $ | (923 | ) | $ | (929 | ) | $ | (983 | ) | $ | 9 | $ | 82 | |||||||||||
|
|
|
|
|
|
|
|
|
|
|
|
|
|
|
|
|
|
|
|
|
| ||||||||||
| GAAP net financing revenue |
[A] | $ | 1,764 | $ | 1,693 | $ | 1,654 | $ | 1,594 | $ | 1,547 | $ | 71 | $ | 217 | |||||||||||||||
| Core OID |
10 | 10 | 9 | 9 | 9 | — | 1 | |||||||||||||||||||||||
|
|
|
|
|
|
|
|
|
|
|
|
|
|
|
|
|
|
|
|
|
| ||||||||||
| Net Financing Revenue (ex. Core OID) |
[B] | $ | 1,774 | $ | 1,703 | $ | 1,663 | $ | 1,603 | $ | 1,556 | $ | 71 | $ | 218 | |||||||||||||||
|
|
|
|
|
|
|
|
|
|
|
|
|
|
|
|
|
|
|
|
|
| ||||||||||
| GAAP Other Revenue |
[C] | $ | 312 | $ | 442 | $ | 545 | $ | 391 | $ | 538 | $ | (130 | ) | $ | (226 | ) | |||||||||||||
| Repositioning |
— | — | 9 | 52 | 70 | — | (70 | ) | ||||||||||||||||||||||
| Change in the fair value of equity securities |
136 | 66 | (21 | ) | 65 | (19 | ) | 71 | 156 | |||||||||||||||||||||
|
|
|
|
|
|
|
|
|
|
|
|
|
|
|
|
|
|
|
|
|
| ||||||||||
| Adjusted Other Revenue |
[D] | $ | 448 | $ | 508 | $ | 533 | $ | 507 | $ | 588 | $ | (59 | ) | $ | (140 | ) | |||||||||||||
|
|
|
|
|
|
|
|
|
|
|
|
|
|
|
|
|
|
|
|
|
| ||||||||||
| GAAP Provision Expense |
$ | 304 | $ | 167 | $ | 210 | $ | 76 | $ | (32 | ) | $ | 137 | $ | 336 | |||||||||||||||
| Repositioning |
— | — | (97 | ) | — | — | — | — | ||||||||||||||||||||||
|
|
|
|
|
|
|
|
|
|
|
|
|
|
|
|
|
|
|
|
|
| ||||||||||
| Adjusted Provision (ex. Repositioning) |
$ | 304 | $ | 167 | $ | 113 | $ | 76 | $ | (32 | ) | $ | 137 | $ | 336 | |||||||||||||||
|
|
|
|
|
|
|
|
|
|
|
|
|
|
|
|
|
|
|
|
|
| ||||||||||
| GAAP Noninterest expense |
[E] | $ | 1,138 | $ | 1,122 | $ | 1,090 | $ | 1,002 | $ | 1,075 | $ | 16 | $ | 63 | |||||||||||||||
| Adjusted Noninterest Expense |
[F] | $ | 1,138 | $ | 1,122 | $ | 1,090 | $ | 1,002 | $ | 1,075 | $ | 16 | $ | 63 | |||||||||||||||
|
|
|
|
|
|
|
|
|
|
|
|
|
|
|
|
|
|
|
|
|
| ||||||||||
| Pre-Provision Net Revenue (PPNR) |
[A]+[C]+[E] | $ | 938 | $ | 1,013 | $ | 1,109 | $ | 983 | $ | 1,010 | $ | (75 | ) | $ | (72 | ) | |||||||||||||
| Core Pre-Provision Net Revenue (PPNR) (1) |
[B]+[D]+[F] | $ | 1,084 | $ | 1,088 | $ | 1,107 | $ | 1,108 | $ | 1,070 | $ | (4 | ) | $ | 15 | ||||||||||||||
(1) Represents a non-GAAP financial measure. See page 25 for definitions.
(2) Adjusted earnings per share (Adjusted EPS) is a non-GAAP financial measure that adjusts GAAP EPS for revenue and expense items that are typically strategic in nature or that management otherwise does not view as reflecting the operating performance of the company. Management believes Adjusted EPS can help the reader better understand the operating performance of the core businesses and their ability to generate earnings. In the numerator of Adjusted EPS, GAAP net income attributable to common shareholders is adjusted for the following items: (1) excludes discontinued operations, net of tax, as Ally is primarily a domestic company and sales of international businesses and other discontinued operations in the past have significantly impacted GAAP EPS, (2) adds back the tax-effected non-cash Core OID, (3) adjusts for tax-effected repositioning and other which are primarily related to the extinguishment of high cost legacy debt, strategic activities and significant other one-time items, (4) excludes equity fair value adjustments (net of tax) related to ASU 2016-01 which requires change in the fair value of equity securities to be recognized in current period net income as compared to periods prior to 1/1/18 in which such adjustments were recognized through other comprehensive income, a component of equity, and (5) excludes significant discrete tax items that do not relate to the operating performance of the core businesses, and adjusts for preferred stock capital actions (e.g., Series A and Series G) that have been taken by the company to normalize its capital structure, as applicable for respective periods.(3) Repositioning and other includes a $50 million Goodwill impairment at Ally Invest in 2Q20.
| 2Q 2022 Preliminary Results | 21 |
| ALLY FINANCIAL INC. ADJUSTED TANGIBLE BOOK PER SHARE RELATED INFORMATION
|
|
| ($ in millions, shares in thousands) | QUARTERLY TRENDS | CHANGE VS. | ||||||||||||||||||||||||||
|
Adjusted Tangible Book Value Per Share (“Adjusted TBVPS”) Information |
2Q 22 | 1Q 22 | 4Q 21 | 3Q 21 | 2Q 21 | 1Q 22 | 2Q 21 | |||||||||||||||||||||
| Numerator |
||||||||||||||||||||||||||||
| GAAP shareholder’s equity |
$ | 13,984 | $ | 15,413 | $ | 17,050 | $ | 17,289 | $ | 17,530 | $ | (1,429) | $ | (3,546) | ||||||||||||||
| Preferred equity |
(2,324) | (2,324) | (2,324) | (2,324) | (2,324) | — | — | |||||||||||||||||||||
| GAAP common shareholder’s equity |
$ | 11,660 | $ | 13,089 | $ | 14,726 | $ | 14,965 | $ | 15,206 | $ | (1,429) | $ | (3,546) | ||||||||||||||
| Goodwill and identifiable intangibles, net of DTLs |
(920) | (932) | (941) | (369) | (374) | 11 | (547) | |||||||||||||||||||||
|
|
|
|
|
|
|
|
|
|
|
|
|
|
|
|||||||||||||||
| Tangible common equity (1) |
10,740 | 12,157 | 13,785 | 14,596 | 14,832 | (1,418) | (4,093) | |||||||||||||||||||||
| Tax-effected Core OID balance (21% tax rate) (1) |
(682) | (690) | (698) | (711) | (752) | 8 | 70 | |||||||||||||||||||||
| Adjusted tangible book value (2) |
$ | 10,058 | $ | 11,468 | $ | 13,087 | $ | 13,885 | $ | 14,081 | $ | (1,410) | $ | (4,023) | ||||||||||||||
|
|
|
|
|
|
|
|
|
|
|
|
|
|
|
|||||||||||||||
| Denominator |
||||||||||||||||||||||||||||
| Issued shares outstanding (period-end, thousands) |
312,781 | 327,306 | 337,941 | 349,599 | 362,639 | (14,525) | (49,857) | |||||||||||||||||||||
| GAAP shareholder’s equity per share |
$ | 44.71 | $ | 47.09 | $ | 50.45 | $ | 49.45 | $ | 48.34 | $ | (2.38) | $ | (3.63) | ||||||||||||||
| Preferred equity per share |
(7.43) | (7.10) | (6.88) | (6.65) | (6.41) | (0.33) | (1.02) | |||||||||||||||||||||
| GAAP common shareholder’s equity per share |
$ | 37.28 | $ | 39.99 | $ | 43.58 | $ | 42.81 | $ | 41.93 | $ | (2.71) | $ | (4.65) | ||||||||||||||
| Goodwill and identifiable intangibles, net of DTLs per share |
(2.94) | (2.85) | (2.79) | (1.06) | (1.03) | (0.10) | (1.91) | |||||||||||||||||||||
|
|
|
|
|
|
|
|
|
|
|
|
|
|
|
|||||||||||||||
| Tangible common equity per share (1) |
34.34 | 37.14 | 40.79 | 41.75 | 40.90 | (2.81) | (6.57) | |||||||||||||||||||||
| Tax-effected Core OID balance (21% tax rate) per share (1) |
(2.18) | (2.11) | (2.06) | (2.03) | (2.07) | (0.07) | (0.11) | |||||||||||||||||||||
|
|
|
|
|
|
|
|
|
|
|
|
|
|
|
|||||||||||||||
| Adjusted tangible book value per share (2) |
$ | 32.16 | $ | 35.04 | $ | 38.73 | $ | 39.72 | $ | 38.83 | $ | (2.88) | $ | (6.67) | ||||||||||||||
|
|
|
|
|
|
|
|
|
|
|
|
|
|
|
|||||||||||||||
(1) Represents a non-GAAP financial measure. See page 25 for methodology and detail.
(2) Adjusted tangible book value per share (Adjusted TBVPS) is a non-GAAP financial measure that reflects the book value of equity attributable to shareholders even if Core OID balance were accelerated immediately through the financial statements. As a result, management believes Adjusted TBVPS provides the reader with an assessment of value that is more conservative than GAAP common shareholder’s equity per share. Adjusted TBVPS generally adjusts common equity for (1) goodwill and identifiable intangibles, net of DTLs, and (2) tax-effected Core OID balance to reduce tangible common equity in the event the corresponding discounted bonds are redeemed/tendered and (3) Series G discount which reduces tangible common equity as the company has normalized its capital structure, as applicable for respective periods.
| 2Q 2022 Preliminary Results | 22 |
| ALLY FINANCIAL INC. CORE ROTCE RELATED INFORMATION
|
|
| ($ in millions) unless noted otherwise | QUARTERLY TRENDS | CHANGE VS. | ||||||||||||||||||||||||||
| Core Return on Tangible Common Equity (“Core ROTCE”) |
2Q 22 | 1Q 22 | 4Q 21 | 3Q 21 | 2Q 21 | 1Q 22 | 2Q 21 | |||||||||||||||||||||
| Numerator |
||||||||||||||||||||||||||||
| GAAP net income attributable to common shareholders |
$ | 454 | $ | 627 | $ | 624 | $ | 683 | $ | 900 | $ | (173) | $ | (446) | ||||||||||||||
| Discontinued operations, net of tax |
— | — | 6 | — | (1) | — | 1 | |||||||||||||||||||||
| Core OID |
10 | 10 | 9 | 9 | 9 | — | 1 | |||||||||||||||||||||
| Change in the fair value of equity securities |
136 | 66 | (21) | 65 | (19) | 71 | 156 | |||||||||||||||||||||
| Core OID, repositioning & change in the fair value of equity securities tax (tax rate 21%) |
(31) | (16) | (20) | (26) | (13) | (15) | (18) | |||||||||||||||||||||
| Repositioning |
— | — | 107 | 52 | 70 | — | (70) | |||||||||||||||||||||
| Significant discrete tax items |
— | — | — | — | (78) | — | 78 | |||||||||||||||||||||
|
|
|
|
|
|
|
|
|
|
|
|
|
|
|
|
|
|
|
|
||||||||||
| Core net income attributable to common shareholders (1) |
$ | 570 | $ | 687 | $ | 705 | $ | 782 | $ | 868 | $ | (117) | $ | (298) | ||||||||||||||
| Denominator (average, $ millions) |
||||||||||||||||||||||||||||
| GAAP shareholder’s equity |
$ | 14,699 | $ | 16,232 | $ | 17,170 | $ | 17,410 | $ | 16,078 | $ | (1,533) | $ | (1,379) | ||||||||||||||
| Preferred equity |
(2,324) | (2,324) | (2,324) | (2,324) | (1,162) | — | (1,162) | |||||||||||||||||||||
| Goodwill & identifiable intangibles, net of deferred tax liabilities (“DTLs”) |
(926) | (937) | (655) | (371) | (376) | 11 | (550) | |||||||||||||||||||||
|
|
|
|
|
|
|
|
|
|
|
|
|
|
|
|
|
|
|
|
||||||||||
| Tangible common equity (1) |
$ | 11,449 | $ | 12,971 | $ | 14,190 | $ | 14,714 | $ | 14,540 | $ | (1,522) | $ | (3,091) | ||||||||||||||
| Core OID balance |
(868) | (878) | (892) | (926) | (985) | 10 | 117 | |||||||||||||||||||||
| Net deferred tax asset (“DTA”) |
(758) | (437) | (551) | (866) | (571) | (322) | (188) | |||||||||||||||||||||
|
|
|
|
|
|
|
|
|
|
|
|
|
|
|
|
|
|
|
|
||||||||||
| Normalized common equity |
$ | 9,822 | $ | 11,656 | $ | 12,747 | $ | 12,923 | $ | 12,984 | $ | (1,834) | $ | (3,162) | ||||||||||||||
| Core Return on Tangible Common Equity (2) |
23.2% | 23.6% | 22.1% | 24.2% | 26.7% | |||||||||||||||||||||||
(1) Represents a non-GAAP measure. See page 25 for methodology and detail.
(2) Core return on tangible common equity (Core ROTCE) is a non-GAAP financial measure that management believes is helpful for readers to better understand the ongoing ability of the company to generate returns on its equity base that supports core operations. For purposes of this calculation, tangible common equity is adjusted for Core OID balance and net DTA. Ally’s Core net income attributable to common shareholders for purposes of calculating Core ROTCE is based on the actual effective tax rate for the period adjusted for significant discrete tax items including tax reserve releases, which aligns with the methodology used in calculating adjusted earnings per share.
1. In the numerator of Core ROTCE, GAAP net income attributable to common shareholders is adjusted for discontinued operations net of tax, repositioning and other which is primarily related to the extinguishment of high cost legacy debt, strategic activities and significant onetime items, tax-effected Core OID, fair value adjustments (net of tax) related to ASU 2016-01, effective 1/1/2018, which requires change in the fair value of equity securities to be recognized in current period net income as compared to prior periods in which such adjustments were recognized through other comprehensive income, a component of equity, significant discrete tax items, and preferred stock capital actions, as applicable for respective periods..
2. In the denominator, GAAP shareholder’s equity is adjusted for goodwill and identifiable intangibles net of DTL, Core OID balance, and net DTA.
| 2Q 2022 Preliminary Results | 23 |
| ALLY FINANCIAL INC. ADJUSTED EFFICIENCY RATIO RELATED INFORMATION
|
|
| ($ in millions) | QUARTERLY TREND | CHANGE VS. | ||||||||||||||||||||||||||||||||||||||||
| Adjusted Efficiency Ratio Calculation | 2Q 22 | 1Q 22 | 4Q 21 | 3Q 21 | 2Q 21 | 1Q 22 | 2Q 21 | |||||||||||||||||||||||||||||||||||
| Numerator |
||||||||||||||||||||||||||||||||||||||||||
| GAAP Noninterest expense | $ | 1,138 | $ | 1,122 | $ | 1,090 | $ | 1,002 | $ | 1,075 | $ | 16 | $ | 63 | ||||||||||||||||||||||||||||
| Rep and warrant expense |
— | — | — | — | — | — | — | |||||||||||||||||||||||||||||||||||
| Insurance expense |
(300 | ) | (274 | ) | (263 | ) | (273 | ) | (272 | ) | (26 | ) | (28 | ) | ||||||||||||||||||||||||||||
| Adjusted noninterest expense for the efficiency ratio | $ | 838 | $ | 848 | $ | 827 | $ | 729 | $ | 803 | $ | (10 | ) | $ | 35 | |||||||||||||||||||||||||||
| Denominator |
||||||||||||||||||||||||||||||||||||||||||
| Total net revenue |
$ | 2,076 | $ | 2,135 | $ | 2,199 | $ | 1,985 | $ | 2,085 | $ | (59 | ) | $ | (9 | ) | ||||||||||||||||||||||||||
| Core OID |
10 | 10 | 9 | 9 | 9 | — | 1 | |||||||||||||||||||||||||||||||||||
| Insurance revenue |
(178 | ) | (287 | ) | (354 | ) | (297 | ) | (359 | ) | 109 | 181 | ||||||||||||||||||||||||||||||
| Repositioning |
— | — | 9 | 52 | 70 | — | (70 | ) | ||||||||||||||||||||||||||||||||||
| Adjusted net revenue for the efficiency ratio | $ | 1,908 | $ | 1,858 | $ | 1,864 | $ | 1,749 | $ | 1,805 | $ | 50 | $ | 103 | ||||||||||||||||||||||||||||
| Adjusted Efficiency Ratio (1) | 43.9 | % | 45.6 | % | 44.4 | % | 41.7 | % | 44.5 | % | ||||||||||||||||||||||||||||||||
(1) Adjusted efficiency ratio is a non-GAAP financial measure that management believes is helpful to readers in comparing the efficiency of its core banking and lending businesses with those of its peers. In the numerator of Adjusted efficiency ratio, total noninterest expense is adjusted for Insurance segment expense, Rep and warrant expense, and repositioning and other which is primarily related to the extinguishment of high cost legacy debt, strategic activities and significant one-time items, as applicable for respective periods. In the denominator, total net revenue is adjusted for Insurance segment revenue and Core OID. See page 11 for the combined ratio for the Insurance segment which management uses as a primary measure of underwriting profitability for the Insurance business.
| 2Q 2022 Preliminary Results | 24 |
| ALLY FINANCIAL INC.
|
|
The following are non-GAAP financial measures which Ally believes are important to the reader of the Consolidated Financial Statements, but which are supplemental to, and not a substitute for, GAAP measures: Adjusted Earnings per Share (Adjusted EPS), Core pre tax income, Core net income attributable to common shareholders, Core return on tangible common equity (Core ROTCE), Adjusted efficiency ratio, Adjusted total net revenue, Adjusted other revenue, Adjusted noninterest expense, Core original issue discount (Core OID) amortization expense and Core outstanding original issue discount balance (Core OID balance), Net financing revenue (excluding Core OID), and Adjusted tangible book value per share (Adjusted TBVPS). These measures are used by management and we believe are useful to investors in assessing the company’s operating performance and capital. For calculation methodology, refer to the Reconciliation to GAAP later in this document.
1) Core pre-tax income is a non-GAAP financial measure that adjusts pre-tax income from continuing operations by excluding (1) Core OID, and (2) equity fair value adjustments related to ASU 2016-01 which requires change in the fair value of equity securities to be recognized in current period net income as compared to periods prior to 1/1/18 in which such adjustments were recognized through other comprehensive income, a component of equity (change in fair value of equity securities impacts the Insurance and Corporate Finance segments), and (3) Repositioning and other which are primarily related to the extinguishment of high cost legacy debt, strategic activities and significant other one-time items, as applicable for respective periods or businesses. Management believes core pre-tax income can help the reader better understand the operating performance of the core businesses and their ability to generate earnings. See page 5 for calculation methodology and details.
2) Core net income attributable to common shareholders is a non-GAAP financial measure that serves as the numerator in the calculations of Adjusted EPS and Core ROTCE and that, like those measures, is believed by management to help the reader better understand the operating performance of the core businesses and their ability to generate earnings. Core net income attributable to common shareholders adjusts GAAP net income attributable to common shareholders for discontinued operations net of tax, tax-effected Core OID expense, tax-effected repositioning and other primarily related to the extinguishment of high-cost legacy debt and strategic activities and significant other, preferred stock capital actions, significant discrete tax items and tax-effected changes in equity investments measured at fair value, as applicable for respective periods. See page 21 calculation methodology and details.
3) Tangible Common Equity is a non-GAAP financial measure that is defined as common stockholders’ equity less goodwill and identifiable intangible assets, net of deferred tax liabilities. Ally considers various measures when evaluating capital adequacy, including tangible common equity. Ally believes that tangible common equity is important because we believe readers may assess our capital adequacy using this measure. Additionally, presentation of this measure allows readers to compare certain aspects of our capital adequacy on the same basis to other companies in the industry. For purposes of calculating Core return on tangible common equity (Core ROTCE), tangible common equity is further adjusted for Core OID balance and net deferred tax asset. See page 22 for more details.
4) Core original issue discount (Core OID) amortization expense is a non-GAAP financial measure for OID and is believed by management to help the reader better understand the activity removed from: Core pre-tax income (loss), Core net income (loss) attributable to common shareholders, Adjusted EPS, Core ROTCE, Adjusted efficiency ratio, Adjusted total net revenue, and Net financing revenue (excluding Core OID). Core OID is primarily related to bond exchange OID which excludes international operations and future issuances. Core OID for all periods shown is applied to the pre-tax income of the Corporate and Other segment. See page 21 calculation methodology and details.
5) Core outstanding original issue discount balance (Core OID balance) is a non-GAAP financial measure for outstanding OID and is believed by management to help the reader better understand the balance removed from Core ROTCE and Adjusted TBVPS. Core OID balance is primarily related to bond exchange OID which excludes international operations and future issuances. See page 21 for calculation methodology and details
6) Accelerated issuance expense (Accelerated OID) is the recognition of issuance expenses related to calls of redeemable debt.
7) Estimated impact of CECL on regulatory capital per final rule issued by U.S. banking agencies - In December 2018, the FRB and other U.S. banking agencies approved a final rule to address the impact of CECL on regulatory capital by allowing BHCs and banks, including Ally, the option to phase in the day-one impact of CECL over a three-year period. In March 2020, the FRB and other U.S. banking agencies issued an interim final rule that became effective on March 31, 2020 and provided an alternative option for banks to temporarily delay the impacts of CECL, relative to the incurred loss methodology for estimating the allowance for loan losses, on regulatory capital. A final rule that was largely unchanged from the March 2020 interim final rule was issued by the FRB and other U.S. banking agencies in August 2020, and became effective in September 2020. For regulatory capital purposes, these rules permitted us to delay recognizing the estimated impact of CECL on regulatory capital until after a two-year deferral period, which for us extended through December 31, 2021. Beginning on January 1, 2022, we are required to phase in 25% of the previously deferred estimated capital impact of CECL, with an additional 25% to be phased in at the beginning of each subsequent year until fully phased in by the first quarter of 2025. Under these rules, firms that adopt CECL and elect the five-year transition will calculate the estimated impact of CECL on regulatory capital as the day-one impact of adoption plus 25% of the subsequent change in allowance during the two-year deferral period, which according to the final rule approximates the impact of CECL relative to an incurred loss model. We adopted this transition option during the first quarter of 2020, and beginning January 1, 2022, are phasing in the regulatory capital impacts of CECL based on this five-year transition period.
8) Change in fair value of equity securities impacts the Insurance, Corporate Finance and Corporate and Other segments. Reflects equity fair value adjustments related to ASU 2016-01 which requires change in the fair value of equity securities to be recognized in current period net income as compared to periods prior to 1/1/18 in which such adjustments were recognized through other comprehensive income, a component of equity.
9) Repositioning is primarily related to the extinguishment of high-cost legacy debt, strategic activities and other one-time items.
10) Core pre-provision net revenue (Core PPNR) is a non-GAAP financial measure calculated by adjusting Core pre-tax income to add back provision for credit losses. Management believes that Core PPNR is a helpful financial metric because it enables the reader to assess the core businesses ability to generate earnings to cover credit losses and is utilized by the Federal Reserve’s approach to modeling within the Supervisory Stress Test Framework that generally follows U.S. generally accepted accounting principles (GAAP) and includes a calculation of PPNR as a component of projected pre-tax net income. See page 21 for calculation detail.
| 2Q 2022 Preliminary Results | 25 |