
Form 8-K MACK CALI REALTY CORP For: Feb 25
Exhibit 99.1

1 Supplemental Operating and Financial Data 4Q2020 February 25, 2021

Table of Contents ▪ Company Highlights Page ▪ Company Overview 4 ▪ Key Financial Metrics 6 ▪ Business Segment Disclosure 7 ▪ Financial Schedules 9 ▪ Debt Statistics 19 ▪ Unconsolidated Joint Ventures 23 ▪ Transaction Activity 24 ▪ Multifamily Portfolio ▪ Operating Schedules 26 ▪ Financial Statements 29 ▪ Office Portfolio ▪ Property Listing 32 ▪ Operating Schedules 33 4Q 2020 2 This Supplemental Operating and Financial Data should be read in connection with the company’s fourth quarter 2020 earnings press release (included as Exhibit 99 . 2 of the company’s Current Report on Form 8 - K, filed on February 25 , 2021 ) as certain disclosures, definitions and reconciliations in such announcement have not been included in this Supplemental Operating and Financial Data . The Upton – Short Hills, NJ (In - Construction) RiverHouse 9 - Weehawken, NJ (In - Construction) The Capstone – West New York, NJ (In - Construction)

3 Company Highlights 4Q 2020 3

Company Overview 4 4Q 2020 Corporate Profile Mack - Cali (CLI) is a fully integrated REIT with a dual asset platform comprised of residential holdings and waterfront office . We are geographically focused on the high barrier - to - entry Hudson River waterfront targeting cash flow growth through all economic cycles . Company Objectives Mack - Cali’s residential portfolio, via our Roseland Residential platform, is a market - leading residential developer and owner of class A properties . We have experienced and expect continued growth and cash flow contribution from our residential holdings as our development pipeline of active construction projects and planned starts is put into service . Mack - Cali’s office portfolio strives to achieve the highest possible rents in select markets with a continuous focus on improving the quality of our portfolio . CLI Company Highlights Harborside Atrium Jersey City, NJ Notes: 1) % Leased Adjusted refers to the exclusion of Transition Assets (BLVD 475 and BLVD 425) from the stabilized operating portfoli o. Key Statistics 4Q 2020 3Q 2020 Company Market Capitalization $4.6 billion $4.7 billion Core FFO $16.2 million $29.9 million Core FFO Per Diluted Share $0.16 $0.30 AFFO $3.3 million $21.8 million Residential Portfolio Operating Units/Keys 6,197 6,896 % Leased 90.2% 89.5% % Physical Occupancy 86.9% 86.3% % Leased Adjusted (1) 92.0% 91.7% Average Rent Per Unit $3,014 $2,996 In-Construction Units 1,616 1,942 Land Bank Units 8,555 9,507 Office Portfolio Square Feet of Office Space 7.9 million 8.3 million Consolidated In-Service Properties 22 26 % Leased Office 78.7% 78.2% % Commenced Occupancy 76.9% 76.9% Cash Rental Rate Roll-Up (5.4%) 12.3% GAAP Rental Rate Roll-Up (2.2%) 22.3% Average In-Place Rent Per Square Foot $40.04 $37.23

5 4Q 2020 Company Achievements CLI Company Highlights 101 Hudson, Jersey City, NJ 4 Q 2020 Performance Highlights • Achieved Core FFO of $ 16 . 2 million, or $ 0 . 16 per share • Produced AFFO of $ 3 . 3 million • Residential : The operating portfolio finished 4 Q at 90 . 2 % leased • Office : Leased 114 , 506 square feet of office space ; finished 4 Q at 78 . 7 % leased 4 Q 2020 Transaction Activity • Since October 1 , 2020 , the Company has completed the sales of 5 office buildings across its Suburban portfolio, totaling 760 , 730 square feet, and land for gross purchase prices totaling $ 129 . 3 million (implying net sale proceeds of $ 111 . 0 million) • On October 21 , 2020 , the Company completed the sale of 5 Vaughn Drive, a 98 , 500 square - foot office building in Princeton, NJ, for a gross purchase price of $ 7 . 5 million • On November 18 , 2020 , the Company completed the sale of 7 Campus Drive, a 154 , 395 square - foot office building in Parsippany, NJ, for a gross purchase price of $ 12 . 8 million • On December 3 , 2020 , the Company completed the sale of 581 Main St . , a 200 , 000 square - foot office building in Woodbridge, NJ, for a gross purchase price of $ 61 . 0 million • On December 18 , 2020 , the Company completed the sale of 14 & 16 Skyline, a land site in Hawthorne, NY, for a gross purchase price of $ 3 . 0 million • On December 22 , 2020 , the Company completed the sale of 500 College Road East, a 158 , 235 square - foot office building in Princeton, NJ, for a gross purchase price of $ 10 . 0 million (CLI share of net sale proceeds : $ 4 . 9 million after ground lease buy - out) • On January 14 , 2021 , subsequent to quarter - end, the Company completed the sale of 100 Overlook Center, a 149 , 600 square - foot office building in Princeton, NJ, for a gross purchase price of $ 38 . 0 million (CLI share of sale proceeds : $ 24 . 8 million after contributor unit retirement) • Since October 1 , 2020 , the Company has completed the sales of 3 residential buildings and land, totaling 1 , 025 units and approximately 913 buildable units, for gross purchase prices totaling $ 427 . 8 million (CLI share of net sale proceeds : $ 82 . 9 million) • On December 17 , 2020 , the Company completed the sale of its 50 % interest in Hillsborough, a land site in Hillsborough, NJ, to its joint venture partner for a gross purchase price of $ 4 . 2 million (CLI’s net sale proceeds : $ 2 . 1 million) • On December 23 , 2020 , the Company completed the sale of Riverwatch, a 200 - unit residential community in New Brunswick, NJ, for a gross purchase price of $ 47 . 0 million (CLI share of sale proceeds : $ 17 . 0 million after mortgage debt repayment) • On December 31 , 2020 , the unconsolidated joint venture in which the Company participates completed the sale of Crystal House, an 825 - unit residential community in Arlington, VA, for a gross purchase price of $ 336 . 6 million (CLI’s 25 % share of sale proceeds : $ 43 . 8 million after mortgage debt retirement) • On December 31 , 2020 , the unconsolidated joint venture in which the Company participates completed the sale of Crystal House Land, developable land sites in Arlington, VA, for a gross purchase price of $ 40 . 0 million (CLI’s 50 % share of sale proceeds : $ 20 . 0 million) 4 Q 2020 Financing Activity • On November 10 , 2020 , the Company replaced its expiring $ 165 . 0 million mortgage on BLVD 475 with a new $ 165 . 0 million mortgage with a maturity date in November of 2027 . • On December 11 , 2020 , the Company replaced its construction loan ( $ 56 . 0 million drawn at retirement) on The Emery development with a new $ 72 . 0 million mortgage with a maturity date in January 2031 . 4 Q 2020 Office Leasing Activity • Completed 6 , 068 sf . of waterfront office leasing • Completed 116 , 506 sf . of leasing in the class A suburban and suburban portfolios, including a renewal with Bank of America Merrill Lynch in Short Hills Urby , Jersey City, NJ

6 4Q 2020 Key Financial Metrics $ in thousands, except per share amounts and ratios Notes: See supporting “Key Financial Metrics” notes on page 36. CLI Company Highlights 4Q 2020 3Q 2020 2Q 2020 1Q 2020 4Q 2019 Core FFO per Diluted Share (1) 0.16 0.30 0.28 0.33 0.44 Net Income / (Loss) per Diluted Share 0.67 (0.49) (0.41) (0.47) (0.64) Market Value of Equity (2) $1,250,504 $1,266,854 $1,531,798 $1,524,747 $2,821,175 → Common Equity (Includes OP Units) 1,763,801 1,778,206 2,040,913 2,031,563 2,317,793 → Preferred Equity (Rockpoint) 460,973 459,028 456,791 454,492 451,058 → OP Equity (Preferred OPs) 52,324 52,324 52,324 52,324 52,324 → Book Value of JV Minority Interest 44,772 45,529 46,737 47,336 47,296 Total Debt, Net 2,801,797 2,895,882 2,990,464 2,877,121 2,808,518 Total Market Capitalization 4,610,370 4,719,617 5,078,114 4,956,020 5,676,989 Shares and Units: Common Shares Outstanding 90,712,417 90,712,055 90,596,723 90,596,079 90,595,176 Common Units Outstanding 9,649,031 9,672,558 9,586,528 9,518,638 9,612,064 Combined Shares and Units 100,361,448 100,384,613 100,183,251 100,114,717 100,207,240 Weighted Average - Diluted (2) 100,338,165 100,306,910 100,212,820 100,183,392 100,264,388 Common Share Price ($’s): At the End of the Period $12.46 $12.62 $15.29 $15.23 $23.13 High During Period 14.67 15.85 18.83 23.89 23.40 Low During Period 10.41 12.14 12.90 13.83 19.96 Dividends Declared per Share 0.00 0.00 0.20 0.20 0.20 Debt Ratios: Net Debt to Adjusted EBITDA 15.8x 12.1x 13.0x 11.5x 9.7x → Net Debt to Adjusted EBITDA - Less CIP Debt 14.4x 10.7x 11.8x 10.7x 9.5x → Net Debt to Adjusted EBITDA - Office Portfolio 10.1x 7.9x 9.1x 8.6x 8.2x → Net Debt to Adjusted EBITDA - Residential Portfolio 25.2x 20.4x 20.9x 16.6x 11.8x → Net Debt to Adjusted EBITDA - Residential Portfolio Less CIP Debt 21.4x 16.0x 17.2x 14.3x 11.4x Interest Coverage Ratio 2.1x 2.7x 2.6x 2.8x 3.0x Fixed Charge Coverage Ratio 1.3x 1.7x 1.7x 1.8x 2.0x Total Debt/Total Market Capitalization 60.8% 61.4% 58.9% 58.1% 49.5% Total Debt/Total Book Capitalization 54.4% 55.8% 55.7% 54.4% 53.1% Total Debt/Total Undepreciated Assets 48.3% 49.8% 50.2% 49.0% 48.0% Secured Debt/Total Undepreciated Assets 38.0% 37.3% 35.1% 34.5% 32.6%

7 4Q 2020 Business Segments – Residential $ in millions Notes: 1) See Page 28 for additional information on In - Construction Properties . 2) Values for Land Held for Development are derived by multiplying (a) a market - rate value per developable unit by (b) each parcel’s density potential as governed by local zoning codes or existing in - place site plan approvals . 3) See Page 27 for additional information on Commercial Properties within Roseland . CLI Company Highlights Roseland's Residential Portfolio Units Ownership Low High 100% Roseland's share Occupancy 100% Roseland's share Operating Properties - Wholly-Owned/Consolidated 4,039 95.4% 4.35% - 4.65% $66.7 $63.6 85.2% $103.5 $98.7 Operating Properties - Unconsolidated JVs 1,786 57.9% 4.35% - 4.55% 29.4 17.0 90.8% 41.1 23.8 In-Construction Properties (1) 1,616 86.6% 4.50% - 4.70% 0.0 0.0 N/A 55.7 48.2 Commercial Assets (3) 80.9% 0.8 0.6 69.9% 7.1 5.8 Hotels 372 100.0% (3.4) (3.4) N/A 8.9 8.9 Balance Sheet and Other Items Other Assets At Estimated Market Value Market Value Land Held for Development (2) 8,555 $45,000 -$55,000 Fee Income Business & Tax Credits 31 At Book Value Book Value Cash and Cash Equivalents 12 Restricted Cash 11 Rent and Account Receivables 7 Other Assets 34 Debt Operating Properties - Wholly-Owned/Consolidated Debt, Net (1,253) Operating Properties - Unconsolidated JVs Debt at Share (263) In-Construction Properties - Wholly-Owned Debt (250) In-Construction Properties - Unfunded Wholly-Owned Debt (to Achieve Stabilization) (206) In-Construction Properties - Unconsolidated JV Debt at Share (30) In-Construction Properties - Unfunded Unconsolidated JV Debt at Share (to Achieve Stabilization) (15) Hotels - Wholly-Owned Debt (94) Other Liabilities Accounts and Other Payables (90) Rockpoint Interest (461) Per Unit Value Range Annualized In-Place NOI* Stabilized NOI* Components of Net Asset Value Stabilized Cap Rate

Business Segments – Office 8 4Q 2020 $ in millions CLI Company Highlights Notes: 1) NOI excludes straight - lining of rents and FAS 141 adjustments . 2) Various assets within the Class A Suburban and Suburban portfolios are under contract for sale for estimated total gross proceeds in a range of $ 600 - $ 625 million . These various assets total 2 , 993 , 049 square feet . 3) Represents the Hyatt Regency in Jersey City, which is not part of Roseland . 4) Estimated market values for Land Held for Development are based on the estimated buildable SF and marketable units at estimated market pricing . The low range assumes 90 . 0 % of the high range of value . Annualized In-Place NOI* (1) Office Portfolio MSF Ownership At Share Occupancy Hudson Waterfront (Jersey City, Hoboken) 4.908 100.0% $70.7 77.3% Class A Suburban (Metropark, Short Hills) (2) 1.755 100.0% 34.8 86.6% Suburban (2) 1.624 100.0% 15.4 74.2% Office JVs 0.246 41.9% 1.3 97.1% Retail 0.191 100.0% 1.3 N/A Hotel (3) 351 units 50.0% (3.3) N/A Balance Sheet and Other Items Other Assets At Estimated Market Value Low High Land Held for Development (4) $103.7 $115.3 At book value Book Value Cash and Cash Equivalents 26 Restricted Cash 3 Rent and Account Receivables 87 Other Assets 171 Debt Unsecured Revolving Credit Facility (25) Senior Unsecured Notes, Net (573) Consolidated Property Debt (521) Unconsolidated Property Debt at Share (53) Other Liabilities Accounts and Other Payables (149) Preferred Equity/LP Interests (53) Common Stock and Operating Partnership Units Outstanding Shares of Common Stock and Operating Partnership Units 100 Components of Net Asset Value

9 4Q 2020 Balance Sheet $ in thousands (unaudited) Notes: See supporting “Balance Sheet” notes on page 36 for more information. CLI Company Highlights 4Q 2019 ASSETS Office/Corp. Roseland Elim./Other Total Rental property Land and leasehold interests $66,553 $323,139 - $389,692 $385,010 Buildings and improvements 1,081,802 1,854,269 - 2,936,071 2,872,270 Tenant improvements 168,100 3,522 - 171,622 163,299 Furniture, fixtures and equipment 6,675 76,878 - 83,553 78,716 Land and improvements held for development 15,518 308,627 - 324,145 299,338 Development and construction in progress 130,793 602,767 - 733,560 458,048 1,469,441 3,169,202 - 4,638,643 4,256,681 Less – accumulated depreciation and amortization (515,555) (140,776) - (656,331) (558,617) 953,886 3,028,426 - 3,982,312 3,698,064 Rental property held for sale, net 656,963 - - 656,963 966,497 Net Investment in Rental Property 1,610,849 3,028,426 - 4,639,275 4,664,561 Cash and cash equivalents 25,987 12,109 - 38,096 25,589 Restricted cash 3,009 11,198 - 14,207 15,577 Investments in unconsolidated joint ventures 5,555 156,827 - 162,382 209,091 Unbilled rents receivable, net 80,794 4,113 - 84,907 95,686 Deferred charges, goodwill and other assets, net (1) (2) 165,541 34,000 - 199,541 275,102 Accounts receivable 6,536 2,842 - 9,378 7,192 Total Assets $1,898,271 $3,249,515 $0 $5,147,786 $5,292,798 LIABILITIES & EQUITY Senior unsecured notes, net $572,653 - - $572,653 $571,484 Unsecured revolving credit facility and term loans 25,000 - - 25,000 329,000 Mortgages, loans payable and other obligations, net 521,377 1,682,767 - 2,204,144 1,908,034 Dividends and distributions payable 1,493 - - 1,493 22,265 Accounts payable, accrued expenses and other liabilities 114,700 80,017 - 194,717 209,510 Rents received in advance and security deposits 27,700 6,401 - 34,101 39,463 Accrued interest payable 5,965 4,036 - 10,001 10,185 Total Liabilities $1,268,888 $1,773,221 $0 $3,042,109 $3,089,941 Commitments and contingencies Redeemable noncontrolling interests 52,324 460,973 - 513,297 503,382 Total Stockholders’/Members Equity 428,506 970,311 - 1,398,817 1,493,699 Noncontrolling interests in subsidiaries: Operating Partnership 148,791 - - 148,791 158,480 Consolidated joint ventures (238) 45,010 - 44,772 47,296 Total Noncontrolling Interests in Subsidiaries 148,553 45,010 - 193,563 205,776 Total Equity 577,059 1,015,321 - 1,592,380 1,699,475 Total Liabilities and Equity $1,898,271 $3,249,515 $0 $5,147,786 $5,292,798 4Q 2020
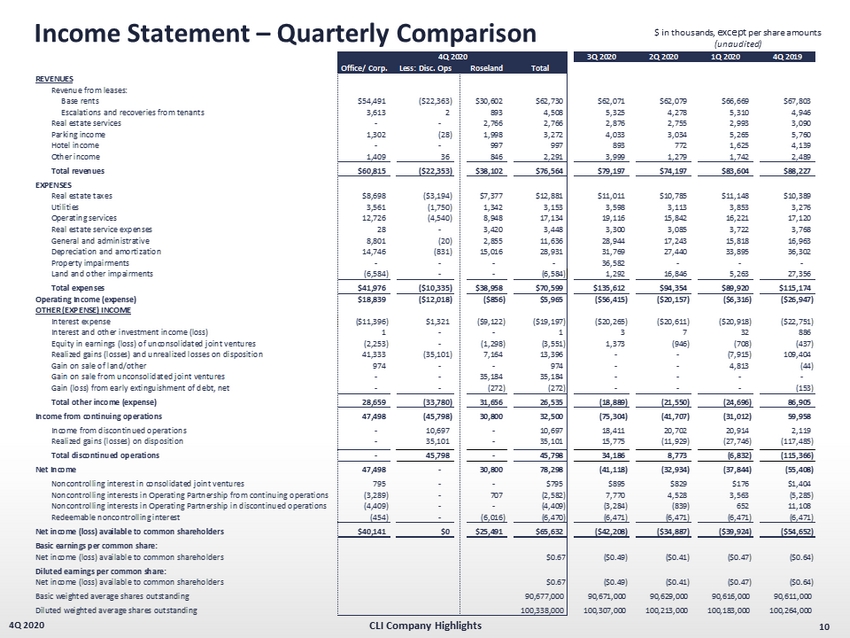
10 4Q 2020 Income Statement – Quarterly Comparison $ in thousands, except per share amounts (unaudited) CLI Company Highlights 3Q 2020 2Q 2020 1Q 2020 4Q 2019 Office/ Corp. Less: Disc. Ops Roseland Total REVENUES Revenue from leases: Base rents $54,491 ($22,363) $30,602 $62,730 $62,071 $62,079 $66,669 $67,803 Escalations and recoveries from tenants 3,613 2 893 4,508 5,325 4,278 5,310 4,946 Real estate services - - 2,766 2,766 2,876 2,755 2,993 3,090 Parking income 1,302 (28) 1,998 3,272 4,033 3,034 5,265 5,760 Hotel income - - 997 997 893 772 1,625 4,139 Other income 1,409 36 846 2,291 3,999 1,279 1,742 2,489 Total revenues $60,815 ($22,353) $38,102 $76,564 $79,197 $74,197 $83,604 $88,227 EXPENSES Real estate taxes $8,698 ($3,194) $7,377 $12,881 $11,011 $10,785 $11,148 $10,389 Utilities 3,561 (1,750) 1,342 3,153 3,598 3,113 3,853 3,276 Operating services 12,726 (4,540) 8,948 17,134 19,116 15,842 16,221 17,120 Real estate service expenses 28 - 3,420 3,448 3,300 3,085 3,722 3,768 General and administrative 8,801 (20) 2,855 11,636 28,944 17,243 15,818 16,963 Depreciation and amortization 14,746 (831) 15,016 28,931 31,769 27,440 33,895 36,302 Property impairments - - - - 36,582 - - - Land and other impairments (6,584) - - (6,584) 1,292 16,846 5,263 27,356 Total expenses $41,976 ($10,335) $38,958 $70,599 $135,612 $94,354 $89,920 $115,174 Operating Income (expense) $18,839 ($12,018) ($856) $5,965 ($56,415) ($20,157) ($6,316) ($26,947) OTHER (EXPENSE) INCOME Interest expense ($11,396) $1,321 ($9,122) ($19,197) ($20,265) ($20,611) ($20,918) ($22,751) Interest and other investment income (loss) 1 - - 1 3 7 32 886 Equity in earnings (loss) of unconsolidated joint ventures (2,253) - (1,298) (3,551) 1,373 (946) (708) (437) Realized gains (losses) and unrealized losses on disposition 41,333 (35,101) 7,164 13,396 - - (7,915) 109,404 Gain on sale of land/other 974 - - 974 - - 4,813 (44) Gain on sale from unconsolidated joint ventures - - 35,184 35,184 - - - - Gain (loss) from early extinguishment of debt, net - - (272) (272) - - - (153) Total other income (expense) 28,659 (33,780) 31,656 26,535 (18,889) (21,550) (24,696) 86,905 Income from continuing operations 47,498 (45,798) 30,800 32,500 (75,304) (41,707) (31,012) 59,958 Income from discontinued operations - 10,697 - 10,697 18,411 20,702 20,914 2,119 Realized gains (losses) on disposition - 35,101 - 35,101 15,775 (11,929) (27,746) (117,485) Total discontinued operations - 45,798 - 45,798 34,186 8,773 (6,832) (115,366) Net Income 47,498 - 30,800 78,298 (41,118) (32,934) (37,844) (55,408) Noncontrolling interest in consolidated joint ventures 795 - - $795 $895 $829 $176 $1,404 Noncontrolling interests in Operating Partnership from continuing operations (3,289) - 707 (2,582) 7,770 4,528 3,563 (5,285) Noncontrolling interests in Operating Partnership in discontinued operations (4,409) - - (4,409) (3,284) (839) 652 11,108 Redeemable noncontrolling interest (454) - (6,016) (6,470) (6,471) (6,471) (6,471) (6,471) Net income (loss) available to common shareholders $40,141 $0 $25,491 $65,632 ($42,208) ($34,887) ($39,924) ($54,652) Basic earnings per common share: Net income (loss) available to common shareholders $0.67 ($0.49) ($0.41) ($0.47) ($0.64) Diluted earnings per common share: Net income (loss) available to common shareholders $0.67 ($0.49) ($0.41) ($0.47) ($0.64) Basic weighted average shares outstanding 90,677,000 90,671,000 90,629,000 90,616,000 90,611,000 Diluted weighted average shares outstanding 100,338,000 100,307,000 100,213,000 100,183,000 100,264,000 4Q 2020

FFO & Core FFO – Quarterly Comparison 11 4Q 2020 $ in thousands, except per share amounts and ratios (unaudited) Notes: See footnotes and “Information About FFO, Core FFO, AFFO & Adjusted EBITDA” on page 17. CLI Company Highlights 4Q 2020 3Q 2020 2Q 2020 1Q 2020 4Q 2019 Net income (loss) available to common shareholders $65,632 ($42,208) ($34,887) ($39,924) ($54,652) Add (deduct): Noncontrolling interest in Operating Partnership 2,582 (7,770) (4,528) (3,563) 5,285 Noncontrolling interests in discontinued operations 4,409 3,284 839 (652) (11,108) Real estate-related depreciation and amortization on continuing operations (1) 30,960 34,764 30,297 36,795 39,550 Real estate-related depreciation and amortization on discontinued operations 831 1,267 1,354 1,354 21,381 Property impairments on continuing operations - 36,582 - - - Property impairments on discontinued operations - - - - Impairment of unconsolidated joint venture investment (included in Equity in earnings) 2,562 - - - 3,661 Gain on sale from unconsolidated joint ventures (35,184) - - - - Continuing operations: Realized (gains) and unrealized losses on disposition of rental property, net (13,396) - - 7,915 (109,404) Discontinued operations: Realized (gains) loss and unrealized losses on disposition of rental property, net (35,101) (15,775) 11,929 27,746 117,485 Funds from operations (2) $23,295 $10,144 $5,004 $29,671 $12,198 Add/(Deduct): (Gain)/Loss from extinguishment of debt, net $272 - - - $153 Dead deal costs - 2,583 277 - - Land and other impairments (6,584) 1,292 16,846 5,263 27,356 Gain on disposition of developable land (974) - - (4,813) 44 Severance/separation costs on management restructuring 191 8,900 891 1,947 - Reporting system conversion costs - - - 363 998 Strategic direction costs - - - - 4,629 Proxy fight costs - 6,954 5,017 799 - Noncontrolling interest share on consolidated joint ventures impairment charges - - - - (1,263) Core FFO $16,200 $29,873 $28,035 $33,320 $44,115 Diluted weighted average shares/units outstanding (7) 100,338,000 100,307,000 100,213,000 100,183,000 100,264,000 Funds from operations per share-diluted $0.23 $0.10 $0.05 $0.30 $0.12 Core Funds from Operations per share/unit-diluted $0.16 $0.30 $0.28 $0.33 $0.44 Dividends declared per common share $0.00 $0.00 $0.20 $0.20 $0.20

AFFO & Adjusted EBITDA – Quarterly Comparison 12 4Q 2020 $ in thousands, except per share amounts and ratios (unaudited) CLI Company Highlights Notes: See footnotes and “Information About FFO, Core FFO, AFFO & Adjusted EBITDA” on page 17. 4Q 2020 3Q 2020 2Q 2020 1Q 2020 4Q 2019 Core FFO (calculated on previous page) $16,200 $29,873 $28,035 $33,230 $44,115 Add (Deduct) Non-Cash Items: Straight-line rent adjustments (3) ($2,184) ($467) $856 ($2,132) ($4,084) Amortization of market lease intangibles, net (4) (1,048) (858) (857) (946) (1,116) Amortization of lease inducements (21) (40) 59 57 (15) Amortization of stock compensation 2,019 799 2,496 2,612 2,192 Non-real estate depreciation and amortization 342 336 482 450 431 Amortization of debt discount/(premium) and mark-to-market, net (373) (238) (238) (238) (237) Amortization of deferred financing costs 1,467 1,074 1,060 1,020 1,147 Deduct: Non-incremental revenue generating capital expenditures: Building improvements (4,365) (2,975) (1,104) (3,247) (6,012) Tenant improvements and leasing commissions (5) (6,248) (4,057) (2,897) (8,093) (9,354) Tenant improvements and leasing commissions on space vacant for more than one year (2,479) (1,627) (6,068) (2,958) (888) Adjusted FFO (2) $3,310 $21,821 $21,824 $19,755 $26,179 Core FFO (calculated on previous page) $16,200 $29,873 $28,035 $33,230 $44,115 Deduct: Equity in earnings (loss) of unconsolidated joint ventures, net $989 ($1,373) $946 $708 ($3,223) Equity in earnings share of depreciation and amortization (2,371) (3,331) (3,340) (3,350) (3,678) Add-back: Interest expense 20,518 21,586 21,919 22,226 24,072 Recurring JV distributions 2,432 6,425 3,682 2,459 5,123 Income (loss) in noncontrolling interest in consolidated joint ventures (795) (895) (830) (176) (1,404) Redeemable noncontrolling interest 6,471 6,471 6,471 6,471 6,471 Income tax expense 72 84 34 6 0 Adjusted EBITDA $43,515 $58,840 $56,917 $61,574 $71,476 Net debt at period end (6) $2,749,493 $2,858,504 $2,950,026 $2,835,993 $2,767,351 Net debt to Adjusted EBITDA 15.8x 12.1x 13.0x 11.5x 9.7x

13 4Q 2020 Income Statement – Year - to - Date Comparison $ in thousands, except per share amounts (unaudited) CLI Company Highlights All Operations Less: Disc. Ops Total All Operations Less: Disc. Ops Total REVENUES Revenue from leases: Base rents $378,543 ($124,994) $253,549 $431,369 ($153,325) $278,044 Escalations and recoveries from tenants 29,262 (9,841) 19,421 38,526 (14,161) 24,365 Real estate services 11,390 - 11,390 13,873 - 13,873 Parking income 15,777 (173) 15,604 22,078 (221) 21,857 Hotel income 4,287 - 4,287 9,841 - 9,841 Other income 9,218 93 9,311 11,187 (1,965) 9,222 Total revenues $448,477 ($134,915) $313,562 $526,874 ($169,672) $357,202 EXPENSES Real estate taxes $63,476 ($17,651) $45,825 $65,778 ($20,961) $44,817 Utilities 24,080 (10,363) 13,717 32,121 (14,240) 17,881 Operating services 94,371 (26,058) 68,313 104,197 (33,788) 70,409 Real estate service expenses 13,555 - 13,555 15,918 - 15,918 General and administrative 73,698 (57) 73,641 59,861 (56) 59,805 Depreciation and amortization 126,841 (4,806) 122,035 204,618 (71,021) 133,597 Property impairments 36,582 - 36,582 - - - Land and other impairments 16,817 - 16,817 32,444 - 32,444 Total expenses $449,420 ($58,935) $390,485 $514,937 ($140,066) $374,871 Operating Income (expense) ($943) ($75,980) ($76,923) $11,937 ($29,606) ($17,669) OTHER (EXPENSE) INCOME Interest expense ($86,248) $5,257 ($80,991) ($95,812) $5,243 ($90,569) Interest and other investment income (loss) 44 (1) 43 2,415 (3) 2,412 Equity in earnings (loss) of unconsolidated joint ventures (3,832) - (3,832) (1,319) - (1,319) Gain on change of control of interests - - - 13,790 - 13,790 Realized gains (losses) and unrealized losses on disposition 5,481 - 5,481 209,752 133,350 343,102 Gain on sale of land/other 16,988 (11,201) 5,787 522 - 522 Gain on sale from unconsolidated joint ventures 35,184 - 35,184 903 - 903 Gain (loss) from early extinguishment of debt, net (272) - (272) 1,648 - 1,648 Total other income (expense) (32,655) (5,945) (38,600) 131,899 138,590 270,489 Income from continuing operations (33,598) (81,925) (115,523) 143,836 108,984 252,820 Income from discontinued operations - 70,724 70,724 - 24,366 24,366 Realized gains (losses) on disposition - 11,201 11,201 - (133,350) (133,350) Total discontinued operations - 81,925 81,925 - (108,984) (108,984) Net Income (33,598) - (33,598) 143,836 - 143,836 Noncontrolling interest in consolidated joint ventures 2,695 - $2,695 3,904 - $3,904 Noncontrolling interests in Operating Partnership of income from continuing operations 13,279 - 13,279 (23,720) - (23,720) Noncontrolling interests in Operating Partnership in discontinued operations (7,880) - (7,880) 10,456 - 10,456 Redeemable noncontrolling interest (25,883) - (25,883) (22,615) - (22,615) Net income (loss) available to common shareholders ($51,387) $0 ($51,387) $111,861 $0 $111,861 Basic earnings per common share: Net income (loss) available to common shareholders ($0.70) $0.95 Diluted earnings per common share: Net income (loss) available to common shareholders ($0.70) $0.95 Basic weighted average shares outstanding 90,648,000 90,557,000 Diluted weighted average shares outstanding 100,260,000 100,689,000 YTD 2020 YTD 2019

FFO & Core FFO – Year - to - Date Comparison 14 4Q 2020 $ in thousands, except per share amounts and ratios (unaudited) CLI Company Highlights Notes: See footnotes and “Information About FFO, Core FFO, AFFO & Adjusted EBITDA” on page 17. YTD 2020 YTD 2019 Net income (loss) available to common shareholders ($51,387) $111,861 Add (deduct): Noncontrolling interest in Operating Partnership (13,279) 23,720 Noncontrolling interests in discontinued operations 7,880 (10,456) Real estate-related depreciation and amortization on continuing operations (1) 132,816 144,932 Real estate-related depreciation and amortization on discontinued operations 4,806 70,614 Property impairments on continuing operations 36,582 - Property impairments on discontinued operations - 11,696 Impairment of unconsolidated joint venture investment (included in Equity in earnings) 2,562 3,661 Gain on change of control of interests - (13,790) Gain on sale from unconsolidated joint ventures (35,184) (903) Continuing operations: Realized (gains) and unrealized losses on disposition of rental property, net (5,481) (343,102) Discontinued operations: Realized (gains) loss and unrealized losses on disposition of rental property, net (11,201) 117,898 Funds from operations (2) $68,114 $116,131 Add/(Deduct): (Gain)/Loss from extinguishment of debt, net $272 ($1,648) Dead deal costs 2,860 271 Land and other impairments 16,817 36,200 Gain on disposition of developable land (5,787) (522) Strategic direction costs - 4,629 Severance/separation costs on management restructuring 11,929 1,839 Reporting system conversion costs 363 998 Noncontrolling interest share of consolidated joint venture impairment charge - (1,263) Management contract termination costs - 1,021 Proxy fight costs 12,770 4,171 New payroll tax consulting costs - 1,313 Core FFO $107,338 $163,140 Diluted weighted average shares/units outstanding (7) 100,260,000 100,689,000 Funds from operations per share-diluted $0.68 $1.15 Core Funds from Operations per share/unit-diluted $1.07 $1.62 Dividends declared per common share $0.40 $0.80

AFFO & Adjusted EBITDA – Year - to - Date Comparison 15 4Q 2020 $ in thousands, except per share amounts and ratios (unaudited) CLI Company Highlights Notes: See footnotes and “Information About FFO, Core FFO, AFFO & Adjusted EBITDA” on page 17. YTD 2020 YTD 2019 Core FFO (calculated on previous page) $107,338 $163,140 Add (Deduct) Non-Cash Items: Straight-line rent adjustments (3) ($3,928) ($14,616) Amortization of market lease intangibles, net (4) (3,709) (4,268) Amortization of lease inducements 55 460 Amortization of stock compensation 7,926 8,481 Non-real estate depreciation and amortization 1,610 2,092 Amortization of debt discount/(premium) and mark-to-market, net (1,084) (949) Amortization of deferred financing costs 4,625 4,625 Deduct: Non-incremental revenue generating capital expenditures: Building improvements (11,690) (12,418) Tenant improvements and leasing commissions (5) (21,295) (29,330) Tenant improvements and leasing commissions on space vacant for more than one year (13,132) (14,724) Adjusted FFO (2) $66,716 $102,493 Core FFO (calculated on previous page) $107,338 $163,140 Deduct: Equity in earnings (loss) of unconsolidated joint ventures, net $1,271 ($2,342) Equity in earnings share of depreciation and amortization (12,391) (13,018) Add-back: Interest expense 86,248 95,811 Recurring JV distributions 14,998 15,621 Income (loss) in noncontrolling interest in consolidated joint ventures (2,695) (3,904) Redeemable noncontrolling interest 25,883 22,615 Income tax expense 195 188 Adjusted EBITDA 220,846 $278,111 Net debt at period end (6) $2,749,493 $2,767,351 Net debt to Adjusted EBITDA 12.4x 10.0x

EBITDAre – Quarterly Comparison 16 4Q 2020 $ in thousands (unaudited) Notes: (1) See unconsolidated joint venture NOI details on page 23 for 4Q 2020. See Information About EBITDAre on page 17. CLI Company Highlights 4Q 2020 3Q 2020 2Q 2020 1Q 2020 4Q 2019 Net Income (loss) available to common shareholders $65,632 ($42,208) ($34,887) ($39,924) ($54,652) Add/(Deduct): Noncontrolling interest in operating partnership 2,582 (7,874) (4,626) (3,666) 5,494 Noncontrolling interest in discontinued operations 4,409 3,388 937 (549) (11,317) Noncontrolling interest in consolidated joint ventures (a) (795) (895) (829) (176) (1,404) Redeemable noncontrolling interest 6,470 6,471 6,471 6,471 6,471 Interest expense 20,518 21,586 21,919 22,226 24,072 Income tax expense 71 84 34 7 1 Depreciation and amortization 29,762 33,036 28,794 35,249 57,684 Deduct: Realized (gains) losses and unrealized losses on disposition of rental property, net - continuing operations (13,396) - - 7,915 8,081 Realized (gains) losses and unrealized losses on disposition of rental property, net - discontinued operations (35,101) (15,775) 11,929 27,746 - (Gain)/loss on sale from unconsolidated joint ventures (35,184) - - - - Equity in (earnings) loss of unconsolidated joint ventures 3,551 (1,373) 946 708 437 Add: Property Impairments - 36,582 - - - Company's share of property NOI's in unconsolidated joint ventures (1) 5,006 7,518 6,823 7,526 12,819 EBITDAre $53,525 $40,540 $37,511 $63,533 $47,686 Add: Loss from extinguishment of debt, net 272 - - - 153 Severance/Separation costs on management restructuring 191 8,900 891 1,947 - Strategic direction costs - - - - 4,629 Reporting systems conversion cost - - - 363 998 Dead deal costs - 2,583 277 - - Land and other impairments (6,584) 1,292 16,846 5,263 27,356 Gain on disposition of developable land (974) - - (4,813) 44 Proxy fight costs - 6,954 5,017 799 - Adjusted EBITDAre $46,430 $60,269 $60,542 $67,092 $80,866 (a) Noncontrolling interests in consolidated joint ventures: Marbella (328) (395) (80) (37) (44) M2 at Marbella (202) (200) (105) (47) (51) Port Imperial Garage South (153) (181) (224) (55) (18) Port Imperial Retail South (5) (3) (3) (3) (8) Other consolidated joint ventures (107) (116) (417) (34) (1,283) Net losses in noncontrolling interests ($795) ($895) ($829) ($176) ($1,404) Add: Depreciation in noncontrolling interest in consolidated JV's 659 661 669 660 645 Funds from operations - noncontrolling interest in consolidated JV's ($136) ($234) ($160) $484 ($759) Add: Interest expense in noncontrolling interest in consolidated JV's 808 806 805 805 806 Net operating income before debt service in consolidated JV's $672 $572 $645 $1,289 $47

FFO, Core FFO, AFFO, & Adjusted EBITDA (Notes) 17 4Q 2020 Notes (1) Includes the Company’s share from unconsolidated joint ventures, and adjustments for noncontrolling interest, of $ 2 , 371 and $ 3 , 677 for the three months ended December 31 , 2020 and 2019 , respectively, and $ 12 , 391 and $ 13 , 018 for the twelve months ended December 31 , 2020 and 2019 , respectively . Excludes non - real estate - related depreciation and amortization of $ 342 and $ 431 for the three months ended December 31 , 2020 and 2019 , respectively, and $ 1 , 610 and $ 2 , 092 for the twelve months ended December 31 , 2020 and 2019 . (2) Funds from operations is calculated in accordance with the definition of FFO of the National Association of Real Estate Investment Trusts (NAREIT) . See “Information About FFO, Core FFO and AFFO” below . (3) Includes free rent of $ 4 , 972 and $ 5 , 329 for the three months ended December 31 , 2020 and 2019 , respectively, and $ 15 , 159 and $ 21 , 424 for the twelve months ended December 31 , 2020 and 2019 , respectively . Also includes the Company's share from unconsolidated joint ventures of $ 108 and $ 186 for the three months ended December 31 , 2020 and 2019 , respectively, and $ 177 and $ 127 for the twelve months ended December 31 , 2020 and 2019 , respectively . (4) Includes the Company's share from unconsolidated joint ventures of $ 0 and $ 0 for the three months ended December 31 , 2020 and 2019 , respectively, and $ 0 and $ 0 for the twelve months ended December 31 , 2020 and 2019 , respectively . (5) Excludes expenditures for tenant spaces in properties that have not been owned by the Company for at least a year . (6) Net Debt calculated by taking the sum of senior unsecured notes, unsecured revolving credit facility, and mortgages, loans payable and other obligations, and deducting cash and cash equivalents and restricted cash, all at period end . (7) Calculated based on weighted average common shares outstanding, assuming redemption of Operating Partnership common units into common shares 9 , 412 and 9 , 530 for the three months ended December 31 , 2020 and 2019 , respectively, and 9 , 411 and 9 , 852 for the twelve months ended December 31 , 2020 and 2019 , respectively . Funds from operations (“FFO”) is defined as net income (loss) before noncontrolling interests of unitholders, computed in accordance with generally accepted accounting principles (“GAAP”), excluding gains or losses from depreciable rental property transactions (including both acquisitions and dispositions), and impairments related to depreciable rental property, plus real estate - related depreciation and amortization . The Company believes that FFO per share is helpful to investors as one of several measures of the performance of an equity REIT . The Company further believes that as FFO per share excludes the effect of depreciation, gains (or losses) from property transactions and impairments related to depreciable rental property (all of which are based on historical costs which may be of limited relevance in evaluating current performance), FFO per share can facilitate comparison of operating performance between equity REITs . FFO per share should not be considered as an alternative to net income available to common shareholders per share as an indication of the Company’s performance or to cash flows as a measure of liquidity . FFO per share presented herein is not necessarily comparable to FFO per share presented by other real estate companies due to the fact that not all real estate companies use the same definition . However, the Company’s FFO per share is comparable to the FFO per share of real estate companies that use the current definition of the National Association of Real Estate Investment Trusts (“NAREIT”) . A reconciliation of net income per share to FFO per share is included in the financial tables above . Core FFO is defined as FFO, as adjusted for items that may distort the comparative measurement of the Company’s performance over time . Adjusted FFO ("AFFO") is defined as Core FFO less ( i ) recurring tenant improvements, leasing commissions and capital expenditures, (ii) straight - line rents and amortization of acquired above/below - market leases, net, and (iii) other non - cash income, plus (iv) other non - cash charges . Core FFO and AFFO are both non - GAAP financial measures that are not intended to represent cash flow and are not indicative of cash flows provided by operating activities as determined in accordance with GAAP . Core FFO and AFFO are presented solely as supplemental disclosures that the Company’s management believes provides useful information regarding the Company's operating performance and its ability to fund its dividends . There are not generally accepted definitions established for Core FFO or AFFO . Therefore, the Company's measures of Core FFO and AFFO may not be comparable to the Core FFO and AFFO reported by other REITs . A reconciliation of net income to Core FFO and AFFO are included in the financial tables above . Information About FFO, Core FFO and AFFO EBITDAre is a non - GAAP financial measure. The Company computes EBITDAre in accordance with standards established by the National Association of Real Estate Investment Trusts, or NAREIT, which may n ot be comparable to EBITDAre reported by other REITs that do not compute EBITDAre in accordance with the NAREIT definition, or that interpret the NAREIT definition differently than the Company does. The Whit e Paper on EBITDAre approved by the Board of Governors of NAREIT in September 2017 defines EBITDAre as net income (loss) (computed in accordance with Generally Accepted Accounting Principles, or GAAP), plus interest expense, plus income tax expense, plus depreciation and amortization, plus (minus) losses and gains on the dispositi on of depreciated property, plus impairment write - downs of depreciated property and investments in unconsolidated joint ventures, plus adjustments to reflect the entity's share of EBITDAre of unconsolidated joint ventures. The Company presents EBITDAre , because the Company believes that EBITDAre , along with cash flow from operating activities, investing activities and financing activities, provides investors with an a ddi tional indicator of the Company’s ability to incur and service debt. EBITDAre should not be considered as an alternative to net income (determined in accordance with GAAP), as an indication of the Compan y’s financial performance, as an alternative to net cash flows from operating activities (determined in accordance with GAAP), or as a measure of the Company’s liquidity. Information About EBITDAre CLI Company Highlights

Same Store Performance 18 4Q 2020 $ in thousands Notes: (1) Values represent the Company’s pro rata ownership of operating portfolio. (2) Aggregate property - level revenue over the given period; less: operating expense, real estate taxes and utilities over the same p eriod for the same store portfolio. (3) Excluding PILOT tax catch - up adjustments totaling $800K, 4Q20 SSNOI % would be (28.1%) and 4Q20 Adjusted SSNOI % would be (22.3% ). (4) Adjusted Residential Same Store property pool excludes Transition Assets: BLVD 475 and BLVD 425. (5) Office Same Store excludes discontinued operations and Harborside Plaza 1 as it was removed from service in 4Q19. (6) The aggregate sum of: property - level revenue, straight - line and ASC 805 adjustments over the given time period; less: operating expense, real estate taxes and utilities over the same period for the same store portfolio. CLI Company Highlights Residential Same Store (1) 4Q 2020 4Q 2019 Change % Change 4Q 2020 4Q 2019 Change % Change Total Property Revenues $23,249 $26,580 ($3,331) (12.5%) $97,956 $103,497 ($5,541) (5.4%) Real Estate Taxes $4,305 $2,964 $1,342 45.3% $13,309 $12,270 $1,039 8.5% Payroll 1,498 1,311 187 14.3% 5,488 5,132 357 6.9% Repairs & Maintenance 513 428 85 19.8% 1,748 1,693 55 3.2% Utilities 777 750 28 3.7% 3,360 3,287 73 2.2% Insurance 538 326 212 65.0% 1,808 1,262 545 43.2% Marketing 445 534 (89) (16.7%) 1,548 1,926 (377) (19.6%) Management Fees & Other 3,665 3,140 524 16.7% 13,560 12,247 1,313 10.7% Total Property Expenses $11,741 $9,453 $2,288 24.2% $40,820 $37,816 $3,004 7.9% Same Store GAAP NOI (2), (3) $11,508 $17,127 ($5,619) (32.8%) $57,136 $65,681 ($8,545) (13.0%) Total Units 3,813 3,813 - - 3,813 3,813 - - % Leased 89.4% 93.9% - (4.5%) 89.4% 93.9% - (4.5%) Adjusted Same Store (4) Revenues $17,244 $19,049 ($1,805) (9.5%) $71,663 $72,474 ($811) (1.1%) Expenses 7,854 6,681 1,173 17.6% 28,830 26,822 2,008 7.5% Adjusted Same Store GAAP NOI (3) $9,390 $12,368 ($2,978) (24.1%) $42,833 $45,652 ($2,819) (6.2%) Total Units 2,878 2,878 - - 2,878 2,878 - - % Leased 92.2% 96.0% - (3.8%) 92.2% 96.0% - (3.8%) Office Same Store (5) 4Q 2020 4Q 2019 Change % Change 4Q 2020 4Q 2019 Change % Change Total Property Revenues (GAAP) $33,277 $35,899 ($2,622) (7.3%) $143,340 $144,740 ($1,400) (1.0%) Real Estate Taxes $5,064 $3,783 $1,281 33.9% $19,812 $18,303 $1,509 8.2% Utilities 1,734 1,968 (234) (11.9%) 7,644 9,023 (1,379) (15.3%) Operating Services 7,399 7,973 (574) (7.2%) 30,185 31,072 (887) (2.9%) Total Property Expenses $14,197 $13,724 $473 3.4% $57,641 $58,398 ($757) (1.3%) Same Store GAAP NOI (6) $19,080 $22,175 ($3,095) (14.0%) $85,699 $86,342 ($643) (0.7%) Less: straight-lining of rents adj. and FAS 141 $608 $2,853 ($2,245) (78.7%) $2,519 $10,234 ($7,715) (75.4%) Same Store Cash NOI $18,472 $19,322 ($850) (4.4%) $83,180 $76,108 $7,072 9.3% Total Properties 6 6 - - 6 6 - - Total Square Footage 4,508,801 4,508,801 - - 4,508,801 4,508,801 - - % Leased 77.3% 77.8% - (0.5%) 77.3% 77.8% - (0.5%) For the Three Months Ended For the Twelve Months Ended For the Three Months Ended For the Twelve Months Ended

19 4Q 2020 Debt Summary & Future Repayments Schedule $ in thousands Notes: (a) Minority interest share of consolidated debt is comprised of $33.7 million at Marbella, $30.1 million at M2, $9.9 million at Por t Imperial South Garage, and $1.2 million at Port Imperial South Retail. See supporting “Debt Summary & Future Repayments Schedule” notes on page 36. CLI Company Highlights Debt Breakdown % Weighted Average Weighted Average Balance of Total Interest Rate (1) Maturity in Years Fixed Rate Debt Fixed Rate Unsecured Debt and Other Obligations $575,000 20.4% 4.09% 1.81 Fixed Rate Secured Debt 1,811,502 64.3% 3.75% 6.24 Subtotal: Fixed Rate Debt $2,386,502 84.7% 3.83% 5.17 Variable Rate Debt Variable Rate Secured Debt $407,360 14.5% 3.50% 3.23 Variable Rate Unsecured Debt (1) 25,000 0.9% 1.50% 0.57 Subtotal: Variable Rate Debt $432,360 15.3% 3.38% 3.07 Totals/Weighted Average $2,818,862 100.0% 3.76% 4.85 Adjustment for Unamortized Debt Discount (1,504) Unamortized Deferred Financing Costs (15,561) Total Consolidated Debt, net $2,801,797 Partners’ Share (74,912) CLI Share of Total Consolidated Debt, net (a) $2,726,886 Unconsolidated Secured Debt CLI Share $358,075 55.7% 4.16% 7.10 Partners’ Share 284,704 44.3% 4.16% 7.10 Total Unconsolidated Secured Debt $642,779 100.0% 4.16% 7.10 Maturity Schedule Principal Scheduled Total Future Weighted Average Period Maturities Amortization Repayments Interest Rate (1) 2021 28,800 590 29,390 1.96% 2022 440,357 550 440,907 4.15% 2023 376,457 2,047 378,504 3.39% 2024 469,545 3,403 472,948 3.86% 2025 - 3,300 3,300 3.98% 2026 658,000 12,822 670,822 3.68% Thereafter 822,991 - 822,991 3.79% Subtotal $2,796,150 22,712 $2,818,862 3.76% Adjustment for unamortized debt discount/premium (1,504) (1,504) Unamortized deferred financing costs (2) (15,561) (15,561) Totals/Weighted Average $2,796,150 $5,643 $2,801,797 3.76%

20 4Q 2020 Residential Debt Profile Notes: See supporting “Debt Profile” notes on page 36. $ in thousands CLI Company Highlights Effective December 31, December 31, Date of Lender Interest Rate (1) 2020 2019 Maturity Secured Construction Loans The Emery Fifth Third Bank N/A - 24,064 N/A RiverHouse 9 Bank of New York Mellon LIBOR + 2.13% 46,357 11,615 12/19/22 The Upton People's United Bank LIBOR + 2.15% 42,459 9,431 03/26/23 The Charlotte QuadReal Finance LIBOR + 2.70% 161,544 5,144 12/01/24 Total Secured Construction Debt $250,360 $50,254 Secured Permanent Loans Riverwatch New York Community Bank N/A - 30,000 N/A Port Imperial South 4/5 Retail American General Life & A/G PC 4.56% 3,866 3,934 12/01/21 Marriott Hotels at Port Imperial Fifth Third Bank LIBOR + 3.40% 94,000 74,000 04/09/22 Portside 7 CBRE Capital Markets/FreddieMac 3.57% 58,998 58,998 08/01/23 Signature Place Nationwide Life Insurance Company 3.74% 43,000 43,000 08/01/24 Liberty Towers American General Life Insurance Company 3.37% 265,000 232,000 10/01/24 Portside 5/6 New York Life Insurance Co. 4.56% 97,000 97,000 03/10/26 BLVD 425 New York Life Insurance Co. 4.17% 131,000 131,000 08/10/26 BLVD 401 New York Life Insurance Co. 4.29% 117,000 117,000 08/10/26 145 Front Street MUFG Union Bank LIBOR + 1.84% 63,000 63,000 12/10/26 Quarry Place at Tuckahoe Natixis Real Estate Capital LLC 4.48% 41,000 41,000 08/05/27 BLVD 475 Northwestern Mutual Life 2.91% 165,000 166,752 11/10/27 RiverHouse 11 at Port Imperial Northwestern Mutual Life 4.52% 100,000 100,000 01/10/29 Soho Lofts New York Community Bank 3.77% 160,000 160,000 07/01/29 Port Imperial South 4/5 Garage American General Life & A/G PC 4.85% 33,138 32,600 12/01/29 The Emery New York Community Bank 3.21% 72,000 - 01/01/31 Principal balance outstanding 1,444,002 1,350,284 Unamortized deferred financing costs (11,595) (13,394) Total Secured Permanent Debt $1,432,407 $1,336,890 Total Debt - Residential Portfolio - A $1,682,767 $1,387,144

21 4Q 2020 Office Debt Profile Notes: See supporting “Debt Profile” notes on page 36. $ in thousands CLI Company Highlights Effective December 31, December 31, Date of Lender Interest Rate (1) 2020 2019 Maturity Secured Permanent Loans 101 Hudson Wells Fargo CMBS 3.20% 250,000 250,000 10/11/26 Short Hills Portfolio Wells Fargo CMBS 4.15% 124,500 124,500 04/01/27 111 River Apollo/Athene 3.90% 150,000 150,000 09/01/29 Principal balance outstanding 524,500 524,500 Unamortized deferred financing costs (3,123) (3,610) Total Secured Debt - Office Portfolio $521,377 $520,890 Senior Unsecured Notes: (2)(3) 4.500%, Senior Unsecured Notes public debt 4.61% 300,000 300,000 04/18/22 3.150%, Senior Unsecured Notes public debt 3.52% 275,000 275,000 05/15/23 Principal balance outstanding 575,000 575,000 Adjustment for unamortized debt discount (1,504) (2,170) Unamortized deferred financing costs (843) (1,346) Total Senior Unsecured Notes, net: $572,653 $571,484 Revolving Credit Facilities 13 Lenders LIBOR +1.35% 25,000 329,000 07/25/21 Total Debt - Office Portfolio - B 1,119,029 1,421,374 Total Debt - Residential Portfolio - A (from previous page) 1,682,767 1,387,144 Total Consolidated Debt: A + B = C 2,801,797 2,808,518

22 4Q 2020 Consolidated Debt Maturity Schedule $ in thousands CLI Company Highlights *Revolving Credit Facility is excluded from the table Construction Office Secured Residential Secured Corporate* 2021 - - $3,866 - 2022 $46,357 - $94,000 $300,000 2023 $42,459 - $58,998 $275,000 2024 $161,544 - $308,000 - 2025 - - - - 2026 - $250,000 $408,000 - 2027 - $124,500 $206,000 - 2028 - - - - 2029 - $150,000 $293,138 - 2030 - - - - 2031 - - $72,000 - $46,357 $42,459 $161,544 $250,000 $124,500 $150,000 $3,866 $94,000 $58,998 $308,000 $408,000 $206,000 $293,138 $72,000 $300,000 $275,000 $0 $100,000 $200,000 $300,000 $400,000 $500,000 $600,000 $700,000 2021 2022 2023 2024 2025 2026 2027 2028 2029 2030 2031 Debt Maturity Schedule Construction Office Secured Residential Secured Corporate*
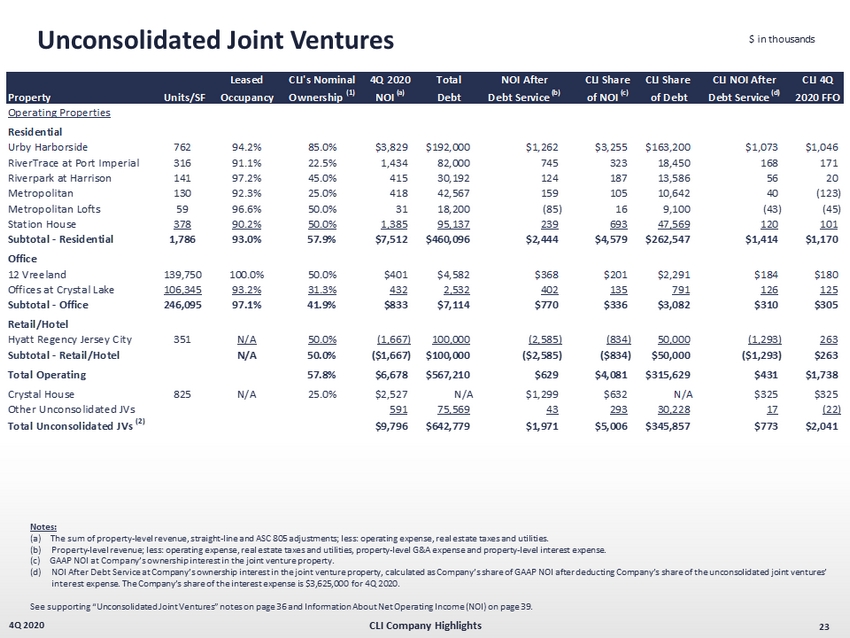
Unconsolidated Joint Ventures 23 4Q 2020 $ in thousands Notes: (a) The sum of property - level revenue, straight - line and ASC 805 adjustments; less: operating expense, real estate taxes and utilities. (b) Property - level revenue; less: operating expense, real estate taxes and utilities, property - level G&A expense and propert y - level interest expense. (c) GAAP NOI at Company’s ownership interest in the joint venture property. (d) NOI After Debt Service at Company’s ownership interest in the joint venture property, calculated as Company’s share of GAAP N OI after deducting Company’s share of the unconsolidated joint ventures’ interest expense. The Company’s share of the interest expense is $3,625,000 for 4Q 2020. See supporting “Unconsolidated Joint Ventures” notes on page 36 and Information About Net Operating Income (NOI) on page 39. CLI Company Highlights Leased CLI's Nominal 4Q 2020 Total NOI After CLI Share CLI Share CLI NOI After CLI 4Q Property Units/SF Occupancy Ownership (1) NOI (a) Debt Debt Service (b) of NOI (c) of Debt Debt Service (d) 2020 FFO Operating Properties Residential Urby Harborside 762 94.2% 85.0% $3,829 $192,000 $1,262 $3,255 $163,200 $1,073 $1,046 RiverTrace at Port Imperial 316 91.1% 22.5% 1,434 82,000 745 323 18,450 168 171 Riverpark at Harrison 141 97.2% 45.0% 415 30,192 124 187 13,586 56 20 Metropolitan 130 92.3% 25.0% 418 42,567 159 105 10,642 40 (123) Metropolitan Lofts 59 96.6% 50.0% 31 18,200 (85) 16 9,100 (43) (45) Station House 378 90.2% 50.0% 1,385 95,137 239 693 47,569 120 101 Subtotal - Residential 1,786 93.0% 57.9% $7,512 $460,096 $2,444 $4,579 $262,547 $1,414 $1,170 Office 12 Vreeland 139,750 100.0% 50.0% $401 $4,582 $368 $201 $2,291 $184 $180 Offices at Crystal Lake 106,345 93.2% 31.3% 432 2,532 402 135 791 126 125 Subtotal - Office 246,095 97.1% 41.9% $833 $7,114 $770 $336 $3,082 $310 $305 Retail/Hotel Hyatt Regency Jersey City 351 N/A 50.0% (1,667) 100,000 (2,585) (834) 50,000 (1,293) 263 Subtotal - Retail/Hotel N/A 50.0% ($1,667) $100,000 ($2,585) ($834) $50,000 ($1,293) $263 Total Operating 57.8% $6,678 $567,210 $629 $4,081 $315,629 $431 $1,738 Crystal House 825 N/A 25.0% $2,527 N/A $1,299 $632 N/A $325 $325 Other Unconsolidated JVs 591 75,569 43 293 30,228 17 (22) Total Unconsolidated JVs (2) $9,796 $642,779 $1,971 $5,006 $345,857 $773 $2,041

Transaction Activity 24 4Q 2020 $ in thousands (incl. per unit values) except per SF See supporting “Transaction Activity” notes on page 36. CLI Company Highlights Residential Portfolio Number of Units / Keys / Percentage Gross Asset Price Per Weighted Average Location Transaction Date Buildings SF Leased Value (1) Unit / SF (1) Cap Rate (2) 1Q 2020 Dispositions Capital Office Park Land Greenbelt, MD 03/27/20 - - - $9,661 - Total 1Q 2020 Dispositions - - - $9,661 - - 1Q 2020 Acquisitions Port Imperial North Retail West New York, NJ 03/12/20 1 30,745 66.2% $15,200 $494 Total 1Q 2020 Dispositions 1 30,745 66.2% $15,200 $494 4.6% 4Q 2020 Dispositions Hillsborough (Land) (3) Hillsborough, NJ 12/17/20 - - - $4,200 - Riverwatch New Brunswick, NJ 12/23/20 2 200 94.0% 47,000 235,000 Crystal House (4) Arlington, VA 12/31/20 1 825 90.2% 336,600 408,000 Crystal House (Land) (5) Arlington, VA 12/31/20 - - - 40,000 - Total 4Q 2020 Dispositions (6) 3 1,025 90.9% $427,800 $374,244 2.9% Office Portfolio Number of Percentage Gross Asset Price Per Weighted Average Location Transaction Date Buildings SF Leased Value (1) SF Cap Rate 1Q 2020 Dispositions 230 & 250 Half Mile Rd. Middletown, NJ 01/03/20 2 - - $7,600 - One Bridge Plaza Fort Lee, NJ 03/17/20 1 200,000 73.5% 36,700 184 Total 1Q 2020 Dispositions 3 200,000 73.5% $44,300 $184 6.2% 3Q 2020 Dispositions 3 Giralda Farms Madison, NJ 07/22/20 1 141,000 0.0% $7,974 57 Parsippany & Giralda Portfolio Morris County, NJ 09/15/20 10 1,448,420 82.4% 158,752 110 325 Columbia Turnpike Florham Park, NJ 09/18/20 1 168,144 84.5% 25,550 152 9 Campus Drive Parsippany, NJ 09/24/20 1 156,495 91.6% 21,000 134 Total 3Q 2020 Dispositions 13 1,914,059 77.3% $213,275 $111 9.6% 4Q 2020 Dispositions 5 Vaughn Drive Princeton, NJ 10/21/20 1 98,500 30.0% $7,500 76 7 Campus Drive Parsippany, NJ 11/18/20 1 154,395 45.0% 12,750 83 581 Main Street Woodbridge, NJ 12/03/20 1 200,000 100.0% 61,000 305 14 & 16 Skyline (Land) Hawthorne, NY 12/18/20 - - - 3,000 - 500 College Road Princeton, NJ 12/22/20 1 158,235 47.0% 9,983 63 Total 4Q 2020 Dispositions 4 611,130 61.1% $94,233 $149 3.6%

25 Multifamily Portfolio 4Q 2020 25
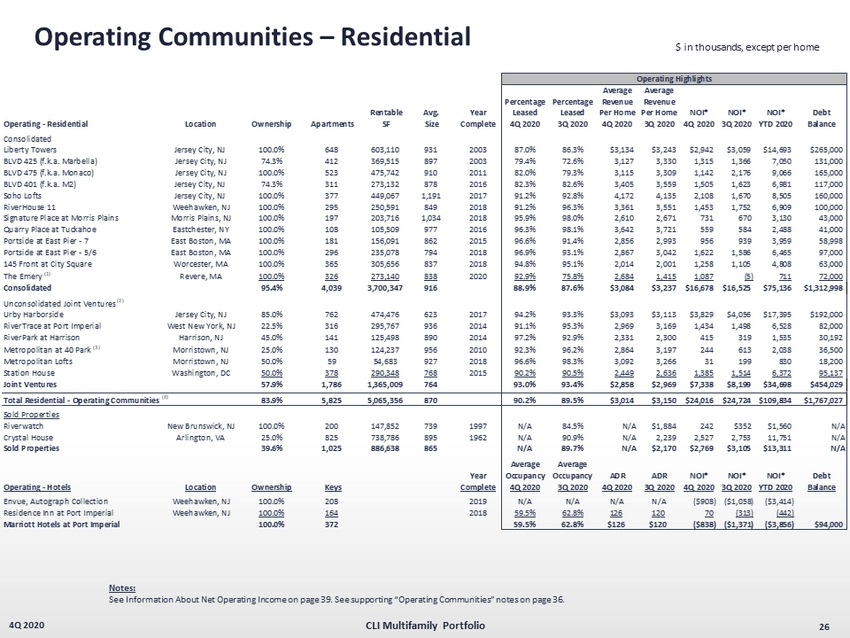
$ in thousands, except per home Operating Communities – Residential 26 4Q 2020 Notes: See Information About Net Operating Income on page 39. See supporting “Operating Communities” notes on page 36. CLI Multifamily Portfolio Average Average Percentage Percentage Revenue Revenue Rentable Avg. Year Leased Leased Per Home Per Home NOI* NOI* NOI* Debt Operating - Residential Location Ownership Apartments SF Size Complete 4Q 2020 3Q 2020 4Q 2020 3Q 2020 4Q 2020 3Q 2020 YTD 2020 Balance Consolidated Liberty Towers Jersey City, NJ 100.0% 648 603,110 931 2003 87.0% 86.3% $3,134 $3,243 $2,942 $3,059 $14,693 $265,000 BLVD 425 (f.k.a. Marbella) Jersey City, NJ 74.3% 412 369,515 897 2003 79.4% 72.6% 3,127 3,330 1,315 1,366 7,050 131,000 BLVD 475 (f.k.a. Monaco) Jersey City, NJ 100.0% 523 475,742 910 2011 82.0% 79.3% 3,115 3,309 1,142 2,176 9,066 165,000 BLVD 401 (f.k.a. M2) Jersey City, NJ 74.3% 311 273,132 878 2016 82.3% 82.6% 3,405 3,559 1,505 1,623 6,981 117,000 Soho Lofts Jersey City, NJ 100.0% 377 449,067 1,191 2017 91.2% 92.8% 4,172 4,135 2,108 1,670 8,505 160,000 RiverHouse 11 Weehawken, NJ 100.0% 295 250,591 849 2018 91.2% 96.3% 3,361 3,551 1,453 1,752 6,909 100,000 Signature Place at Morris Plains Morris Plains, NJ 100.0% 197 203,716 1,034 2018 95.9% 98.0% 2,610 2,671 731 670 3,130 43,000 Quarry Place at Tuckahoe Eastchester, NY 100.0% 108 105,509 977 2016 96.3% 98.1% 3,642 3,721 559 584 2,488 41,000 Portside at East Pier - 7 East Boston, MA 100.0% 181 156,091 862 2015 96.6% 91.4% 2,856 2,993 956 939 3,959 58,998 Portside at East Pier - 5/6 East Boston, MA 100.0% 296 235,078 794 2018 96.9% 93.1% 2,867 3,042 1,622 1,586 6,465 97,000 145 Front at City Square Worcester, MA 100.0% 365 305,656 837 2018 94.8% 95.1% 2,014 2,001 1,258 1,105 4,808 63,000 The Emery (1) Revere, MA 100.0% 326 273,140 838 2020 92.9% 75.8% 2,684 1,415 1,087 (5) 711 72,000 Consolidated 95.4% 4,039 3,700,347 916 88.9% 87.6% $3,084 $3,237 $16,678 $16,525 $75,136 $1,312,998 Unconsolidated Joint Ventures (2) Urby Harborside Jersey City, NJ 85.0% 762 474,476 623 2017 94.2% 93.3% $3,093 $3,113 $3,829 $4,056 $17,395 $192,000 RiverTrace at Port Imperial West New York, NJ 22.5% 316 295,767 936 2014 91.1% 95.3% 2,969 3,169 1,434 1,498 6,528 82,000 RiverPark at Harrison Harrison, NJ 45.0% 141 125,498 890 2014 97.2% 92.9% 2,331 2,300 415 319 1,535 30,192 Metropolitan at 40 Park (3) Morristown, NJ 25.0% 130 124,237 956 2010 92.3% 96.2% 2,864 3,197 244 613 2,038 36,500 Metropolitan Lofts Morristown, NJ 50.0% 59 54,683 927 2018 96.6% 98.3% 3,092 3,266 31 199 830 18,200 Station House Washington, DC 50.0% 378 290,348 768 2015 90.2% 90.5% 2,449 2,636 1,385 1,514 6,372 95,137 Joint Ventures 57.9% 1,786 1,365,009 764 93.0% 93.4% $2,858 $2,969 $7,338 $8,199 $34,698 $454,029 Total Residential - Operating Communities (4) 83.9% 5,825 5,065,356 870 90.2% 89.5% $3,014 $3,150 $24,016 $24,724 $109,834 $1,767,027 Sold Properties Riverwatch New Brunswick, NJ 100.0% 200 147,852 739 1997 N/A 84.5% N/A $1,884 242 $352 $1,560 N/A Crystal House Arlington, VA 25.0% 825 738,786 895 1962 N/A 90.9% N/A 2,239 2,527 2,753 11,751 N/A Sold Properties 39.6% 1,025 886,638 865 N/A 89.7% N/A $2,170 $2,769 $3,105 $13,311 N/A Average Average Year Occupancy Occupancy ADR ADR NOI* NOI* NOI* Debt Operating - Hotels Location Ownership Keys Complete 4Q 2020 3Q 2020 4Q 2020 3Q 2020 4Q 2020 3Q 2020 YTD 2020 Balance Envue, Autograph Collection Weehawken, NJ 100.0% 208 2019 N/A N/A N/A N/A ($908) ($1,058) ($3,414) Residence Inn at Port Imperial Weehawken, NJ 100.0% 164 2018 59.5% 62.8% 126 120 70 (313) (442) Marriott Hotels at Port Imperial 100.0% 372 59.5% 62.8% $126 $120 ($838) ($1,371) ($3,856) $94,000 Operating Highlights
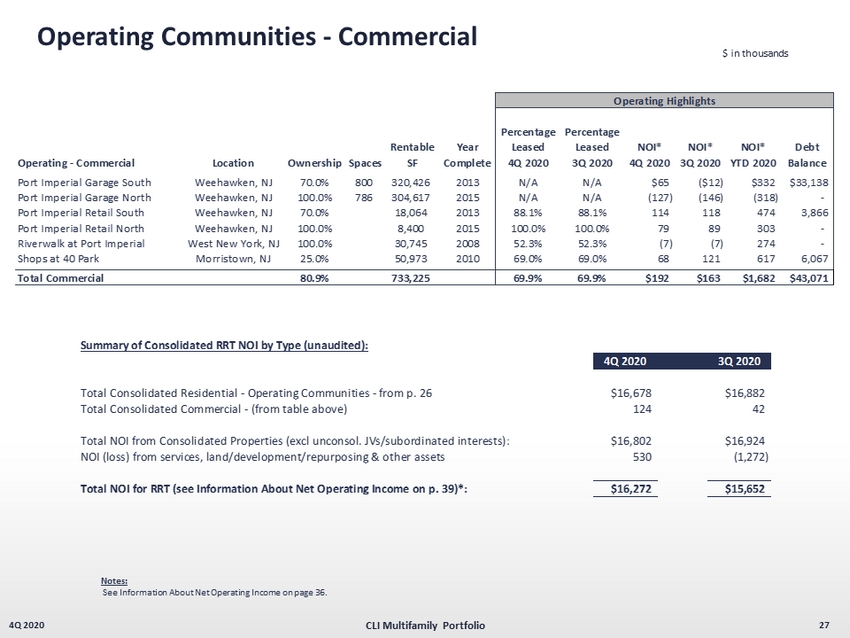
Operating Communities - Commercial 4Q 2020 27 $ in thousands CLI Multifamily Portfolio Notes: See Information About Net Operating Income on page 36. Percentage Percentage Rentable Year Leased Leased NOI* NOI* NOI* Debt Operating - Commercial Location Ownership Spaces SF Complete 4Q 2020 3Q 2020 4Q 2020 3Q 2020 YTD 2020 Balance Port Imperial Garage South Weehawken, NJ 70.0% 800 320,426 2013 N/A N/A $65 ($12) $332 $33,138 Port Imperial Garage North Weehawken, NJ 100.0% 786 304,617 2015 N/A N/A (127) (146) (318) - Port Imperial Retail South Weehawken, NJ 70.0% 18,064 2013 88.1% 88.1% 114 118 474 3,866 Port Imperial Retail North Weehawken, NJ 100.0% 8,400 2015 100.0% 100.0% 79 89 303 - Riverwalk at Port Imperial West New York, NJ 100.0% 30,745 2008 52.3% 52.3% (7) (7) 274 - Shops at 40 Park Morristown, NJ 25.0% 50,973 2010 69.0% 69.0% 68 121 617 6,067 Total Commercial 80.9% 733,225 69.9% 69.9% $192 $163 $1,682 $43,071 Operating Highlights Summary of Consolidated RRT NOI by Type (unaudited): 4Q 2020 3Q 2020 Total Consolidated Residential - Operating Communities - from p. 26 $16,678 $16,882 Total Consolidated Commercial - (from table above) 124 42 Total NOI from Consolidated Properties (excl unconsol. JVs/subordinated interests): $16,802 $16,924 NOI (loss) from services, land/development/repurposing & other assets 530 (1,272) Total NOI for RRT (see Information About Net Operating Income on p. 39)*: $16,272 $15,652

In - Construction Communities & Future Land Sites 28 4Q 2020 $ in thousands Notes: NOI amounts are projected only. See Information About Net Operating Income (NOI) on page 39. See supporting “In - Construction Communities” notes on page 36. CLI Multifamily Portfolio Apartment Third Projected Projected Projected Homes/ MCRC Party Dev Debt MCRC Initial Project Stabilized Stabilized Stabilized Community Location Ownership Keys Costs Debt (1) Capital Capital Costs (2) Balance Capital Start OccupancyStabilization Yield NOI FFO Consolidated RiverHouse 9 Weehawken, NJ 100.0% 313 $143,778 $92,000 $51,778 - $98,135 $46,357 $51,778 3Q 2018 2Q 2021 2Q 2022 6.33% $9,100 $6,110 The Upton Short Hills, NJ 100.0% 193 99,412 64,000 35,412 - 77,871 42,459 35,412 4Q 2018 1Q 2021 4Q 2021 6.31% 6,268 4,188 The Charlotte Jersey City, NJ 100.0% 750 469,510 300,000 169,510 - 331,054 161,544 169,510 1Q 2019 1Q 2022 3Q 2023 5.98% 28,100 18,350 Consolidated 100.0% 1,256 $712,700 $456,000 $256,700 $0 $507,060 $250,360 $256,700 6.12% $43,468 $28,648 Joint Ventures The Capstone West New York, NJ 40.0% 360 192,916 112,000 35,529 45,387 156,485 75,569 35,529 4Q 2017 1Q 2021 1Q 2022 6.34% 12,222 8,582 Joint Ventures 40.0% 360 $192,916 $112,000 $35,529 $45,387 $156,485 $75,569 $35,529 6.34% $12,222 $8,582 Total In-Construction Communities 86.6% 1,616 $905,616 $568,000 $292,229 $45,387 $663,545 $325,929 $292,229 6.15% $55,690 $37,230 Total Remaining Capital $242,071 $242,071 $0 Future Developments Units Units Hudson Waterfront Greater NY/NJ Plaza 8 680 1 Water St. 299 Plaza 9 487 1633 Littleton/2 Campus 368 Urby Harborside - Future Phases 1,500 6 Becker Farm/85 Livingston 439 107 Morgan 800 233 Canoe Brook Hotel 160 Liberty Landing Phase 1 265 Subtotal – Greater NY/NJ 1,266 Liberty Landing – Future Phases 585 PI South – Park Parcel 298 Boston Metro PI South – Building 16 204 Portside 1-4 300 PI South – Office 1/3 (3) 290 Future Overlook Phases 694 PI South – Building 2 245 Overlook Hotel Parcels 170 PI North – Riverbend 6 607 Subtotal – Boston Metro 1,164 PI North – Building I 164 Subtotal – Hudson Waterfront 6,125 Total Future Start Communities 8,555 Project Capitalization - Total Capital as of 4Q 2020 Development Schedule Location West New York, NJ Location Weehawken, NJ Weehawken, NJ West New York, NJ White Plains, NY Parisppany, NJ Roseland, NJ Short Hills, NJ East Boston, MA Malden/Revere, MA Malden/Revere, MA Jersey City, NJ Jersey City, NJ Jersey City, NJ Jersey City, NJ Jersey City, NJ Jersey City, NJ Weehawken, NJ Weehawken, NJ

Roseland Balance Sheet 29 4Q 2020 $ in thousands (unaudited) CLI Multifamily Portfolio 4Q 2020 4Q 2019 ASSETS Rental Property Land and leasehold interests $323,139 $322,792 Buildings and improvements 1,854,269 1,811,505 Tenant improvements 3,522 1,981 Furniture, fixtures and equipment 76,878 72,224 Land and improvements held for development 308,627 292,350 Development and construction in progress 602,767 396,391 Total Gross Rental Property 3,169,202 2,897,243 Less: Accumulated depreciation (140,776) (90,627) Net Investment in Rental Property 3,028,426 2,806,616 Assets held for sale, net - - Total Property Investments 3,028,426 2,806,616 Cash and cash equivalents 12,109 8,654 Restricted cash 11,198 10,520 Investments in unconsolidated JV's 156,827 201,724 Unbilled rents receivable, net 4,113 2,745 Deferred charges & other assets 34,000 47,749 Accounts receivable, net of allowance 2,842 1,401 Total Assets $3,249,515 $3,079,409 LIABILITIES & EQUITY Mortgages, loans payable & other obligations $1,682,767 $1,387,144 Note payable to affiliate - 19,300 Accounts pay, accrued exp and other liabilities 80,017 85,377 Rents recv'd in advance & security deposits 6,401 6,569 Accrued interest payable 4,036 3,950 Total Liabilities 1,773,221 1,502,340 Redeemable noncontrolling interest - Rockpoint Group 460,973 451,058 Noncontrolling interests in consolidated joint ventures 45,010 47,064 Mack-Cali capital 970,311 1,078,947 Total Liabilities & Equity $3,249,515 $3,079,409

Roseland Income Statement 30 4Q 2020 $ in thousands (unaudited) CLI Multifamily Portfolio 4Q 2020 3Q 2020 2Q 2020 1Q 2020 4Q 2019 REVENUES Base rents $30,602 $29,238 $31,190 $33,013 $34,919 Escalation and recoveries from tenants 893 1,311 1,218 1,080 1,223 Real estate services 2,766 2,864 2,711 2,949 2,995 Parking income 1,998 2,439 1,496 2,990 3,366 Hotel income 997 893 772 1,625 4,139 Other income 846 913 847 1,189 1,056 Total revenues $38,102 $37,658 $38,234 $42,846 $47,698 EXPENSES Real estate taxes $7,377 $5,675 $6,312 $6,283 $6,082 Utilities 1,342 1,562 1,376 1,633 1,216 Operating services 8,948 10,267 8,172 8,290 8,982 Real estate service expenses 3,420 3,258 3,035 3,673 3,703 General and administrative 2,855 6,010 3,250 2,893 3,377 Depreciation and amortization 15,016 15,551 15,309 21,067 22,564 Property impairments - 36,582 - - - Land and other impairments - - 4,856 175 1,035 Total expenses $38,958 $78,905 $42,310 $44,014 $46,959 Operating Income ($856) ($41,247) ($4,076) ($1,168) $739 OTHER (EXPENSE) INCOME Interest expense ($9,122) ($9,067) ($9,164) ($8,909) ($10,363) Interest and other investment income (loss) 0 2 6 1 844 Equity in earnings (loss) of unconsolidated joint ventures (1,298) 880 (569) (590) 2,297 Realized gains (losses) and unrealized losses on disposition 7,164 - - - 113,787 Gain on sale from unconsolidated joint venture 35,184 - - - 0 Gain on sale of land/other - - - 764 (44) Gain (loss) from early extinguishment of debt, net (272) - - - - Total other income (expense) $31,656 ($8,185) ($9,727) ($8,734) $106,521 Net income (loss) $30,800 ($49,432) ($13,803) ($9,902) $107,260 Noncontrolling interest in consolidated joint ventures $707 $798 $447 $176 $140 Redeemable noncontrolling interest (6,016) (6,016) (6,016) (6,016) (6,015) Net income (loss) available to common shareholders $25,491 ($54,650) ($19,372) ($15,742) $101,385

31 Office Portfolio 4Q 2020 31
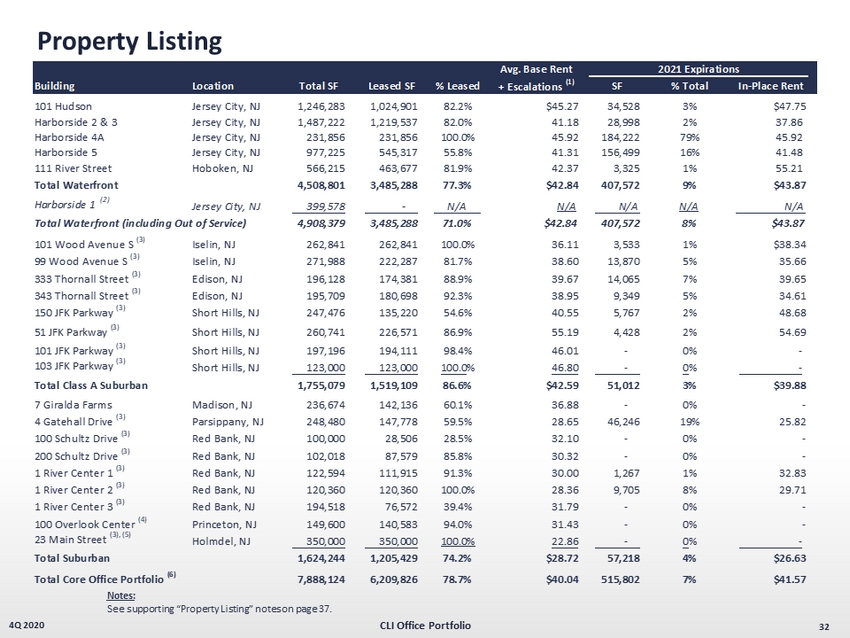
Property Listing 32 4Q 2020 CLI Office Portfolio Notes: See supporting “Property Listing” notes on page 37. Avg. Base Rent Building Location Total SF Leased SF % Leased + Escalations (1) SF % Total In-Place Rent 101 Hudson Jersey City, NJ 1,246,283 1,024,901 82.2% $45.27 34,528 3% $47.75 Harborside 2 & 3 Jersey City, NJ 1,487,222 1,219,537 82.0% 41.18 28,998 2% 37.86 Harborside 4A Jersey City, NJ 231,856 231,856 100.0% 45.92 184,222 79% 45.92 Harborside 5 Jersey City, NJ 977,225 545,317 55.8% 41.31 156,499 16% 41.48 111 River Street Hoboken, NJ 566,215 463,677 81.9% 42.37 3,325 1% 55.21 Total Waterfront 4,508,801 3,485,288 77.3% $42.84 407,572 9% $43.87 Harborside 1 (2) Jersey City, NJ 399,578 - N/A N/A N/A N/A N/A Total Waterfront (including Out of Service) 4,908,379 3,485,288 71.0% $42.84 407,572 8% $43.87 101 Wood Avenue S (3) Iselin, NJ 262,841 262,841 100.0% 36.11 3,533 1% $38.34 99 Wood Avenue S (3) Iselin, NJ 271,988 222,287 81.7% 38.60 13,870 5% 35.66 333 Thornall Street (3) Edison, NJ 196,128 174,381 88.9% 39.67 14,065 7% 39.65 343 Thornall Street (3) Edison, NJ 195,709 180,698 92.3% 38.95 9,349 5% 34.61 150 JFK Parkway (3) Short Hills, NJ 247,476 135,220 54.6% 40.55 5,767 2% 48.68 51 JFK Parkway (3) Short Hills, NJ 260,741 226,571 86.9% 55.19 4,428 2% 54.69 101 JFK Parkway (3) Short Hills, NJ 197,196 194,111 98.4% 46.01 - 0% - 103 JFK Parkway (3) Short Hills, NJ 123,000 123,000 100.0% 46.80 - 0% - Total Class A Suburban 1,755,079 1,519,109 86.6% $42.59 51,012 3% $39.88 7 Giralda Farms Madison, NJ 236,674 142,136 60.1% 36.88 - 0% - 4 Gatehall Drive (3) Parsippany, NJ 248,480 147,778 59.5% 28.65 46,246 19% 25.82 100 Schultz Drive (3) Red Bank, NJ 100,000 28,506 28.5% 32.10 - 0% - 200 Schultz Drive (3) Red Bank, NJ 102,018 87,579 85.8% 30.32 - 0% - 1 River Center 1 (3) Red Bank, NJ 122,594 111,915 91.3% 30.00 1,267 1% 32.83 1 River Center 2 (3) Red Bank, NJ 120,360 120,360 100.0% 28.36 9,705 8% 29.71 1 River Center 3 (3) Red Bank, NJ 194,518 76,572 39.4% 31.79 - 0% - 100 Overlook Center (4) Princeton, NJ 149,600 140,583 94.0% 31.43 - 0% - 23 Main Street (3), (5) Holmdel, NJ 350,000 350,000 100.0% 22.86 - 0% - Total Suburban 1,624,244 1,205,429 74.2% $28.72 57,218 4% $26.63 Total Core Office Portfolio (6) 7,888,124 6,209,826 78.7% $40.04 515,802 7% $41.57 2021 Expirations

Leasing Rollforwards & Activity 33 4Q 2020 CLI Office Portfolio For the three months ended December 31, 2020 Pct. Sq. Ft. Inventory Leased Sq. Ft. Net Sq. Ft. Pct. Leased Inventory Leased Acquired/ Acquired/ Expiring/ Incoming Leasing Inventory Leased Leased 9/30/2020 9/30/2020 9/30/2020 Disposed Disposed Adj. Sq. Ft. Sq. Ft. Activity 12/31/2020 12/31/2020 12/31/2020 Waterfront 76.9% 4,508,801 3,467,561 - - 11,659 6,068 17,727 4,508,801 3,485,288 77.3% Class A Suburban 89.0% 1,955,079 1,739,759 (200,000) (200,000) (95,702) 75,052 (20,650) 1,755,079 1,519,109 86.6% Suburban 70.0% 1,877,139 1,313,816 (252,895) (101,980) (47,861) 41,454 (6,407) 1,624,244 1,205,429 74.2% Subtotals 78.2% 8,341,019 6,521,136 (252,895) (101,980) (131,904) 122,574 (28,295) 7,888,124 6,209,826 78.7% Non-Core 68.0% 158,235 107,641 (158,235) (106,057) (1,584) - (1,584) - - - TOTALS 78.0% 8,499,254 6,628,777 (252,895) (101,980) (133,488) 122,574 (29,879) 7,888,124 6,209,826 78.7% For the twelve months ended December 31, 2020 Pct. Sq. Ft. Inventory Leased Sq. Ft. Net Sq. Ft. Pct. Leased Inventory Leased Acquired/ Acquired/ Expiring/ Incoming Leasing Inventory Leased Leased 12/31/2019 12/31/2019 12/31/2019 Disposed Disposed Adj. Sq. Ft. Sq. Ft. Activity 12/31/2020 12/31/2020 12/31/2020 Waterfront 77.8% 4,508,801 3,510,055 - - (155,170) 130,403 (24,767) 4,508,801 3,485,288 77.3% Class A Suburban 89.7% 2,155,079 1,932,953 (400,000) (347,899) (317,047) 251,102 (65,945) 1,755,079 1,519,109 86.6% Suburban 79.0% 3,650,198 2,884,391 (2,025,954) (1,584,289) (289,823) 195,150 (94,673) 1,624,244 1,205,429 74.2% Subtotals 80.7% 10,314,078 8,327,399 (2,425,954) (1,932,188) (762,040) 576,655 (185,385) 7,888,124 6,209,826 78.7% Non-Core 70.3% 158,235 111,292 (158,235) (87,294) (33,275) 28,040 (5,235) - - - TOTALS 80.6% 10,472,313 8,438,691 (2,425,954) (1,932,188) (795,315) 604,695 (190,620) 7,888,124 6,209,826 78.7% For the three months ended December 31, 2020 Number of Total Sq. Ft. Sq. Ft. Renewed Weighted Avg. Weighted Avg. Wtd. Avg. Wtd. Avg. Costs Transactions Sq. Ft. New Leases and Other Retained Sq. Ft. Term (Yrs) Base Rent ($) (1) Sq. Ft. Per Year ($) Waterfront 2 6,068 4,242 1,826 3,034 4.3 $50.36 $0.20 Class A Suburban 5 75,052 2,871 72,181 15,010 4.9 49.52 2.63 Suburban 3 41,454 1,300 40,154 13,818 7.2 28.71 1.01 Subtotals 10 122,574 8,413 114,161 12,257 5.6 $42.52 $1.88 Notes: (1) Inclusive of escalations.

34 4Q 2020 Top 15 Tenants Notes: See supporting “Top 15 Tenants” notes on page 37. CLI Office Portfolio Percentage of Annualized Company Square Percentage Year of Number of Base Rental Annualized Base Feet Total Company Lease Properties Revenue ($) (1) Rental Revenue (%) (2) Leased Leased Sq. Ft. (%) (2) Expiration Bank of America Merrill Lynch 2 $11,125,489 5.5% 421,570 7.1% (3) John Wiley & Sons, Inc. 1 10,888,238 5.3% 290,353 4.9% 2033 MUFG Bank, Ltd. 2 10,195,724 5.0% 242,354 4.1% (4) Dun & Bradstreet Corporation 2 7,568,200 3.7% 192,280 3.2% 2023 Investors Bank 3 5,300,455 2.6% 144,552 2.4% (5) E*Trade Financial Corporation 1 5,290,600 2.6% 132,265 2.2% 2031 KPMG LLP 2 5,266,324 2.6% 120,947 2.0% (6) Vonage America Inc. 1 4,924,500 2.4% 350,000 5.9% 2023 Arch Insurance Company 1 4,326,008 2.1% 106,815 1.8% 2024 TP Icap Americas Holdings Inc. 2 4,163,898 2.0% 121,871 2.0% (7) Sumitomo Mitsui Banking Corp. 1 4,156,989 2.0% 111,105 1.9% 2037 (8) First Data Corporation 1 3,684,106 1.8% 88,374 1.5% (9) Brown Brothers Harriman & Co. 1 3,673,536 1.8% 114,798 1.9% 2026 HQ Global Workplaces LLC 4 3,460,735 1.7% 102,737 1.7% (10) Cardinia Real Estate LLC 1 3,112,664 1.5% 79,771 1.3% 2032 Totals $87,137,466 42.8% 2,619,792 44.0%

35 4Q 2020 Lease Expirations Notes: See supporting “Expirations” notes on page 37. CLI Office Portfolio Net Rentable Area Percentage of Total Leased Annualized Base Average Annualized Base Rent Percentage of Annual Year of Expiration/Market Number of Subject to Expiring Square Feet Represented Rental Revenue Under Per Net Rentable Square Foot Base Rent Under Leases Expiring (1) Leases (Sq. Ft.) (2) by Expiring Leases (%) Expiring Leases ($) (3)(4) Represented by Expiring Leases ($) Expiring Leases (%) 2021 Waterfront 18 407,572 6.8 17,224,734 42.26 8.1 Class A Suburban 11 51,012 0.8 1,841,133 36.09 0.9 Suburban 5 57,218 1.0 1,505,330 26.31 0.7 TOTAL – 2021 34 515,802 8.6 20,571,197 39.88 9.7 2022 Waterfront 12 102,307 1.7 4,002,238 39.12 1.9 Class A Suburban 14 137,871 2.3 4,894,661 35.50 2.3 Suburban 9 77,333 1.3 2,199,579 28.44 1.0 TOTAL – 2022 35 317,511 5.3 11,096,478 34.95 5.2 2023 Waterfront 11 324,360 5.4 12,331,295 38.02 5.8 Class A Suburban 19 352,245 5.9 13,901,220 39.46 6.6 Suburban 13 548,467 9.2 10,822,700 19.73 5.1 TOTAL – 2023 43 1,225,072 20.5 37,055,215 30.25 17.5 2024 Waterfront 13 234,673 3.9 9,483,792 40.41 4.5 Class A Suburban 16 218,175 3.7 9,819,761 45.01 4.6 Suburban 13 121,838 2.0 3,579,917 29.38 1.7 TOTAL – 2024 42 574,686 9.6 22,883,470 39.82 10.8 2025 Waterfront 10 116,923 2.0 3,653,423 31.25 1.7 Class A Suburban 16 196,267 3.3 7,245,321 36.92 3.5 Suburban 5 50,730 0.8 1,531,161 30.18 0.7 TOTAL – 2025 31 363,920 6.1 12,429,905 34.16 5.9 2026 Waterfront 11 249,982 4.2 9,030,388 36.12 4.3 Class A Suburban 11 213,629 3.6 7,222,952 33.81 3.4 Suburban 12 104,360 1.7 2,993,026 28.68 1.4 TOTAL – 2026 34 567,971 9.5 19,246,366 33.89 9.1 2027 AND THEREAFTER Waterfront 42 1,837,994 30.7 66,713,611 36.30 31.4 Class A Suburban 15 344,660 5.7 14,342,477 41.61 6.9 Suburban 11 232,214 4.0 7,483,851 32.23 3.5 TOTAL – 2027 AND THEREAFTER 68 2,414,868 40.4 88,539,939 36.66 41.8 TOTALS BY TYPE Waterfront 117 3,273,811 54.7 122,439,481 37.40 57.7 Class A Suburban 102 1,513,859 25.3 59,267,525 39.15 28.2 Suburban 68 1,192,160 20.0 30,115,564 25.26 14.1 Totals/Weighted Average 287 5,979,830 100.0 211,822,570 35.42 100.0
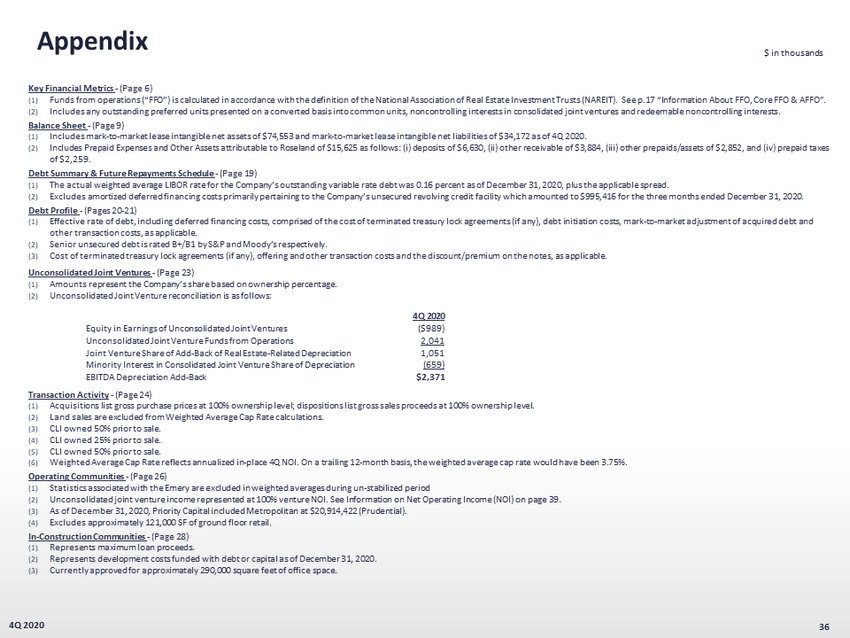
Appendix Key Financial Metrics - (Page 6 ) (1) Funds from operations (“FFO”) is calculated in accordance with the definition of the National Association of Real Estate Investment Trusts (NAREIT) . See p . 17 “Information About FFO, Core FFO & AFFO” . (2) Includes any outstanding preferred units presented on a converted basis into common units, noncontrolling interests in consolidated joint ventures and redeemable noncontrolling interests . Balance Sheet - (Page 9 ) (1) Includes mark - to - market lease intangible net assets of $ 74 , 553 and mark - to - market lease intangible net liabilities of $ 34 , 172 as of 4 Q 2020 . (2) Includes Prepaid Expenses and Other Assets attributable to Roseland of $ 15 , 625 as follows : ( i ) deposits of $ 6 , 630 , (ii) other receivable of $ 3 , 884 , (iii) other prepaids/assets of $ 2 , 852 , and (iv) prepaid taxes of $ 2 , 259 . Debt Summary & Future Repayments Schedule - (Page 19 ) (1) The actual weighted average LIBOR rate for the Company’s outstanding variable rate debt was 0 . 16 percent as of December 31 , 2020 , plus the applicable spread . (2) Excludes amortized deferred financing costs primarily pertaining to the Company’s unsecured revolving credit facility which amounted to $ 995 , 416 for the three months ended December 31 , 2020 . Debt Profile - (Pages 20 - 21) (1) Effective rate of debt, including deferred financing costs, comprised of the cost of terminated treasury lock agreements (if any ), debt initiation costs, mark - to - market adjustment of acquired debt and other transaction costs, as applicable. (2) Senior unsecured debt is rated B+/B1 by S&P and Moody’s respectively. (3) Cost of terminated treasury lock agreements (if any), offering and other transaction costs and the discount/premium on the no tes , as applicable. Unconsolidated Joint Ventures - (Page 23) (1) Amounts represent the Company’s share based on ownership percentage. (2) Unconsolidated Joint Venture reconciliation is as follows: Transaction Activity - (Page 24) (1) Acquisitions list gross purchase prices at 100% ownership level; dispositions list gross sales proceeds at 100% ownership lev el. (2) Land sales are excluded from Weighted Average Cap Rate calculations. (3) CLI owned 50% prior to sale. (4) CLI owned 25% prior to sale. (5) CLI owned 50% prior to sale. (6) Weighted Average Cap Rate reflects annualized in - place 4Q NOI. On a trailing 12 - month basis, the weighted average cap rate would have been 3.75%. Operating Communities - (Page 26) (1) Statistics associated with the Emery are excluded in weighted averages during un - stabilized period (2) Unconsolidated joint venture income represented at 100% venture NOI. See Information on Net Operating Income (NOI) on page 39 . (3) As of December 31, 2020, Priority Capital included Metropolitan at $20,914,422 (Prudential). (4) Excludes approximately 121,000 SF of ground floor retail. In - Construction Communities - (Page 28) (1) Represents maximum loan proceeds. (2) Represents development costs funded with debt or capital as of December 31, 2020. (3) Currently approved for approximately 290,000 square feet of office space. 36 4Q 2020 4Q 2020 Equity in Earnings of Unconsolidated Joint Ventures ($989) Unconsolidated Joint Venture Funds from Operations 2,041 Joint Venture Share of Add - Back of Real Estate - Related Depreciation 1,051 Minority Interest in Consolidated Joint Venture Share of Depreciation (659) EBITDA Depreciation Add - Back $2,371 $ in thousands
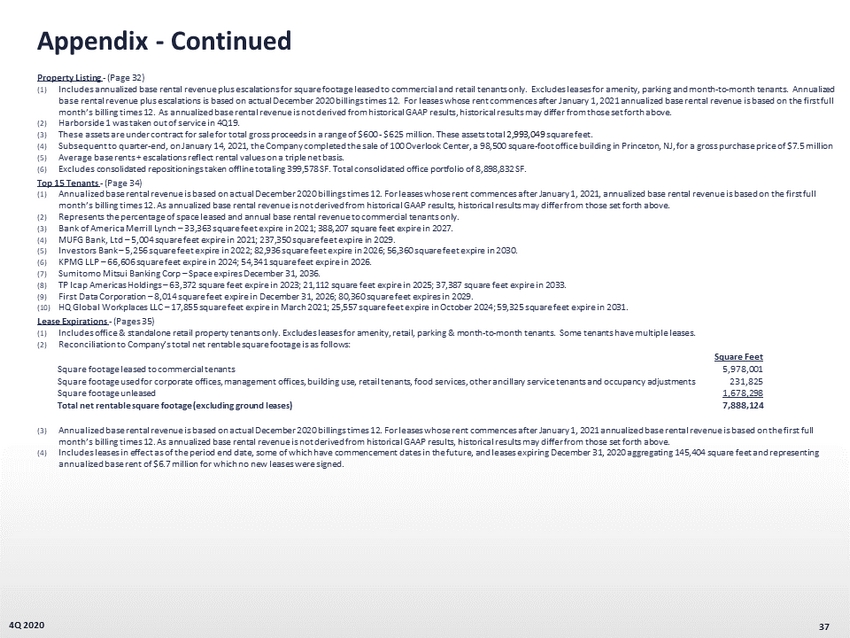
Appendix - Continued Property Listing - (Page 32) (1) Includes annualized base rental revenue plus escalations for square footage leased to commercial and retail tenants only. Ex clu des leases for amenity, parking and month - to - month tenants. Annualized base rental revenue plus escalations is based on actual December 2020 billings times 12. For leases whose rent commences aft er January 1, 2021 annualized base rental revenue is based on the first full month’s billing times 12. As annualized base rental revenue is not derived from historical GAAP results, historical results may differ from those set forth above. (2) Harborside 1 was taken out of service in 4Q19. (3) These assets are under contract for sale for total gross proceeds in a range of $600 - $625 million. These assets total 2,993,049 square feet. (4) Subsequent to quarter - end, on January 14, 2021, the Company completed the sale of 100 Overlook Center, a 98,500 square - foot offi ce building in Princeton, NJ, for a gross purchase price of $7.5 million (5) Average base rents + escalations reflect rental values on a triple net basis. (6) Excludes consolidated repositionings taken offline totaling 399,578 SF. Total consolidated office portfolio of 8,898,832 SF. Top 15 Tenants - (Page 34) (1) Annualized base rental revenue is based on actual December 2020 billings times 12. For leases whose rent commences after Janu ary 1, 2021, annualized base rental revenue is based on the first full month’s billing times 12. As annualized base rental revenue is not derived from historical GAAP results, historical results m ay differ from those set forth above. (2) Represents the percentage of space leased and annual base rental revenue to commercial tenants only. (3) Bank of America Merrill Lynch – 33,363 square feet expire in 2021; 388,207 square feet expire in 2027. (4) MUFG Bank, Ltd – 5,004 square feet expire in 2021; 237,350 square feet expire in 2029. (5) Investors Bank – 5,256 square feet expire in 2022; 82,936 square feet expire in 2026; 56,360 square feet expire in 2030. (6) KPMG LLP – 66,606 square feet expire in 2024; 54,341 square feet expire in 2026. (7) Sumitomo Mitsui Banking Corp – Space expires December 31, 2036. (8) TP Icap Americas Holdings – 63,372 square feet expire in 2023; 21,112 square feet expire in 2025; 37,387 square feet expire in 2033. (9) First Data Corporation – 8,014 square feet expire in December 31, 2026; 80,360 square feet expires in 2029. (10) HQ Global Workplaces LLC – 17,855 square feet expire in March 2021; 25,557 square feet expire in October 2024; 59,325 square fee t expire in 2031. Lease Expirations - (Pages 35) (1) Includes office & standalone retail property tenants only. Excludes leases for amenity, retail, parking & month - to - month tenants . Some tenants have multiple leases. (2) Reconciliation to Company’s total net rentable square footage is as follows: (3) Annualized base rental revenue is based on actual December 2020 billings times 12. For leases whose rent commences after Janu ary 1, 2021 annualized base rental revenue is based on the first full month’s billing times 12. As annualized base rental revenue is not derived from historical GAAP results, historical results m ay differ from those set forth above. (4) Includes leases in effect as of the period end date, some of which have commencement dates in the future, and leases expiring De cember 31, 2020 aggregating 145,404 square feet and representing annualized base rent of $6.7 million for which no new leases were signed. 37 4Q 2020 Square Feet Square footage leased to commercial tenants 5,978,001 Square footage used for corporate offices, management offices, building use, retail tenants, food services, other ancillary service tenants and occupancy adjustments 231,825 Square footage unleased 1,678,298 Total net rentable square footage (excluding ground leases) 7,888,124
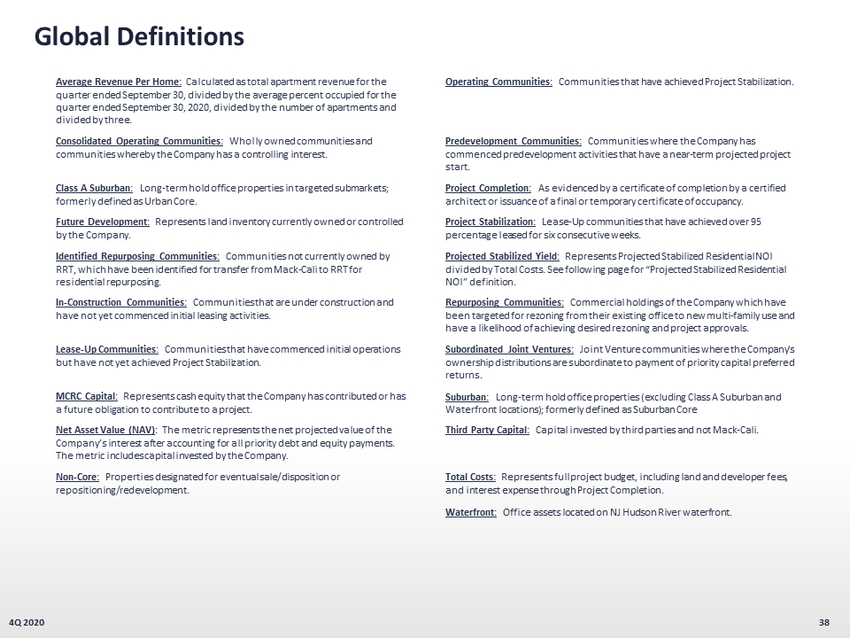
Global Definitions 38 Average Revenue Per Home : Calculated as total apartment revenue for the quarter ended September 30, divided by the average percent occupied for the quarter ended September 30, 2020, divided by the number of apartments and divided by three. Operating Communities : Communities that have achieved Project Stabilization. Consolidated Operating Communities : Wholly owned communities and communities whereby the Company has a controlling interest. Predevelopment Communities : Communities where the Company has commenced predevelopment activities that have a near - term projected project start. Class A Suburban : Long - term hold office properties in targeted submarkets; formerly defined as Urban Core. Project Completion : As evidenced by a certificate of completion by a certified architect or issuance of a final or temporary certificate of occupancy. Future Development : Represents land inventory currently owned or controlled by the Company. Project Stabilization : Lease - Up communities that have achieved over 95 percentage leased for six consecutive weeks. Identified Repurposing Communities : Communities not currently owned by RRT, which have been identified for transfer from Mack - Cali to RRT for residential repurposing. Projected Stabilized Yield : Represents Projected Stabilized Residential NOI divided by Total Costs. See following page for “Projected Stabilized Residential NOI” definition. In - Construction Communities : Communities that are under construction and have not yet commenced initial leasing activities. Repurposing Communities : Commercial holdings of the Company which have been targeted for rezoning from their existing office to new multi - family use and have a likelihood of achieving desired rezoning and project approvals. Lease - Up Communities : Communities that have commenced initial operations but have not yet achieved Project Stabilization. Subordinated Joint Ventures : Joint Venture communities where the Company's ownership distributions are subordinate to payment of priority capital preferred returns. MCRC Capital : Represents cash equity that the Company has contributed or has a future obligation to contribute to a project. Suburban : Long - term hold office properties (excluding Class A Suburban and Waterfront locations); formerly defined as Suburban Core Net Asset Value (NAV) : The metric represents the net projected value of the Company’s interest after accounting for all priority debt and equity payments. The metric includes capital invested by the Company. Third Party Capital : Capital invested by third parties and not Mack - Cali . Non - Core : Properties designated for eventual sale/disposition or repositioning/redevelopment. Total Costs : Represents full project budget, including land and developer fees, and interest expense through Project Completion. Waterfront : Office assets located on NJ Hudson River waterfront. 4Q 2020

Information About Net Operating Income (NOI) 39 4Q 2020 NOI represents total revenues less total operating expenses, as reconciled to net income above . The Company considers NOI to be a meaningful non - GAAP financial measure for making decisions and assessing unlevered performance of its property types and markets, as it relates to total return on assets, as opposed to levered return on equity . As properties are considered for sale and acquisition based on NOI estimates and projections, the Company utilizes this measure to make investment decisions, as well as compare the performance of its assets to those of its peers . NOI should not be considered a substitute for net income, and the Company’s use of NOI may not be comparable to similarly titled measures used by other companies . The Company calculates NOI before any allocations to noncontrolling interests, as those interests do not effect the overall performance of the individual assets being measured and assessed . Definition of Net Operating Income (NOI) Reconciliation of Net Income (Loss) to Net Operating Income (NOI) $ in thousands (unaudited) Office/Corp Roseland Total Office/Corp Roseland Total Net Income (loss) $47,498 $30,800 $78,298 $8,314 ($49,432) ($41,118) Deduct: Real estate services income - (2,766) (2,766) (12) (2,864) (2,876) Interest and other investment loss (income) (1) - (1) (1) (2) (3) Equity in (earnings) loss of unconsolidated joint ventures 2,253 1,298 3,551 (493) (880) (1,373) General & Administrative - property level - (1,397) (1,397) - (1,638) (1,638) Realized (gains) losses and unrealized losses on disposition (41,333) (7,164) (48,497) (15,775) - (15,775) (Gain) loss on disposition of developable land (974) - (974) - - - Gain on sale from unconsolidated joint ventures - (35,184) (35,184) - - - (Gain) loss from early extinguishment of debt, net - 272 272 - - - Add: Real estate services expenses 28 3,420 3,448 42 3,258 3,300 General and administrative 8,801 2,855 11,656 22,946 6,010 28,956 Depreciation and amortization 14,746 15,016 29,762 17,485 15,551 33,036 Interest expense 11,396 9,122 20,518 12,519 9,067 21,586 Property impairments - - - - 36,582 36,582 Land impairments (6,584) - (6,584) 1,292 - 1,292 Net operating income (NOI) $35,830 $16,272 $52,102 $46,317 $15,652 $61,969 4Q 2020 3Q 2020

40 4Q 2020 Company Information, Executive Officers, & Analysts Company Information Corporate Headquarters Stock Exchange Listing Contact Information Mack-Cali Realty Corporation New York Stock Exchange Mack-Cali Realty Corporation Harborside 3, 210 Hudson St., Ste. 400 Investor Relations Department Jersey City, New Jersey 07311 Trading Symbol Harborside 3, 210 Hudson St., Ste. 400 (732) 590-1010 Common Shares: CLI Jersey City, New Jersey 07311 David Smetana Chief Financial Officer Phone: (732) 590-1035 E-Mail: [email protected] Web: www.mack-cali.com Executive Officers MaryAnne Gilmartin Marshall Tycher David Smetana Gary Wagner Interim Chief Executive Officer Chairman, Roseland Residential Trust Chief Financial Officer General Counsel and Secretary Ricardo Cardoso Giovanni M. DeBari EVP and Chief Investment Officer Chief Accounting Officer Equity Research Coverage Bank of America Merrill Lynch Citigroup Green Street Advisors Truist James C. Feldman Michael Bilerman Danny Ismail Michael R. Lewis Barclays Capital Deutsche Bank North America JP Morgan Ross L. Smotrich Derek Johnston Anthony Paolone BTIG, LLC Evercore ISI Stifel Nicolaus & Company, Inc. Thomas Catherwood Steve Sakwa Steve Manaker Analysts, Company Information, and Executive Officers Any opinions, estimates, forecasts or predictions regarding Mack-Cali Realty Corporation's performance made by these analysts are theirs alone and do not represent opinions, estimates, forecasts or predictions of Mack - Cali Realty Corporation or its management. Mack-Cali does not by its reference above or distribution imply its endorsement of or concurrence with such opinions, estimates, forecasts or predictions.
DISCLOSURE REGARDING FORWARD - LOOKING STATEMENTS The Company considers portions of this information, including the documents incorporated by reference, to be forward - looking sta tements within the meaning of Section 21E of the Securities Exchange Act of 1934, as amended. The Company intends such forward - looking statements to be covered by the safe harb or provisions for forward - looking statements contained in Section 21E of such act. Such forward - looking statements relate to, without limitation, our future economic perfor mance, plans and objectives for future operations and projections of revenue and other financial items. Forward - looking statements can be identified by the use of words such as “may ,” “will,” “plan,” “potential,” “projected,” “should,” “expect,” “anticipate,” “estimate,” “target”, “continue” or comparable terminology. Forward - looking statements are inherently s ubject to certain risks, trends and uncertainties, many of which we cannot predict with accuracy and some of which we might not even anticipate. Although the Company believes that the ex pectations reflected in such forward - looking statements are based upon reasonable assumptions at the time made, the Company can give no assurance that such expectations w ill be achieved. Future events and actual results, financial and otherwise, may differ materially from the results discussed in the forward - looking statements. Readers are cautio ned not to place undue reliance on these forward - looking statements. Among the factors about which the Company has made assumptions are: - risks and uncertainties affecting the general economic climate and conditions, which in turn may have a negative effect on th e fundamentals of the Company’s business and the financial condition of the Company’s tenants and residents; - the value of the Company’s real estate assets, which may limit the Company’s ability to dispose of assets at attractive price s or obtain or maintain debt financing secured by our properties or on an unsecured basis; - the extent of any tenant bankruptcies or of any early lease terminations; - The Company’s ability to lease or re - lease space at current or anticipated rents; - changes in the supply of and demand for the Company’s properties; - changes in interest rate levels and volatility in the securities markets; - The Company’s ability to complete construction and development activities on time and within budget, including without limita ti on obtaining regulatory permits and the availability and cost of materials, labor and equipment; - forward - looking financial and operational information, including information relating to future development projects, potential acquisitions or dispositions, leasing activities, capitalization rates and projected revenue and income; - changes in operating costs; - The Company’s ability to obtain adequate insurance, including coverage for terrorist acts; - The Company’s credit worthiness and the availability of financing on attractive terms or at all, which may adversely impact o ur ability to pursue acquisition and development opportunities and refinance existing debt and the Company’s future interest expense; - changes in governmental regulation, tax rates and similar matters; and - other risks associated with the development and acquisition of properties, including risks that the development may not be co mp leted on schedule, that the tenants or residents will not take occupancy or pay rent, or that development or operating costs may be greater than anticipated. In addition, the extent to which the ongoing COVID - 19 pandemic impacts us and our tenants will depend on future developments, wh ich are highly uncertain and cannot be predicted with confidence, including the scope, severity and duration of the pandemic, the actions taken to contain the pandemic or mit iga te its impact, and the direct and indirect economic effects of the pandemic and containment measures, among others. For further information on factors which could impact us and the statements contained herein, see Item 1A: Risk Factors in MC RC’ s Annual Report on Form 10 - K for the year ended December 31, 2019. We assume no obligation to update and supplement forward - looking statements that become untrue because of su bsequent events, new information or otherwise. This Supplemental Operating and Financial Data is not an offer to sell or solicitation to buy any securities of the Mack - Cali Re ality Corporation (“MCRC”). Any offers to sell or solicitations of the MCRC shall be made by means of a prospectus. The information in this Supplemental Package must be read in conjunction wit h, and is modified in its entirety by, the Annual Report on Form 10 - K (the “10 - K”) filed by the MCRC for the same period with the Securities and Exchange Commission (the “SEC”) and all of the MCRC’s other public filings with the SEC (the “Public Filings”). In particular, the financial information contained herein is subject to and qualified by reference to the financia l s tatements contained in the 10 - K, the footnotes thereto and the limitations set forth therein. Investors may not rely on the Supplemental Package without reference to the 10 - K and the Public F ilings. Any investors’ receipt of, or access to, the information contained herein is subject to this qualification. 41 4Q 2020
Exhibit 99.2
M A C K - C A L I R E A L T Y C O R P O R A T I O N
NEWS RELEASE
For Immediate Release
Mack-Cali Realty Corporation
Reports Fourth Quarter and Year End 2020 Results
Jersey City, New Jersey – February 25, 2021 – Mack-Cali Realty Corporation (NYSE: CLI) today reported its results for the fourth quarter and full year 2020.
FOURTH QUARTER 2020 HIGHLIGHTS
| - | Net income (loss) of $0.67 per diluted share for the fourth quarter 2020, as compared to $(0.64) per diluted share for the fourth quarter 2019; and net income (loss) of $(0.70) per diluted share for the year ended December 31, 2020, as compared to $0.95 per diluted share for the same period in 2019; |
| - | Core Funds from Operations per diluted share of $0.16 for the fourth quarter 2020, as compared to $0.44 for the fourth quarter 2019; |
| - | Roseland's 4,890-unit multifamily stabilized portfolio (excluding assets in renovation) was 92.0% leased at December 31, 2020, as compared to 91.7% at September 30, 2020; |
| - | In the fourth quarter, Roseland’s physical same-store occupancy increased sequentially by 130 bps, a trend which has continued in January with an additional 40 bp gain; |
| - | Roseland's adjusted same-store portfolio (excluding assets in renovation), consisting of 2,878 units, experienced a reduction of 9.5% in revenues and 24.1% in NOI over same quarter 2019; |
| - | Roseland successfully completed the lease-up of The Emery, Overlook Ridge, achieving 93% occupancy; |
| - | Leased 122,574 sq. ft. of commercial space: 6,068 sq. ft. on the Waterfront, 116,506 sq. ft. in class A suburban and suburban; |
| - | Core office portfolio was 78.7% leased; with the Waterfront at 77.3%, class A suburban portfolio at 86.6%, and Suburban at 74.2% leased; and |
| - | Office same-store portfolio, consisting of 4.5 million sq. ft., experienced a reduction of 4.4% in Cash NOI and 14.0% in GAAP NOI in the fourth quarter 2020 over the fourth quarter 2019. |
MaryAnne Gilmartin, Mack-Cali Board Chair and Interim Chief Executive Officer, stated, “The team remained focused on execution of its strategic initiatives while effectively navigating the challenges of the pandemic in 2020. We made meaningful progress on our non-core asset sales and are well-positioned to execute on our stated strategy of exiting the Suburban Office Portfolio this year.”
FINANCIAL HIGHLIGHTS
* All per share amounts presented below are on a diluted basis.
Net income (loss) available to common shareholders for the quarter ended December 31, 2020 was $65.6 million, or $0.67 per share, as compared to $(54.7) million, or $(0.64) per share, for the quarter ended December 31, 2019. For the year ended December 31, 2020, net income (loss) available to common shareholders equaled $(51.4) million, or $(0.70) per share, as compared to $111.9 million, or $0.95 per share, for the same period last year.
Funds from operations (FFO) for the quarter ended December 31, 2020 was $23.3 million, or $0.23 per share, as compared to $12.2 million, or $0.12 per share, for the quarter ended December 31, 2019. For the year ended December 31, 2020, FFO equaled $68.1 million, or $0.68 per share, as compared to $116.1 million, or $1.15 per share, for the same period last year.
For the fourth quarter 2020, Core FFO was $16.2 million, or $0.16 per share, as compared to $44.1 million, or $0.44 per share for the same period last year. For the year ended December 31, 2020, Core FFO equaled $107.3 million, or $1.07 per share, as compared to $163.1 million, or $1.62 per share, for the same period last year.
OPERATING HIGHLIGHTS
Office
The Company's consolidated Core office properties (including discontinued operations) were 78.7 percent leased at December 31, 2020, as compared to 78.2 percent leased at September 30, 2020 and 80.7 percent leased at December 31, 2019.
For the office portfolio, fourth quarter 2020 same-store GAAP revenues and same-store GAAP NOI were off 7.3 percent and 14.0 percent, respectively from the same period in 2019. Same store cash revenues and same-store cash NOI for the office portfolio for the fourth quarter declined by 1.1 percent and 4.4 percent, respectively from 2019. Same store cash revenues and same store cash NOI exclude straight-line rent and FAS 141 adjustments.
For the quarter ended December 31, 2020, the Company executed ten leases at its commercial office portfolio, totaling 122,574 square feet. Of these totals, three leases for 8,413 square feet (6.9 percent) were for new leases and seven leases for 114,161 square feet (93.1 percent) were lease renewals and other tenant retention transactions.
Multifamily
Roseland's stabilized operating portfolio was 92 percent leased at December 31, 2020 (excluding assets in renovation). Roseland’s overall operating portfolio was 90.2 percent leased at December 31, 2020 as compared to 89.5 percent at September 30, 2020. Roseland's same-store portfolio, consisting of 3,813 units, experienced a decrease in NOI and revenue of 32.8 percent and 12.5 percent, respectively over fourth quarter 2019. During the same period expenses rose by 24.2 percent. Excluding assets in renovation, adjusted same-store revenues decreased by 9.5 percent resulting in a same-store net operating income decrease of 24.1 percent for the fourth quarter 2020, as compared to fourth quarter 2019. For the year ended December 31, 2020, adjusted same-store revenues decreased 1.1 percent and NOI decreased 6.2 percent over the same period in 2019.
At quarter end, Roseland had 1,616 units under construction across four projects. This aggregate $900 million construction portfolio has a projected stabilized yield of approximately 6.15 percent.
TRANSACTION ACTIVITY
In the fourth quarter, the Company completed the sale of four office buildings and land across its Suburban portfolio including: 5 Vaughn Drive, a 98,500-square-foot office building in Princeton, NJ for a total of $7.5 million; 7 Campus Drive, a 154,395-square-foot office building in Parsippany, NJ, for approximately $12.75 million; 581 Main Street, a 200,000-square-foot office building in Woodbridge Township, NJ, for approximately $61 million; 500 College Road, a 158,235-square-foot office building in Princeton, NJ for $10.0 million; and 14 & 16 Skyline, a land site in Hawthorne, NY, for approximately $3.0 million.
During the fourth quarter, Roseland disposed of two operating assets (Riverwatch Commons and Crystal House) and development sites in Arlington, VA and Hillsborough, NJ at gross prices of $427.8 million (CLI share of proceeds of $82.9 million).
Subsequent to year-end, the Company completed the sale of 100 Overlook Center, a 149,600-square-foot office building in Princeton, NJ for $38.0 million.
The Company’s remaining suburban New Jersey office portfolios in Monmouth, Short Hills and MetroPark are all under contract and are expected to be sold by early second quarter 2021.
BALANCE SHEET/CAPITAL MARKETS
As of December 31, 2020, the Company had a debt-to-undepreciated assets ratio of 48.4 percent compared to 49.8 percent at September 30, 2020 and 48.0 percent at December 31, 2019. Net debt to adjusted EBITDA for the quarter ended December 31, 2020 was 15.8x compared to 9.7x for the quarter ended December 31, 2019. The Company's interest coverage ratio was 2.1x for the quarter ended December 31, 2020, compared to 3.0x for the quarter ended December 31, 2019.
DIVIDEND
On September 30, 2020, the Company announced that it was suspending its common dividends and distributions attributable to the third and fourth quarters 2020. As the Company’s management estimated that as of September 2020 it had satisfied its dividends obligations as a REIT on taxable income expected for 2020, the Company made the strategic decision to suspend its common dividends and distributions for the remainder of 2020 in an effort to provide greater financial flexibility during the pandemic and to retain incremental capital to support leasing initiatives at its Harborside commercial office properties on the Jersey City waterfront.
GUIDANCE
The Company is presenting initial Core FFO guidance of $0.12 - $0.15 per diluted share for first quarter 2021, as follows:
| First Quarter | ||||||||
| 2021 Range | ||||||||
| Low | High | |||||||
| Net income (loss) available to common shareholders | $ | (0.44 | ) | - | $ | (0.41 | ) | |
| Add (deduct): | ||||||||
| Real estate-related depreciation and amortization | 0.56 | |||||||
| Core FFO | $ | 0.12 | - | $ | 0.15 | |||
CONFERENCE CALL/SUPPLEMENTAL INFORMATION
An earnings conference call with management is scheduled for February 26, 2021 at 8:30 a.m. Eastern Time, which will be broadcast live via the Internet at:
https://edge.media-server.com/mmc/p/k6ujzvmx
The live conference call is also accessible by calling (323) 289-6576 and requesting the Mack-Cali earnings conference call or passcode 5369397.
The conference call will be rebroadcast on Mack-Cali’s website at http://investors.mack-cali.com/corporate-overview beginning at 10:30 a.m. Eastern Time on February 26, 2021.
A replay of the call will also be accessible February 26, 2021 through March 5, 2021 by calling (719) 457-0820 and using the pass code, 5369397.
Copies of Mack-Cali’s 2020 Form 10-K and fourth quarter Supplemental Operating and Financial Data are available on Mack-Cali’s website, as follows:
2020 Form 10-K:
http://investors.mack-cali.com/sec-filings
Fourth Quarter 2020 Supplemental Operating and Financial Data:
http://investors.mack-cali.com/quarterly-supplementals
In addition, once filed, these items will be available upon request from:
Mack-Cali Investor Relations Department
Harborside 3, 210 Hudson St., Ste. 400, Jersey City, New Jersey 07311
INFORMATION ABOUT FFO
Funds from operations (“FFO”) is defined as net income (loss) before noncontrolling interests in Operating Partnership, computed in accordance with generally accepted accounting principles (“GAAP”), excluding gains or losses from depreciable rental property transactions (including both acquisitions and dispositions), and impairments related to depreciable rental property, plus real estate-related depreciation and amortization. The Company believes that FFO per
share is helpful to investors as one of several measures of the performance of an equity REIT. The Company further believes that as FFO per share excludes the effect of depreciation, gains (or losses) from property transactions and impairments related to depreciable rental property (all of which are based on historical costs which may be of limited relevance in evaluating current performance), FFO per share can facilitate comparison of operating performance between equity REITs.
FFO per share should not be considered as an alternative to net income available to common shareholders per share as an indication of the Company’s performance or to cash flows as a measure of liquidity. FFO per share presented herein is not necessarily comparable to FFO per share presented by other real estate companies due to the fact that not all real estate companies use the same definition. However, the Company’s FFO per share is comparable to the FFO per share of real estate companies that use the current definition of the National Association of Real Estate Investment Trusts (“NAREIT”). A reconciliation of net income per share to FFO per share is included in the financial tables accompanying this press release.
Core FFO is defined as FFO, as adjusted for certain items to facilitate comparative measurement of the Company's performance over time. Core FFO is presented solely as supplemental disclosure that the Company's management believes provides useful information to investors and analysts of its results, after adjusting for certain items to facilitate comparability of its performance from period to period. Core FFO is a non-GAAP financial measure that is not intended to represent cash flow and is not indicative of cash flows provided by operating activities as determined in accordance with GAAP. As there is not a generally accepted definition established for Core FFO, the Company's measures of Core FFO may not be comparable to the Core FFO reported by other REITs. A reconciliation of net income per share to Core FFO in dollars and per share is included in the financial tables accompanying this press release.
ABOUT THE COMPANY
One of the country's leading real estate investment trusts (REITs), Mack-Cali Realty Corporation is an owner, manager and developer of premier office and multifamily properties in select waterfront and transit-oriented markets throughout New Jersey. Mack-Cali is headquartered in Jersey City, New Jersey, and is the visionary behind the city's flourishing waterfront, where the company is leading development, improvement and place-making initiatives for Harborside, a master-planned destination comprised of class A office, luxury apartments, diverse retail and restaurants, and public spaces.
A fully integrated and self-managed company, Mack-Cali has provided world-class management, leasing, and development services throughout New Jersey and the surrounding region for over two decades. By regularly investing in its properties and innovative lifestyle amenity packages, Mack-Cali creates environments that empower tenants and residents to reimagine the way they work and live.
Additional information on Mack-Cali Realty Corporation and the commercial real estate properties and multifamily residential communities available for lease can be found on the Company’s website at www.mack-cali.com.
The information in this press release must be read in conjunction with, and is modified in its entirety by, the Annual Report on Form 10-K (the “10-K”) filed by the Company for the same period with the Securities and Exchange Commission (the “SEC”) and all of the Company’s other public filings with the SEC (the “Public Filings”). In particular, the financial information contained herein is subject to and qualified by reference to the financial statements contained in the 10-K, the footnotes thereto and the limitations set forth therein. Investors may not rely on the press release without reference to the 10-K and the Public Filings.
We consider portions of this report, including the documents incorporated by reference, to be forward-looking statements within the meaning of Section 21E of the Securities Exchange Act of 1934, as amended. We intend such forward-looking statements to be covered by the safe harbor provisions for forward-looking statements contained in Section 21E of such act. Such forward-looking statements relate to, without limitation, our future economic performance, plans and objectives for future operations and projections of revenue and other financial items. Forward-looking statements can be identified by the use of words such as “may,” “will,” “plan,” “potential,” “projected,” “should,” “expect,” “anticipate,” “estimate,” "target," “continue” or comparable terminology. Forward-looking statements are inherently subject to certain risks, trends and uncertainties, many of which we cannot predict with accuracy and some of which we might not even anticipate. Although we believe that the expectations reflected in such forward-looking statements are based upon reasonable assumptions at the time made, we can give no assurance that such expectations will be achieved. Future events and actual results, financial and otherwise, may differ materially from the results discussed in the forward-looking statements. Readers are cautioned not to place undue reliance on these forward-looking statements and are advised to consider the factors listed above together with the additional factors under the heading "Disclosure Regarding Forward-Looking Statements" and "Risk Factors" in the Company's Annual Report on Form 10-K, as may be supplemented or amended by the Company's Quarterly Reports on Form 10-Q, which are incorporated herein by reference. The Company assumes no obligation to update or supplement forward-looking statements that become untrue because of subsequent events, new information or otherwise, except as required under applicable law.
In addition, the extent to which the ongoing COVID-19 pandemic impacts us and our tenants will depend on future developments, which are highly uncertain and cannot be predicted with confidence, including the scope, severity and duration of the pandemic, the actions taken to contain the pandemic or mitigate its impact, and the direct and indirect economic effects of the pandemic and containment measures, among others.
| Media Contact: | |||
| Jeremy Soffin | |||
| [email protected] | |||
| (646) 200-5318 |
Mack-Cali Realty Corporation
Consolidated Statements of Operations
(In thousands, except per share amounts) (unaudited)
| Three Months Ended | Year Ended | |||||||||||||||
| December 31, | December 31, | |||||||||||||||
| REVENUES | 2020 | 2019 | 2020 | 2019 | ||||||||||||
| Revenue from leases | $ | 67,238 | $ | 72,749 | $ | 272,970 | $ | 302,409 | ||||||||
| Real estate services | 2,766 | 3,090 | 11,390 | 13,873 | ||||||||||||
| Parking income | 3,272 | 5,760 | 15,604 | 21,857 | ||||||||||||
| Hotel income | 997 | 4,139 | 4,287 | 9,841 | ||||||||||||
| Other income | 2,291 | 2,489 | 9,311 | 9,222 | ||||||||||||
| Total revenues | 76,564 | 88,227 | 313,562 | 357,202 | ||||||||||||
| EXPENSES | ||||||||||||||||
| Real estate taxes | 12,881 | 10,389 | 45,825 | 44,817 | ||||||||||||
| Utilities | 3,153 | 3,276 | 13,717 | 17,881 | ||||||||||||
| Operating services | 17,134 | 17,120 | 68,313 | 70,409 | ||||||||||||
| Real estate services expenses | 3,448 | 3,768 | 13,555 | 15,918 | ||||||||||||
| General and administrative | 11,636 | 16,963 | 73,641 | 59,805 | ||||||||||||
| Depreciation and amortization | 28,931 | 36,302 | 122,035 | 133,597 | ||||||||||||
| Property impairments | - | - | 36,582 | - | ||||||||||||
| Land and other impairments | (6,584 | ) | 27,356 | 16,817 | 32,444 | |||||||||||
| Total expenses | 70,599 | 115,174 | 390,485 | 374,871 | ||||||||||||
| OTHER (EXPENSE) INCOME | ||||||||||||||||
| Interest expense | (19,197 | ) | (22,751 | ) | (80,991 | ) | (90,569 | ) | ||||||||
| Interest and other investment income (loss) | 1 | 886 | 43 | 2,412 | ||||||||||||
| Equity in earnings (loss) of unconsolidated joint ventures | (3,551 | ) | (437 | ) | (3,832 | ) | (1,319 | ) | ||||||||
| Gain on change of control of interests | - | - | - | 13,790 | ||||||||||||
| Realized gains (losses) and unrealized losses on disposition of rental property, net | 13,396 | 109,404 | 5,481 | 343,102 | ||||||||||||
| Gain (loss) on disposition of developable land | 974 | (44 | ) | 5,787 | 522 | |||||||||||
| Gain on sale from unconsolidated joint ventures | 35,184 | - | 35,184 | 903 | ||||||||||||
| Gain (loss) from extinguishment of debt, net | (272 | ) | (153 | ) | (272 | ) | 1,648 | |||||||||
| Total other income (expense) | 26,535 | 86,905 | (38,600 | ) | 270,489 | |||||||||||
| Income (loss) from continuing operations | 32,500 | 59,958 | (115,523 | ) | 252,820 | |||||||||||
| Discontinued operations: | ||||||||||||||||
| Income from discontinued operations | 10,697 | 2,119 | 70,724 | 24,366 | ||||||||||||
| Realized gains (losses) and unrealized losses on disposition of rental property and impairments, net | 35,101 | (117,485 | ) | 11,201 | (133,350 | ) | ||||||||||
| Total discontinued operations, net | 45,798 | (115,366 | ) | 81,925 | (108,984 | ) | ||||||||||
| Net income (loss) | 78,298 | (55,408 | ) | (33,598 | ) | 143,836 | ||||||||||
| Noncontrolling interests in consolidated joint ventures | 795 | 1,404 | 2,695 | 3,904 | ||||||||||||
| Noncontrolling interest in Operating Partnership of income from continuing operations | (2,582 | ) | (5,285 | ) | 13,279 | (23,720 | ) | |||||||||
| Noncontrolling interests in Operating Partnership in discontinued operations | (4,409 | ) | 11,108 | (7,880 | ) | 10,456 | ||||||||||
| Redeemable noncontrolling interests | (6,470 | ) | (6,471 | ) | (25,883 | ) | (22,615 | ) | ||||||||
| Net income (loss) available to common shareholders | $ | 65,632 | $ | (54,652 | ) | $ | (51,387 | ) | $ | 111,861 | ||||||
| Basic earnings per common share: | ||||||||||||||||
| Income (loss) from continuing operations | $ | 0.22 | $ | 0.51 | $ | (1.51 | ) | 2.04 | ||||||||
| Discontinued operations | 0.45 | (1.15 | ) | 0.81 | (1.09 | ) | ||||||||||
| Net income (loss) available to common shareholders | $ | 0.67 | $ | (0.64 | ) | $ | (0.70 | ) | $ | 0.95 | ||||||
| Diluted earnings per common share: | ||||||||||||||||
| Income (loss) from continuing operations | $ | 0.22 | $ | 0.51 | $ | (1.51 | ) | $ | 2.04 | |||||||
| Discontinued operations | 0.45 | (1.15 | ) | 0.81 | (1.09 | ) | ||||||||||
| Net income (loss) available to common shareholders | $ | 0.67 | $ | (0.64 | ) | $ | (0.70 | ) | $ | 0.95 | ||||||
| Basic weighted average shares outstanding | 90,677 | 90,611 | 90,648 | 90,557 | ||||||||||||
| Diluted weighted average shares outstanding | 100,338 | 100,264 | 100,260 | 100,689 | ||||||||||||
Mack-Cali Realty Corporation
Statements of Funds from Operations and Core FFO
(in thousands, except per share/unit amounts) (unaudited)
| Three Months Ended | Year Ended | |||||||||||||||
| December 31, | December 31, | |||||||||||||||
| 2020 | 2019 | 2020 | 2019 | |||||||||||||
| Net income (loss) available to common shareholders | $ | 65,632 | $ | (54,652 | ) | $ | (51,387 | ) | $ | 111,861 | ||||||
| Add (deduct): Noncontrolling interests in Operating Partnership | 2,582 | 5,285 | (13,279 | ) | 23,720 | |||||||||||
| Noncontrolling interests in discontinued operations | 4,409 | (11,108 | ) | 7,880 | (10,456 | ) | ||||||||||
| Real estate-related depreciation and amortization on continuing operations (a) | 30,960 | 39,550 | 132,816 | 144,932 | ||||||||||||
| Real estate-related depreciation and amortization on discontinued operations | 831 | 21,381 | 4,806 | 70,614 | ||||||||||||
| Property Impairments on continuing operations | - | - | 36,582 | - | ||||||||||||
| Property Impairments on discontinued operations | - | - | - | 11,696 | ||||||||||||
| Impairment of unconsolidated joint venture investment (included in Equity in earnings) | 2,562 | 3,661 | 2,562 | 3,661 | ||||||||||||
| Gain on change of control of interests | - | - | - | (13,790 | ) | |||||||||||
| Gain on sale from unconsolidated joint ventures | (35,184 | ) | - | (35,184 | ) | (903 | ) | |||||||||
| Continuing operations: Realized (gains) losses and unrealized losses on disposition of rental property, net | (13,396 | ) | (109,404 | ) | (5,481 | ) | (343,102 | ) | ||||||||
| Discontinued operations: Realized (gains) losses and unrealized losses on disposition of rental property, net | (35,101 | ) | 117,485 | (11,201 | ) | 117,898 | ||||||||||
| Funds from operations (b) | $ | 23,295 | $ | 12,198 | $ | 68,114 | $ | 116,131 | ||||||||
| Add (Deduct): | ||||||||||||||||
| (Gain) loss from extinguishment of debt, net | 272 | 153 | 272 | (1,648 | ) | |||||||||||
| Land and other impairments | (6,584 | ) | 27,356 | 16,817 | 36,200 | |||||||||||
| (Gain) on disposition of developable land | (974 | ) | 44 | (5,787 | ) | (522 | ) | |||||||||
| Dead deal costs | - | - | 2,860 | 271 | ||||||||||||
| Severance/separation costs on management restructuring | 191 | - | 11,929 | 1,839 | ||||||||||||
| Strategic direction costs | - | 4,629 | - | 4,629 | ||||||||||||
| Management contract termination costs | - | - | - | 1,021 | ||||||||||||
| Reporting systems conversion costs | - | 998 | 363 | 998 | ||||||||||||
| Proxy fight costs | - | - | 12,770 | 4,171 | ||||||||||||
| New payroll tax consulting costs | - | - | - | 1,313 | ||||||||||||
| Noncontrolling interest share on consolidated joint ventures impairment charges | - | (1,263 | ) | - | (1,263 | ) | ||||||||||
| Core FFO | $ | 16,200 | $ | 44,115 | $ | 107,338 | $ | 163,140 | ||||||||
| Diluted weighted average shares/units outstanding (c) | 100,338 | 100,264 | 100,260 | 100,689 | ||||||||||||
| Funds from operations per share/unit-diluted | $ | 0.23 | $ | 0.12 | $ | 0.68 | $ | 1.15 | ||||||||
| Core funds from operations per share/unit diluted | $ | 0.16 | $ | 0.44 | $ | 1.07 | $ | 1.62 | ||||||||
| Dividends declared per common share | $ | - | $ | 0.20 | $ | 0.40 | $ | 0.80 | ||||||||
| Supplemental Information: | ||||||||||||||||
| Non-incremental revenue generating capital expenditures: | ||||||||||||||||
| Building improvements | $ | 4,365 | $ | 6,012 | $ | 11,690 | $ | 12,418 | ||||||||
| Tenant improvements & leasing commissions (d) | $ | 6,248 | $ | 9,354 | $ | 21,295 | $ | 29,330 | ||||||||
| Tenant improvements & leasing commissions on space vacant for more than a year | $ | 2,479 | $ | 888 | $ | 13,132 | $ | 14,724 | ||||||||
| Straight-line rent adjustments (e) | $ | 2,184 | $ | 4,084 | $ | 3,928 | $ | 14,616 | ||||||||
| Amortization of (above)/below market lease intangibles, net (f) | $ | 1,048 | $ | 1,116 | $ | 3,709 | $ | 4,268 | ||||||||
| Amortization of stock compensation | $ | 2,019 | $ | 2,192 | $ | 7,926 | $ | 8,481 | ||||||||
| Amortization of lease inducements | $ | (21 | ) | $ | (15 | ) | $ | 55 | $ | 460 | ||||||
| Non real estate depreciation and amortization | $ | 342 | $ | 431 | $ | 1,610 | $ | 2,092 | ||||||||
| Amortization of deferred financing costs | $ | 1,467 | $ | 1,147 | $ | 4,625 | $ | 4,625 | ||||||||
| (a) | Includes the Company’s share from unconsolidated joint ventures, and adjustments for noncontrolling interests, of $2,371 and $3,677 for the three months ended December 31, 2020 and 2019, respectively, and $12,391 and $13,018 for the years ended December 31, 2020 and 2019, respectively. Excludes non-real estate-related depreciation and amortization of $342 and $431 for the three months ended December 31, 2020 and 2019, respectively, and $1,610 and $2,092 for the years ended December 31, 2020 and 2019, respectively. |
| (b) | Funds from operations is calculated in accordance with the definition of FFO of the National Association of Real Estate Investment Trusts (NAREIT). See "Information About FFO" in this release. |
| (c) | Calculated based on weighted average common shares outstanding, assuming redemption of Operating Partnership common units into common shares (9,412 and 9,530 shares for the three months ended December 31, 2020 and 2019, respectively, and 9,411 and 9,852 for the years ended December 31, 2020 and 2019, respectively), plus dilutive Common Stock Equivalents (i.e. stock options). |
| (d) | Excludes expenditures for tenant spaces that have not been owned for at least a year. |
| (e) | Includes free rent of $4,972 and $5,329 for the three months ended December 31, 2020 and 2019, respectively, and $15,159 and $21,424 for the years ended December 31, 2020 and 2019, respectively. Also, includes the Company's share from unconsolidated joint ventures of $108 and $186 for the three months ended December 31, 2020 and 2019, respectively, and $177 and $127 for the years ended December 31, 2020 and 2019, respectively. |
| (f) | Includes the Company's share from unconsolidated joint ventures of $0 and $0 for the three months ended December 31, 2020 and 2019, respectively, and $0 and $0 for the years ended December 31, 2020 and 2019, respectively. |
Statements of Funds from Operations (FFO) and Core FFO per Diluted Share
(amounts are per diluted share, except share counts in thousands) (unaudited)
| Three Months Ended | Year Ended | |||||||||||||||
| December 31, | December 31, | |||||||||||||||
| 2020 | 2019 | 2020 | 2019 | |||||||||||||
| Net income (loss) available to common shareholders | $ | 0.67 | $ | (0.64 | ) | $ | (0.70 | ) | $ | 0.95 | ||||||
| Add (deduct): Real estate-related depreciation and amortization on continuing operations (a) | 0.31 | 0.39 | 1.32 | 1.44 | ||||||||||||
| Real estate-related depreciation and amortization on discontinued operations | 0.01 | 0.21 | 0.05 | 0.70 | ||||||||||||
| Redemption value adjustment to redeemable noncontrolling interests | 0.05 | 0.03 | 0.13 | 0.29 | ||||||||||||
| Property impairments on continuing operations | - | - | 0.36 | - | ||||||||||||
| Property Impairments on discontinued operations | - | - | - | 0.12 | ||||||||||||
| Impairment of unconsolidated joint venture investment (included in Equity in earnings) | 0.03 | 0.04 | 0.03 | 0.04 | ||||||||||||
| Gain on change of control of interests | - | - | - | (0.14 | ) | |||||||||||
| Gain on sale from unconsolidated joint ventures | (0.35 | ) | - | (0.35 | ) | (0.01 | ) | |||||||||
| Continuing operations: Realized (gains) losses and unrealized losses on disposition of rental property, net | (0.13 | ) | (1.09 | ) | (0.05 | ) | (3.41 | ) | ||||||||
| Discontinued operations: Realized (gains) losses and unrealized losses on disposition of rental property, net | (0.35 | ) | 1.17 | (0.11 | ) | 1.17 | ||||||||||
| Noncontrolling interest/rounding adjustment | (0.01 | ) | 0.01 | - | - | |||||||||||
| Funds from operations (b) | $ | 0.23 | $ | 0.12 | $ | 0.68 | $ | 1.15 | ||||||||
| Add (Deduct): | ||||||||||||||||
| (Gain) loss from extinguishment of debt, net | - | - | - | (0.02 | ) | |||||||||||
| Land and other impairments | (0.07 | ) | 0.27 | 0.17 | 0.36 | |||||||||||
| Dead deal costs | - | - | 0.03 | - | ||||||||||||
| (Gain) on disposition of developable land | (0.01 | ) | - | (0.06 | ) | (0.01 | ) | |||||||||
| Strategic direction costs | - | 0.05 | - | 0.05 | ||||||||||||
| Severance/separation costs on management restructuring | - | - | 0.12 | 0.02 | ||||||||||||
| Management contract termination costs / reporting system conversion costs | - | 0.01 | - | 0.02 | ||||||||||||
| Proxy fight costs | - | - | 0.13 | 0.04 | ||||||||||||
| New payroll tax consulting costs | - | - | - | 0.01 | ||||||||||||
| Noncontrolling interest share on consolidated joint ventures | - | (0.01 | ) | - | (0.01 | ) | ||||||||||
| Noncontrolling interest/rounding adjustment | 0.01 | - | - | 0.01 | ||||||||||||
| Core FFO | $ | 0.16 | $ | 0.44 | $ | 1.07 | $ | 1.62 | ||||||||
| Diluted weighted average shares/units outstanding (c) | 100,338 | 100,264 | 100,260 | 100,689 | ||||||||||||
| (a) | Includes the Company’s share from unconsolidated joint ventures of $0.03 and $0.04 for the three months ended December 31, 2020 and 2019, respectively, and $0.15 and $0.17 for the years ended December 31, 2020 and 2019, respectively. |
| (b) | Funds from operations is calculated in accordance with the definition of FFO of the National Association of Real Estate Investment Trusts (NAREIT). See “Information About FFO” in this release. |
| (c) | Calculated based on weighted average common shares outstanding, assuming redemption of Operating Partnership common units into common shares (9,412 and 9,530 shares for the three months ended December 31, 2020 and 2019, respectively, and 9,411 and 9,852 for the years ended December 31, 2020 and 2019, respectively), plus dilutive Common Stock Equivalents (i.e. stock options). |
Mack-Cali Realty Corporation
Consolidated Balance Sheets
(in thousands, except per share amounts) (unaudited)
| December 31, | December 31, | |||||||
| Assets | 2020 | 2019 | ||||||
| Rental property | ||||||||
| Land and leasehold interests | $ | 639,636 | $ | 653,231 | ||||
| Buildings and improvements | 3,743,831 | 3,361,435 | ||||||
| Tenant improvements | 171,623 | 163,299 | ||||||
| Furniture, fixtures and equipment | 83,553 | 78,716 | ||||||
| 4,638,643 | 4,256,681 | |||||||
| Less – accumulated depreciation and amortization | (656,331 | ) | (558,617 | ) | ||||
| 3,982,312 | 3,698,064 | |||||||
| Rental property held for sale, net | 656,963 | 966,497 | ||||||
| Net investment in rental property | 4,639,275 | 4,664,561 | ||||||
| Cash and cash equivalents | 38,096 | 25,589 | ||||||
| Restricted cash | 14,207 | 15,577 | ||||||
| Investments in unconsolidated joint ventures | 162,382 | 209,091 | ||||||
| Unbilled rents receivable, net | 84,907 | 95,686 | ||||||
| Deferred charges, goodwill and other assets, net | 199,541 | 275,102 | ||||||
| Accounts receivable | 9,378 | 7,192 | ||||||
| Total assets | $ | 5,147,786 | $ | 5,292,798 | ||||
| Liabilities and Equity | ||||||||
| Senior unsecured notes, net | $ | 572,653 | $ | 571,484 | ||||
| Unsecured revolving credit facility and term loans | 25,000 | 329,000 | ||||||
| Mortgages, loans payable and other obligations, net | 2,204,144 | 1,908,034 | ||||||
| Dividends and distributions payable | 1,493 | 22,265 | ||||||
| Accounts payable, accrued expenses and other liabilities | 194,717 | 209,510 | ||||||
| Rents received in advance and security deposits | 34,101 | 39,463 | ||||||
| Accrued interest payable | 10,001 | 10,185 | ||||||
| Total liabilities | 3,042,109 | 3,089,941 | ||||||
| Commitments and contingencies | ||||||||
| Redeemable noncontrolling interests | 513,297 | 503,382 | ||||||
| Equity: | ||||||||
| Mack-Cali Realty Corporation stockholders’ equity: | ||||||||
| Common stock, $0.01 par value, 190,000,000 shares authorized, | ||||||||
| 90,712,417 and 90,595,176 shares outstanding | 907 | 906 | ||||||
| Additional paid-in capital | 2,528,187 | 2,535,440 | ||||||
| Dividends in excess of net earnings | (1,130,277 | ) | (1,042,629 | ) | ||||
| Accumulated other comprehensive income (loss) | - | (18 | ) | |||||
| Total Mack-Cali Realty Corporation stockholders’ equity | 1,398,817 | 1,493,699 | ||||||
| Noncontrolling interests in subsidiaries: | ||||||||
| Operating Partnership | 148,791 | 158,480 | ||||||
| Consolidated joint ventures | 44,772 | 47,296 | ||||||
| Total noncontrolling interests in subsidiaries | 193,563 | 205,776 | ||||||
| Total equity | 1,592,380 | 1,699,475 | ||||||
| Total liabilities and equity | $ | 5,147,786 | $ | 5,292,798 | ||||