Centerra Gold Records 2020 Net Earnings of $408.5 million or $1.39 per Common Share, Adjusted Net Earnings (Non-GAAP) of $461.9 million or $1.57 per Common Share, Cash from Operations of $930.0 millio
All figures are in United States dollars and all production figures are on a 100% basis unless otherwise stated. This news release contains forward looking information regarding Centerra Gold’s business and operations. See “Caution Regarding Forward-Looking Information”. All references in this document denoted with NG, indicate a non-GAAP term which is discussed under “Non-GAAP Measures” and reconciled to the most directly comparable GAAP measure.
TORONTO, Feb. 24, 2021 (GLOBE NEWSWIRE) -- Centerra Gold Inc. (“Centerra” or the “Company”) (TSX: CG) today reported its fourth quarter 2020 results. Key events and operating results of the fourth quarter and year ended December 31, 2020 included:
- Net earnings and adjusted net earningsNG for the quarter of $95.2 million, $0.32 per common share (basic), and $104.5 million, $0.35 per common share (basic), respectively. Net earnings and adjusted net earningsNG for the year of $408.5 million, $1.39 per common share (basic) and $461.9 million, $1.57 per common share (basic), respectively.
- Cash flow from operations and free cash flowNG for the quarter of $182.0 million and $76.8 million, respectively. Cash flow from operations and free cash flowNG for the year of $930.0 million and $603.8 million, respectively.
- Cash position of $545.2 million at year-end.
- Gold Production for the quarter of 172,446 ounces and gold production for the year of 824,059 ounces.
- Copper production for the quarter of 20.4 million pounds and copper production for the year of 82.8 million pounds.
- Gold production costs for the quarter and year were $474 per ounce and $419 per ounce, respectively.
- Copper production costs for the quarter and year were $1.24 per pound and $1.18 per pound, respectively.
- All-in sustaining costs on a by-product basisNG for the quarter and year were $974 per ounce and $729 per ounce, respectively.
- All-in costs on a by-product basisNG for the quarter and year were $1,352 per ounce and $1,059 per ounce, respectively.
- Kumtor Mine mineral reserves increased by 107%(1) to 6.3 million contained ounces of gold(2) as at July 1, 2020. A new Kumtor technical report details a new 11-year mine life; consistent annual gold production averaging 590,000 ounces for five years commencing in 2022, and an average life of mine all-in sustaining costs on a by-product basisNG of $828 per ounce and all-in costs on a by-product basisNG of $1,044 per ounce.
- Mount Milligan achieved record throughput for the quarter and year, averaging 59,762 and 54,827 tonnes per calendar day, respectively.
- Greenstone property sale announced on December 15, 2020, subsequently closing on January 19, 2021 for final cash consideration received of $210 million and contingent consideration of approximately $75 million(3).
- Quarterly Dividend declared of CAD$0.05 per common share.
| (1) | Reserve increase calculated by comparing the new 2021 Kumtor Technical Report effective as at July 1, 2020 compared to the December 31, 2019 reserve statement (less mine depletion from January 1, 2020 to June 30, 2020). | |
| (2) | 73.3 million tonnes at an average gold grade of 2.66 grams per tonne gold (g/t Au) using gold price of $1,350 per ounce. | |
| (3) | Assuming a gold price of $1,500 per ounce. |
The Company also announced its full-year 2021 guidance and a three-year outlook. Highlights included:
| 2021 to 2023 Outlook Highlights | |||
| • | Strong organic gold growth production profile: | ||
| • | 2021: 740,000 to 820,000 ounces. | ||
| • | 2022: 920,000 to 1,020,000 ounces. | ||
| • | 2023: 930,000 to 1,030,000 ounces. | ||
| • | Maintain robust copper production profile: | ||
| • | 2021: 70 to 80 million pounds. | ||
| • | 2022: 90 to 100 million pounds. | ||
| • | 2023: 70 to 80 million pounds. | ||
2021 Guidance Highlights
- Gold production guidance of 740,000 to 820,000 ounces.
- Copper production guidance of 70 to 80 million pounds.
- Gold production costs guidance of $475 to $525 per ounce.
- All-in sustaining costs on a by-product basisNG guidance of $850 to $900 per ounce is higher than 2020 primarily due to Kumtor processing lower grade material from its stockpiles on surface.
- All-in costs on a by-product basisNG guidance of $1,175 to $1,230 per ounce.
- Total capital spending guidance of $430 to $480 million including capitalized stripping is higher than 2020 due to increased spending at Kumtor and Mount Milligan.
- Total capitalized stripping guidance of $230 to $245 million including $220 to $230 million at Kumtor primarily for mining cut-back 20 and $10 to $15 million at Öksüt.
- Cash provided by operations guidance of $750 to $800 million (assuming US$1,750 gold price).
- Free cash flowNG guidance of $350 to $400 million (assuming US$1,750 gold price).
- Exploration budget of $50 million with approximately 70% focused on brownfield exploration at our three existing operations.
Commentary
Scott Perry, President and Chief Executive Officer of Centerra stated, “During the fourth quarter, our Öksüt operation continued to demonstrate very high safety performance, achieving the safety milestone of four million consecutive hours without a lost time injury. Additionally, we continue to stay vigilant at all of our operations with rigorous safety protocols to help prevent an outbreak and avoid the spread of the COVID-19 virus.”
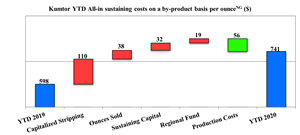
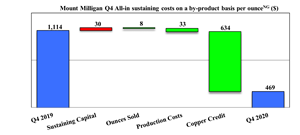
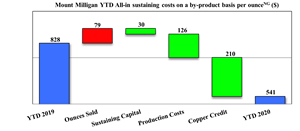
“In 2020, our three operating mines delivered solid performances, including Mount Milligan’s achievement of its highest level of mill throughput and its highest level of concentrate production since the start of the operations in 2014. The Company favourably exceeded its consolidated gold production and cost guidance, delivering more than 824,000 ounces of gold at an all-in sustaining cost on a by-product basisNG of $729 per ounce sold, which was lower than the low-end of our all-in sustaining cost guidance. Kumtor had another strong year where gold production was at the top end of guidance delivering 556,136 ounces of gold at an all-in-sustaining cost on a by-product basisNG of $741 per ounce sold, which was lower than the low-end of its all-in-sustaining cost guidance. In 2020, Mount Milligan exceeded the upper end of its gold production guidance and achieved its copper production guidance, producing 161,855 ounces of gold and 82.8 million pounds of copper at an all-in-sustaining cost on a by-product basisNG of $541 per ounce sold, which was lower than the low-end of its all-in-sustaining cost guidance. Our Öksüt mine, which only came into commercial production May 31, 2020, favourably exceeded both its gold production and cost guidance, achieving 106,068 ounces of gold production at an all-in-sustaining cost on a by-product basisNG of $494 per ounce, which was lower than the low-end of its all-in-sustaining cost guidance.”
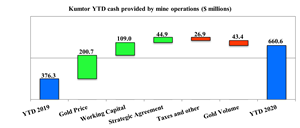
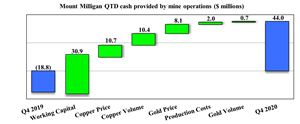
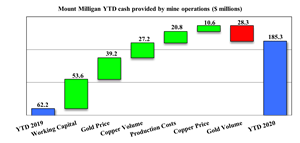
“Financially, the Company generated $930.0 million of cash from operations for the year, Öksüt generated $146.1 million, Mount Milligan generated $185.3 million and Kumtor generated $660.6 million. In 2020, $603.8 million of free cash flowNG was generated Company-wide, including $437.9 million of free cash flowNG from Kumtor, $150.2 million from Mount Milligan and $105.2 million from Öksüt. During the year, the Company repaid its debt and ended the year with no debt and cash of $545.2 million. In January 2021, we completed the sale of our 50% interest in the Greenstone Gold Mines Partnership and received a cash payment of approximately $210 million (including adjustments) adding to our strong balance sheet.”
“Based on the Company’s financial position, recent strong operating results and cash flows, the Board approved a quarterly dividend to CAD$0.05 per share on February 23, 2021.”
“Today, the updated Kumtor Mine Technical Report was filed showcasing an extended mine life for Kumtor. The new Kumtor life-of-mine adds significantly to the open pit reserves and has extended Kumtor’s mine life by 5 years. The new mine life is 11 years and milling operations are extended to 2031. The new life of mine plan has consistent annual gold production averaging 590,000 ounces for 5 years commencing in 2022 at an average life of mine all-in sustaining costs on a by-product basisNG of $828 per ounce sold.”
“For 2021, we are estimating consolidated gold production to be in the range of 740,000 to 820,000 ounces and 70 to 80 million pounds of copper production. Centerra’s consolidated all-in sustaining cost on a by-product basisNG for 2021 is expected to be in the range of $850 to $900 per ounce. We also announced our inaugural three-year outlook which reflects a growing gold production profile in 2022 and 2023. This brings Centerra close to expected annual gold production of approximately one million ounces with a declining cost profile which is expected to generate significant diversified free cash flowNG from our operations.”
COVID-19 Update
Centerra continues to prioritize the health, safety and well-being of its employees, contractors, communities, and other stakeholders during the current outbreak of COVID-19 and to take steps to minimize the effect of the pandemic on its business. The Company has established strict COVID-19 protocols at its mine sites to help prevent infection and reduce the potential transmission of COVID-19. The company has also implemented travel restrictions and has temporarily closed various administration offices including its head office in Toronto. In addition, operating mine sites continue to assess the resiliency of their supply chains, increase mine site inventories of key materials and develop and implement contingency plans to allow for continued operations.
COVID-19 has not materially affected Centerra’s operations as employee absences due to COVID-19 and other illnesses have so far been successfully managed. The Company notes that the effects of COVID-19 on its business continue to change rapidly. The measures enacted to date reflect the Company’s best assessment at this time but will remain flexible and be revised as necessary or advisable and/or as recommended by the public health and governmental authorities.
To date, the Company has incurred incremental COVID-19 related costs of $3.0 million.
About Centerra Centerra Gold Inc. is a Canadian-based gold mining company focused on operating, developing, exploring and acquiring gold properties in North America, Asia and other markets worldwide and is one of the largest Western-based gold producers in Central Asia. Centerra operates three mines, the Kumtor mine in the Kyrgyz Republic, the Mount Milligan mine in British Columbia, Canada and the Öksüt mine in Turkey. Centerra's shares trade on the Toronto Stock Exchange (TSX) under the symbol CG. The Company is based in Toronto, Ontario, Canada.
Conference Call Centerra invites you to join its 2020 fourth quarter conference call on Wednesday, February 24, 2021 at 9:00 AM Eastern Time. The call is open to all investors and the media. To join the call, please dial toll-free in North America 1 (888) 754-4430. International participants may access the call at +1 (416) 641-6701. Results summary slides are available on Centerra Gold’s website at www.centerragold.com. Alternatively, an audio feed webcast will be broadcast live by Intrado and can be accessed live at Centerra Gold’s website at www.centerragold.com. A recording of the call will be available on www.centerragold.com shortly after the call and via telephone until midnight Eastern Time on March 3, 2021 by calling +1 (416) 626-4100 or 1 (800) 558-5253 and using passcode 21989633.
For more information: John W. Pearson Vice President, Investor Relations Centerra Gold Inc. (416) 204-1953 [email protected]
Additional information on Centerra is available on the Company’s web site at www.centerragold.com and at SEDAR at www.sedar.com.
A PDF accompanying this announcement is available at: http://ml.globenewswire.com/Resource/Download/0a10f8e1-e3be-48df-8b4f-83e19487c1d7
Management’s Discussion and Analysis For the Period Ended December 31, 2020
This Management Discussion and Analysis (“MD&A”) has been prepared as of February 23, 2021 and is intended to provide a review of the financial position and results of operations of Centerra Gold Inc. (“Centerra” or the “Company”) for the three and twelve months ended December 31, 2020 in comparison with the corresponding periods ended December 31, 2019. This discussion should be read in conjunction with the Company’s audited financial statements and the notes thereto for the year ended December 31, 2020 prepared in accordance with International Financial Reporting Standards (“IFRS”). The Company’s audited financial statements and the notes thereto for the year ended December 31, 2020, are available at www.centerragold.com and on the System for Electronic Document Analysis and Retrieval (“SEDAR”) at www.sedar.com. In addition, this discussion contains forward looking information regarding Centerra’s business and operations. Such forward-looking statements involve risks, uncertainties and other factors that could cause actual results to differ materially from those expressed or implied by such forward looking statements. See “Caution Regarding Forward-Looking Information” in this discussion. All dollar amounts are expressed in United States dollars (“USD”), except as otherwise indicated. All references in this document denoted with NG indicate a non-GAAP term which is discussed under “Non-GAAP Measures” and reconciled to the most directly comparable GAAP measure.
Caution Regarding Forward-Looking Information Information contained in this document which are not statements of historical facts, and the documents incorporated by reference herein, may be “forward-looking information” for the purposes of Canadian securities laws. Such forward-looking information involves risks, uncertainties and other factors that could cause actual results, performance, prospects and opportunities to differ materially from those expressed or implied by such forward looking information. The words “believe”, “expect”, “anticipate”, “contemplate”, “plan”, “intends”, “continue”, “budget”, “estimate”, “may”, “will”, “schedule”, “understand” and similar expressions identify forward-looking information. These forward-looking statements relate to, among other things: statements regarding 2021-2023 Outlook and 2021 Guidance, including guidance on production, cost and capital spend in 2021, and the assumptions used in preparing; the impact, if any, of the Kyrgyz Parliamentary election and the aftermath on the Kumtor mine; planned exploration in 2021; possible impacts to its operations relating to COVID-19; the Company’s expectations regarding having sufficient liquidity for 2021; the Company’s expectation regarding having sufficient water at Mount Milligan in the medium term, and its plans for a long term solution; and expectations regarding litigation involving the Company including the HRS litigation impacting the Mount Milligan mine.
Forward-looking information is necessarily based upon a number of estimates and assumptions that, while considered reasonable by Centerra, are inherently subject to significant technical, political, business, economic and competitive uncertainties and contingencies. Known and unknown factors could cause actual results to differ materially from those projected in the forward-looking information. Factors and assumptions that could cause actual results or events to differ materially from current expectations include, among other things: (A) strategic, legal, planning and other risks, including: political risks associated with the Company’s operations in the Kyrgyz Republic, Turkey and Canada; the failure of the Kyrgyz Republic Government to comply with its continuing obligations under the Strategic Agreement, including the requirement that it comply at all times with its obligations under the Kumtor Project Agreements, allow for the continued operation of the Kumtor mine by KGC and KOC and not take any expropriation action against the Kumtor mine; actions by the Kyrgyz Republic Government or any state agency or the General Prosecutor's Office that serve to restrict or otherwise interfere with the payment of funds by KGC and KOC to Centerra; resource nationalism including the management of external stakeholder expectations; the impact of changes in, or to the more aggressive enforcement of, laws, regulations and government practices, including unjustified civil or criminal action against the Company, its affiliates or its current or former employees; risks that community activism may result in increased contributory demands or business interruptions; the risks related to outstanding litigation affecting the Company; the impact of the delay by relevant government agencies to provide required approvals, expertise and permits; potential impact on the Kumtor Project of investigations by Kyrgyz Republic instrumentalities; the impact of constitutional changes in Turkey; the impact of any sanctions imposed by Canada, the United States or other jurisdictions against various Russian and Turkish individuals and entities; potential defects of title in the Company’s properties that are not known as of the date hereof; the inability of the Company and its subsidiaries to enforce their legal rights in certain circumstances; the presence of a significant shareholder that is a state-owned company of the Kyrgyz Republic; risks related to anti-corruption legislation; risks related to the concentration of assets in Central Asia; Centerra not being able to replace mineral reserves; Indigenous claims and consultative issues relating to the Company’s properties which are in proximity to Indigenous communities; and potential risks related to kidnapping or acts of terrorism; (B) risks relating to financial matters, including: sensitivity of the Company’s business to the volatility of gold, copper and other mineral prices, the use of provisionally-priced sales contracts for production at Mount Milligan, reliance on a few key customers for the gold-copper concentrate at Mount Milligan and at Kumtor there is reliance on Kyrgyzaltyn, as Centerra sells all of its gold doré produced from the Kumtor Mine to Kyrgyzaltyn pursuant to the Restated Gold and Silver Sale Agreement; use of commodity derivatives, the imprecision of the Company’s mineral reserves and resources estimates and the assumptions they rely on, the accuracy of the Company’s production and cost estimates, the impact of restrictive covenants in the Company’s credit facilities which may, among other things, restrict the Company from pursuing certain business activities or making distributions from its subsidiaries, the Company’s ability to obtain future financing, the impact of global financial conditions, the impact of currency fluctuations, the effect of market conditions on the Company’s short-term investments, the Company’s ability to make payments including any payments of principal and interest on the Company’s debt facilities depends on the cash flow of its subsidiaries; and (C) risks related to operational matters and geotechnical issues and the Company’s continued ability to successfully manage such matters, including the stability of the pit walls at our operations, the movement of the Davidov Glacier, waste and ice movement and continued performance of the buttress at the Kumtor mine; the occurrence of further ground movements at the Kumtor mine and mechanical availability; the risk of having sufficient water to continue operations at the Mount Milligan mine and achieve expected mill throughput; changes to, or delays in, transportation routes, including cessation or disruption in rail and shipping networks whether caused by decisions of third party providers or force majeure events (including COVID-19); the success of the Company’s future exploration and development activities, including the financial and political risks inherent in carrying out exploration activities; inherent risks associated with the use of sodium cyanide in the mining operations; the adequacy of the Company’s insurance to mitigate operational risks; mechanical breakdowns; the Company’s ability to replace its mineral reserves; the occurrence of any labour unrest or disturbance and the ability of the Company to successfully re-negotiate collective agreements when required; the risk that Centerra’s workforce and operations may be exposed to widespread epidemic including, but not limited to, the COVID-19 pandemic; seismic activity in the vicinity of the Company’s properties; long lead times required for equipment and supplies given the remote location of some of the Company’s operating properties; reliance on a limited number of suppliers for certain consumables, equipment and components; the ability of the Company to address physical and transition risks from climate change and sufficiently manage stakeholder expectations on climate-related issues; the Company’s ability to accurately predict decommissioning and reclamation costs; the Company’s ability to attract and retain qualified personnel; competition for mineral acquisition opportunities; risks associated with the conduct of joint ventures/partnerships; and the Company’s ability to manage its projects effectively and to mitigate the potential lack of availability of contractors, budget and timing overruns and project resources. For additional risk factors, please see section titled “Risks Factors” in the Company’s most recently filed Annual Information Form available on SEDAR at www.sedar.com. There can be no assurances that forward-looking information and statements will prove to be accurate, as many factors and future events, both known and unknown could cause actual results, performance or achievements to vary or differ materially from the results, performance or achievements that are or may be expressed or implied by such forward-looking statements contained herein or incorporated by reference. Accordingly, all such factors should be considered carefully when making decisions with respect to Centerra, and prospective investors should not place undue reliance on forward looking information. Forward-looking information is as of February 23, 2021. Centerra assumes no obligation to update or revise forward-looking information to reflect changes in assumptions, changes in circumstances or any other events affecting such forward-looking information, except as required by applicable law.
TABLE OF CONTENTS
| Overview | 10 |
| Consolidated Financial and Operational Highlights | 11 |
| Overview of Consolidated Results | 12 |
| Outlook | 14 |
| Risks That Can Affect Our Business | 22 |
| Financial Performance | 24 |
| Balance Sheet Review | 26 |
| Market Conditions | 28 |
| Financial Instruments | 31 |
| Operating Mines and Facilities | 32 |
| Pre-Development Projects | 48 |
| Quarterly Results – Previous Eight Quarters | 49 |
| Related party transactions | 50 |
| Contingencies | 51 |
| Contractual Obligations | 53 |
| Accounting Estimates, Policies and Changes | 53 |
| Disclosure Controls and Procedures and Internal Control Over Financial Reporting | 54 |
| Non-GAAP Measures | 54 |
| Qualified Person & QA/QC – Production, Mineral Reserves and Mineral Resources | 59 |
| Mineral Reserves and Mineral Resources | 60 |
Overview
Centerra is a Canadian-based gold mining company focused on operating, developing, exploring and acquiring gold properties worldwide and is one of the largest Western-based gold producers in Central Asia. Centerra’s principal operations are the Kumtor Gold Mine located in the Kyrgyz Republic, the Mount Milligan Gold-Copper Mine located in British Columbia, Canada, and the Öksüt Gold Mine located in Turkey. The Company has one property in Canada in the pre-development stage, the Kemess Underground Gold Property. The Company sold its interest in the Greenstone Gold Mines Partnership, which included its interest in the Hardrock deposit, effective January 19, 2021, and as a result, treated it as available for sale as at December 31, 2020. The Company owns exploration properties in Canada, the United States of America and Turkey and has options to acquire exploration joint venture properties in Canada, Finland, Turkey, and the United States of America. The Company owns various assets within its Molybdenum Business Unit, particularly the Langeloth metallurgical processing facility in Pennsylvania, United States of America and two primary molybdenum mines currently on care and maintenance, Thompson Creek Mine in Idaho, United States of America, and the Endako Mine (75% ownership) in British Columbia, Canada.
As of December 31, 2020, Centerra’s significant subsidiaries are as follows:
| Current | Property | ||
| Entity | Property - Location | Status | Ownership |
| Kumtor Gold Company (“KGC”) | Kumtor Mine - Kyrgyz Republic | Operation | 100% |
| Thompson Creek Metals Company Inc. | Mount Milligan Mine - Canada | Operation | 100% |
| Öksüt Madencilik A.S. (“OMAS”) | Öksüt Mine - Turkey | Operation | 100% |
| Langeloth Metallurgical Company LLC | Langeloth - United States | Operation | 100% |
| AuRico Metals Inc. | Kemess Underground Project - Canada | Pre-development | 100% |
| Greenstone Gold Mines LP (“Greenstone”) | Greenstone Gold Property - Canada | Available for sale(1) | 50% |
| Thompson Creek Mining Co. | Thompson Creek Mine - United States | Care and Maintenance | 100% |
| Thompson Creek Metals Company Inc. | Endako Mine - Canada | Care and Maintenance | 75% |
| (1) Property divestment completed on January 19th, 2021. | |||
Centerra’s common shares are listed for trading on the Toronto Stock Exchange under the symbol CG. As of February 23, 2021, there are 295,856,546 common shares issued and outstanding, options to acquire 3,251,500 common shares outstanding under its stock option plan and 936,947 units outstanding under its restricted share unit plan (exercisable on a 1:1 basis for common shares).
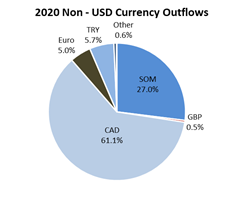
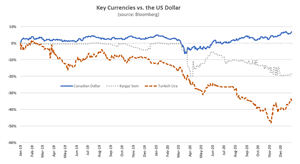
The Company reports the results of its operations in U.S. dollars, however not all of its costs are incurred in U.S. dollars. As such, the movement in exchange rates between currencies in which the Company incurs costs and the U.S. dollar also impacts reported costs of the Company.
Consolidated Financial and Operational Highlights
| Unaudited ($ millions, except as noted) | Three months ended December 31 | Twelve months ended December 31 | |||||||||
| Financial Highlights | 2020 | 2019 | % Change | 2020 | 2019 | 2018 | 2020 vs 2019 %Change | ||||
| Revenue | $ | 386.8 | $ | 312.5 | 24% | $ | 1,688.7 | $ | 1,375.3 | 1,129.3 | 23% |
| Production costs | 138.3 | 149.4 | (7%) | 590.6 | 676.6 | 578.4 | (13%) | ||||
| Standby costs | - | 9.1 | (100%) | 6.7 | 9.1 | 10.8 | (26%) | ||||
| Depreciation, depletion and amortization | 65.1 | 59.3 | 10% | 305.3 | 239.6 | 196.9 | 27% | ||||
| Earnings from mine operations | 183.4 | 94.7 | 94% | 786.1 | 450.1 | 343.3 | 75% | ||||
| Net earnings (loss) | $ | 95.2 | $ | (12.2) | 880% | $ | 408.5 | $ | (93.5) | 107.5 | 537% |
| Adjusted net earnings(1) | $ | 104.5 | $ | 22.3 | 369% | $ | 461.9 | $ | 181.5 | 118.1 | 154% |
| Cash provided by operations | 182.0 | 92.5 | 97% | 930.0 | 334.1 | 217.5 | 178% | ||||
| Adjusted cash provided by operations(1) | 182.0 | 92.5 | 97% | 935.0 | 396.7 | 221.9 | 136% | ||||
| Cash provided by operations before changes in working capital | 187.8 | 93.0 | 102% | 852.7 | 398.5 | 341.4 | 114% | ||||
| Free cash flow (deficit)(1) | 76.8 | (0.4) | 100% | 603.8 | 34.7 | (68.4) | 1640% | ||||
| Adjusted free cash flow(1) | 76.8 | (0.4) | 100% | 608.8 | 97.3 | (64.0) | 526% | ||||
| Sustaining capital expenditures(2) | 33.7 | 16.7 | 102% | 97.7 | 74.2 | 86.8 | 32% | ||||
| Non-sustaining capital expenditures(2)(3) | 20.2 | 42.3 | (52%) | 69.8 | 148.9 | 97.7 | (53%) | ||||
| Capitalized stripping(2) | 55.3 | 28.2 | 96% | 154.0 | 76.5 | 103.9 | 101% | ||||
| Total assets | $ | 3,136.0 | $ | 2,701.7 | 16% | $ | 3,136.0 | $ | 2,701.7 | 2,826.7 | 16% |
| Long-term debt and lease obligations | 14.3 | 88.3 | (84%) | 14.3 | 88.3 | 183.5 | (84%) | ||||
| Cash, cash equivalents and restricted cash(4) | 547.9 | 70.7 | 675% | 547.9 | 70.7 | 179.2 | 675% | ||||
| Per Share Data | |||||||||||
| Earnings per common share - $ basic (5) | $ | 0.32 | $ | (0.04) | 900% | $ | 1.39 | $ | (0.32) | 0.37 | 534% |
| Adjusted net earnings per common share - $ basic (1)(5) | $ | 0.35 | $ | 0.08 | 338% | $ | 1.57 | $ | 0.62 | 0.40 | 153% |
| Per Ounce Data (except as noted) | |||||||||||
| Average gold spot price ($/oz)(6) | 1,876 | 1,483 | 27% | 1,772 | 1,393 | 1,269 | 27% | ||||
| Average realized gold price ($/oz sold)(1)(6) | 1,760 | 1,403 | 25% | 1,670 | 1,309 | 1,175 | 28% | ||||
| Average copper spot price ($/lb)(6) | 3.27 | 2.68 | 22% | 2.80 | 2.73 | 2.96 | 3% | ||||
| Average realized copper price ($/lb sold)(1)(6) | 2.79 | 2.23 | 25% | 2.22 | 2.09 | 2.02 | 6% | ||||
| Operating Highlights | |||||||||||
| Gold produced (oz) | 172,446 | 194,507 | (11%) | 824,059 | 783,308 | 729,556 | 5% | ||||
| Gold sold (oz) | 169,950 | 169,892 | 0% | 828,816 | 780,654 | 709,330 | 6% | ||||
| Copper produced (000's lb) | 20,376 | 18,079 | 13% | 82,816 | 71,146 | 47,091 | 16% | ||||
| Copper sold (000's lb) | 18,975 | 14,301 | 33% | 80,477 | 67,430 | 44,370 | 19% | ||||
| Unit Costs | |||||||||||
| Gold production costs ($/oz sold)(7) | $ | 474 | $ | 455 | 4% | $ | 419 | $ | 465 | 464 | (10%) |
| Gold - All-in sustaining costs on a by-product basis ($/oz sold)(1)(7) | $ | 974 | $ | 799 | 22% | $ | 729 | $ | 708 | 754 | 3% |
| Gold - All-in costs on a by-product basis ($ /oz sold)(1)(7) | $ | 1,352 | $ | 1,331 | 2% | $ | 1,059 | $ | 1,126 | 1,100 | (6%) |
| Gold - All-in sustaining costs on a co-product basis($/oz sold)(1)(7) | $ | 1,073 | $ | 829 | 29% | $ | 799 | $ | 737 | 750 | 8% |
| Copper production costs ($/lb sold)(7) | $ | 1.24 | $ | 1.50 | (17%) | $ | 1.18 | $ | 1.46 | 1.26 | (19%) |
| Copper - All-in sustaining costs on a co-product basis – ($/lb)(1)(7) | $ | 1.79 | $ | 2.28 | (21%) | $ | 1.47 | $ | 1.85 | 1.77 | (21%) |
| (1) Non-GAAP measure. See discussion under “Non-GAAP Measures”. | |||||||||||
| (2) Capital expenditures are presented on a cash basis. | |||||||||||
| (3) Non-sustaining capital expenditures are distinct projects designed to have a significant increase in the net present value of the mine. In the current year, non-sustaining capital expenditures included construction costs related to the Öksüt mine and additional costs related to cut-back 20 at the Kumtor mine. | |||||||||||
| (4) Includes restricted cash of $2.7 million as at December 31, 2020 (December 31, 2019: $28.0 million and December 31, 2018: $27.5 million). | |||||||||||
| (5) As at December 31 2020, the Company had 295,827,906 common shares issued and outstanding. | |||||||||||
| (6) Average for the period as reported by the London Bullion Market Association (US dollar Gold P.M. Fix Rate) and London Metal Exchange (LME). | |||||||||||
| (7) Combines streamed and unstreamed amounts. | |||||||||||
Overview of Consolidated Results
Fourth Quarter 2020 compared to Fourth Quarter 2019 Net earnings of $95.2 million and adjusted net earningsNG of $104.5 million were recognized in the fourth quarter of 2020, compared to a net loss of $12.2 million and adjusted net earningsNG of $22.3 million in the fourth quarter of 2019. The increase in adjusted net earningsNG was due to contributions from the new Öksüt mine in 2020 with 39,380 gold ounces sold in the fourth quarter, 25% higher average realized prices for both gold and copper and lower production and depreciation costs at Kumtor, partially offset by decreased gold ounces sold at Kumtor and higher depreciation costs at the Mount Milligan mine.
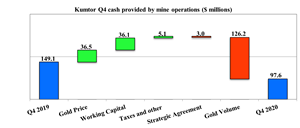
Cash provided by operations was $182.0 million in the fourth quarter of 2020, compared to cash provided by operations of $92.5 million in the fourth quarter of 2019. The increase in cash provided by operations was due to increased earnings from mine operations including earnings from the Öksüt mine which began production in 2020 and increased cash from working capital due to the processing of previously built-up stockpiles at the Kumtor mine.
Free cash flowNG of $76.8 million was recognized in the fourth quarter of 2020 compared to a free cash flow deficitNG of $0.4 million in the fourth quarter of 2019. The increase in free cash flowNG was due to higher cash provided by operations and lower non-sustaining capital expenditures as construction of the Öksüt mine was completed, partially offset by increased capitalized stripping at Kumtor and greater sustaining capital at the Mount Milligan and Kumtor mines.
Year ended December 31, 2020 compared to 2019 Net earnings were $408.5 million and adjusted net earningsNG were $461.9 million in 2020, compared to a net loss of $93.5 million and adjusted net earningsNG of $181.5 million in 2019.
The increase in adjusted net earningsNG was due to contributions from the new Öksüt mine, 28% higher realized gold prices, increased copper pounds sold at Mount Milligan and lower production costs at both Kumtor and Mount Milligan. This was partially offset by lower gold ounces sold and an increase in depreciation costs at the Kumtor and Mount Milligan mines.
Significant adjusting items to net earnings in 2020 include:
- $53.4 million asset retirement obligation (“ARO”) expense at the non-operating sites due to a significant decrease in the risk-free rate assumption, and
Significant adjusting items to the net loss in 2019 include:
- $230.5 million impairment charge on the assets at the Mount Milligan mine,
- $34.5 million ARO expense at the non-operating sites due to a significant change in the risk-free rate assumption, and
- $10.0 million charge relating to the completion of the Strategic Agreement with the Kyrgyz Government.
Cash provided by operations of $930.0 million and adjusted cash provided by operationsNG of $935.0 million were recognized in 2020, compared to cash provided by operations of $334.1 million and adjusted cash provided by operationsNG of $396.7 million in 2019. The increase in cash provided by operations was due to increased earnings from mine operations in 2020 including contributions from the Öksüt mine, increased cash from working capital from processing of stockpiles at Kumtor and a $22.8 million tax refund collected by the Molybdenum business unit, partially offset by a greater Kyrgyz Republic settlement payment.
Free cash flowNG of $603.8 million and adjusted free cash flowNG of $608.8 million was recognized in 2020 compared to free cash flowNG of $34.7 million and adjusted free cash flowNG of $97.3 million in 2019. The increase in adjusted free cash flowNG was due to higher cash provided by operations and lower non-sustaining capital expenditures as construction at the Öksüt mine was completed, partially offset by an increase in capitalized stripping at the Kumtor mine.
Safety and EnvironmentDuring the fourth quarter of 2020, the Öksüt mine achieved four million work hours without a lost time injury.
There were nine reportable injuries company-wide in the fourth quarter of 2020, including one lost time injury, six medical aid injuries and two restricted work injuries. During 2020, Centerra incurred thirty-seven reportable injuries, including one fatal injury, ten lost time injuries, eighteen medical aid injuries and eight restricted work injuries.
Centerra has implemented a number of proactive measures to prevent infection and reduce the spread of COVID-19 for the health and safety of its employees, contractors, communities and other stakeholders.
There were no reportable incidents to the environment in the fourth quarter of 2020. For the year-ended December 31, 2020, there was one reportable incident to the environment as reported in the third quarter of 2020.
Outlook
2021 - 2023 OutlookSee “Material Assumptions” for material assumptions or factors used to forecast production and costs.
The Company’s three-year outlook is set out in the following table:
| Units | 2020 | 2021 | 2022 | 2023 | |
| Actual | Guidance | Outlook | Outlook | ||
| Gold Production | (Koz) | ||||
| Kumtor | 556 | 470 - 510 | 540 - 590 | 550 - 600 | |
| Mount Milligan(1) | 162 | 180 - 200 | 170 - 190 | 180 - 210 | |
| Öksüt | 106 | 90 - 110 | 210 - 240 | 200 - 220 | |
| Consolidated Gold Production | (Koz) | 824 | 740 - 820 | 920 - 1,020 | 930 - 1,030 |
| Copper Production(1) | (Mlb) | 83 | 70 - 80 | 90 - 100 | 70 - 80 |
| Gold production costs(3) | ($/oz) | 419 | 475 - 525 | 390 - 440 | 385 - 435 |
| All-in sustaining costs on a by-product basis(2),(3) | 729 | 850 - 900 | 630 - 680 | 700 - 750 | |
| All-in sustaining costs on a by-product basis including revenue-based taxes(2),(3),(4) | 897 | 1,010 - 1,065 | 775 - 835 | 855 - 905 | |
| All-in costs on a by-product basis(2),(3) | 1,059 | 1,175 - 1,230 | 875 - 935 | 925 - 975 | |
| Capital Expenditures | ($M) | ||||
| Sustaining capital expenditures | 98 | 130 - 150 | 130 - 145 | 100 - 115 | |
| Non-sustaining capital expenditures(5) | 70 | 70 - 85 | 35 - 50 | 10 - 25 | |
| Capitalized stripping costs(6) | 194 | 230 - 245 | 155 - 175 | 270 - 290 | |
| Total Capital Expenditures | ($M) | 362 | 430 - 480 | 320 - 370 | 380 - 430 |
| Outlook Assumptions(7) | |||||
| Gold Price | ($/oz) | 1,750 | 1,750 | 1,750 | |
| Copper Price | ($/lb) | 3.36 | 3.40 | 3.40 | |
| Canadian Dollar | (CAD/USD) | 1.31 | 1.27 | 1.25 |
| (1) | Mount Milligan production and ounces sold are on a 100% basis. The Mount Milligan Streaming Arrangement entitles Royal Gold to 35% and 18.75% of gold and copper sales, respectively, from the Mount Milligan Mine. Under the Mount Milligan Streaming Arrangement, Royal Gold will pay $435 per ounce of gold delivered and 15% of the spot price per metric tonne of copper delivered. Assuming a market gold price of $1,750 per ounce and a market copper price of $3.36 per pound, Mount Milligan’s average realized gold and copper price would be $1,290 per ounce and $2.82 per pound, respectively. |
| (2) | Non-GAAP measure and is discussed under “Non-GAAP Measures”. |
| (3) | Figures are for consolidated Centerra Gold. |
| (4) | Includes only revenue-based taxes at Kumtor. |
| (5) | Non-sustaining capital expenditures are distinct projects designed to have a significant increase the net present value of the mine. |
| (6) | Presented capitalized stripping includes a cash and non-cash component. |
| (7) | Copper price for 2021 and CAD/USD exchange rates for 2021 and 2022, giving effect to hedges in place as at December 31, 2020. |
Kumtor
Centerra expects an increasing gold production profile at Kumtor over the 2021-2023 period. While the mid-point of gold production in 2021 is expected to be approximately 12% lower than 2020 gold production at the mine, Centerra expects 2022-2023 gold production levels to return to or exceed 2020 levels. Expansion of the mine fleet capacity is expected to allow Kumtor to exceed 2019 mining levels. 2021 capital expenditures are forecast to be less than what is reported in the 2021 Kumtor Technical Report due to eight haul truck purchases being deferred to 2022. Mill improvement projects, including a tower mill project for regrinding of flotation tails is expected to allow Kumtor to achieve higher targeted gold production levels. Gold production and all-in sustaining costs on a by-product basisNG over the three-year period are expected to reflect a growing gold production profile with unit costs per ounce fluctuating primarily due to changes in gold production.
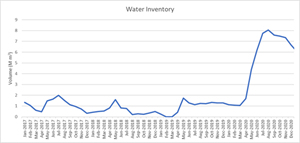
Mount MilliganCenterra expects strong gold and copper production at Mount Milligan over the 2021-2023 period. The Mount Milligan mill is expected to maintain a stable average daily throughput of approximately 60,000 tonnes per day, the maximum permitted rate. Installation of staged flotation reactors are expected to contribute to achieving targeted gold and copper production levels in 2022 and beyond. All-in sustaining costs on a by-product basisNG is expected to be at or below 2020 levels over the three-year period. Centerra expects to have adequate water inventory levels for targeted throughput and is working with government regulators, its First Nations partners, and other stakeholders to maintain access to its existing water resources and secure a stable long-term water solution. The long-term water solution is expected to require additional infrastructure, the capital for which is not included in the capital expenditure guidance. Mount Milligan’s current water level is in excess of 6 million cubic metres.
ÖksütGold production at Öksüt in 2021 is expected to be approximately the same as 2020 levels, whereas in 2022 and 2023 gold production is expected to benefit from mining and processing higher grade ore from the Güneytepe pit subject to receipt of all required permits. Construction of Phase 2 of the heap leach pad is expected to be completed by the end of 2021, and with the expanded heap leach capacity, it is expected to be sufficient to achieve targeted gold production in 2022 and 2023. As the Güneytepe pit ore becomes available, the average grade of ore stacked to the heap leach pad is estimated to increase to approximately 2.22 g/t gold (Au) during 2022 and 2023 compared to the estimated 1.27 g/t Au in 2021 and the actual stacked grade of 1.40 g/t Au in 2020. Gold production and all-in sustaining costsNG profiles over the three-year period are expected to reflect a growing gold production profile with unit costs per ounce reducing with the increases in gold production.
2021 Guidance
2021 Gold Production GuidanceCenterra’s 2021 gold production is expected to be between 740,000 to 820,000 ounces.
KumtorKumtor gold production in 2021 is expected to be in the range of 470,000 to 510,000 ounces and reflects lower average grades in the ore stockpiles available for processing compared to 2020. Gold production is expected to rise steadily throughout the year with the first quarter of 2021 contributing approximately 15% of annual gold production rising to approximately 35% in the fourth quarter of 2021. Total tonnes mined are expected to increase to a rate of approximately 550,000 tonnes per day from the average mining rate of 280,000 tonnes per day in 2020 due to the addition of new mining equipment, a resumption of waste rock dumping at the Lysii waste rock dump and fewer expected restrictions due to COVID-19. Mine operations are expected to be focused mainly on waste stripping from cut-back 20 during the first half of 2021, accessing greater amounts of ore in the second half of the year and accessing the high-grade ore in the fourth quarter. The Kumtor mill is scheduling a 6-day mill maintenance shutdown in the third quarter of the year to complete a replacement of the regrind mill motor and carry out SAG mill and regrind mill relines and other maintenance work.
Mount MilliganAt Mount Milligan, the Company expects to achieve an average daily throughput of approximately 60,000 tonnes per calendar day. Mill maintenance downtimes are scheduled for the first quarter (5 days) and third quarter (4 days) to complete SAG Mill reline replacements and other maintenance work. Mount Milligan’s total (streamed and unstreamed) gold production is forecast to be in the range of 180,000 to 200,000 ounces. Gold and copper production is expected to be slightly back-end weighted in 2021 with the first half of the year representing 45% or more of the 2021 annual metal production total while the second half of the year will represent up to 55% of the 2021 annual metal production total. The Company plans to continue to work on continuous improvement projects in 2021, including secondary crusher improvements and the installation of staged flotation reactors which is expected to improve metal recoveries in future years.
ÖksütAt Öksüt, 2021 will be the first full year of operations and gold production is expected to be in the range of 90,000 to 110,000 ounces. Gold production is expected to be back-end weighted in 2021 with the first half of the year representing 35% or more of the 2021 annual gold production total while the second half of the year will represent up to 65% of the 2021 annual gold production total. Mining will continue at the Keltepe pit in 2021 while the Güneytepe pit is expected to be developed from early 2022 assuming receipt of the forestry permit from the local authorities. The average grade of ore stacked to the heap leach pad in 2021 is expected to be approximately 1.27 g/t Au, which is lower than the average grade of ore stacked in 2020 of approximately 1.40 g/t Au. In 2021, Öksüt is expected to achieve a project-to-date accumulated heap leach recovery of 75%. The Company continues with construction of Phase 2 of the heap leach facility, where excavation has been completed and the Company is currently carrying out levelling activities with clay placement expected to start in May 2021.
2021 Copper Production GuidanceCenterra expects total (streamed and unstreamed) copper production from the Mount Milligan mine to be in the range of 70 to 80 million pounds.
Centerra’s 2021 production is currently forecast as follows:
| Units | Kumtor | Mount Milligan(1) | Öksüt | Centerra Consolidated | |
| Gold | |||||
| Unstreamed Gold Production | (Koz) | 470-510 | 117-130 | 90-110 | 677-750 |
| Streamed Gold Production(1) | (Koz) | - | 63-70 | - | 63-70 |
| Total Gold Production(2) | (Koz) | 470-510 | 180-200 | 90-110 | 740-820 |
| Copper | |||||
| Unstreamed Copper Production | (Mlb) | - | 57-65 | - | 57-65 |
| Streamed Copper Production(1) | (Mlb) | - | 13-15 | - | 13-15 |
| Total Copper Production(3) | (Mlb) | - | 70-80 | - | 70-80 |
| (1) | The Mount Milligan Streaming Arrangement entitles Royal Gold to 35% and 18.75% of gold and copper sales, respectively, from the Mount Milligan mine. Under the Mount Milligan Streaming Arrangement, Royal Gold will pay $435 per ounce of gold delivered and 15% of the spot price per metric tonne of copper delivered. |
| (2) | Gold production assumes recoveries of 81.9% at Kumtor, 63.9% at Mount Milligan and approximately 75% at Öksüt. |
| (3) | Copper production assumes 78.8% recovery for copper at Mount Milligan. |
2021 Sales, All-in Sustaining and All-in Unit Costs GuidanceNG
Centerra’s 2021 sales, all-in sustaining costs per ounceNG calculated on a by-product and co-product basis, and all-in costs per ounceNG calculated on a by-product basis are forecasted as follows:
| Units | Kumtor | Mount Milligan | Öksüt | Centerra Consolidated(2) | |
| Ounces of gold sold | (Koz) | 470 - 510 | 180 - 200 | 90 - 110 | 740 - 820 |
| Gold production costs | ($/oz) | 400 - 450 | 650 -700 | 500 - 550 | 475 - 525 |
| All-in sustaining costs on a by-product basis(1) | ($/oz) | 950 - 1,000 | 530 - 580 | 730 - 780 | 850 - 900 |
| Revenue-based taxes | ($/oz) | 250 - 255 | - | - | 160 - 165 |
| All-in sustaining costs on a by-product basis, including revenue-based taxes (1), (2), (3) | ($/oz) | 1,200 - 1,255 | 530 - 580 | 730 - 780 | 1,010 - 1,065 |
| All-in costs on a by-product basis(1),(2),(3) | ($/oz) | 1,365 - 1,420 | 590 - 640 | 790 - 840 | 1,175 - 1,230 |
| Gold - All-in sustaining costs on a co-product basis(1),(2) | ($/oz) | 950 - 1,000 | 910 - 1,025 | 730 - 780 | 950 - 1,055 |
| Copper production costs | ($/lb) | - | 1.30-1.45 | - | 1.30-1.45 |
| Copper - All-in sustaining costs on a co-product basis (1),(2) | ($/lb) | - | 1.75-1.95 | - | 1.75-1.95 |
| (1) | All-in sustaining costs and all-in costs on a by-product and co-product basis are non-GAAP measures and are discussed under “Non-GAAP Measures”. Gold production cost per ounce is different from the all-in sustaining costs on a by-product basis measure and is considered the nearest GAAP measure. |
| (2) | Mount Milligan production and ounces sold are on a 100% basis (the Mount Milligan Streaming Arrangement entitles Royal Gold to 35% and 18.75% of gold and copper sales, respectively). Unit costs and consolidated unit costs include a credit for forecasted copper sales treated as by-product for all-in sustaining costs and all-in sustaining costs including revenue-based taxes. Production for copper and gold reflects estimated metallurgical losses resulting from handling of the concentrate and metal deductions, subject to metal content, levied by smelters. |
| (3) | Includes revenue-based taxes at Kumtor. |
Gold production costs are expected to increase to $475 to $525 per ounce range up from 2020 consolidated gold production costs of $419 per ounce due to higher operating costs at Kumtor and Öksüt, lower gold production at Kumtor and lower copper production at Mount Milligan.
Consolidated all-in sustaining costs on a by-product basisNG are expected to be in the range of $850 to $900 per ounce. Kumtor’s all-in sustaining costs on a by-product basisNG are expected to increase to $950 to $1,000 per ounce range driven by lower gold production and higher capitalized stripping and mining costs reflecting the expansion of mining activities. Mount Milligan’s all-in sustaining costs on a by-product basisNG are expected to be in line with 2020 levels as higher production costs attributable to increased mill throughput are offset by higher gold production and a higher credit for copper sales. Öksüt’s all-in sustaining costs on a by-product basisNG are expected to increase to a range of $730 to $780 per ounce, reflecting lower ore grades, higher sustaining capital expenditures and capitalized stripping costs compared to 2020.
Consolidated all-in costs on a by-product basisNG are expected to be in the range of $1,175 to $1,230 per ounce. Kumtor’s all-in costs on a by-product basisNG are expected to be in the range of $1,365 to $1,420 per ounce due to lower gold production, higher all-in sustaining costs, increases in non-sustaining capital and site exploration expenditures planned for 2021. Mount Milligan’s all-in costs on a by-product basisNG of $590 to $640 per ounce are expected to be in line with 2020. Öksüt’s all-in costs on a by-product basisNG are expected to be between $790 to $840 per ounce reflecting the higher all-in sustaining costs offset by lower non-sustaining capital expenditures planned for 2021.
Consolidated cash flow provided by operations and consolidated free cash flow NG are expected to be in the range of $750 to $800 million and the range of $350 to $400 million (assuming US$1,750 gold price), respectively.
2021 Capital Expenditures Projected capital expenditures is currently forecast as follows:
| Capitalized | Sustaining | Non-sustaining | ||
| Projects ($ millions) | Stripping | Capital | Capital(1) | Total |
| Kumtor mine(2) | 220 - 230 | 55 - 65 | 60 - 70 | 335 - 365 |
| Mount Milligan mine | - | 65 - 70 | 5 - 10 | 70 - 80 |
| Öksüt mine(2) | 10 - 15 | 5 - 10 | 15 - 25 | |
| Other(3) | - | 5 | 5 | 10 |
| Consolidated Total | 230-245 | 130-150 | 70-85 | 430-480 |
| 1) | Non-sustaining capital expenditures are distinct projects designed to increase the net present value of the mine. |
| 2) | Capitalized stripping costs include cash components of $185 to $205 million at Kumtor mine, and $10 to $15 million at Öksüt mine. |
| 3) | Non-sustaining capital relates to the completion of construction at Öksüt and development activities at Kemess Underground Project. |
Kumtor
Sustaining capital expenditure is projected at $55 to $65 million in 2021 and relates primarily to major overhauls, purchase of mining equipment, replacement of regrind mill motor, and dewatering projects.
Non-sustaining capital investment at Kumtor for 2021 is forecast at $60 to $70 million which includes, expansion of the leach circuit, the tower mill project for regrinding of flotation tails to improve future recoveries, and additional capital expenditures for mine life extension related to development of the cut-back 21 and Hockey Stick zones, including mine fleet expansion and raising of the tailings dam.
The cash component of capitalized stripping costs related to the development of the open pit is expected to be $185 to $205 million of the $220 to $230 million range for total capitalized stripping costs.
Mount MilliganSustaining capital expenditure in 2021 is forecast to be $65 to $70 million and relate primarily to tailings storage facility costs, major overhauls and water management costs.
Non-sustaining capital investment at Mount Milligan for 2021 is forecast at $5 to $10 million for the installation of staged flotation reactors to improve future metal recoveries.
ÖksütIn 2021 sustaining capital spending is estimated to be $5 to $10 million and relates primarily to the costs for construction of the Phase 2 heap leach expansion, and electric equipment costs.
The cash component of capitalized stripping costs related to the development of the open pit is expected to be $10 to $15 million representing 100% of total capitalized stripping costs.
Kemess Underground Project In 2021, total spending at the Kemess Underground Project is estimated at approximately $13 to $15 million, including $11 million for care and maintenance activities.
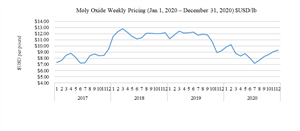
Molybdenum Business Unit In 2021, the Langeloth metallurgical roasting facility is expected to generate sufficient operating margins to cover the care and maintenance costs of the Endako mine and the Thompson Creek mine. Care and maintenance expenses related to the Molybdenum unit are currently estimated to be between $14 and $15 million for 2021 and the Company’s assumed molybdenum price is $9.00 per pound.
2021 Exploration Expenditures Planned exploration expenditures for 2021 are expected to be $50 million, including approximately $34 million for brownfields exploration (Kumtor - $21 million, Mount Milligan - $6 million, Öksüt - $3.5 million and Kemess - $3 million) and the balance for greenfields and generative exploration programs.
2021 Corporate Administration Corporate and administration expense for 2021 is forecast to be between $35 million and $40 million (including $8 million to $10 million of stock-based compensation expense).
2021 Depreciation, Depletion and AmortizationConsolidated depreciation, depletion, and amortization (DD&A) expense included in costs of sales expense for 2021 is forecasted to be in the range of $240 to $270 million, including Kumtor’s DD&A expense of $150 to $170 million, Mount Milligan’s DD&A expense of $55 million to $65 million, and Öksüt’s DD&A expense of $25 to $35 million.
2021 Taxes Pursuant to the Restated Investment Agreement, Kumtor’s operations are not subject to corporate income taxes. Instead, the Restated Investment Agreement imposes a tax of 13% on gross revenue plus 1% of gross revenue payable to the Issyk-Kul Development Fund. The Mount Milligan operations are subject to corporate income tax and British Columbia mineral tax. The British Columbia mineral tax is forecast to be between $7 and $9 million. At Öksüt, income tax is expected to be between $1 to $2 million. At the Canadian parent company level, corporate income tax for 2021 is forecast to be nil.
2021 SensitivitiesCenterra’s revenues, earnings, and cash flows for 2021 are sensitive to changes in certain key inputs or currencies. The Company has estimated the impact of any such changes on revenues, net earnings, and cash flows.
| Impact on($ millions) | Impact on ($ per ounce sold) | |||||||
| Production Costs & Taxes | Capital Costs | Revenues | Cash flows | Net Earnings (after tax) | AISC(2)(3) on by-product basis | |||
| Gold price | $50/oz | 5.5 - 6.0 | - | 34.0 - 37.5 | 28.5 - 31.5 | 28.5 - 31.5 | 2.5 - 3.0 | |
| Copper price(4) | 10 | % | 0.1 - 0.5 | - | 3.0 - 5.5 | 3.0 - 5.0 | 3.0 - 5.0 | 6.0 - 7.0 |
| Diesel fuel(3) | 10 | % | 5.5- 7.0 | 11.5 - 14.0 | - | 17.0 - 21.0 | 5.5 - 7.0 | 23.0 - 25.5 |
| Kyrgyz som(1) | 1 som | 1.0 - 2.0 | - | - | 1.0 - 2.0 | 1.0 - 2.0 | 2.0 - 2.5 | |
| Canadian dollar(1)(3) | 10 cents | 9.5 - 11.0 | 1.5 - 2.0 | - | 11.0 - 13.0 | 9.5 - 11.0 | 14.5 - 16.0 | |
| Turkish lira(1) | 1 lira | 3.0 - 4.0 | 0.5 - 1.0 | - | 3.5 - 5.0 | 3.0 - 4.0 | 5.5 - 6.0 | |
| (1) | Appreciation of currency against the U.S. dollar will result in higher costs and lower cash flow and earnings, depreciation of currency against the U.S. dollar results in decreased costs and increased cash flow and earnings. |
| (2) | Non-GAAP measure. See discussion under “Non-GAAP Measures”. |
| (3) | Includes the effect of hedging programs. |
| (4) | 2021 copper sales are hedged up to 85%. |
Production, cost and capital forecasts for 2021 are forward-looking information and are based on key assumptions and subject to material risk factors that could cause actual results to differ materially and which are discussed herein under the headings “2021 Material Assumptions” and “Caution Regarding Forward-Looking Information” in this document and under the heading “Risks That Can Affect Our Business” in this document and the Company’s most recently filed Annual Information Form.
2021 Material AssumptionsMaterial assumptions or factors used to forecast production and costs for 2021, after giving effect to the hedges in place as at December 31, 2020, include the following:
| • | a market gold price of $1,750 per ounce and an average realized gold price at Mount Milligan of $1,290 per ounce after reflecting the streaming arrangement with Royal Gold (35% of Mount Milligan’s gold at $435 per ounce). | ||
| • | a market copper price of $3.36 per pound and an average realized copper price at Mount Milligan of $2.82 per pound after reflecting the streaming arrangement with Royal Gold (18.75% of Mount Milligan’s copper at 15% of the spot price per metric tonne). | ||
| • | a molybdenum price of $9.00 per pound. | ||
| • | exchange rates: | ||
| º | $1USD:$1.31 Canadian dollar, | ||
| º | $1USD:80.00 Kyrgyz som, | ||
| º | $1USD:7.50 Turkish lira. | ||
| • | diesel fuel price assumption: | ||
| º | $0.44/litre at Kumtor, | ||
| º | $0.69/litre (CAD$0.90/litre) at Mount Milligan. | ||
Kumtor FuelThe assumed diesel price of $0.44/litre at Kumtor assumes that no Russian export duty will be paid on the fuel exports from Russia to the Kyrgyz Republic. Diesel fuel for Kumtor is sourced from separate Russian suppliers. The diesel fuel price assumes a price of oil of approximately $53 per barrel. Crude oil is a component of diesel fuel purchased by the Company, such that changes in the price of Brent crude oil generally impacts diesel fuel prices.
Mount Milligan Streaming ArrangementThe Mount Milligan Mine is an open pit mine located in north central British Columbia, Canada producing a gold and copper concentrate. Production at Mount Milligan is subject to an arrangement with RGLD Gold AG and Royal Gold, Inc. (together, “Royal Gold”) pursuant to which Royal Gold is entitled to purchase 35% of the gold produced and 18.75% of the copper production at the Mount Milligan Mine for $435 per ounce of gold delivered and 15% of the spot price per metric tonne of copper delivered (the “Mount Milligan Streaming Arrangement”). To satisfy its obligations under the Mount Milligan Streaming Arrangement the Company purchases refined gold and copper warrants and arranges for delivery to Royal Gold. The difference between the cost of the purchases of refined gold and copper warrants, and the corresponding amounts payable to the Company under the Mount Milligan Streaming Arrangement is recorded as a reduction of revenue and not a cost of operating the mine.
Other Material AssumptionsOther material assumptions used in forecasting production and costs for 2021 can be found under the heading “Caution Regarding Forward-Looking Information” in this document. Production, cost, and capital forecasts for 2021 are forward-looking information and are based on key assumptions and subject to material risk factors that could cause actual results to differ materially and which are discussed under the heading “Risks That Can Affect Our Business” in the Company’s most recent Annual Information Form.
Risks That Can Affect Our Business
Overview The Company is subject to risks that can have a material effect on the profitability, future cash flow, financial condition of the Company and its stated mineral reserves. Some of these risks relate to the mining industry in general, and others apply to specific properties, operations or planned operations. The Company has implemented an enterprise risk management (“ERM”) program which applies to all of its operations and corporate offices. The program is based on leading international risk management standards and industry best practice. It employs both a bottom-up and top-down approach to identify and address risks from all sources that threaten the achievement of the Company’s objectives.
Centerra’s Vice President, Risk & Insurance is responsible for providing the requisite tools, guidance, and leadership of the ERM program. Each operating site and project are responsible for identifying, assessing, mitigating, and monitoring risk. Efforts are coordinated by appointed “Risk Champions” who facilitate the process and provide regular reporting to Centerra’s Vice President, Risk & Insurance.
The risk management program at Centerra considers the full life of mine cycle from exploration through to closure. All aspects of the operation and the Company’s stakeholders are considered when identifying risks. As such, the Company’s risk program encompasses a broad range of risks including technical, financial, commercial, social, reputational, environmental, health and safety, political and human resources related risks.
Board and Committee OversightThe Risk Committee of the Board of Directors has oversight responsibilities for the policies, processes and systems for the identification, assessment, and management of the Company’s principal strategic, financial, and operational risks. To ensure consistent communication of risks amongst Board committees, the members of the Risk Committee are comprised of at least one member from each of the other standing committees of the Board. Each of the other Board committees is responsible for overseeing risks related to their area of responsibility and reviewing the policies, standards and actions undertaken to mitigate such risks.
Management OversightThe Company’s executive team meets regularly with its Vice President, Risk and Insurance to review the risks facing the organization and to discuss the implementation and effectiveness of mitigation actions.
Principal risks The following section describes the risks that are most material to the Company’s business. This is not a complete list of the potential risks the Company faces; there may be others the Company is not aware of, or risks that the Company feels are not material today that could become material in the future. For a more comprehensive discussion about the Company’s risks, see the most recently filed Annual Information Form.
Strategic, Legal and Planning Risks Strategic, legal and planning risks include political risks associated with the Company’s operations in the Kyrgyz Republic, Turkey, United States and Canada; resource nationalism; reliance on cash flow from its subsidiaries; the impact of changes in, or more aggressive enforcement of laws, regulations and government practices including with respect to the environment; impact of community activism on laws and regulations; increases in contributory demands or business interruption; delays or refusals to grant required permits and licenses; status of the Company’s relationships with local communities; Indigenous claims and consultation issues relating to the Company’s properties which are in proximity to Indigenous communities; the risks related to outstanding litigation affecting the Company; the impact of any sanctions imposed by Canada, the United States or other jurisdictions against various Russian and Turkish individuals and entities; potential defects of title in the Company’s properties that are not known as of the date hereof; the inability of the Company and its subsidiaries to enforce their legal rights in certain circumstances; the presence of a significant shareholder that is a state-owned company of the Kyrgyz Republic; conflicts of interest among its board members; risks related to anti-corruption legislation; Centerra’s future exploration and development activities not being successful; Centerra not being able to replace mineral reserves and resources; risks related to mineral reserves and resources being imprecise; production and cost estimates may be inaccurate; reputational risks, particularly in light of the increase in social media; inability to identify new opportunities and to grow the business; large fluctuations in the Company’s trading price that are beyond the Company’s control or ability to predict and mitigate; potential risks related to kidnapping or acts of terrorism.
Financial Risks The Company is subject to risks related to its financial position and liquidity, including sensitivity of the Company’s business to the volatility of gold, copper and other mineral prices; the use of provisionally-priced sales contracts for production at Mount Milligan; reliance on a few key customers for the gold-copper concentrate at Mount Milligan and at Kumtor there is reliance on Kyrgyzaltyn, as Centerra sells all of its gold doré produced from the Kumtor Mine to Kyrgyzaltyn pursuant to the Restated Gold and Silver Sale Agreement; use of commodity derivatives; sensitivity to fuel price volatility; the impact of currency fluctuations; global financial conditions; access to future financing including the impact of environmental, social and corporate governance (“ESG”) practices and reporting on the Company’s ability to obtain future financing or accessing capital; the impact of restrictive covenants in the Company’s credit facility which may, among other things, restrict the Company from pursuing certain business activities; the effect of market conditions on the Company’s short-term investments; the Company’s ability to make payments including any payments of principal and interest on the Company’s debt facilities, which depends on the cash flow of its subsidiaries; ability to obtain adequate insurance coverage; and changes to taxation laws in the jurisdictions where the Company operates.
Operational RisksMining and metals processing involve significant production and operational risks. Some of these risks are outside of the Company’s control or ability to predict and mitigate. Risks include but are not limited to the following: unanticipated ground and water conditions; shortages of water for processing activities; adjacent or adverse land or mineral ownership that results in constraints on current or future mine operations; geological risks, including earthquakes and other natural disasters; metallurgical and other processing risks; unusual or unexpected mineralogy or rock formations; ground or slope failures; pit flooding; tailings design or operational issues, including dam breaches or failures; structural cave-ins, wall failures or rock-slides; flooding or fires; equipment failures or performance problems; periodic interruptions due to inclement or hazardous weather conditions or operating conditions and other force majeure events; lower than expected ore grades or recovery rates; accidents; changes to, or delays in, transportation routes, including cessation or disruption in rail and shipping networks whether caused by decisions of third party providers or force majeure events (including COVID-19); interruption of energy supply; labour disturbances; the availability of drilling and related equipment in the area where mining operations will be conducted; the failure of equipment or processes to operate in accordance with specifications or expectations; tailings management facilities; exposure of workforce to widespread pandemic (including COVID-19); cyanide use; regulations regarding greenhouse gas emissions and climate change; development and construction costs being over budget; predicting decommissioning and reclamation costs; attracting and retaining qualified personnel; long lead times required for equipment and supplies given the remote location of some of the Company’s operating properties, and the potential that COVID-19 could disrupt such supply chains; reliance on a limited number of suppliers for certain consumables, equipment and components; and security of critical operating systems.
Financial Performance
Fourth Quarter 2020 compared to Fourth Quarter 2019
Revenue of $387 million was recognized in the fourth quarter of 2020 compared to $313 million in the fourth quarter of 2019. The increase in revenue was due to higher average realized gold and copper prices, increased copper pounds sold at the Mount Milligan mine and 39,380 gold ounces sold at Öksüt in 2020, partially offset by fewer gold ounces sold at the Kumtor mine.
Gold production was 172,446 ounces in the fourth quarter of 2020 compared to 194,507 ounces in the fourth quarter of 2019. Gold production in the fourth quarter of 2020 was 90,402 ounces at Kumtor, 42,664 ounces at Mount Milligan and 39,380 ounces at Öksüt, which commenced commercial production on May 31, 2020. At the Kumtor and Mount Milligan mines, the 39% and 7% decreases, respectively, were due to lower grades and recoveries at both sites due to mine plan sequencing.
Copper production at the Mount Milligan mine was 20.4 million pounds in the fourth quarter of 2020 compared to 18.1 million pounds in the fourth quarter of 2019. The increase in copper production was due to higher throughput as the process plant achieved an average throughput of 59,762 tonnes per calendar day in the quarter.
Gold production costs were $474 per ounce in the fourth quarter of 2020 compared to $455 per ounce in the fourth quarter of 2019. The increase was primarily due to higher gold production costs per ounce at the Kumtor mine, partially offset by the low gold production cost of $350 per ounce at Öksüt in the fourth quarter of 2020.
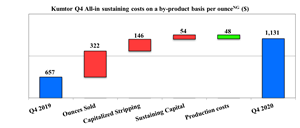
All-in sustaining costs on a by-product basisNG were $974 per ounce in the fourth quarter of 2020 compared to $799 per ounce in the fourth quarter of 2019. The increase was due to higher capitalized stripping costs at Kumtor, higher sustaining capital at both Kumtor and Mount Milligan and lower ounces sold at Kumtor, partially offset by higher copper credits. Consolidated gold ounces sold in the fourth quarter of 2020 was consistent with the fourth quarter of 2019 as the decrease in ounces sold at Kumtor was offset by the addition of the Öksüt mine which recorded all-in sustaining costs on a by-product basisNG of $586 per ounce.
All-in costs on a by-product basisNG were $1,352 per ounce in the fourth quarter of 2020 compared to $1,331 per ounce in the fourth quarter of 2019. The increase was due to higher all-in sustaining costs on a by-product basisNG, partially offset by lower non-sustaining expenditures as construction of the Öksüt mine was completed.
Exploration expenditures of $13 million were recognized in the fourth quarter of 2020 compared to $9.1 million in the fourth quarter of 2019. The increase was primarily due to additional brownfield exploration activity carried out at the Kumtor and Mount Milligan mines.
Financing costs of $5.5 million were recognized in the fourth quarter of 2020 compared to $5.3 million in the fourth quarter of 2019. The increase was primarily due to costs associated with the new corporate revolving credit facility.
Corporate administration costs of $17.4 million were recognized in the fourth quarter of 2020 compared to $9.2 million in the fourth quarter of 2019. The increase was primarily due to an increase in share-based compensation, positively impacted by the performance of the Company’s share price relative to the S&P/TSX Global Gold CAD$ Index and an increase in advisory fees associated with the disposal of the Company’s interest in the Greenstone Gold Mines Partnership.
Year ended December 31, 2020 compared to 2019
Revenue of $1,689 million was recognized in 2020 compared to $1,375 million in 2019. The increase was primarily due to a 28% higher average realized gold price and 19% more copper pounds sold.
Gold production was 824,059 ounces in 2020 compared to 783,308 ounces in 2019. Gold production in 2020 was 556,136 ounces at Kumtor, 161,855 ounces at Mount Milligan and 106,068 ounces at Öksüt. At Kumtor, the 7% decrease in gold production was due to processing stockpiled ore with lower grades and recoveries in the fourth quarter of 2020. At Mount Milligan, the 12% decrease in gold production was due to lower grades and lower recoveries, partially offset by higher throughput. Öksüt commenced production in 2020, achieving commercial production on May 31, 2020.
Copper production at Mount Milligan was 82.8 million pounds in 2020 compared to 71.1 million in 2019. The increase was due to higher throughput, partially offset by lower recoveries.
Gold production costs were $419 per ounce in 2020 compared to $465 per ounce in 2019. The decrease in 2020 was due to an increase in ounces sold. The increase in consolidated gold ounces sold was due to the ounces sold at Öksüt which recorded production costs of $356 per ounce sold.
All-in sustaining costs on a by-product basisNG were $729 per ounce in 2020 compared to $708 per ounce in 2019. The increase was due to higher capitalized stripping costs at the Kumtor mine and higher sustaining capital at both the Kumtor and Mount Milligan mines, partially offset by higher copper credits and greater gold ounces sold as a result of the addition of the Öksüt mine. All-in sustaining costs on a by-product basisNG at Öksüt were $494.
All-in costs on a by-product basisNG were $1,059 per ounce in 2020 compared to $1,126 per ounce in 2019. The decrease was due to lower non-sustaining capital expenditures as construction of the Öksüt mine was completed, partially offset by higher all-in sustaining costs on a by-product basisNG.
Exploration expenditures of $39.2 million were recognized in 2020 compared to $28 million in 2019. The increase was due to additional brownfield exploration activity at the Kumtor and Mount Milligan mines.
Financing costs of $14.9 million were recognized in 2020 compared to $16.3 million in 2019. The spending in 2020 included $2.4 million of costs associated with the new corporate revolving credit facility.
Corporate administration costs were $45.7 million in 2020, consistent with the prior year of $45.3 million.
Balance Sheet Review
| $ millions | As at | |||
| December 31, 2020 | December 31, 2019 | %Change | ||
| Consolidated: | ||||
| Cash | 545.2 | 42.7 | 1177% | |
| Inventories | 580.6 | 774.1 | (25%) | |
| Assets-held-for-sale | 140.0 | - | 100% | |
| Other current assets | 107.0 | 115.9 | (8%) | |
| Property, plant and equipment | 1,686.1 | 1,669.5 | 1% | |
| Other non-current assets | 77.1 | 99.5 | (23%) | |
| Total Assets | 3,136.0 | 2,701.7 | 16% | |
| Other current liabilities | 256.7 | 244.6 | 5% | |
| Non-current debt | - | 70.0 | (100%) | |
| Provision for reclamation | 352.2 | 265.2 | 33% | |
| Other non-current liabilities | 61.1 | 56.1 | 9% | |
| Total Liabilities | 670.0 | 635.9 | 5% | |
| Total Equity | 2,466.0 | 2,065.8 | 19% | |
| Total Liabilities and Equity | 3,136.0 | 2,701.7 | 16% | |
Cash as at December 31, 2020 was $545.2 million compared to $42.7 million as at December 31, 2019. The increase was due to free cash flowNG of $603.8 million in 2020 and the release of a $25 million cash deposit previously restricted by the Öksüt project financing facility. This was partially offset by the repayment in full of the Öksüt project financing facility of $77.4 million.
Total inventory as at December 31, 2020 was $580.6 million compared to $774.1 million as at December 31, 2019. Total inventory includes stockpiles of ore, gold in-circuit, gold doré, copper and gold concentrate and molybdenum inventory (collectively “Product Inventory”) of $373.1 million and supplies inventory of $207.5 million, compared to $564.7 million and $209.4 million, respectively, as at December 31, 2019. The decrease in Product Inventory was primarily attributable to Kumtor’s 2020 gold production coming from ore stockpiles.
As at December 31, 2020, the Product Inventory balance consisted of 487,268 contained gold ounces on surface at Kumtor, of which roughly 60% is expected to be processed in 2021, 80,552 contained gold ounces and 19.5 million contained pounds of copper in stockpiles at Mount Milligan, of which roughly 15% is expected to be processed in 2021 and 27,065 contained gold ounces on surface, stacked and in-circuit at the Öksüt mine, which is expected to be processed in 2021.
The book value of property, plant and equipment as at December 31, 2020 was $1.69 billion compared to $1.67 billion as at December 31, 2019. The increase in 2020 was related to increased capitalized stripping at Kumtor, partially offset by the reclassification of the Greenstone Gold Mines Partnership as assets held for sale.
Asset retirement obligations as at December 31, 2020 were $352.2 million compared to $265.2 million as at December 31, 2019. The increase was primarily due to a reduction in the risk-free interest rate used to calculate the present value of reclamation costs at the Company’s various sites and the disturbance to date at the new Öksüt mine for its reclamation obligation.
In 1998, a reclamation trust fund was established to cover the future costs of reclamation at the Kumtor mine. As at December 31, 2020, this fund had a balance of $47 million and is shown as long-term asset on the balance sheet.
On December 31, 2020, the Company entered into a new $400 million four-year revolving credit facility with a $200 million accordion feature (the “2020 Corporate Facility”). The interest rate payable on any outstanding borrowings under the 2020 Corporate Facility is LIBOR plus 2.25% to 3.25% and the maturity date of the facility is December 31, 2024. The 2020 Corporate Facility replaced the Company’s previous $500 million revolving credit facility.
Total bank debt as at December 31, 2020 was nil compared to $70.0 million as at December 31, 2019. The decrease was due to the repayment and subsequent cancellation of the Company’s Öksüt project financing facility during 2020, which resulted in the release of $25 million in restricted cash. The Company’s corporate revolving credit facilities were undrawn as at December 31, 2020 and December 31, 2019.
The Company’s total liquidity position is $945.2 million, representing a cash balance of $545.2 million and $400 million available as part of the 2020 Corporate Facility. The strong liquidity position and forecasted robust free cash flows from the Company’s Kumtor, Mount Milligan and Öksüt operations will be sufficient to satisfy working capital needs, fund its development and exploration activities and meet other liquidity requirements through to the end of 2021. See “Caution Regarding Forward-Looking Information”.
Market Conditions
Commodity pricesThe Company's profitability is materially affected by the market price of metals. Metal prices fluctuate widely and are affected by numerous factors beyond the Company's control.
| Metal | Average spot price | Period end spot price | ||||||||||||||
| Three months ended December 31 | Twelve months ended December 31 | December 31, | December 31, | % Change | ||||||||||||
| 2020 | 2019 | % Change | 2020 | 2019 | % Change | 2020 | 2019 | |||||||||
| Gold (per oz) | $ | 1,876 | $ | 1,483 | 27% | $ | 1,772 | $ | 1,393 | 27% | $ | 1,886 | $ | 1,517 | 24% | |
| Copper (per lb) | 3.27 | 2.68 | 22% | 2.80 | 2.73 | 3% | 3.03 | 2.80 | 8% | |||||||
| Molybdenum (per lb) | 9.01 | 9.65 | (7%) | 8.68 | 11.35 | (24%) | 10.02 | 9.20 | 9% | |||||||
Foreign ExchangeThe Company receives its revenue through the sale of gold, copper and molybdenum in U.S. dollars. The Company has operations in Canada, including its corporate head office, the Kyrgyz Republic, Turkey and the United States.
During 2020, approximately 40% of the Company’s combined expenditures (including capital costs and lease payments) was in currencies other than the U.S. dollar, including the Canadian dollar (“CAD”), Kyrgyz som (“SOM”) and the Turkish lira (“TRY”), consistent with 2019. The percentage of Centerra’s non-U.S. Dollar costs by currency in 2020, consistent with 2019, was as follows:
A chart accompanying this announcement is available at https://www.globenewswire.com/NewsRoom/AttachmentNg/55f24910-00bd-470b-b43b-1f749bedae39
A significant cost driver of Centerra is the performance of key currencies relative to the U.S. dollar. The performance of these currencies over a 24-month period and at key reporting dates was as follows:
A chart accompanying this announcement is available at https://www.globenewswire.com/NewsRoom/AttachmentNg/0d9a0927-5794-435f-9584-6296c8762bae
| Currency | Average exchange rate | Period end exchange rate | ||||||||||||||
| Three months ended December 31 | Twelve months ended December 31 | December 31, | December 31, | % Change | ||||||||||||
| 2020 | 2019 | % Change | 2020 | 2019 | % Change | 2020 | 2019 | |||||||||
| USD-CAD | $ | 1.30 | $ | 1.32 | (2%) | $ | 1.34 | $ | 1.33 | 1% | $ | 1.27 | $ | 1.30 | (2%) | |
| USD-Kyrgyz Som | 82.6 | 71.3 | 16% | 77.4 | 70.4 | 10% | 84.0 | 69.8 | 20% | |||||||
| USD-Turkish Lira | 7.9 | 5.8 | 36% | 7.0 | 5.7 | 23% | 7.4 | 6.0 | 23% | |||||||
The Company utilizes its foreign exchange hedging program in order to manage its exposure to adverse fluctuations in the Canadian dollar, relative to the U.S dollar, see “Financial Instruments”. The Company does not currently hedge the Kyrgyz som or Turkish lira.
Diesel Fuel Prices Fuel costs represent a significant cost component for Centerra’s mining operations, representing 11% of production costs. Prices for Kumtor’s diesel fuel generally reflect the price movements of Brent crude oil. Kumtor sources its fuel from Russia either directly or through Kyrgyz distributors and prices include additional costs such as seasonal premiums for winterizing fuel and transportation costs from the Russian refineries. The prices for Mount Milligan’s diesel fuel are based on a supply agreement for weekly deliveries and priced at the Prince George Rack rate. The Prince George Rack rate reflects general benchmark movements, plus additional costs such as seasonal premiums for winterizing, costs to meet regulatory requirements and transportation costs. Mining operations at Öksüt are outsourced, and the fuel operating cost is included in the outsourcing contract costs, based on the published local retail diesel market price.
| Commodity | Average spot price | Period end spot price | ||||||||||||||
| Three months ended December 31 | Twelve months ended December 31 | December 31, | December 31, | % Change | ||||||||||||
| 2020 | 2019 | % Change | 2020 | 2019 | % Change | 2020 | 2019 | |||||||||
| Kumtor Diesel (per ltr) | $ | 0.40 | $ | 0.50 | (20%) | $ | 0.40 | $ | 0.51 | (22%) | $ | 0.41 | $ | 0.49 | (16%) | |
| ULSD (per bbl) | 53.89 | 81.69 | (34%) | 52.49 | 81.47 | (36%) | 62.00 | 85.19 | (27%) | |||||||
| Brent (per bbl) | 45.26 | 62.42 | (27%) | 43.21 | 64.16 | (33%) | 51.80 | 66.00 | (22%) | |||||||
The Company utilizes its diesel hedging program in order to manage its exposure to adverse fluctuations in diesel fuel prices, see “Financial Instruments”.
Financial Instruments
The Company seeks to manage its exposure to fluctuations in diesel fuel prices, commodity prices and foreign exchange rates by entering into derivative financial instruments from time-to-time.
The hedge positions for each of these programs as at December 31, 2020 are summarized as follows:
| Average Strike Price | Settlements (% of exposure hedged) | As at December 31, 2020 | ||||||
| Instrument | Unit | Type | 2021 | 2022 | 2021 | 2022 | Total position (4) | Fair value($'000's) |
| FX Hedges | ||||||||
| USD/CAD zero-cost collars(3) | CAD | Fixed | $1.33/$1.40 | $1.32/$1.38 | $217.8 million (39%) | $149.0 million (28%) | $366.8 million | 13,458 |
| USD/CAD forward contracts(2) | CAD | Fixed | $1.38 | $1.32 | $102.0 million (19%) | $46.0 million (9%) | $148.0 million | 7,159 |
| Total | $1.35 | $1.32 | $319.8 million (58%) | $195 million (37%) | $514.8 million | 20,617 | ||
| Fuel Hedges | ||||||||
| Brent Crude Oil zero-cost collars(1) | Barrels | Fixed | $40/$46 | $44/$51 | 79,712 (10%) | 96,966 (10%) | 176,678 | 688 |
| Brent Crude Oil swap contracts(2) | Barrels | Fixed | $42 | $47 | 206,485 (25%) | 44,850 (5%) | 251,335 | 1,937 |
| ULSD zero-cost collars(1) | Barrels | Fixed | $53/$59 | $54/$64 | 59,404 (7%) | 125,066 (13%) | 184,470 | 748 |
| ULSD swap contracts(2) | Barrels | Fixed | $55 | $59 | 231,655 (28%) | 70,850 (7%) | 302,505 | 2,500 |
| Total | 577,256 (70%) | 337,732 (35%) | 914,988 | 5,873 | ||||
| Copper Hedges (Strategic hedges): | ||||||||
| Copper forward contracts(2) | Pounds | Fixed | $3.37 | N/A | 59.8 million (91%) | N/A | 59.8 million | (9,480) |
| Gold/Copper Hedges (Royal Gold deliverables): | ||||||||
| Gold forward contracts(2) | Ounces | Float | N/A | N/A | 17,570 | N/A | 17,570 | 219 |
| Copper forward contracts(2) | Pounds | Float | N/A | N/A | 4.2 million | N/A | 4.2 million | 1,192 |
| (1) | Under the fuel zero-cost collars, the Company retains the right to buy fuel barrels at the contract’s ‘ceiling’ price if the market price was to exceed this price upon contract expiration, while requiring the Company to buy fuel barrels at the ‘floor’ price if the market price fell below this price upon expiration. At the end of each contract there is no exchange of the underlying item and the contract is financially settled. |
| (2) | Under the swap and forward contracts, the Company ‘buys’ or ‘sells’ metals, currencies and commodities, at a specified price at a certain future date. |
| (3) | Under the currency zero-cost collars, the Company retains the right to buy foreign currency at the contract’s ‘floor’ price if the market price was to fall below this price upon contract expiration, while requiring it to sell foreign currency at the ‘ceiling’ price if the market price was to exceed this price upon expiration. |
| (4) | Royal Gold hedging program with a market price determined on closing of the contract. |
In the fourth quarter and year-ended December 31, 2020, Centerra’s Canadian dollar hedging program resulted in a $2.7 million realized gain and $1.1 million realized gain, respectively, compared to no loss or gain in either the fourth quarter or year-ended December 31, 2019.
In the fourth quarter of 2020, Centerra’s diesel hedging program resulted in a $3.0 million realized loss compared to nil in the fourth quarter of 2019. For the year-ended December 31, 2020, Centerra’s diesel hedging program resulted in a $6.5 million realized loss compared to a $0.7 million realized gain in 2019.
In the fourth quarter of 2020, the Company commenced a copper hedging program, entering into forward contracts to lock in the copper price for the majority of Mount Milligan’s copper sales from December 2020 to the end of 2021. In the fourth quarter and year-end of December 31, 2020, Centerra’s copper hedging program resulted in a $1.4 million realized loss.As at December 31, 2020, Centerra has not entered into any off-balance sheet arrangements with special purpose entities, nor does it have any unconsolidated affiliates.
Operating Mines and Facilities
Kumtor MineThe Kumtor open pit mine, located in the Kyrgyz Republic, is one of the largest gold mines in Central Asia. It has been in production since 1997 and has produced over 13.2 million ounces of gold to December 31, 2020.
2021 Kumtor Technical Report Update In February 2021, the Company issued a new technical report for the Kumtor mine, as at July 1, 2020 (the “2021 Kumtor Technical Report”), extending its mine life by 5 years to 2031 and increasing its reserves 107%(1) to 6.3 million contained ounces of gold (73.3 million tonnes at an average gold grade of 2.66 grams per tonne gold (g/t Au) using a gold price of $1,350 per ounce). All-in sustaining costs on a by-product basisNG is estimated to be $828 per ounce and all-in costs on a by-product basisNG is estimated to be $1,044 per ounce for the life of mine. Gold production is expected to average 590,000 ounces at an average all-in sustaining cost on a by-product basisNG of $782 per ounce, for five years commencing in 2022.
The 2021 Kumtor Technical Report provides an update of the 2015 technical report, including a mineral resource model update based on extensive in-fill and expansion drilling in recent years. The 2021 Kumtor Technical Report also revised the gold price assumptions, pit slope angles, capital and operating cost estimates and metallurgical recovery estimates based on process plant improvements, all of which has resulted in updated mineral resource and mineral reserve estimates, a revised ultimate pit design and an updated mining plan. The technical report was prepared in accordance with National Instrument 43-101 Standards of Disclosure for Mineral Projects (“NI 43-101”) and filed on SEDAR on February 24, 2021 with an effective date of July 1, 2020.
| (1) | Reserve increase calculated by comparing the new 2021 Kumtor Technical Report effective as at July 1, 2020 compared to the December 31, 2019 reserve statement (less mine depletion from January 1, 2020 to June 30, 2020). |
Kyrgyz RepublicPolitical and social disruptions followed the Parliamentary election held during the first week of October 2020 and resulted in an interim government led by Prime Minister Sadyr Japarov following the resignation of former President Sooronbai Jeenbekov. An early presidential election was held on January 10, 2021 and Mr. Japarov was elected President.
Centerra and Kumtor will continue to cooperate and work with the Kyrgyz Government and state agencies to ensure uninterrupted operation of the mine.
COVID-19 updateKumtor continues to implement mitigation controls and health & safety precautions at the mine site to contain the spread of COVID-19. As previously disclosed, open pit mining was operating at below capacity in July, returned to full capacity in September and continued at full capacity through the fourth quarter. Mill processing operated at full capacity throughout the year.
Lysii waste dump updateIn July 2020, Kumtor received a permit to utilize the Lysii Valley for dumping waste rock going forward. Lysii Valley is expected to be the main mine waste rock dump for the next two years as it is closest to cut-back 20. According to the new waste dumping plan in the Lysii Valley, waste rock will be placed at the base of the valley initially and the waste rock dump will be developed up the valley creating slightly longer haulage distances in the near-term.
Kumtor Operating Results
| Unaudited ($ millions, except as noted) | Three months ended December 31, | Twelve months ended December 31, | ||||||||
| Financial Highlights: | 2020 | 2019 | % Change | 2020 | 2019 | % Change | ||||
| Revenue | $ | 178.1 | $ | 200.5 | (11%) | $ | 981.6 | $ | 827.5 | 19% |
| Production costs | 42.4 | 49.6 | (15%) | 194.8 | 228.6 | (15%) | ||||
| Depreciation, depletion and amortization | 38.5 | 46.6 | (17%) | 209.5 | 181.3 | 16% | ||||
| Standby costs | - | 9.1 | 100% | 6.7 | 9.1 | 100% | ||||
| Earnings from mine operations | $ | 97.2 | $ | 95.2 | 2% | $ | 570.6 | $ | 408.5 | 40% |
| Revenue-based taxes | 25.2 | 28.3 | (11%) | 138.5 | 116.4 | 19% | ||||
| Exploration and development costs | 5.5 | 4.3 | 28% | 15.9 | 11.3 | 41% | ||||
| Other operating expenses | 2.8 | 7.6 | (63%) | 21.8 | 23.9 | (9%) | ||||
| Earnings from operations | $ | 63.7 | $ | 55.0 | 16% | $ | 394.4 | $ | 256.9 | 54% |
| Cash provided by mine operations | 97.6 | 149.1 | (35%) | 660.6 | 376.3 | 76% | ||||
| Cash provided by mine operations before changes in working capital | 102.6 | 107.1 | (4%) | 609.3 | 385.1 | 58% | ||||
| Free cash flow from mine operations (1) | 28.1 | 104.3 | (73%) | 437.9 | 240.1 | 82% | ||||
| Operating Highlights: | ||||||||||
| Tonnes mined (000's) | 42,733 | 28,565 | 50% | 103,735 | 156,439 | (34%) | ||||
| Tonnes ore mined (000's) | 115 | 1,716 | (93%) | 705 | 10,970 | (94%) | ||||
| Average mining grade (g/t) | 1.43 | 5.50 | (74%) | 6.64 | 2.91 | 128% | ||||
| Tonnes processed (000's) | 1,563 | 1,322 | 18% | 6,323 | 5,968 | 6% | ||||
| Process plant head grade (g/t) | 2.11 | 3.79 | (44%) | 3.27 | 3.69 | (11%) | ||||
| Recovery (%)(2) | 74.2% | 85.3% | (13%) | 81.4% | 83.5% | (3%) | ||||
| Mining costs ($/t mined material) | 1.23 | 1.50 | (18%) | 1.52 | 1.26 | 20% | ||||
| Processing costs ($/t processed material) | 10.87 | 13.48 | (19%) | 10.97 | 12.00 | (9%) | ||||
| Gold produced (oz) | 90,402 | 148,523 | (39%) | 556,136 | 600,201 | (7%) | ||||
| Gold sold (oz) | 96,641 | 136,568 | (29%) | 569,213 | 600,231 | (5%) | ||||
| Average realized gold price ($/oz sold)(1) | 1,843 | 1,468 | 26% | 1,725 | 1,379 | 25% | ||||
| Sustaining capital expenditures(3) | 15.2 | 7.8 | 94% | 58.0 | 38.6 | 50% | ||||
| Non-sustaining capital expenditures(3)(4) | 9.4 | 2.9 | 224% | 16.8 | 16.0 | 5% | ||||
| Capitalized stripping - cash | 48.1 | 28.2 | 71% | 142.5 | 76.5 | 86% | ||||
| Capitalized stripping - non-cash | 10.3 | 6.9 | 49% | 40.0 | 20.7 | 94% | ||||
| Capital expenditures - total | 83.0 | 45.8 | 81% | 257.3 | 151.8 | 70% | ||||
| Unit Costs: | ||||||||||
| Gold production costs ($/oz sold) | $ | 439 | $ | 363 | 21% | $ | 342 | $ | 381 | (10%) |
| Gold - All-in sustaining costs on a by-product basis ($/oz sold)(1) | $ | 1,131 | $ | 657 | 72% | $ | 741 | $ | 598 | 24% |
| Gold - All-in costs on a by-product basis ($ /oz sold)(1) | $ | 1,545 | $ | 916 | 69% | $ | 1,042 | $ | 838 | 24% |
| (1) | Non-GAAP measure. See discussion under “Non-GAAP Measures”. |
| (2) | Metallurgical recoveries are based on recovered gold, not produced gold. |
| (3) | Capital expenditures are presented on a cash basis. |
| (4) | Non-sustaining capital expenditures are distinct projects designed to have a significant increase in the net present value of the mine. In the current year, non-sustaining capital expenditures included additional costs related to cut-back 20. |
Fourth Quarter 2020 compared to Fourth Quarter 2019
Earnings from mine operations of $97.2 million were recognized in the fourth quarter of 2020 compared to earnings from mine operations of $95.2 million in the fourth quarter of 2019. The increase was primarily due to a 26% higher average realized gold price and lower production and depreciation costs, offset by 29% fewer gold ounces sold.
A chart accompanying this announcement is available at https://www.globenewswire.com/NewsRoom/AttachmentNg/1acd005a-32ee-4150-9b34-b1115ef2a557
Cash provided by mine operations of $97.6 million was recognized in the fourth quarter of 2020 compared to $149.1 million in the fourth quarter of 2019. The decrease was primarily due to the lower gold sales, partially offset by higher gold prices and increased cash from working capital due to production being exclusively from stockpiles. Free cash flow from mine operationsNG of $28.1 million was recognized in the fourth quarter of 2020 compared to $104.3 million in the fourth quarter of 2019. The decrease was due to lower cash provided by mine operations, a 71% increase in capitalized stripping costs as Kumtor mined cut-back 20 during the fourth quarter of 2020 and an increase in capital expenditure related to the timing of equipment overhauls and the delivery of additional haul trucks to increase mining capacity.
During the fourth quarter of 2020, Kumtor continued mining cut-back 20. Tonnes mined were 42.7 million in the fourth quarter of 2020 compared to 28.6 million tonnes in the fourth quarter of 2019. The increase was due to the suspension of mining operations in December 2019 due to the Lysii waste rock dump incident. The 42.7 million tonnes mined in the fourth quarter of 2020 were capitalized as waste stripping for the benefit of future production from cut-back 20.
Mining costs were $1.23 per tonne in the fourth quarter of 2020 compared to $1.50 per tonne in the fourth quarter of 2019. The decrease was primarily due to greater tonnes mined and lower diesel fuel prices. Total mining costs were $52.4 million of which $48.1 million was capitalized in the fourth quarter of 2020, compared to $42.8 million in mining costs of which $28.2 million was capitalized in the fourth quarter of 2019.
Gold production was 90,402 ounces from on-surface stockpiled ore in the fourth quarter of 2020 compared to 148,523 ounces of gold produced in the fourth quarter of 2019. The decrease was primarily due to lower average process plant head grades and lower gold recovery. During the fourth quarter of 2020, Kumtor’s average process plant head grade was 2.11 g/t with a recovery of 74.2% compared to 3.79 g/t and a recovery of 85.3% in the fourth quarter of 2019.
Processing costs were $10.87 per tonne in the fourth quarter of 2020 compared to $13.48 per tonne in the fourth quarter of 2019. The decrease was primarily due to 18% greater tonnes processed and lower maintenance costs.
Gold production costs were $439 per ounce in the fourth quarter of 2020, compared to $363 per ounce in the fourth quarter of 2019. The increase was primarily due to lower ounces sold.
A chart accompanying this announcement is available at https://www.globenewswire.com/NewsRoom/AttachmentNg/d9587c12-e9ed-4317-9e71-5d2020aa2736
All-in sustaining costs on a by-product basisNG, which excludes revenue-based tax, were $1,131 per ounce in the fourth quarter of 2020 compared to $657 per ounce in the fourth quarter of 2019. The increase was primarily due to fewer ounces sold, an elevated level of capitalized stripping costs as mining activities were concentrated on stripping cut-back 20 and greater sustaining capital costs relating to rebuilds and haul truck fleet expansion, partially offset by lower production costs.
All-in costs on a by-product basisNG were $1,545 per ounce in the fourth quarter of 2020 compared to $916 per ounce in the fourth quarter of 2019. The increase was due to an increase in all-in sustaining costs on a by-product basisNG and the purchase of haul trucks to support the mine expansion.
Year-ended December 31, 2020 compared to 2019 Earnings from mine operations of $570.6 million were recognized in 2020 compared to $408.5 million in 2019. The increase was primarily due to 25% higher average realized gold prices and lower production costs, partially offset by fewer ounces sold and higher depreciation charges which largely represents capitalized stripping costs being amortized into earnings as stockpiled inventories were processed through the mill during the year.
A chart accompanying this announcement is available at https://www.globenewswire.com/NewsRoom/AttachmentNg/f2e7336b-b11b-4b95-9b66-cfde18cf5760
Cash provided by mine operations of $660.6 million was recognized in 2020 compared to $376.3 million in 2019. The increase was due to higher earnings from mine operations, an increase in cash generated from working capital as the plant processed ore from on surface stockpiles and lower Strategic Agreement payments. Free cash flow from mine operationsNG of $437.9 million was recognized in 2020 compared to $240.1 million in 2019. The increase was due to an increase in cash provided by mine operations, partially offset by higher capitalized expenditures as the mining fleet was expanded, and higher capitalized stripping costs as Kumtor mined waste material from cut-back 20 throughout the year.
In 2020, Kumtor finished mining cut-back 19 and continued stripping and managing the ice from cut-back 20. Tonnes mined were 103.7 million tonnes in 2020 compared to 156.4 million tonnes in 2019. The decrease was primarily due to the suspension of mining operations from December 2019 to mid-January 2020, longer haulage distances as a result of the change in the waste dump location from the Lysii Valley to the Central Valley for the first half of the year and lower equipment utilization due to workforce availability (primarily COVID-19 related). Of the 103.7 million tonnes mined in 2020, 101.6 million tonnes were capitalized as waste stripping for benefit of future production from cut-back 20.
Mining costs were $1.52 per tonne in 2020 compared to $1.26 per tonne in 2019. The increase was primarily due to lower tonnes mined, and longer haulage distances, partially offset by lower diesel fuel prices, lower maintenance costs and a favourable foreign currency exchange rate movement.
Gold production was 556,136 ounces of gold in 2020 from previously mined on-surface stockpiled ore, compared to 600,201 ounces of gold produced in 2019. The decrease in 2020 was primarily due to lower process plant head grade and lower gold recovery coming from the stockpiled ore. During 2020, Kumtor’s average process plant head grade was 3.27 g/t with a recovery of 81.4% compared to 3.69 g/t and a recovery of 83.5% in 2019.
Processing costs were $10.97 per tonne in 2020 compared to $12.00 per tonne in 2019. The decrease was primarily due to increased tonnes processed and lower maintenance costs as a result of less maintenance activities performed due to COVID-19.
Gold production costs were $342 per ounce in 2020 compared to $381 per ounce in 2019. The decrease was primarily due to increased tonnes processed, partially offset by lower grades and recovery.
A chart accompanying this announcement is available at https://www.globenewswire.com/NewsRoom/AttachmentNg/fe61ba10-97b1-4d50-b03f-b84cef98e863
All-in sustaining costs on a by-product basisNG, which excludes revenue-based tax were, $741 per ounce in 2020 compared to $598 per ounce in 2019. The increase was mainly due to higher capitalized stripping costs, fewer ounces sold, higher sustaining capital representing the purchase of eleven haulage trucks to increase mining capacity and higher Strategic Agreement contributions to the various regional funds in the Kyrgyz Republic. This was partially offset by lower production costs.
All-in costs on a by-product basisNG were $1,042 per ounce in 2020 compared to $838 per ounce in 2019. The increase was due to an increase in all-in sustaining costs on a by-product basisNG and greater revenue-based taxes paid as a result of higher gold prices.
Mount Milligan MineThe Mount Milligan Mine is an open pit mine located in north central British Columbia, Canada producing a gold and copper concentrate. Production at Mount Milligan is subject to an arrangement with RGLD Gold AG and Royal Gold, Inc. (together, “Royal Gold”) pursuant to which Royal Gold is entitled to purchase 35% of the gold produced and 18.75% of the copper production at the Mount Milligan Mine for $435 per ounce of gold delivered and 15% of the spot price per metric tonne of copper delivered. To satisfy its obligations under the Mount Milligan Streaming Arrangement the Company purchases refined gold and copper warrants and arranges for delivery to Royal Gold. The difference between the cost of the purchases of refined gold and copper warrants, and the corresponding amounts payable to the Company under the Mount Milligan Streaming Arrangement is recorded as a reduction of revenue and not a cost of operating the mine.
Water Update Stored water inventory at Mount Milligan is critical to the ability to process ore through the mill on a sustainable basis. Stored water was in excess of 6 million cubic metres as at December 31, 2020. In addition to accessing water from surface water sources throughout 2020, Mount Milligan continued to access ground water from the Lower Rainbow Valley wellfield as well as other groundwater wells near the tailings storage facility during the year.
Exploration activities continue to focus on extending the groundwater capacity in the vicinity of the existing infrastructure. The Company continues to pursue a longer-term solution to its water requirements at Mount Milligan and is in discussions with regulators, its First Nations partners and other stakeholders. The Company does not expect any interruptions to Mount Milligan operations in the medium term when considering currently available water sources and inventory. See “Caution Regarding Forward-Looking Information”.
A chart accompanying this announcement is available at https://www.globenewswire.com/NewsRoom/AttachmentNg/9ae73cdc-a736-4ff7-96ba-4c6541ffba17
COVID-19Mount Milligan continues to monitor controls that have been put in place to manage the exposure of its workforce to COVID-19 and has added to these controls as required. Mining and processing activities are currently operating without any material disruption.
Mount Milligan Operating Results
| Unaudited ($ millions, except as noted) | Three months ended December 31, | Twelve months ended December 31, | ||||||||
| Financial Highlights: | 2020 | 2019 | % Change | 2020 | 2019 | % Change | ||||
| Gold revenue | 46.7 | 37.9 | 23% | 205.0 | 194.2 | 6% | ||||
| Copper revenue | 53.0 | 31.9 | 66% | 178.6 | 140.8 | 27% | ||||
| Total Revenues | $ | 99.7 | $ | 69.8 | 43% | $ | 383.6 | $ | 335.0 | 15% |
| Production costs | 47.8 | 49.1 | (3%) | 209.4 | 232.7 | (10%) | ||||
| Depreciation, depletion and amortization | 17.7 | 11.0 | 60% | 73.1 | 53.3 | 37% | ||||
| Earnings from mine operations | $ | 34.2 | $ | 9.7 | 253% | $ | 101.1 | $ | 49.0 | 106% |
| Exploration and development costs | 3.0 | 1.3 | 126% | 7.5 | 4.0 | 88% | ||||
| Impairment | - | - | 0% | - | 214.4 | |||||
| Other operating expenses | 2.7 | 2.4 | 14% | 9.7 | 8.0 | 21% | ||||
| Earnings (loss) from operations | $ | 28.4 | $ | 6.0 | 377% | $ | 83.9 | $ | (177.4) | (147%) |
| Cash provided by (used in) mine operations | 44.0 | (18.8) | 334% | 185.3 | 62.2 | 198% | ||||
| Cash provided by mine operations before changes in working capital | 44.2 | 16.2 | 173% | 147.9 | 85.7 | 73% | ||||
| Free cash flow (deficit) from mine operations(1) | 30.7 | (27.7) | 211% | 150.2 | 26.5 | 467% | ||||
| Operating Highlights: | ||||||||||
| Tonnes mined (000's) | 10,935 | 9,577 | 14% | 41,238 | 39,466 | 4% | ||||
| Tonnes ore mined (000's) | 5,350 | 3,812 | 40% | 19,196 | 15,736 | 22% | ||||
| Tonnes processed (000's) | 5,498 | 3,919 | 40% | 20,067 | 16,350 | 23% | ||||
| Process plant head grade gold (g/t) | 0.40 | 0.56 | (28%) | 0.41 | 0.53 | (23%) | ||||
| Process plant head grade copper (%) | 0.24% | 0.28% | (12%) | 0.26% | 0.26% | (0%) | ||||
| Gold recovery (%) | 61.2% | 67.1% | (9%) | 62.9% | 67.4% | (7%) | ||||
| Copper recovery (%) | 73.4% | 80.3% | (9%) | 77.4% | 81.3% | (5%) | ||||
| Mining costs ($/t mined material) | 2.07 | 2.43 | (15%) | 1.80 | 2.19 | (18%) | ||||
| Processing costs - total ($/t processed material) | 3.98 | 7.43 | (46%) | 4.88 | 7.10 | (31%) | ||||
| Concentrate produced (dmt) | 45,943 | 41,688 | 10% | 184,915 | 159,517 | 16% | ||||
| Gold produced (oz) (2) | 42,664 | 45,984 | (7%) | 161,855 | 183,107 | (12%) | ||||
| Copper produced (000's lb) (2) | 20,376 | 18,079 | 13% | 82,816 | 71,146 | 16% | ||||
| Gold sold (oz)(2) | 33,929 | 33,324 | 2% | 154,100 | 180,423 | (15%) | ||||
| Copper sold (000's lb)(2) | 18,975 | 14,301 | 33% | 80,477 | 67,430 | 19% | ||||
| Average realized gold price - combined ($/oz sold )(1)(2) | 1,376 | 1,137 | 21% | 1,330 | 1,077 | 23% | ||||
| Average realized copper price - combined ($/lb sold) (1)(2) | 2.79 | 2.23 | 25% | 2.22 | 2.09 | 6% | ||||
| Sustaining capital expenditures(3) | 16.6 | 8.9 | 87% | 37.8 | 35.6 | 6% | ||||
| Unit Costs: | ||||||||||
| Gold production costs ($/oz sold) | $ | 716 | $ | 831 | (14%) | $ | 744 | $ | 746 | (0%) |
| Gold - All-in sustaining costs on a by-product basis ($/oz sold) (1) | $ | 469 | $ | 1,114 | (58%) | $ | 541 | $ | 828 | (35%) |
| Gold - All-in costs on a by-product basis ($ /oz sold)(1) | $ | 558 | $ | 1,155 | (52%) | $ | 590 | $ | 849 | (31%) |
| Gold - All-in sustaining costs on a co-product basis ($/oz sold) (1) | $ | 1,033 | $ | 1,269 | (19%) | $ | 934 | $ | 950 | (2%) |
| Copper production costs ($/lb sold) | $ | 1.24 | $ | 1.50 | (17%) | $ | 1.18 | $ | 1.46 | (19%) |
| Copper - All-in Sustaining costs on a co-product basis ($/lb sold) (1) | $ | 1.79 | $ | 2.28 | (21%) | $ | 1.47 | $ | 1.85 | (21%) |
| (1) | Non-GAAP measure. See discussion under “Non-GAAP Measures”. |
| (2) | Mount Milligan production and sales are presented on a 100% basis. Under the Mount Milligan Streaming Arrangement, Royal Gold is entitled to 35% of gold ounces and 18.75% of copper. Royal Gold pays $435 per ounce of gold delivered and 15% of the spot price per metric tonne of copper delivered. |
| (3) | Capital expenditures are presented on a cash basis. |
Fourth Quarter 2020 compared to Fourth Quarter 2019
Earnings from mine operations of $34.2 million were recognized in the fourth quarter of 2020 compared to $9.7 million in the fourth quarter of 2019. The increase was primarily due to higher average realized gold and copper prices, higher copper sales and lower production costs, partially offset by an increase in depreciation due to the revised mine life which was published in early 2020.
A chart accompanying this announcement is available at https://www.globenewswire.com/NewsRoom/AttachmentNg/5e546bcc-fc62-4274-9a2e-d4cf1657df1b
Cash provided by mine operations of $44.0 million was recognized in the fourth quarter of 2020 compared to a deficit of $18.8 million in the fourth quarter of 2019. The increase was primarily due to higher net earnings from mine operations and an increase in cash generated from working capital. Free cash flow from mine operationsNG of $30.7 million was recognized in the fourth quarter of 2020 compared to a deficit $27.7 million in the fourth quarter of 2019, due to an increase in cash provided by mine operations, partially offset by an increase in capital expenditure related to the tailing storage facility.
During the fourth quarter of 2020, mining activities were in phases 4, 5 and 8 of the open pit. Total tonnes mined were 10.9 million tonnes and total material moved was 11.9 million tonnes in the fourth quarter of 2020. In the comparative quarter of 2019, total tonnes mined were 9.6 million tonnes and total material moved was 10.8 million tonnes.
Mining costs were $2.07 per tonne in the fourth quarter of 2020 compared to $2.43 per tonne in the fourth quarter of 2019. The decrease was due to higher tonnage mined as a result of improved mining efficiencies, lower diesel fuel prices, a reduction in contract service costs associated with the in-pit drilling program, lower labour costs and a favourable foreign currency exchange rate. This was partially offset by increased maintenance costs associated with major planned repairs of ancillary equipment.
Total mill throughput was 5.5 million tonnes, averaging 59,762 tonnes per calendar day in the fourth quarter of 2020, approaching the permitted limit of 60,000 tonnes per calendar day, compared to 3.9 million tonnes, averaging 42,599 tonnes per calendar day in the fourth quarter of 2019. Higher throughput was a result of improved milling efficiencies and greater mechanical availability.
Gold production was 42,664 ounces in the fourth quarter of 2020 compared to 45,984 ounces in the fourth quarter of 2019. The decrease was due to lower grades and recoveries, partially offset by increased throughput. During the fourth quarter of 2020, Mount Milligan’s average process plant gold head grade was 0.40 g/t compared to 0.56 g/t in the fourth quarter of 2019. Total copper production was 20.4 million pounds in the fourth quarter of 2020 compared to 18.1 million pounds in the fourth quarter of 2019. The increase was due to increased throughput, partially offset by lower grades and recoveries.
Processing costs were $3.98 per tonne in the fourth quarter of 2020 compared to $7.43 per tonne in the fourth quarter of 2019. The decrease was due to 40% higher tonnage, the timing of mill liner change-out, lower water sourcing costs and a favourable foreign currency exchange rate movement.
Gold production costs were $716 per ounce in the fourth quarter of 2020 compared to $831 per ounce in fourth quarter of 2019. The decrease was due to lower mining costs per tonne and lower processing costs per tonne.
Copper production costs were $1.24 per pound in the fourth quarter of 2020 compared to $1.50 per pound in the fourth quarter of 2019. The decrease was primarily due to lower mining costs per tonne and lower processing costs per tonne.
A chart accompanying this announcement is available at https://www.globenewswire.com/NewsRoom/AttachmentNg/4147b1c1-611c-48f4-b715-e0345bf0a7ec
All-in sustaining costs on a by-product basisNG were $469 per ounce in the fourth quarter of 2020 compared to $1,114 per ounce in the fourth quarter of 2019. The decrease was primarily due to increased copper credits due to higher realized copper prices and lower production costs, partially offset by higher sustaining capital related to the tailings storage facility.
All-in costs on a by-product basisNG were $558 per ounce in the fourth quarter of 2020 compared to $1,155 per ounce in the fourth quarter of 2019. The decrease was due to a decrease in all-in sustaining costs on a by-product basisNG, partially offset by higher exploration and development costs.
Year-ended December 31, 2020 compared to 2019 Earnings from mine operations of $101.1 million were recognized in 2020 compared to $49.0 million in 2019. The increase was due to 23% higher average realized gold prices, higher copper pounds sold and lower production costs. The increase was partially offset by higher depreciation, as a result of the change in the mine life in 2020.
A chart accompanying this announcement is available at https://www.globenewswire.com/NewsRoom/AttachmentNg/ba7a5b82-1ad5-449d-b155-9422d04e4c48
Cash provided by mine operations of $185.3 million was recognized in 2020 compared to $62.2 million in 2019. The increase was due to greater earnings from mine operations and a reduction in working capital. Free cash flow from mine operationsNG of $150.2 million was recognized in 2020 compared to $26.5 million in 2019, due to an increase in cash provided by mine operations.
During 2020, mining activities were in phases 3, 4, 5 and 8 of the open pit. Total tonnes mined in 2020 were 41.2 million tonnes and total material moved was 45.1 million tonnes. In the comparative period of 2019, total tonnes mined were 39.5 million tonnes and total material moved was 43.2 million tonnes.
Mining costs were $1.80 per tonne in 2020 compared to $2.19 per tonne in 2019. The decrease was due to lower diesel fuel price, lower contract service costs associated with the in-pit drilling program, a favorable foreign currency exchange rate and higher tonnage mined due to improved efficiencies.
Mount Milligan reported record mill throughput in 2020, processing 20.1 million tonnes, averaging 54,827 tonnes per calendar day in 2020 compared to 16.4 million tonnes, averaging 44,795 tonnes per calendar day in 2019. The increase in throughput is primarily due to the increased availability of water, continuous improvement to mill operations and greater availability. In 2020, Mount Milligan recorded its highest level of concentrate tonnes produced since the start of operations in 2014.
Gold production was 161,855 ounces in 2020 compared to 183,107 ounces in 2019. The decrease was due to lower grades and recoveries, partially offset by higher throughput. During 2020, Mount Milligan’s average process plant gold head grade was 0.41 g/t with a recovery of 63% compared to 0.53 g/t with a recovery of 67% in 2019. Total copper production was 82.8 million pounds in 2020 compared to 71.1 million pounds in 2019. The increase was primarily due to higher throughput, partially offset by lower copper recoveries.
Processing costs were $4.88 per tonne in 2020 compared to $7.10 per tonne in 2019. The per tonne decrease was due to the higher throughput, decreased water sourcing costs, lower labour costs, a favorable foreign exchange currency rate, and lower electricity costs. This was partially offset by higher mill consumables costs due to the higher throughput.
Gold production costs were $744 per ounce in 2020 consistent with $746 per ounce in 2019. The lower production costs were offset by the lower gold ounces sold.
Copper production costs were $1.18 per pound in 2020 compared to $1.46 per pound in 2019, primarily as a result of increased copper pounds sold and lower production costs.
A chart accompanying this announcement is available at https://www.globenewswire.com/NewsRoom/AttachmentNg/ac658e4a-ad90-4fd4-970f-947eef81cef2
All-in sustaining costs on a by-product basisNG were $541 per ounce for 2020 compared to $828 per ounce in 2019. The decrease was primarily due to increased copper credits, lower production costs including decreased water sourcing activities and lower diesel costs, partially offset by lower gold ounces sold.
All-in costs on a by-product basisNG were $590 per ounce in 2020 compared to $849 per ounce in 2019. The decrease was due to a decrease in all-in sustaining costs on a by-product basisNG, partially offset by higher exploration and development costs.
Öksüt Mine The Öksüt mine is situated in Turkey approximately 300 kilometres southeast of Ankara and 48 kilometres south of Kayseri, the provincial capital. The nearest administrative centre is at Develi, located approximately 10 kilometres north of the mine site.
The Öksüt mine achieved first gold pour on January 31, 2020 and achieved commercial production on May 31, 2020. Commercial production was declared after the operation completed its testing phase and the constructed assets were operating in the manner intended by management. Up to the point of achieving commercial production, gold revenue and the associated costs of production were capitalized.
During the fourth quarter of 2020, the construction of the Öksüt mine was finalized, with the completion of leach pad phase 1C, a new overflow pond, and crusher modification. Additionally, during the quarter, the Phase 2 expansion of the heap leach pad commenced with completion expected in 2021.
In early February 2021, there was a temporary disruption in mining activity at the Öksüt mine due to a labour dispute between the Company’s local mining contractor, Çiftay İnşaat Taahhüt ve Ticaret A.Ş (“Çiftay”) and its employees. The Company worked closely with Çiftay management, as well as with local government and other officials and the matter has been resolved.
During the third quarter of 2020, the Öksüt mine obtained an amendment to its environmental impact assessment (“EIA”) certificate from the Minister of Environment and Urbanization. The amendment is to accommodate changes to the Öksüt mine’s open pit mine design and pit optimization. Due to the delay in receiving the amendment from the EIA and further potential delays in obtaining the related forestry permit, the Öksüt mine plan and design is currently being further revised with the expectation that the high-grade ore of the Güneytepe deposit will be accessed in 2022.
COVID-19 Öksüt continues to maintain active measures to prevent a COVID-19 outbreak at the site. Open pit mining was suspended during the first quarter due to Turkish Government initiatives aimed at reducing the spread of COVID-19 and resumed normal operations in April. Placement of ore on the heap leach pad from stockpiles, ore irrigation, and the Adsorption-Desorption-Recovery plant continued to operate with limited impact on production.
Öksüt Operating Results
| ($ millions, except as noted) | Three months ended December 31, | Twelve months ended December 31, | ||
| 2020 | 2020 | |||
| Financial Highlights: | ||||
| Revenue | $ | 74.3 | $ | 186.5 |
| Production costs | 13.8 | 35.2 | ||
| Depreciation, depletion and amortization | 7.1 | 16.0 | ||
| Earnings from mine operations | $ | 53.4 | $ | 135.3 |
| Exploration and development costs | 1.0 | 1.7 | ||
| Other operating expenses | 0.1 | 0.1 | ||
| Earnings from operations | $ | 52.3 | $ | 133.5 |
| Cash provided by mine operations | 61.8 | 146.1 | ||
| Cash provided by mine operations before changes in working capital | 58.1 | 146.8 | ||
| Free cash flow from mine operations (1) | 46.5 | 105.2 | ||
| Operating Highlights: | ||||
| Tonnes mined (000's) | 4,440 | 15,115 | ||
| Tonnes ore mined (000's) | 115 | 2,578 | ||
| Ore mined - grade (g/t) | 1.91 | 1.68 | ||
| Ore crushed (000's) | 637 | 3,428 | ||
| Tonnes stacked (000's) | 952 | 3,445 | ||
| Heap leach grade (g/t) | 0.78 | 1.40 | ||
| Heap leach contained ounces stacked | 23,950 | 154,948 | ||
| Mining costs ($/t mined material) | 1.71 | 1.77 | ||
| Processing costs ($/t processed material) | 5.22 | 5.34 | ||
| Gold produced (oz) | 39,380 | 106,068 | ||
| Gold sold (oz)(2) | 39,380 | 105,503 | ||
| Average realized gold price ($/oz sold)(1) | 1,887 | 1,887 | ||
| Sustaining capital expenditures(3) | 1.9 | 1.9 | ||
| Non-sustaining capital expenditures(3)(4) | 6.2 | 30.4 | ||
| Capitalized stripping(3) | 7.2 | 11.5 | ||
| Capital expenditures - total | 15.3 | 43.8 | ||
| Unit Costs: | ||||
| Gold production costs ($/oz sold)(5) | $ | 350 | $ | 356 |
| Gold - All-in sustaining costs on a by-product basis ($/oz sold)(1)(5) | $ | 586 | $ | 494 |
| Gold - All-in costs on a by-product basis ($ /oz sold)(1)(5) | $ | 769 | $ | 819 |
| (1) | Non-GAAP measure. See discussion under “Non-GAAP Measures”. |
| (2) | Includes 6,654 ounces sold before the mine was in commercial production. |
| (3) | Capital expenditures are presented on a cash basis. |
| (4) | Non-sustaining capital expenditures are distinct projects designed to have a significant increase in the net present value of the mine. In the current year, non-sustaining capital expenditures included construction costs. |
| (5) | Calculated starting from June 1, 2020, after Öksüt achieved commercial production effective May 31, 2020. |
Fourth Quarter 2020
Earnings from mine operations were $53.4 million in the fourth quarter of 2020. Cash provided by mine operations was $61.8 million and free cash flow from mine operationsNG was $46.5 million in the fourth quarter of 2020. During the fourth quarter of 2020, the Company spent $6.2 million on construction and development activities at Öksüt compared to $28.8 million in the fourth quarter of 2019.
Total ounces of gold sold were 39,380 in the fourth quarter of 2020 at an average realized price of $1,887 per ounce, resulting in revenue recognized of $74.3 million for the quarter.
Mining in the fourth quarter of 2020 was focused on the development of phase 3 and phase 4 of the Keltepe pit, with total tonnes mined of 4.4 million tonnes. Mining costs were $1.71 per tonne in the fourth quarter of 2020.
Processing in the fourth quarter of 2020 was focused on the preparation, stacking and irrigation of the heap leach pad, with tonnes stacked of 0.95 million at a grade of 0.78 g/t. Processing costs, including crushing costs were $5.22 per tonne.
Gold production costs were $350 per ounce, all-in sustaining costs on a by-product basisNG were $586 per ounce and all-in costs on a by-product basisNG were $769 per ounce for the fourth quarter of 2020.
Year-ended December 31, 2020 Earnings from mine operations were $135.3 million in 2020, representing earnings while in commercial production. Cash provided by mine operations was $146.1 million and free cash flow from mine operationsNG of $105.2 million were recognized in 2020, as capital costs associated with the project continued to be incurred. During 2020, the Company spent $30.4 million on construction and development activities at Öksüt compared to $86.5 million in 2019.
Total ounces of gold sold in 2020 was 105,503 ounces including 98,849 ounces while in commercial production. The sale of gold was recorded as revenue starting on June 1, 2020, after Öksüt achieved commercial production. Previously, revenue and costs of gold sales during the testing stage were capitalized against construction costs.
Öksüt mined 15.1 million tonnes in 2020 at a cost of $1.77 per tonne. At the end of December 2020, 3.47 million tonnes of ore averaging 1.41 g/t gold had been placed onto the heap leach pad and was under leach with an estimated accumulated recovery to date of 76.2% which includes estimated gold in process inventory. Processing costs were $5.34 per tonne and total gold produced was 106,068 ounces in 2020.
Gold production costs per were $356 per ounce, all-in sustaining costs on a by-product basisNG were $494 per ounce and all-in costs on a by-product basisNG were $819 per ounce in 2020 (post commercial production).
Molybdenum Business UnitThe molybdenum business includes two North American primary molybdenum mines that are currently on care and maintenance: the Thompson Creek mine (mine and process plant) in Idaho and the 75%-owned Endako mine (mine, process plant and roaster) in British Columbia. The molybdenum business also includes the Langeloth metallurgical roasting facility (the "Langeloth Facility") in Pennsylvania. The Thompson Creek mine (the “TC mine”) operates a molybdenum beneficiation circuit to treat molybdenum concentrates to supplement the concentrate feed sourced directly for the Langeloth Facility. This beneficiation process allows the Company to process high copper content molybdenum concentrate purchased from third parties, which is then transported from TC mine to the Langeloth Facility for further processing.
The molybdenum business provides tolling treatment services for customers by converting molybdenum concentrates to molybdenum oxide powder, briquettes and ferromolybdenum products. Additionally, molybdenum concentrates are purchased to convert to upgraded products which are then sold in the metallurgical and chemical markets.
COVID-19 At the end of the fourth quarter of 2020, the molybdenum business remained COVID-19 free.
| ($ millions, except as noted) | Three months ended December 31, | Twelve months ended December 31, | ||||||||
| Financial Highlights: | 2020 | 2019 | % Change | 2020 | 2019 | % Change | ||||
| Molybdenum (Mo) revenue | 33.7 | 40.7 | (17%) | 132.3 | 204.7 | (35%) | ||||
| Tolling, calcining and other revenue | 0.9 | 1.5 | (40%) | 4.7 | 8.1 | (42%) | ||||
| Total revenues | $ | 34.6 | $ | 42.2 | (18%) | $ | 137.0 | $ | 212.8 | (36%) |
| Production costs | 34.3 | 50.8 | (33%) | 151.2 | 215.2 | (30%) | ||||
| Depreciation, depletion and amortization | 1.7 | 1.7 | 0% | 6.7 | 5.0 | 34% | ||||
| Loss from mine operations | $ | (1.3) | $ | (10.2) | (87%) | $ | (20.9) | $ | (7.4) | 182% |
| Exploration and development costs | - | 0.1 | (100%) | - | 0.1 | (100%) | ||||
| Care and Maintenance costs - Molybdenum mines | 3.1 | 3.3 | (6%) | 12.9 | 13.4 | (4%) | ||||
| Reclamation expense | 9.3 | 34.5 | (73%) | 53.4 | 34.5 | 55% | ||||
| Other operating expenses | 0.4 | 0.6 | (37%) | 2.1 | 2.7 | (22%) | ||||
| Net loss from operations | $ | (14.1) | $ | (48.7) | (71%) | $ | (89.3) | $ | (58.1) | 54% |
| Cash (used in) provided by operations | (3.8) | (12.9) | 71% | 11.4 | (20.2) | (156%) | ||||
| Free cash flow (deficit) from operations (1) | (6.2) | (14.1) | 56% | 5.6 | (25.0) | 122% | ||||
| Operating Highlights (000's lbs): | ||||||||||
| Mo purchased | 2,924 | 4,723 | (38%) | 13,577 | 17,779 | (24%) | ||||
| Mo roasted | 2,712 | 3,235 | (16%) | 13,760 | 17,384 | (21%) | ||||
| Mo sold | 3,610 | 3,578 | 1% | 13,667 | 16,035 | (15%) | ||||
| Toll roasted and upgraded Mo | 385 | 773 | (50%) | 2,383 | 5,059 | (53%) | ||||
| Average Mo spot price ($/lb) | 9.01 | 9.65 | (7%) | 8.68 | 11.35 | (24%) | ||||
| Total capital expenditure | 2.3 | 1.1 | 110% | 5.8 | 5.4 | 8% | ||||
| (1) | Non-GAAP measure. See discussion under “Non-GAAP Measures”. |
Fourth Quarter 2020 compared to Fourth Quarter 2019
A loss from operations of $14.1 million was recognized in the fourth quarter of 2020 compared to a loss of $48.7 million in the fourth quarter of 2019. The decrease was due to lower reclamation expense related to the change in the asset retirement obligation and a higher gross margin on material sold.
Cash used in operations of $3.8 million was recognized in the fourth quarter of 2020, compared to $12.9 million in the fourth quarter of 2019. The decrease was due to a reduced loss from operations excluding the non-cash movement in reclamation expense at the non-operating sites. A free cash flow deficit from operationsNG of $6.2 million was recognized in the fourth quarter of 2020 compared to a free cash flow deficit from operationsNG of $14.1 million in the fourth quarter of 2019, due to a decrease in cash used by operations.
Molybdenum roasted was 2.7 million pounds in the fourth quarter of 2020 compared to 3.2 million pounds in the fourth quarter of 2019. The decrease was the result of the decline in availability of feed for roasting.
A chart accompanying this announcement is available at https://www.globenewswire.com/NewsRoom/AttachmentNg/7cc4c546-4171-48dc-a27e-4165e4c85104
Year-ended December 31, 2020 compared to 2019A loss from operations of $89.3 million was recognized in 2020 compared to a loss of $58.1 million in 2019. The loss recorded in 2020 included a $53.4 million reclamation charge for an increase in the asset retirement obligation, as a result of a decrease in the risk-free interest rate used for discounting the liability, compared to a $34.5 million reclamation charge in 2019. The loss recorded in 2020 also included a $13.6 million non-cash write down in product inventory as a result of the continuing decline in the molybdenum price compared to $8.4 million in 2019.
Cash provided by operations was $11.4 million in 2020 compared to cash used by operations of $20.2 million in 2019. The increase was due to a $22.8 million United States tax refund received in the current year as a result of a change in income tax laws affecting prior year tax filings and an increase in cash generated from working capital.
In 2020, 13.8 million pounds of molybdenum were roasted, including 2.4 million pounds from tolling arrangements, which represented a 21% and 53% decrease over 2019, respectively. The decrease was primarily due to the decline in demand for industrial products that use molybdenum which was adversely affected by the demand disruption created by the COVID-19 pandemic.
Pre-Development Projects
Kemess Underground Project:The Kemess Project (“Kemess”) is located in north-central British Columbia, Canada, approximately 250 kilometres north of Smithers, 430 kilometres northwest of Prince George and 209 kilometres from the Mount Milligan mine. The Kemess site includes infrastructure from the past producing Kemess South mine. There are currently no mining activities at the Kemess site and on-site activities consist of care and maintenance work and pre-development activities for the proposed Kemess Underground Project.
COVID-19The Kemess Project continues to monitor controls that have been put in place to manage the exposure of its workforce to COVID-19 and has added to these controls as required. These measures have resulted in a COVID-19 free environment.
Fourth Quarter 2020 compared to Fourth Quarter 2019 Care and maintenance costs of $4.2 million were recognized in the fourth quarter of 2020, compared to $5.2 million recognized in the fourth quarter of 2019. Capital expenditures of $2.2 million were recognized in the fourth quarter of 2020, compared to $7.1 million in the fourth quarter of 2019. The capital expenditures in the fourth quarter of 2020 included costs for technical engineering studies and the installation and commissioning of site generators. The capital expenditures in the fourth quarter of 2019 included the construction of a water treatment plant and water distribution system.
Year-ended December 31, 2020 compared to 2019 Care and maintenance costs of $16.1 million were recognized in 2020, compared to $14.9 million recognized in 2019. Capital expenditures of $12.9 million were recognized in 2020, compared to $32.7 million in 2019. The capital expenditures in 2020 included costs for technical engineering studies, water treatment plant performance testing, completion of the southern collection system pond construction and the installation and commissioning of site generators. The capital expenditures in 2019 included expenditures for the water treatment plant, camp refurbishment and mobile equipment purchases.
Greenstone Gold Property:The Greenstone Gold property is located in northern Ontario, Canada approximately 275 kilometres northeast of Thunder Bay and includes the Hardrock deposit.
On December 15, 2020, the Company entered into an agreement with an affiliate of the Orion Mine Finance Group (“Orion”) and Premier Gold Mines Limited to sell the Company’s 50% interest in the Greenstone Partnership to Orion for cash consideration of $225 million, subject to certain adjustments and contingent consideration of approximately $75 million, assuming a gold price of $1,500 per ounce, based on the successful construction and operation of the mine, which will be recorded on achieving the applicable milestones.
On January 19, 2021, the Company completed the sale of its 50% interest in the Greenstone Gold Mines Partnership with final cash consideration received of $210 million, net of adjustments. As a result of the closing of this transaction, the Company expects to recognize a gain of approximately $72 million in the first quarter of 2021
Quarterly Results – Previous Eight Quarters
Over the last eight quarters, Centerra’s results reflect the impact of increasing gold sales during a period of rising gold prices. Production costs have also benefited from decreasing diesel fuel costs and depreciating Kyrgyz and Turkish currencies over the last eight quarters. Gold sold on a quarterly basis steadily increased from the first quarter of 2019 to the third quarter of 2019, followed by a slight decline in the fourth quarter of 2019 and increasing again in the first nine months of 2020 as the Öksüt mine reached commercial production, with a decline in the fourth quarter of 2020 due to lower ounces sold at Kumtor. The third quarter of 2019 reflects the impairment of $230.5 million recorded on the Mount Milligan mine and a $10 million Kyrgyz Republic settlement expense. A non-cash reclamation expense was recognized in the fourth quarters of 2019 and 2020 of $31.4 million and $53.4 million, respectively, as a result of a change in the interest rate used to discount the reclamation costs at the two molybdenum mine sites which are not in operation. The quarterly financial results for the last eight quarters are shown below:
| $ million, except per share data | 2020 | 2019 | ||||||
| Quarterly data unaudited | ||||||||
| Q4 | Q3 | Q2 | Q1 | Q4 | Q3 | Q2 | Q1 | |
| Revenue | 387 | 515 | 413 | 374 | 313 | 388 | 341 | 334 |
| Net earnings (loss) | 95 | 206 | 88 | 20 | (12) | (165) | 33 | 50 |
| Basic earnings (loss) per share | 0.32 | 0.70 | 0.30 | 0.07 | (0.04) | (0.56) | 0.11 | 0.17 |
| Diluted earnings (loss) per share | 0.32 | 0.68 | 0.29 | 0.06 | (0.04) | (0.56) | 0.11 | 0.17 |
Related party transactions
KyrgyzaltynThe sole customer of gold doré from the Kumtor mine, Kyrgyzaltyn JSC (“Kyrgyzaltyn”), is a shareholder of the Company and is a state-owned entity of the Kyrgyz Republic. Gold produced by the Kumtor mine is purchased at the mine site by Kyrgyzaltyn, for processing at its refinery in the Kyrgyz Republic pursuant to the Restated Gold and Silver Sales Agreement (“Sales Agreement”), dated June 6, 2009 between KGC, Kyrgyzaltyn and the Government of the Kyrgyz Republic. Amounts receivable from Kyrgyzaltyn arise from the sale of gold to Kyrgyzaltyn. Kyrgyzaltyn is required to pay for gold delivered within 12 days from the date of shipment. Default interest is accrued on any unpaid balance after the permitted payment period of 12 days. The obligations of Kyrgyzaltyn are partially secured by a pledge of 2,850,000 shares of the Company owned by Kyrgyzaltyn. Revenues from the Kumtor mine are subject to a management fee of $1.00 per ounce based on sales volumes, payable to Kyrgyzaltyn.
The breakdown of the sales transactions and expenses with Kyrgyzaltyn, and the management fees paid and accrued by KGC to Kyrgyzaltyn according to the terms of the Sales Agreement are as follows:
| 2020 | 2019 | ||||
| Sales: | |||||
| Gross gold and silver sales to Kyrgyzaltyn(1) | $ | 995,111 | $ | 836,689 | |
| Deduct: refinery and financing charges | (6,164) | (5,141) | |||
| Net sales revenue received from Kyrgyzaltyn | $ | 988,947 | $ | 831,548 | |
| Expenses: | |||||
| Contracting services provided by Kyrgyzaltyn(2) | $ | 658 | $ | 1,146 | |
| Management fees payable to Kyrgyzaltyn | 569 | 600 | |||
| Expenses paid to Kyrgyzaltyn | $ | 1,227 | $ | 1,746 | |
| (1) | As at December 31, 2020, there is no amount receivable from Kyrgyzaltyn from gold sales (December 31, 2019 - $0.1 million). |
| (2) | As at December 31, 2020, there is $0.9 million payable to Kyrgyzaltyn (December 31, 2019 - $1.2 million). |
Transactions with directors and key management
The Company transacts with key management personnel and directors, who have authority and responsibility to plan, direct and control the activities of the Company, for services rendered in their capacity as directors and employees.
Key management personnel are defined as the executive officers of the Company including the President and Chief Executive Officer, Vice President and Chief Financial Officer, Vice President and Chief Operating Officer, Vice President and General Counsel, Vice President Business Development & Exploration, and Vice President and Chief Human Resources Officer who joined the Company in February 2020.
The increase in compensation for key management personnel salaries and benefits is a combination of increase in executive officers from five to six together an increase in short-term incentives. The share-based compensation is driven by performance of the Company’s share price relative to the S&P/TSX Global Gold Index Total Return Index Value.
During the years ended December 31, 2020 and 2019, remuneration to directors and key management personnel were as follows:
Compensation of directors
| 2020 | 2019 | ||||
| Fees earned and other compensation | $ | 820 | $ | 1,259 | |
| Share-based compensation | 3,011 | 2,465 | |||
| Total expense | $ | 3,831 | $ | 3,724 | |
Compensation of key management personnel
| 2020 | 2019 | ||||
| Salaries and benefits | $ | 6,354 | $ | 4,311 | |
| Share-based compensation | 9,264 | 7,756 | |||
| Total expense | $ | 15,618 | $ | 12,067 | |
In 2020, the Company incurred an amount of $94 for services rendered by a family member of one of Centerra’s key management personnel. This person was acting as a consultant.
Contingencies
The following is a summary of contingencies with respect to matters affecting the Company and its subsidiaries. Readers are cautioned that the following is only a brief summary of such matters. For a more complete discussion of these matters, see the Company’s news releases and its most recently filed Annual Information Form and specifically the section therein entitled “Risks that can affect our business” available on SEDAR at www.sedar.com. The following summary also contains forward-looking statements and readers are referred to “Caution Regarding Forward-looking Information”.
Kyrgyz Republic
The Kyrgyz Parliamentary elections held in early October 2020 resulted in a period of political and social disruption in the Kyrgyz Republic, eventually leading to the cancellation of the Parliamentary election results and the resignation of the then Kyrgyz Prime Minister and President. Presidential elections were held in the Kyrgyz Republic on January 10, 2021, with Mr. Sadyr Japarov being elected President. A non-binding referendum on the Kyrgyz Republic’s form of government was also held on January 10, 2021 and the Company expects a process of constitutional reform to unfold in the coming months leading to a presidential form of government.
The Company understands that a parliamentary commission has been formed by the Kyrgyz Republic Parliament in February 2021, to review the effectiveness of the Kumtor Mine’s activities. The Company will review the mandate for the parliamentary commission when it becomes available to determine the precise scope of the commission’s proposed review and its response to the inquiries, if necessary.
Despite the changes to the political landscape in the Kyrgyz Republic and the uncertainty of the Parliamentary elections, the Kumtor operations have continued uninterrupted. The Company continues to monitor the situation with the objective of ensuring that the Kumtor mine continues its operation uninterrupted in accordance with its project agreements.
Canada
Mount Milligan Mine
As previously disclosed, in the first quarter of 2020, the Company received a notice of civil claim from H.R.S. Resources Corp. (“H.R.S.”), the holder of a 2% production royalty at Mount Milligan. H.R.S. claims that since November 2016 (when the royalty became payable) the Company has incorrectly calculated amounts payable under the production royalty agreement and has therefore underpaid amounts owing to H.R.S. The Company disputes the claim and believes it has correctly calculated the royalty payments in accordance with the agreement. The Company believes that the potential exposure in relation to this claim, over what the Company has accrued, is not material.
Other
The Company operates in multiple countries around the world and accordingly is subject to, and pays, taxes under the various regimes in those jurisdictions in which it operates. These tax regimes are determined under general taxation and other laws of the respective jurisdiction. The Company has historically filed, and continues to file, all required tax returns and to pay the taxes reasonably determined to be due. The tax rules and regulations in many countries are complex and subject to interpretation. From time to time the Company’s tax filings are subject to review and in connection with such reviews, disputes can arise with the taxing authorities over the Company’s interpretation of the country’s tax laws. The Company records provisions for future tax assessments considered to be probable. As at December 31, 2020, the Company did not have any material provision for claims or taxation assessments.
Contractual Obligations
The following table summarizes Centerra’s contractual obligations as of December 31, 2020, including payments due over the next five years and thereafter:
| $ millions | Total | Due in Less than One Year | Due in 1 to 3 Years | Due in 4 to 5 Years | Due After 5 Years | ||||||
| Kumtor | |||||||||||
| Reclamation trust fund (1) | $ | 22.0 | $ | 6.0 | $ | 16.0 | - | ||||
| Capital equipment (2) | 27.3 | 27.3 | - | - | - | ||||||
| Operational supplies | 24.1 | 24.1 | - | - | - | ||||||
| Mount Milligan | |||||||||||
| Operational supplies | 1.0 | 1.0 | - | - | - | ||||||
| Leases | 13.9 | 4.3 | 7.7 | 1.9 | - | ||||||
| Öksüt | |||||||||||
| Capital equipment (2) | 3.0 | 2.3 | 0.7 | - | - | ||||||
| Operational supplies | 0.5 | 0.5 | - | - | - | ||||||
| Leases | 0.7 | 0.4 | 0.3 | - | - | ||||||
| Kemess Project | |||||||||||
| Project development | - | - | - | - | - | ||||||
| Corporate and other | |||||||||||
| Leases | 5.9 | 0.7 | 1.7 | 3.5 | - | ||||||
| Total contractual obligations (2) | $ | 98.4 | $ | 66.6 | $ | 26.4 | $ | 5.4 | $ | - | |
| (1) | Centerra’s future estimated decommissioning and reclamation costs for the Kumtor mine are present-valued at $56.5 million to be incurred beyond 2031. The settlement agreement with the Kyrgyz Republic Government requires this restricted cash to be funded at a rate of $6.0 million per year until the Reclamation Trust Fund reaches the total estimated reclamation cost for the Kumtor Project (no less than $69.0 million). The estimated future cost of closure, reclamation and decommissioning of the project are used as the basis for calculating the amount remaining to be deposited in the Reclamation Trust Fund ($69.0 million). On December 31, 2020 the balance in the Reclamation Trust Fund was $47.0 million (2019 - $40.9 million), with the remaining $22.0 million to be funded over the life of the mine. |
| (2) | Excludes trade payables and accrued liabilities. |
Accounting Estimates, Policies and Changes
Accounting EstimatesThe preparation of consolidated financial statements in accordance with IFRS requires management to make judgments, estimates and assumptions that affect the application of the Company’s accounting policies, which are described in note 3 of the consolidated financial statements, the reported amounts of assets and liabilities and disclosure of commitments and contingent liabilities at the date of the financial statements, and the reported amounts of revenues and expenses during the reporting period. The determination of estimates requires the exercise of judgment based on various assumptions and other factors such as historical experience, current and expected economic conditions. Actual results could differ from those estimates.
Management’s estimates and underlying assumptions are reviewed on an ongoing basis. Any changes or revisions to estimates and underlying assumptions are recognized in the period in which the estimates are revised and in any future periods affected. Changes to these critical accounting estimates could have a material impact on the consolidated financial statements.
The key sources of estimation uncertainty and judgment used in the preparation of the consolidated financial statements that have a significant risk of causing a material adjustment to the carrying amounts of assets and liabilities and earnings within the next financial year are outlined in detail in note 4 of the December 31, 2020 financial statements.
Disclosure Controls and Procedures and Internal Control Over Financial Reporting
The Company’s management, including the CEO and CFO, is responsible for the design of disclosure controls and procedures (“DC&P”) and internal controls over financial reporting (“ICFR”). Centerra adheres to the Committee of Sponsoring Organizations of the Treadway Commission’s (“COSO”) revised 2013 Internal Control Framework for the design of its ICFR. There was no material change to the Company’s internal controls over financial reporting that occurred during 2020 that has materially affected, or is reasonably likely to materially affect, the Company’s internal controls over financial reporting.
The evaluation of DC&P and ICFR was carried out under the supervision of and with the participation of management, including Centerra’s CEO and CFO. Based on these evaluations, the CEO and the CFO concluded that the design and operation of these DC&P and ICFR were effective throughout 2020.
Non-GAAP Measures
In the fourth quarter of 2020, the Company elected to present the World Gold Council’s (“WGC”) financial measure all-in costs on a by-product basis per ounce (“AIC”), which incorporates non-sustaining capital expenditures and certain development and overhead costs in addition to the sustaining costs that are included in the all-in sustaining costs on a by-product basis metric. Management believes the AIC metric will assist stakeholders in understanding the costs associated with producing gold over the entire lifecycle of the mine.
This document contains the following non-GAAP financial measures: all-in sustaining costs per ounce on a by-product basis, all-in sustaining costs per ounce on a by-product basis including revenue-based taxes, all-in sustaining costs per ounce on a co-product basis and all-in costs on a by-product basis per ounce. In addition, non-GAAP financial measures include adjusted net earnings, adjusted net earnings per common share (basic and diluted), average realized gold price, average realized copper price, adjusted cash provided by operations, free cash flow from operations and adjusted free cash flow from operations. These financial measures do not have any standardized meaning prescribed by GAAP and are therefore unlikely to be comparable to similar measures presented by other issuers, even as compared to other issuers who may be applying the WGC guidelines, which can be found at http://www.gold.org.
Management believes that the use of these non-GAAP measures will assist analysts, investors and other stakeholders of the Company in understanding the costs associated with producing gold, understanding the economics of gold mining, assessing our operating performance, our ability to generate free cash flow from current operations and to generate free cash flow on an overall Company basis, and for planning and forecasting of future periods. However, the measures do have limitations as analytical tools as they may be influenced by the point in the life cycle of a specific mine and the level of additional exploration or expenditures a company has to make to fully develop its properties. Accordingly, these non-GAAP measures should not be considered in isolation, or as a substitute for, analysis of our results as reported under GAAP.
DefinitionsThe following is a description of the non-GAAP measures used in this MD&A:
- All-in sustaining costs on a by-product basis per ounce include adjusted operating costs, the cash component of capitalized stripping costs, corporate general and administrative expenses, accretion expenses, and sustaining capital, net of copper and silver credits. The measure incorporates costs related to sustaining production. When calculating all-in sustaining costs on a by-product basis, all revenue received from the sale of copper from the Mount Milligan mine, as reduced by the effect of the copper stream, is treated as a reduction of costs incurred. All-in sustaining costs on a by-product basis per ounce excludes revenue-based taxes.
- All-in sustaining costs on a by-product basis per ounce including revenue-based taxes, include revenue-based taxes at Kumtor.
- All-in sustaining costs on a co-product basis per ounce of gold or per pound of copper, are based on an allocation of production costs between copper and gold based on the conversion of copper production to ounces of gold equivalent. For the fourth quarter and year-end of 2020, 576 and 633 pounds of copper, respectively, were equivalent to one ounce of gold. All-in sustaining costs on a co-product basis per ounce of gold or per pound of copper excludes revenue-based taxes.
- All-in costs on a by-product basis per ounce include all-in sustaining costs on a by-product basis including revenue-based taxes, exploration and study costs, non-sustaining capital expenditures, care and maintenance and pre-development costs.
- Non-sustaining capital expenditures are costs incurred at new operations and costs related to major projects at existing operations where these projects will materially benefit the operation.
- Adjusted net earnings is calculated by adjusting net earnings (loss) as recorded in the consolidated statements of income (loss) and comprehensive income (loss) for items not associated with ongoing operations.
- Adjusted cash provided by operations is calculated by adjusting cash provided by operations as recorded in the condensed consolidated interim statements of statements of cash flows for items not associated with ongoing operations.
- Average realized gold price is calculated by dividing the different components of gold sales (including third party sales, mark to market adjustments, final pricing adjustments and the fixed amount received under the Mount Milligan Streaming Arrangement(1)) by the number of ounces sold.
- Average realized copper price is calculated by dividing the different components of copper sales (including third party sales, mark to market adjustments, final pricing adjustments and the fixed amount received under the Mount Milligan Streaming Arrangement(1)) by the number of pounds sold.
- Free cash flow is calculated as cash provided by operations less additions to property, plant and equipment.
- Free cash flow from mine operations is calculated as cash provided by mine operations less additions to property, plant and equipment.
- Adjusted free cash flow from operations is calculated as free cash flow adjusted for items not associated with ongoing operations.
| (1) | Realized revenue for the gold and copper concentrate produced at the Mount Milligan mine reflects the actual price received from customers upon final settlement for both the contained gold and copper, less the difference between the cost of the purchased refined gold and copper warrants to satisfy the Company’s obligations under the Mount Milligan Streaming Arrangement and the amount the Company receives under that arrangement. |
Certain unit costs, including all-in sustaining costs on a by-product basis (including and excluding revenue-based taxes) per ounce are non-GAAP measures and can be reconciled as follows:
| Three months ended December 31, | Twelve months ended December 31, | |||||||||||||
| (Unaudited - $ millions, unless otherwise specified) | Consolidated | Kumtor | Mount Milligan | Öksüt | Consolidated | Kumtor | Mount Milligan | Öksüt | ||||||
| 2020 | 2019 | 2020 | 2019 | 2020 | 2019 | 2020 | 2020 | 2019 | 2020 | 2019 | 2020 | 2019 | 2020 | |
| Production costs attributable to gold | 80.5 | 77.3 | 42.4 | 49.6 | 24.3 | 27.7 | 13.8 | 344.7 | 363.1 | 194.8 | 228.6 | 114.7 | 134.5 | 35.2 |
| Production costs attributable to copper | 23.5 | 21.4 | - | - | 23.5 | 21.4 | - | 94.7 | 98.2 | - | - | 94.7 | 98.2 | - |
| Total production costs excluding molybdenum segment, as reported | 104.0 | 98.7 | 42.4 | 49.6 | 47.8 | 49.1 | 13.8 | 439.4 | 461.3 | 194.8 | 228.6 | 209.4 | 232.7 | 35.2 |
| Adjust for: | ||||||||||||||
| Third party smelting, refining and transport costs | 3.6 | 3.8 | 1.1 | 1.3 | 2.5 | 2.5 | - | 15.0 | 14.0 | 6.2 | 5.1 | 8.8 | 8.9 | - |
| By-product and co-product credits | (53.0) | (31.9) | - | - | (53.0) | (31.9) | - | (178.6) | (140.8) | - | - | (178.6) | (140.8) | - |
| Community costs related to current operations | 2.2 | 2.4 | 2.2 | 2.4 | - | - | - | 19.3 | 8.7 | 19.3 | 8.7 | - | - | - |
| Adjusted production costs | 56.8 | 73.0 | 45.7 | 53.3 | (2.7) | 19.7 | 13.8 | 295.1 | 343.2 | 220.3 | 242.4 | 39.6 | 100.8 | 35.2 |
| Corporate general administrative and other costs | 17.6 | 9.0 | - | - | 0.3 | - | - | 46.1 | 44.6 | - | - | 1.2 | - | - |
| Reclamation and remediation - accretion (operating sites) | 0.3 | 0.5 | 0.3 | 0.4 | - | 0.1 | - | 1.0 | 1.9 | 1.0 | 1.4 | - | 0.5 | - |
| Capitalized stripping(1) | 55.3 | 28.2 | 48.1 | 28.2 | - | - | 7.2 | 154.0 | 76.5 | 142.5 | 76.5 | - | - | 11.5 |
| Sustaining capital expenditures(1) | 33.7 | 16.7 | 15.2 | 7.8 | 16.6 | 8.9 | 1.9 | 97.7 | 74.2 | 58.0 | 38.6 | 37.8 | 35.6 | 1.9 |
| Sustaining leases | 1.9 | 8.4 | - | - | 1.7 | 8.4 | 0.2 | 5.0 | 12.4 | - | - | 4.8 | 12.4 | 0.2 |
| All-in sustaining costs on a by-product basis | 165.6 | 135.8 | 109.3 | 89.7 | 15.9 | 37.1 | 23.1 | 599.0 | 552.8 | 421.8 | 358.9 | 83.4 | 149.3 | 48.8 |
| Revenue-based taxes | 25.2 | 28.3 | 25.2 | 28.3 | - | - | - | 138.5 | 116.4 | 138.5 | 116.4 | - | - | - |
| All-in sustaining costs on a by-product basis (including revenue-based taxes) | 190.8 | 164.1 | 134.5 | 118.0 | 15.9 | 37.1 | 23.1 | 737.5 | 669.2 | 560.3 | 475.3 | 83.4 | 149.3 | 48.8 |
| Exploration and study costs | 13.0 | 9.0 | 5.5 | 4.3 | 3.0 | 1.3 | 1.0 | 39.2 | 28.0 | 15.9 | 11.3 | 7.5 | 4.0 | 1.7 |
| Non-sustaining capital expenditures(1)(2) | 20.2 | 42.3 | 9.4 | 2.9 | - | - | 6.2 | 69.8 | 148.9 | 16.8 | 16.0 | - | - | 30.4 |
| Care and maintenance costs and pre-development costs | 5.8 | 10.8 | - | - | - | - | - | 24.3 | 32.7 | - | - | - | - | - |
| All-in costs on a by-product basis | 229.8 | 226.2 | 149.4 | 125.2 | 18.9 | 38.4 | 30.3 | 870.8 | 878.8 | 593.0 | 502.6 | 90.9 | 153.3 | 80.9 |
| Ounces sold (000's) | 169.9 | 169.9 | 96.6 | 136.6 | 33.9 | 33.3 | 39.4 | 822.1 | 780.6 | 569.2 | 600.2 | 154.1 | 180.4 | 98.8 |
| Pounds sold (millions) | 19.0 | 14.3 | - | - | 19.0 | 14.3 | - | |||||||
| Gold production costs ($ /oz sold) | 474 | 455 | 439 | 363 | 716 | 831 | 350 | 419 | 465 | 342 | 381 | 744 | 746 | 356 |
| Gold - All-in sustaining costs on a by-product basis ($ /oz sold) | 974 | 799 | 1,131 | 657 | 469 | 1,114 | 586 | 729 | 708 | 741 | 598 | 541 | 828 | 494 |
| Gold - All-in sustaining costs on a by-product basis, including revenue-based taxes ($ /oz sold) | 1,122 | 966 | 1,391 | 864 | 469 | 1,114 | 586 | 897 | 857 | 984 | 792 | 541 | 828 | 494 |
| Gold - All-in costs on a by-product basis ($ /oz sold) | 1,352 | 1,331 | 1,545 | 916 | 558 | 1,155 | 769 | 1,059 | 1,126 | 1,042 | 838 | 590 | 849 | 819 |
| Gold - All-in sustaining costs on a co-product basis ($ /oz sold) | 1,073 | 829 | 1,131 | 657 | 1,033 | 1,269 | 586 | 799 | 737 | 741 | 598 | 934 | 950 | 494 |
| Copper production costs ($ /pound sold) | 1.24 | 1.50 | n/a | n/a | 1.24 | 1.50 | n/a | 1.18 | 1.46 | n/a | n/a | 1.18 | 1.46 | n/a |
| Copper - All-in sustaining costs on a co-product basis ($ /pound sold) | 1.79 | 2.28 | n/a | n/a | 1.79 | 2.28 | n/a | 1.47 | 1.85 | n/a | n/a | 1.47 | 1.85 | n/a |
| (1) | Capital expenditures are presented on a cash basis. |
| (2) | Non-sustaining capital expenditures are distinct projects designed to have a significant increase in the net present value of the mine. In the current year, non-sustaining capital expenditures included construction costs related to the Öksüt mine and additional costs related to cut-back 20 at the Kumtor mine. |
Adjusted net earnings can be reconciled as follows:Adjusted net earnings is intended to provide investors with information about the Company’s continuing income generating capabilities. This measure adjusts for the earnings impact of items not associated with ongoing operations.}
| Three months ended December 31, | Twelve months ended December 31, | ||||||||
| ($ millions, except as noted) | 2020 | 2019 | 2020 | 2019 | |||||
| Net earnings | $ | 95.2 | $ | (12.2) | $ | 408.5 | $ | (93.5) | |
| Adjust for items not associated with ongoing operations: | |||||||||
| Kyrgyz Republic settlement | - | - | - | 10.0 | |||||
| Asset Impairment - Mount Milligan | - | - | - | 230.5 | |||||
| ARO revaluation at sites on care and maintenance | 9.3 | 34.5 | 53.4 | 34.5 | |||||
| Adjusted net earnings | $ | 104.5 | $ | 22.3 | $ | 461.9 | $ | 181.5 | |
| Net earnings (loss) per share - basic | $ | 0.32 | $ | (0.04) | $ | 1.39 | $ | (0.32) | |
| Net earnings (loss) per share - diluted | $ | 0.32 | $ | (0.04) | $ | 1.37 | $ | (0.32) | |
| Adjusted net earnings per share - basic | $ | 0.35 | $ | 0.08 | $ | 1.57 | $ | 0.62 | |
| Adjusted net earnings per share - diluted | $ | 0.35 | $ | 0.08 | $ | 1.55 | $ | 0.62 | |
Adjusted cash provided by operations can be reconciled as follows:
| Three months ended December 31 | Twelve months ended December 31 | |||||||
| ($ millions, except as noted) | 2020 | 2019 | 2020 | 2019 | ||||
| Cash provided by operations | $ | 182.0 | $ | 92.5 | $ | 930.0 | $ | 334.1 |
| Adjust for items not associated with ongoing operations: | ||||||||
| Kyrgyz Republic settlement payment | - | - | 5.0 | 62.6 | ||||
| Adjusted cash provided by operations | $ | 182.0 | $ | 92.5 | $ | 935.0 | $ | 396.7 |
Free cash flow and Adjusted free cash flow are calculated as follows:
| Three months ended December 31 | Twelve months ended December 31 | |||||||
| ($ millions, except as noted) | 2020 | 2019 | 2020 | 2019 | ||||
| Cash provided by operations (1) | $ | 182.0 | $ | 92.5 | $ | 930.0 | $ | 334.1 |
| Adjust for: | ||||||||
| Additions to property, plant and equipment (1) | (105.2) | (92.9) | (326.2) | (299.4) | ||||
| Free cash flow (deficit) | $ | 76.8 | $ | (0.4) | $ | 603.8 | $ | 34.7 |
| Adjust for: | ||||||||
| Kyrgyz Republic settlement payment | - | - | 5.0 | 62.6 | ||||
| Adjusted Free cash flow (deficit) | $ | 76.8 | $ | (0.4) | $ | 608.8 | $ | 97.3 |
| (1) | As presented in the Company’s Consolidated Statement of Cash Flows. |
Average realized sales price for gold
The average realized gold price per ounce sold is calculated by dividing gold sales revenue, together with the final pricing adjustments and mark-to-market adjustments by the ounces sold, as shown in the table below:
| Average realized sales price for gold | Three months ended December 31, | Twelve months ended December 31, | ||
| 2020 | 2019 | 2020 | 2019 | |
| Gold sales reconciliation ($ millions) | ||||
| Gold sales - Kumtor | 178.1 | 200.5 | 981.6 | 827.5 |
| Gold sales - Öksüt | 74.3 | - | 186.5 | - |
| Gold sales - Mt. Milligan | ||||
| Gold sales related to cash portion of Royal Gold stream | 5.1 | 5.1 | 23.5 | 27.4 |
| Mark-to-market adjustments on sales to Royal Gold | 0.2 | 0.7 | 6.3 | 1.7 |
| Final adjustments on sales to Royal Gold | (0.4) | (0.9) | (10.7) | (4.0) |
| Total gold sales under Royal Gold stream | 4.9 | 4.9 | 19.1 | 25.1 |
| Gold sales to third party customers | 41.2 | 32.8 | 175.0 | 164.3 |
| Mark-to-market adjustments | 2.4 | 2.7 | 4.0 | (2.7) |
| Final pricing adjustments | (1.9) | (1.6) | 9.0 | 8.6 |
| Final metal adjustments | 0.3 | (0.7) | (1.4) | (0.2) |
| Total gold sales to third party customers | 42.0 | 33.2 | 186.6 | 170.0 |
| Gold sales, net of adjustments | 46.9 | 38.1 | 205.7 | 195.1 |
| Refining and treatment costs | (0.2) | (0.2) | (0.7) | (0.9) |
| Total gold sales | 46.7 | 37.9 | 205.0 | 194.2 |
| Total gold revenue - Consolidated | 299.2 | 238.4 | 1,373.1 | 1,021.7 |
| Ounces of gold sold | ||||
| Gold ounces sold - Kumtor | 96,641 | 136,568 | 569,213 | 600,231 |
| Gold ounces sold - Öksüt | 39,380 | - | 98,849 | - |
| Ounces sold to Royal Gold - Mt. Milligan | 11,842 | 11,577 | 53,684 | 62,800 |
| Ounces sold to third party customers - Mt. Milligan | 22,087 | 21,747 | 100,416 | 117,623 |
| Total ounces sold - Consolidated(1) | 169,950 | 169,892 | 822,162 | 780,654 |
| Average realized sales price for gold on a per ounce basis | ||||
| Average realized sales price - Kumtor | 1,843 | 1,468 | 1,725 | 1,379 |
| Average realized sales price - Öksüt | 1,887 | - | 1,887 | - |
| Average realized gold price - Royal Gold | 435 | 435 | 435 | 435 |
| Average realized gold price - Mark-to-market adjustments | 15 | 43 | 118 | 27 |
| Average realized gold price - Final pricing adjustments | (31) | (80) | (199) | (64) |
| Average realized gold price - Mt. Milligan - Royal Gold | 419 | 398 | 354 | 398 |
| Average realized gold price - Third party | 1,866 | 1,510 | 1,743 | 1,397 |
| Average realized gold price - Mark-to-market adjustments | 108 | 126 | 40 | (23) |
| Average realized gold price - Final pricing adjustments | (88) | (71) | 90 | 73 |
| Average realized gold price - Final metal adjustments | 13 | (30) | (14) | (2) |
| Average realized gold price - Mt. Milligan - Third party | 1,899 | 1,535 | 1,859 | 1,445 |
| Average realized gold price - Mt. Milligan - Combined | 1,376 | 1,137 | 1,330 | 1,077 |
| Average realized sales price for gold - Consolidated | 1,760 | 1,403 | 1,670 | 1,309 |
| (1) | Includes ounces sold at Öksüt from June 1, 2020, after Öksüt achieved commercial production on May 31, 2020. |
Average realized sales price for Copper - Mount Milligan
The average realized copper price per pound is calculated by dividing copper sales revenue, together with the final pricing adjustments and mark-to-market adjustments per pound, as shown in the table below:
| Average realized sales price for Copper - Mount Milligan | Three months ended December 31, | Twelve months ended December 31, | ||
| 2020 | 2019 | 2020 | 2019 | |
| Copper sales reconciliation ($ millions) | ||||
| Copper sales related to cash portion of Royal Gold stream | 1.7 | 1.0 | 6.2 | 5.2 |
| Mark-to-market adjustments on Royal Gold stream | 0.4 | (0.6) | 2.1 | (0.9) |
| Final adjustments on sales to Royal Gold | (1.3) | (0.2) | (3.5) | (0.1) |
| Total copper sales under Royal Gold stream | 0.8 | 0.2 | 4.8 | 4.2 |
| Copper sales to third party customers | 49.1 | 30.0 | 179.6 | 147.0 |
| Mark-to-market adjustments | 3.2 | 5.4 | 5.4 | 8.1 |
| Final pricing adjustments | 3.5 | 1.1 | 6.8 | 0.6 |
| Final metal adjustments | (0.2) | (1.0) | (2.8) | (2.0) |
| Total copper sales to third party customers | 55.6 | 35.5 | 189.0 | 153.7 |
| Copper sales, net of adjustments | 56.4 | 35.7 | 193.8 | 157.9 |
| Refining and treatment costs | (3.4) | (3.8) | (15.2) | (17.1) |
| Copper sales | 53.0 | 31.9 | 178.6 | 140.8 |
| Pounds of copper sold (000's lbs) | ||||
| Pounds sold to Royal Gold | 3,563 | 2,684 | 15,124 | 12,682 |
| Pounds sold to third party customers | 15,412 | 11,617 | 65,353 | 54,748 |
| Total pounds sold | 18,975 | 14,301 | 80,477 | 67,430 |
| Average realized sales price for copper on a per pound basis | ||||
| Copper sales related to cash portion of Royal Gold stream | 0.48 | 0.38 | 0.41 | 0.41 |
| Mark-to-market adjustments on Royal Gold stream | 0.11 | (0.21) | 0.14 | (0.07) |
| Final pricing adjustments on Royal Gold stream | (0.37) | (0.07) | (0.23) | (0.01) |
| Average realized copper price - Royal Gold | 0.22 | 0.10 | 0.32 | 0.33 |
| Average realized copper price - Third party | 3.19 | 2.58 | 2.75 | 2.68 |
| Average realized copper price - Mark-to-market adjustments | 0.21 | 0.45 | 0.08 | 0.15 |
| Average realized copper price - Final pricing adjustments | 0.23 | 0.10 | 0.10 | 0.01 |
| Average realized copper price - Metal pricing adjustments | (0.01) | (0.09) | (0.04) | (0.04) |
| Average realized copper price - Third party | 3.62 | 3.04 | 2.89 | 2.80 |
| Average realized copper price - Combined | 2.79 | 2.23 | 2.22 | 2.09 |
Qualified Person & QA/QC – Production, Mineral Reserves and Mineral Resources
The production information and other scientific and technical information presented in this document, including the production estimates were prepared in accordance with the standards of the Canadian Institute of Mining, Metallurgy and Petroleum and NI 43-101 and were prepared, reviewed, verified, and compiled by Centerra’s geological and mining staff under the supervision of Slobodan (Bob) Jankovic, Professional Geoscientist, member of the Association of Professional Geoscientists of Ontario (APGO) and Centerra’s Senior Director, Technical Services, who is a qualified person for the purpose of NI 43-101. Unless otherwise noted below, sample preparation, analytical techniques, laboratories used and quality assurance-quality control protocols used during the exploration drilling programs are done consistent with industry standards and independent certified assay labs are used.
The Kumtor deposit is described in a NI 43-101 technical report dated February 24, 2021 and filed on SEDAR at www.sedar.com. The technical report describes the exploration history, geology, and style of gold mineralization at the Kumtor deposit. Sample preparation, analytical techniques, laboratories used, and quality assurance-quality control protocols used are described in the technical report.
The Mount Milligan deposit is described in a NI 43-101 technical report dated March 26, 2020 and filed on SEDAR at www.sedar.com. The technical report describes the exploration history, geology, and style of gold mineralization at the Mount Milligan deposit. Sample preparation, analytical techniques, laboratories used, and quality assurance-quality control protocols used during the exploration drilling programs are done consistent with industry standards and independent certified assay labs.
The Öksüt deposit is described in a NI 43-101 technical report dated September 3, 2015 and filed on SEDAR at www.sedar.com. The technical report describes the exploration history, geology, and style of gold mineralization at the Öksüt deposit. Sample preparation, analytical techniques, laboratories used, and quality assurance-quality control protocols used during the exploration drilling programs are done consistent with industry standards and independent certified assay labs.
Mineral Reserves and Mineral Resources
On February 24, 2021, the Company released the results of the updated mineral reserve and mineral resource estimates for the Kumtor Mine, the Mount Milligan Mine, the Öksüt Mine, and the Kemess Property, all as of December 31, 2020. The 2020 mineral reserves and resources estimate excludes the Greenstone property (Hardrock), the sale of which was announced December 15, 2020. For additional details, please see the news release “Centerra Gold 2020 Year-End Mineral Reserves and Resources, Kumtor Technical Report and Fourth Quarter Exploration Update” filed on SEDAR and posted on the Company’s website on February 24, 2021.
Mount Milligan’s mineral reserves and mineral resources are presented on a 100% basis. Sales of gold and copper from the Mount Milligan Mine are subject to the Mount Milligan Streaming Arrangement whereby Royal Gold is entitled to 35% and 18.75% of gold and copper sales respectively. Under this streaming arrangement, Royal Gold pays Centerra $435 per ounce of gold delivered and 15% of the spot price per metric tonne of copper delivered.
Total gold mineral reserves and resources
| Gold (000s attributable ounces contained) (1)(4) | 2020 | 2019 | |
| Total proven and probable mineral reserves | 11,166 | 11,086 | |
| Total measured and indicated mineral resources (2) | 7,948 | 13,347 | |
| Total inferred mineral resources(2)(3) | 5,379 | 6,722 |
| (1) | Centerra’s equity interests as at December 31, 2020, are as follows: Mount Milligan 100%, Kumtor 100%, Öksüt 100% and Kemess Underground and Kemess East 100%. The mineral reserves and mineral resources above reflect Centerra's equity interests in the applicable properties. |
| (2) | Mineral resources are in addition to mineral reserves. Mineral resources do not have demonstrated economic viability. |
| (3) | Inferred mineral resources have a great amount of uncertainty as to their existence and as to whether they can be mined economically. It cannot be assumed that all or part of the inferred mineral resources will ever be upgraded to a higher category. |
| (4) | Production at Mount Milligan is subject to a streaming agreement which entitles Royal Gold to 35% of gold sales from the Mount Milligan Mine. Under the stream arrangement, Royal Gold will pay $435 per ounce of gold delivered. Mineral resources for the Mount Milligan property are presented on a 100% basis. |
Total copper mineral reserves and resources
| Copper (million pounds contained) (1)(4) | 2020 | 2019 | |
| Total proven and probable mineral reserves | 1,467 | 1,589 | |
| Total measured and indicated mineral resources (2) | 5,329 | 5,327 | |
| Total inferred mineral resources(2)(3) | 520 | 502 |
| (1) | Centerra’s equity interests as at December 31, 2020, are as follows: Mount Milligan 100%, Kemess Underground 100%, Kemess East 100% and Berg 100%. |
| (2) | Mineral resources are in addition to mineral reserves. Mineral resources do not have demonstrated economic viability. |
| (3) | Inferred mineral resources have a great amount of uncertainty as to their existence and as to whether they can be mined economically. It cannot be assumed that all or part of the inferred mineral resources will ever be upgraded to a higher category. |
| (4) | Production at Mount Milligan is subject to a streaming agreement which entitles Royal Gold to 18.75% of copper sales from the Mount Milligan mine. Under the stream arrangement, Royal Gold will pay 15% of the spot price per metric tonne of copper delivered. Mineral resources for the Mount Milligan property are presented on a 100% basis. |
Total molybdenum mineral reserves and resources
| Molybdenum (million pounds contained) (1)(3)(4) | 2020 | 2019 | |
| Total proven and probable mineral reserves | - | - | |
| Total measured and indicated mineral resources(2) | 636 | 636 | |
| Total inferred mineral resources(3) | 50 | 50 |
| (1) | Centerra’s equity interests are Berg 100%, Thompson Creek 100%, and Endako 75%. |
| (2) | Mineral resources are in addition to mineral reserves. Mineral resources do not have demonstrated economic viability. |
| (3) | Inferred mineral resources have a great amount of uncertainty as to their existence and as to whether they can be mined economically. It cannot be assumed that all or part of the inferred mineral resources will ever be upgraded to a higher category. |
| (4) | Molybdenum mineral resources at Berg, Thompson Creek and Endako were estimated using a molybdenum price of $14.00 per pound. The exchange rate used at Berg and Endako was 1USD:1.25CAD |
Material assumptions used to determine mineral reserves and mineral resources are as follows:
| 2020 | 2019 | ||
| Gold price | |||
| Gold mineral reserves ($/oz) | 1,250-1,350 | 1,250 | |
| Gold mineral resources ($/oz) | 1,500-1,550 | 1,500 | |
| Copper price | |||
| Copper mineral reserves ($/lb) | 3.00 | 3.00 | |
| Copper mineral resources ($/lb) | 3.50 | 3.50 | |
| Foreign exchange rates | |||
| 1 USD : Cdn dollar | 1.25 | 1.25 | |
| 1 USD : Kyrgyz som | 70 | 65 | |
| 1 USD : Turkish Lira | 5.50 | 5.50 | |
| Centerra Gold Inc. | |||||||
| Consolidated Statements of Financial Position | |||||||
| December 31, | December 31, | ||||||
| 2020 | 2019 | ||||||
| (Expressed in thousands of United States Dollars) | |||||||
| Assets | |||||||
| Current assets | |||||||
| Cash and cash equivalents | $ | 545,180 | $ | 42,717 | |||
| Amounts receivable | 66,108 | 79,022 | |||||
| Inventories | 580,587 | 774,060 | |||||
| Assets held-for-sale | 140,005 | - | |||||
| Other current assets | 40,961 | 36,869 | |||||
| 1,372,841 | 932,668 | ||||||
| Property, plant and equipment | 1,686,067 | 1,669,516 | |||||
| Reclamation deposits | 47,083 | 40,999 | |||||
| Other assets | 30,018 | 58,470 | |||||
| 1,763,168 | 1,768,985 | ||||||
| Total assets | $ | 3,136,009 | $ | 2,701,653 | |||
| Liabilities and Shareholders' equity | |||||||
| Current liabilities | |||||||
| Accounts payable and accrued liabilities | $ | 232,704 | $ | 238,339 | |||
| Revenue-based tax payable | 5,073 | 744 | |||||
| Income tax payable | 2,474 | 1,034 | |||||
| Liabilities held-for-sale | 2,255 | - | |||||
| Other current liabilities | 15,322 | 4,692 | |||||
| 257,828 | 244,809 | ||||||
| Long-term debt | - | 70,007 | |||||
| Deferred income tax liability | 39,473 | 33,733 | |||||
| Provision for reclamation | 351,149 | 265,049 | |||||
| Other liabilities | 21,541 | 22,211 | |||||
| 412,163 | 391,000 | ||||||
| Shareholders' equity | |||||||
| Share capital | 975,122 | 960,404 | |||||
| Contributed surplus | 30,601 | 26,278 | |||||
| Accumulated other comprehensive income (loss) | 11,600 | (752) | |||||
| Retained earnings | 1,448,695 | 1,079,914 | |||||
| 2,466,018 | 2,065,844 | ||||||
| Total liabilities and Shareholders' equity | $ | 3,136,009 | $ | 2,701,653 | |||
| Centerra Gold Inc. | |||||||||||||
| Consolidated Statements of Earnings (Loss) and Comprehensive Income (Loss) | |||||||||||||
| Three months ended December 31, | Twelve months ended December 31, | ||||||||||||
| 2020 | 2019 | 2020 | 2019 | ||||||||||
| (Expressed in thousands of United States Dollars) | |||||||||||||
| (except per share amounts) | |||||||||||||
| Revenue | $ | 386,811 | $ | 312,503 | $ | 1,688,675 | $ | 1,375,328 | |||||
| Cost of sales | |||||||||||||
| Production costs | 138,256 | 149,431 | 590,624 | 676,632 | |||||||||
| Depreciation, depletion and amortization | 65,117 | 59,279 | 305,286 | 239,511 | |||||||||
| Standby costs | - | 9,100 | 6,728 | 9,100 | |||||||||
| Earnings from mine operations | 183,438 | 94,693 | 786,037 | 450,085 | |||||||||
| Revenue-based taxes | 25,154 | 28,262 | 138,493 | 116,417 | |||||||||
| Exploration and development costs | 14,673 | 14,599 | 47,442 | 45,958 | |||||||||
| Corporate administration | 17,350 | 9,155 | 45,674 | 45,265 | |||||||||
| Care and maintenance expense | 7,385 | 8,421 | 29,117 | 28,529 | |||||||||
| Impairment | - | - | - | 230,500 | |||||||||
| Other operating expenses | 15,170 | 44,260 | 87,095 | 69,113 | |||||||||
| Earnings (loss) from operations | 103,706 | (10,004) | 438,216 | (85,697) | |||||||||
| Other expense (income), net | 103 | 421 | 7,028 | (1,450) | |||||||||
| Finance costs | 5,487 | 5,260 | 14,941 | 16,337 | |||||||||
| Earnings (loss) before income tax | 98,116 | (15,685) | 416,247 | (100,584) | |||||||||
| Income tax expense (recovery) | 2,905 | (3,453) | 7,709 | (7,071) | |||||||||
| Net earnings (loss) | $ | 95,211 | $ | (12,232) | $ | 408,538 | $ | (93,513) | |||||
| Other Comprehensive Income (Loss) | |||||||||||||
| Items that may be subsequently reclassified to earnings: | |||||||||||||
| Net gain on translation of foreign operation | $ | 1,715 | $ | 701 | $ | 839 | $ | 1,753 | |||||
| Net unrealized gain (loss) on derivative instruments | 8,339 | 37 | 11,513 | (395) | |||||||||
| Post-retirement benefit | - | (22) | - | (22) | |||||||||
| Other comprehensive income ("OCI") | 10,054 | 716 | 12,352 | 1,336 | |||||||||
| Total comprehensive income (loss) | $ | 105,265 | $ | (11,516) | $ | 420,890 | $ | (92,177) | |||||
| Basic earnings (loss) per share | $ | 0.32 | $ | (0.04) | $ | 1.39 | $ | (0.32) | |||||
| Diluted earnings (loss) per share | $ | 0.32 | $ | (0.04) | $ | 1.37 | $ | (0.32) | |||||
| Centerra Gold Inc. | |||||||||||||
| Consolidated Statements of Cash Flows | |||||||||||||
| Three months ended December 31, | Twelve months ended December 31, | ||||||||||||
| 2020 | 2019 | 2020 | 2019 | ||||||||||
| (Expressed in thousands of United States Dollars) | |||||||||||||
| Operating activities | |||||||||||||
| Earnings (loss) from operations | $ | 95,211 | $ | (12,233) | $ | 408,538 | $ | (93,513) | |||||
| Adjustments for the following items: | |||||||||||||
| Depreciation, depletion and amortization | 65,011 | 61,123 | 314,947 | 245,746 | |||||||||
| Finance costs | 5,487 | 4,326 | 14,941 | 16,337 | |||||||||
| Share-based compensation expense | 8,542 | 1,333 | 20,348 | 19,773 | |||||||||
| Reclamation expense | 9,216 | 34,288 | 53,135 | 34,439 | |||||||||
| Asset impairment | - | - | - | 230,500 | |||||||||
| Other | 4,299 | 4,212 | 40,747 | (54,819) | |||||||||
| Cash provided by operations before changes in working capital | 187,766 | 93,049 | 852,656 | 398,463 | |||||||||
| Changes in working capital | (5,800) | (504) | 77,359 | (64,314) | |||||||||
| Cash provided by operations | 181,966 | 92,545 | 930,015 | 334,149 | |||||||||
| Investing activities | |||||||||||||
| Property, plant and equipment additions | (105,181) | (92,908) | (326,240) | (299,443) | |||||||||
| (Increase) decrease in restricted cash | (8) | 587 | 25,246 | (481) | |||||||||
| (Increase) decrease in other assets | (186) | 183 | (2,382) | (9,725) | |||||||||
| Cash used in investing | (105,375) | (92,138) | (303,376) | (309,649) | |||||||||
| Financing activities | |||||||||||||
| Debt drawdown | - | 95,932 | 250,000 | 302,804 | |||||||||
| Debt repayment | - | (121,986) | (327,472) | (417,986) | |||||||||
| Payment of borrowing costs | (2,653) | (1,895) | (8,515) | (9,293) | |||||||||
| Lease payments | (1,601) | (10,949) | (6,037) | (16,962) | |||||||||
| Proceeds from common shares issued | 332 | 721 | 7,793 | 7,949 | |||||||||
| Dividends declared and paid | (11,487) | - | (39,757) | - | |||||||||
| Cash used in financing | (15,409) | (38,177) | (123,988) | (133,488) | |||||||||
| Increase (decrease) in cash during the year | 61,182 | (37,770) | 502,651 | (108,988) | |||||||||
| Cash at beginning of the year | 484,186 | 80,487 | 42,717 | 151,705 | |||||||||
| Reclassified to assets held-for-sale | (188) | - | (188) | - | |||||||||
| Cash at end of the year | $ | 545,180 | $ | 42,717 | $ | 545,180 | $ | 42,717 | |||||
The Audited Consolidated Financial Statements and Notes for the twelve months ended December 31, 2020 and Management’s Discussion and Analysis for the period ended December 31, 2020 have been filed on the System for Electronic Document Analysis and Retrieval (‘SEDAR’) at www.sedar.com and are available at the Company’s web site at: www.centerragold.com. The Interim Consolidated Financial Statements for the three months ended December 31, 2020 are unaudited.