
Form 10-K IMPINJ INC For: Dec 31
UNITED STATES
SECURITIES AND EXCHANGE COMMISSION
Washington, D.C. 20549
FORM
|
|
ANNUAL REPORT PURSUANT TO SECTION 13 OR 15(d) OF THE SECURITIES EXCHANGE ACT OF 1934 |
For the fiscal year ended
OR
|
|
TRANSITION REPORT PURSUANT TO SECTION 13 OR 15(d) OF THE SECURITIES EXCHANGE ACT OF 1934 |
Commission File Number
(Exact name of registrant as specified in its charter)
|
|
|
|
(State or other jurisdiction of incorporation or organization) |
(I.R.S. Employer Identification No.) |
|
|
|
|
(Address of principal executive offices) |
(Zip Code) |
Registrant’s telephone number, including area code: (
Securities registered pursuant to Section 12(b) of the Act:
|
(Title of each class) |
(Trading Symbol) |
(Name of each exchange on which registered) |
Securities registered pursuant to Section 12(g) of the Act:
None
Indicate by check mark if the registrant is a well-known seasoned issuer, as defined in Rule 405 of the Securities Act. Yes ☐
Indicate by check mark if the registrant is not required to file reports pursuant to Section 13 or 15(d) of the Act. Yes ☐
Indicate by check mark whether the registrant (1) has filed all reports required to be filed by Section 13 or 15(d) of the Securities Exchange Act of 1934 during the preceding 12 months (or for such shorter period that the registrant was required to file such reports), and (2) has been subject to such filing requirements for the past 90 days.
Indicate by check mark whether the registrant has submitted electronically every Interactive Data File required to be submitted pursuant to Rule 405 of Regulation S-T (§ 232.405 of this chapter) during the preceding 12 months (or for such shorter period that the registrant was required to submit such files).
Indicate by check mark whether the registrant is a large accelerated filer, an accelerated filer, a non-accelerated filer, a smaller reporting company, or an emerging growth company. See the definitions of “large accelerated filer,” “accelerated filer,” “smaller reporting company,” and "emerging growth company" in Rule 12b-2 of the Exchange Act.
|
Large accelerated filer |
|
☐ |
|
|
|
☑ |
|
Non-accelerated filer |
|
☐ |
|
Smaller reporting company |
|
|
|
Emerging growth company |
|
|
|
|
|
|
If an emerging growth company, indicate by check mark if the registrant has elected not to use the extended transition period for complying with any new or revised financial accounting standards provided pursuant to Section 13(a) of the Exchange Act.
Indicate by check mark whether the registrant has filed a report on and attestation to its management’s assessment of the effectiveness of its internal control over financing reporting under Section 404(b) of the Sarbanes-Oxley Act (15 U.S.C. 7262(b)) by the registered public accounting firm that prepared or issued its audit report.
Indicate by check mark whether the registrant is a shell company (as defined in Rule 12b-2 of the Act). Yes
As of June 30, 2020, the last business day of the Registrant’s most recently completed second fiscal quarter, the aggregate market value of the Registrant’s common stock held by non-affiliates based upon the closing price of such shares on The Nasdaq Global Market on such date was $
As of February 5, 2021,
DOCUMENTS INCORPORATED BY REFERENCE
The information required by Part III of this report, to the extent not set forth herein, is incorporated in this report by reference to the registrant’s definitive proxy statement relating to its 2021 annual meeting of stockholders. The definitive proxy statement will be filed with the Securities and Exchange Commission within 120 days of the registrant’s fiscal year ended December 31, 2020.
Table of Contents
|
|
|
Page |
|
|
4 |
|
|
PART I |
|
|
|
Item 1. |
5 |
|
|
Item 1A. |
12 |
|
|
Item 1B. |
36 |
|
|
Item 2. |
36 |
|
|
Item 3. |
37 |
|
|
Item 4. |
37 |
|
|
|
|
|
|
PART II |
|
|
|
Item 5. |
38 |
|
|
Item 6. |
40 |
|
|
Item 7. |
Management’s Discussion and Analysis of Financial Condition and Results of Operations |
41 |
|
Item 7A. |
57 |
|
|
Item 8. |
58 |
|
|
Item 9. |
Changes in and Disagreements With Accountants on Accounting and Financial Disclosure |
90 |
|
Item 9A. |
90 |
|
|
Item 9B. |
90 |
|
|
|
|
|
|
PART III |
|
|
|
Item 10. |
91 |
|
|
Item 11. |
91 |
|
|
Item 12. |
Security Ownership of Certain Beneficial Owners and Management and Related Stockholder Matters |
91 |
|
Item 13. |
Certain Relationships and Related Transactions, and Director Independence |
91 |
|
Item 14. |
91 |
|
|
|
|
|
|
PART IV |
|
|
|
Item 15. |
92 |
|
|
Item 16. |
95 |
As used in this report, the terms “Impinj,” “the Company,” “we,” “us” and “our” refer to Impinj, Inc., unless the context indicates otherwise.
Risk Factors Summary
Our business is subject to numerous risks and uncertainties, including those highlighted in the section of this report captioned “Risk Factors.” These risks include the following:
|
|
• |
if RAIN market adoption does not continue to develop, or develops slower than we expect, or if RAIN adoption by retailers does not continue at the rate we expect, our business will suffer; |
|
|
• |
our market is very competitive, and if we fail to compete successfully, our business and operating results will suffer; |
|
|
• |
an inability or limited ability of enterprise systems to exploit RAIN information may adversely affect the market for our products; |
|
|
• |
if end users or our direct customers fail to design our products into their products and systems, our operating results and prospects will be adversely affected; |
|
|
• |
alternative technologies or standards, or changes in existing technologies or standards, may adversely affect RAIN market growth and our business; |
|
|
• |
we obtain products we sell through third parties who operate outside of United States and with whom we do not have long-term supply contracts, and if we are unable to effectively manage our relationships with suppliers our operating results and financial condition would be adversely affected; |
|
|
• |
we are vulnerable to silicon wafer shortages, which may adversely affect our ability to meet demand for our products; |
|
|
• |
Our products must meet demanding technical and quality specifications and failure of our products to operate as expected could have an adverse effect on our operating results; |
|
|
• |
Covid-19 has adversely affected our business, and the magnitude and duration of future Covid-19 effects on our business are uncertain; |
|
|
• |
we rely on a small number of customers for a large share of our revenues; |
|
|
• |
because we sell and fulfill through channel partners, our ability to affect or determine end-user demand is limited; |
|
|
• |
our growth strategy depends in part on the success of strategic relationships with third parties and their continued performance and alignment; |
|
|
• |
if we are unable to protect our intellectual property, then our business could be adversely affected; |
|
|
• |
we may become party to intellectual property disputes, which could be time consuming, costly to prosecute, defend or settle, result in the loss of significant rights, and adversely affect RAIN adoption generally; |
|
|
• |
we have a history of losses and have only achieved profitability intermittently, and we cannot be certain that we will attain or sustain profitability in the future; |
|
|
• |
we have a history of significant fluctuations in our quarterly and annual operating results; |
|
|
• |
servicing $86.3 million aggregate principal amount 2.00% convertible senior notes due 2026, or the 2019 Notes, may require a significant amount of cash, and we may not have sufficient cash flow or the ability to raise the funds necessary to satisfy our obligations under the 2019 Notes, and our current and future indebtedness may limit our operating flexibility or otherwise affect our business; and |
|
|
• |
our executive officers, directors, principal stockholders, together with their affiliates, beneficially owned approximately 35.6% of our outstanding common stock as of December 31, 2020, and as a result are able to exercise significant influence over matters subject to stockholder approval. |
3
NOTE REGARDING FORWARD-LOOKING STATEMENTS
This report contains certain forward-looking statements within the meaning of Section 27A of the Securities Act of 1933, as amended, and Section 21E of the Securities Exchange Act of 1934, as amended. Statements containing words such as “may,” “believe,” “anticipate,” “expect,” “intend,” “plan,” “project,” “projections,” “business outlook,” “estimate,” or similar expressions constitute forward-looking statements. You should read these statements carefully because they discuss future expectations, contain projections of future results of operations or financial condition or state other “forward-looking” information. These statements relate to our future plans, objectives, expectations, intentions and financial performance and the assumptions that underlie these statements. They include, but are not limited to, statements about:
|
|
• |
our market opportunity; the adoption of RAIN RFID technology and solutions; our ability to compete effectively against competitors and competing technologies; and our market share and technology leadership; and the implementation of our business model, strategic plans and product development plans; |
|
|
• |
the impact of Covid-19, including on macroeconomic conditions and our business, results and operations and financial condition; |
|
|
• |
our future financial performance, including our average selling prices and gross margins; and the dependency of our future financial performance on future macroeconomic conditions; |
|
|
• |
the performance of third parties on which we rely for product development, manufacturing, assembly and testing; and our relationship with other third parties on which we rely for product distribution, sales integration and deployment; |
|
|
• |
our ability to adequately protect our intellectual property; |
|
|
• |
the regulatory regime for our products and services; and |
|
|
• |
our leadership of standards-setting processes. |
Our actual results may differ materially from those contained in or implied by any forward-looking statements. Factors that could cause or contribute to these differences include those discussed below and elsewhere in this report, including those factors discussed in Part I, Item 1A (Risk Factors).
In light of the significant uncertainties and risks inherent in these forward-looking statements, you should not regard these statements as a representation or warranty by us or anyone else that we will achieve our objectives and plans in any specified time frame, or at all, or as predictions of future events. Moreover, neither we nor any other person assumes responsibility for the accuracy and completeness of the forward-looking statements. We undertake no obligation to publicly update any forward-looking statements, whether as a result of new information, future events or otherwise, except as required by law.
4
PART I
Item 1. Business
Overview
Our vision is a boundless Internet of Things, or IoT. We are driving a future in which everyday physical items are wirelessly connected to digital counterparts, or digital twins, in the cloud, and in which businesses and people access information about an item from its digital twin. Our mission is to connect every thing. We deliver a platform that powers item-to-cloud connectivity, and on which enterprise solution providers innovate IoT whole products.
Today, we deliver the identity, location and authenticity of billions of physical items. We believe our future is extending that delivery to trillions of physical items and enabling ubiquitous access to cloud-based digital twins of those items, each storing an item’s ownership, history and links. We believe the item-to-cloud connectivity that our platform will deliver will enhance businesses efficiencies and commerce and, ultimately, improve peoples’ lives.
Impinj Platform
Our platform, which comprises multiple product families, wirelessly connects individual items and delivers data about the connected items to business and consumer applications enabled by our partner network. We link the products within our platform to deliver capabilities and performance that surpasses mix-and-match solutions built from competitor products.
We and our partners connect the items via a miniature radio chip embedded in the item or in its packaging, reading and delivering each item’s identity, location and authenticity. To date, we have enabled connectivity to nearly 50 billion items, enabling businesses and consumers to derive timely information from those connected items.
Our platform uses RAIN, a type of radio-frequency identification, or RFID, technology we pioneered. We spearheaded development of the RAIN radio standard, lobbied governments to allocate frequency spectrum and cofounded the RAIN Alliance that today has more than 160 member companies. Our industry uses free spectrum in 78 countries encompassing roughly 96.5% of the world’s GDP and has connected many tens of billions of items to date. We believe RAIN’s capabilities – in particular, endpoint ICs with serialized identifiers, 30-foot range reading up to 1000 items per second without line-of-sight, radio-frequency energy harvesting for battery-free operation, essentially unlimited life and, in the future, cryptographic item authentication – position RAIN to be the leading item-to-cloud connectivity technology for the IoT.
RAIN market adoption has historically been slower than anticipated or forecasted by us and industry sources. For additional information related to RAIN market adoption, please see the section of this report captioned “Risk Factors.”
Endpoint ICs
Our endpoint IC product family comprises miniature radios-on-a-chip that can wirelessly connect almost any item yet sell for pennies. Each IC attaches to a host item and includes a number to identify the item. The IC may also include or enable features such as user data storage, security, authentication, loss prevention, privacy protection and value-added Impinj custom capabilities, all accessible by our platform.
Our original equipment manufacturing, or OEM, partners typically attach each endpoint IC to a thin printed or etched antenna on a paper or Mylar backing, then cover the composite inlay with a paper face to form a tag. End users attach the tags to items in markets including retail, supply chain and logistics, healthcare, automotive, sports, industrial and manufacturing, consumer experience, food, datacenter, travel and banking. In some more-recent applications, rather than attaching a tag to an item, end users may instead embed the inlay directly into the item, for example by sewing an inlay into a garment’s care label. Regardless of the method by which our partners embed an endpoint IC into a host item, we refer to an IC and its host item as an endpoint.
5
When a consumer purchases a retail item, a store or supplier typically procures another item to sell, including another endpoint IC. We believe endpoint ICs are the first market for consumable silicon and are a recurring revenue source for us.
Systems
Our systems product family comprises reader ICs, readers and gateways that wirelessly provide power to, and communicate bidirectionally with, endpoint ICs on host items. They also read, write, authenticate and engage the endpoint ICs on those items. Our systems products include software and algorithms that enable our partners to deliver use cases such as retail self-checkout and loss prevention, and warehouse pallet and carton tracking, to end users worldwide.
Our reader IC product family comprises multiple products, tiered by performance and functionality, that our reader IC partners use in their readers. We offer easy-to-use APIs, development environments, sample code, drivers and libraries to facilitate partner reader development. We also leverage developments in our reader and gateway software to enhance our reader IC firmware. We sell our reader ICs to OEM and original design manufacturing, or ODM, partners that use them in mobile or handheld readers, fixed readers, gateways, RAIN-enabled appliances and other intelligent edge devices. We sell our reader ICs for tens of dollars.
Our reader product family comprises multiple finished products, tiered by performance and functionality. Our gateway product family integrates our readers with beamforming antennas to electrically steer a radio beam like a radar, locating and tracking items in one dimension or two. Our partners can use our readers and gateways to enable end-user solutions. Our readers and gateways are easy to deploy and use, can be powered via power-over-Ethernet, or PoE, and are certified for operation in more than 40 countries.
Our software and algorithms run either entirely on our readers and gateways or partly on them and partly on partner devices. We are currently focused on developing software and algorithms to enable retail use cases (such as self-checkout and loss prevention), and on supply chain and logistics use cases (such as pallet tracking in dock doors and package sortation on conveyors). Our easy-to-use APIs enable our partners to transform item data into actionable information, enabling analytics and insights about the items that businesses manufacture, transport and sell. Our APIs also help our partners deliver enterprise-grade systems management and control. We sell our readers and gateways through distributors, system integrators, or SIs, value-added resellers, or VARs, and solution providers. We sell our readers sell for hundreds of dollars and our gateways for thousands of dollars.
Industry Use Cases
The following use cases are representative of actual RAIN deployments we serve today.
Retail
Retailers, both traditional “brick-and-mortar” and online, consume billions of RAIN tags each year to obtain real-time data about products they manufacture, transport and sell. Today, most of retail products with RAIN tags are apparel and footwear, but retailers are extending RAIN usage to cosmetics, home good, sporting items and even food. Retailers can obtain the following benefits by using our platform:
|
|
• |
In-store Inventory Visibility. Our platform delivers accurate and timely data about a retailer’s inventory. Accurate inventory data can reduce overstocks, understocks and searching, thereby allowing retailers to both reduce costly inventory and increase same-store sales by ensuring each store is properly stocked and by enabling staff to focus on customers rather than on inventorying or searching for items. |
|
|
• |
Omnichannel Fulfillment. The cornerstone of a successful omnichannel operation is real-time inventory visibility in stores, warehouses and fulfillment centers. The visibility our platform delivers can help or enable retailers ship directly from those stores, warehouses and fulfillment centers as well as allow consumers to buy online and pickup in store. It can also help retailers sell to any customer from any retail location, confidently sell down to the last item and facilitate seamless returns. |
6
|
|
• |
Self-checkout and Loss Prevention. Consumer self-checkout is a clear opportunity for retailers looking to modernize their in-store experience. However, self-checkout requires effective loss prevention. Our platform can enable both – self-checkout via kiosks that read endpoint ICs on items and loss-prevention systems that scan RAIN tags for unsold items leaving the store. As our inlay partners focus on embedding RAIN tags directly into retail items, we focus on key innovations like our patented Protected Mode that allows a tag to require a PIN for post point-of-sale readability, enabling loss-prevention systems to focus on unsold items while satisfying General Data Protection Regulation, or GDPR, and similar privacy requirements. |
Supply Chain and Logistics
The supply chain and logistics, or SC&L, industry includes shipping companies, third-party logistics providers, postal organizations, captive distribution operations and other organizations transporting national and international trade. These organizations are increasingly demanding real-time shipment data to virtualize, analyze and optimize their operations. SC&L companies can obtain these benefits using our platform:
|
|
• |
Shipment Verification. Our platform provides real-time data about items passing through dock doors to the systems that run shipping and receiving, enabling SC&L companies to reduce mistakes, automate processes and drive operational efficiencies. |
|
|
• |
Conveyor Sortation. Our platform enables high-speed, real-time, not line-of-sight reading of packages moving along conveyors, improving automatic sortation accuracy and reducing costly shipping errors. |
|
|
• |
Returnable Transit Item, or RTI, Tracking. By tagging RTI containers that travel in and out of warehouses, our platform can reduce RTI loss and ensure SC&L companies have the RTI containers they need. |
|
|
• |
Asset Management. Our platform enables automated asset check-in/out procedures and location monitoring, reducing loss and improving efficiencies and maintenance-schedule compliance. |
Other Industries
These other industries can also obtain benefits using our platform:
|
|
• |
Aviation. Luggage tags that incorporate our endpoint ICs allow airlines to give passengers real-time location information for their checked bags as well as reduce lost bags. |
|
|
• |
Automotive. Car manufacturers use our platform to track and verify automotive parts for vehicle assembly, reducing mistakes and labor costs and improving operations. |
|
|
• |
Healthcare. Hospitals use our platform to track assets and manage patient and clinician workflows. Partner products built on our platform include RAIN-enabled medical cabinets and refrigerators. |
|
|
• |
Industrial and Manufacturing. Industrial companies track components to increase manufacturing productivity and reduce shipping errors. Manufacturers use our platform to track assets and tools, reducing errors and increasing calibration compliance. |
|
|
• |
Sports. Marathons and other foot races track runners via our endpoint ICs in race bibs. Golf venues score participants’ shots via our endpoint ICs inside golf balls. |
|
|
• |
Food. Coca-Cola uses our reader ICs for syrup-cartridge tracking and replenishment in its Freestyle soda fountains. |
|
|
• |
Datacenters. Datacenters use our platform for asset tracking. Electronics manufacturers embed our endpoint ICs into electronic devices for processor-secured storage. |
|
|
• |
Travel. Driver licenses in some states in the United States include our endpoint ICs to speed border crossings. Fueling stations use vehicle windshield tags to enable automatic and cashless fueling. |
|
|
• |
Banking. Banks use our endpoint ICs for money bundles and to track information-technology assets. |
7
|
|
• |
Linen and Uniform Tracking. Laundry providers embed washable tags into their linens and uniforms for automated tracking. |
Competitive Advantages
We believe we can extend our leadership of the RAIN RFID market by leveraging our competitive strengths, including:
|
|
• |
Platform. Our platform integrates our products and enables enhanced functionalities in ways we believe surpasses mix-and-match solutions built from competitor components, improving overall RAIN system performance, capabilities, reliability and ease-of-use. |
|
|
• |
Market Leadership. We believe we have leading market share in endpoint ICs, reader ICs, fixed readers and gateways. We are also the only company with an integrated RAIN platform spanning those endpoint ICs, reader ICs, fixed readers and gateways. |
|
|
• |
Technology Leadership. Our RAIN focus has enabled us to regularly be first-to-market with innovative, high-performing and high-quality products. Our chief executive officer is a recognized industry thought leader, a director of the RAIN Alliance and previously was an editor for the RAIN radio standard. |
|
|
• |
Partner Ecosystem. Our worldwide partner ecosystem comprises hundreds of distributors, SIs, VARs, software solution partners and reader, inlay and tag ODMs and OEMs. That ecosystem gives us market reach, penetration and scale we believe few, if any, of our competitors enjoy. |
|
|
• |
Trusted Brand. We believe our industry leadership, name recognition and reputation for innovative, high-performing and high-quality products have significantly contributed to our leading market position. |
|
|
• |
Intellectual Property. We believe we have the leading RAIN patent portfolio. As of December 31, 2020, our portfolio included 287 issued and allowed U.S. patents, five issued and allowed international patents, 25 pending U.S. patent applications and two pending international patent applications. |
Growth Strategies
To further our mission of connecting every thing, we plan to focus on the following strategic areas:
|
|
• |
Drive RAIN Adoption: We will focus on repeatable whole products with top-tier partners, enhancing and expanding our product offerings and deepening our platform integration with those partners. |
|
|
• |
Invest in Our Platform: We will continue investing in our platform’s products, software and algorithms, use cases, differentiated capabilities and cost reductions. |
|
|
• |
Ubiquitous Reading: We will develop next-generation reader ICs to improve functionality, reduce costs and make Impinj-based partner readers ubiquitous. |
|
|
• |
Cloud Services: We will invest in cloud services that leverage differentiated features in our endpoint ICs to enhance our platform’s reach and breadth and enable new use cases and opportunities |
Sales and Marketing
We have a worldwide sales team with expertise in endpoint ICs, reader ICs, readers, gateways and solutions. We also have a global ecosystem of hundreds of partners. Our sales team enables end-user solutions through, with and alongside those partners, fulfilling through the partners primarily as follows:
|
|
• |
Endpoint ICs: Directly to inlay and tag OEMs. We typically negotiate pricing with these OEMs annually, with new pricing effective during the first quarter of the calendar year. |
|
|
• |
Reader ICs: Through distribution to handheld and fixed reader OEMs and ODMs. |
|
|
• |
Readers and gateways: To VARs and SIs through distributors. |
8
We aim to engender preference for our platform in all our sales engagements, encouraging our partners and end users to use and gain the full benefit of our entire platform. Our business development, product marketing, technical and systems engineers actively engage those partners and end users. Our solutions-marketing and business-development teams work with our ISVs to enable end-user awareness, joint solutions, joint go-to-market selling and sales enablement.
The following table presents total revenue concentration to Avery Dennison Corporation, or Avery Dennison, Arizon RFID Technology (Yangzhou) Co., LTD, or Arizon, and a North American logistics provider for the periods presented;
|
|
|
Year Ended December 31, |
|
|||||||||
|
|
|
2020 |
|
|
2019 |
|
|
2018 |
|
|||
|
Revenue: |
|
|
|
|
|
|
|
|
|
|
|
|
|
Avery Dennison(1) |
|
|
32 |
% |
|
|
31 |
% |
|
|
39 |
% |
|
North American logistics provider |
|
* |
|
|
|
14 |
|
|
* |
|
||
|
Arizon |
|
|
10 |
|
|
* |
|
|
|
10 |
|
|
|
|
|
|
42 |
% |
|
|
45 |
% |
|
|
49 |
% |
|
* Less than 10% |
|
|
|
|
|
|
|
|
|
|
|
|
|
(1) Includes concentration of revenue related to Smartrac NV, or Smartrac. In March 2020, Avery Dennison completed an acquisition of Smartrac. |
|
|
|
|
|
|||||||
Avery Dennison and Arizon purchase our endpoint ICs for their inlay and tag products. In 2019, we generated 14% of total revenue from a North American logistics provider in connection with a project-based gateway deployment.
Manufacturing
We outsource all our product manufacturing to third-party manufacturers that build our products to our specifications. This capital-efficient operating model scales efficiently with volume, allowing us to focus our resources on accelerating development of new products and solutions.
Taiwan Semiconductor Manufacturing Company Limited, or TSMC, fabricates our endpoint IC wafers in Asia and the United States and has been our sole endpoint IC wafer supplier since 2003. We order endpoint IC wafers on a purchase-order basis and do not have a long-term agreement with TSMC. We test the wafers at our U.S. headquarters and in Asia. We use multiple subcontractors to post-process the wafers, with Stars Microelectronics (Thailand) Public Company Limited, or Stars, and Unisem Group, or Unisem, our primary subcontractors. We generally engage all our endpoint IC subcontractors on a purchase-order basis.
TowerJazz Ltd., or TowerJazz fabricates our reader IC wafers in the United States and has been our sole reader IC wafer supplier since 2008. We order reader IC wafers on a purchase-order basis and do not have a long-term agreement with TowerJazz. We test and package the ICs in Asia. We generally engage all our reader IC subcontractors on a purchase-order basis.
Plexus Corp., or Plexus, manufactures our readers and gateways in Asia since 2005. We order readers and gateways pursuant to non-exclusive purchase agreements that automatically renew each year, subject to each party’s right to terminate on 180 days’ notice. We use subcontractors on a purchase-order basis to assemble and test printed circuit boards, to build our reader and gateway enclosures and to test our readers and gateways.
Research and Development
We built our company around technology leadership, innovation and best-in-class products. Throughout our history we have committed, and we plan to continue committing, significant resources to technology, innovation and product development. We believe we have achieved our leading market position by continuously improving product performance, features, quality and reliability while reducing costs, and we plan to invest to continue doing so.
9
In most situations, we strive to lead the market with new products and innovations, but we sometimes adopt a more deliberate approach depending on the market situation. As one example, our nearest endpoint IC competitor migrated from 200mm wafers to 300mm wafers before we did. That migration caused the inlay OEMs to gradually retrofit their inlay manufacturing machines to handle 300mm wafers. In the meantime, we focused on an endpoint IC process-node migration, which we completed in 2020. Our first product in that process node, the Impinj M700, is not only on 300mm wafers, but today has roughly twice as many ICs per wafer as that competitor and entered the market with the inlay OEMs already able to process 300mm wafers.
We have a team of skilled engineers that today conduct all our research and most of our product development internally. As of December 31, 2020, we had 159 employees in research and development. We regularly review our technology, products and market development opportunities and reallocate our spending and resources accordingly.
Intellectual Property
We protect our technologies by filing patent applications, retaining trade secrets and defending and enforcing our intellectual property rights where appropriate. To date, our intellectual property portfolio includes 287 issued and allowed U.S. patents, five issued and allowed international patents, 25 pending U.S. patent applications and two pending international patent applications. The first of our 258 utility patents expire in 2022 and the first of our 29 design patents expire in 2021. To protect confidential information not otherwise subject to patent protection, we rely on trade secret law and enter into confidentiality agreements with our employees, customers, suppliers and partners.
Because most RAIN product SKUs are used in the United States, and because most of our partners, end users and competitors have U.S. operations, we believe U.S. patents hold the most value for our business. Consequently, we have primarily filed U.S. patent applications. Because our portfolio currently comprises mostly U.S. patents, we have limited ability to assert our intellectual property rights outside the United States.
Although our patents and trade secrets constitute valuable assets, we do not view any one of them as material. Instead, we believe the totality of our patent and trade-secret portfolio creates an advantage for our business.
We have entered into licensing, broad-scope cross licensing and other agreements authorizing us to use or to operate within the scope of patents and intellectual property owned by third parties. For example, we have licenses to third-party intellectual property that we use in our products. As another example, by participating in developing GS1 EPCglobal protocols, such as the RAIN radio protocol, we agreed to license those of our patents necessarily infringed by the practice of these protocols on a royalty-free basis to other GS1 EPCglobal members, subject to reciprocal royalty-free rights from those members. By participating in developing International Organization for Standardization, or ISO, standards, we agreed to grant to all users worldwide a license to those of our patents necessarily infringed by the practice of several ISO standards, including non-RAIN standards, on reasonable and nondiscriminatory terms, here again subject to reciprocity.
We own a number of trademarks and develop names for our new products and secure trademark protection for them, including domain name registration, in relevant jurisdictions.
Alliances and Standardization
Our platform connects everyday items using the RAIN RFID technology we pioneered. We spearheaded development of the RAIN radio standard, lobbied governments to allocate frequency spectrum and, along with Google, Intel and Smartrac N.V., cofounded the RAIN Alliance. Our chief executive officer is presently an Alliance Director and was previously the Alliance Chairman. The Alliance is a global organization promoting the universal adoption of RAIN technology and solutions, with more than 160 members as of December 31, 2020. Today, the RAIN industry has access to radio spectrum freely available in 78 countries encompassing roughly 96.5% of the world’s GDP and has connected many tens of billions of items. We believe RAIN’s core capabilities – serialized identifiers for individual items, battery-free operation, 30-foot range, not line-of-sight readability, up to 1,000 reads per second, low cost, essentially unlimited life and available cryptographic authentication – position RAIN to be the leading item-to-cloud connectivity technology for the IoT.
10
We, our end users, partners and competitors developed the RAIN radio protocol, whose technical name is EPC™ Radio-Frequency Identity Protocols Generation-2 UHF RFID (standardized as ISO/IEC 18000-63 and often known colloquially as Gen2) in 2004, with us as the editor. Our community delivered a backward-compatible update in 2013, again with us as the editor. Our industry uses the RAIN radio protocol nearly exclusively.
By participating in GS1 EPCglobal, which produced Gen2, and ISO, which ratified 18000-63, as well as in other standards bodies, we agreed to license certain patents as described in the section captioned “Intellectual Property.”
Government Regulations
Government regulations require us to certify our readers and gateways in jurisdictions where they operate. For example, we certify our readers and gateways to Federal Communications Commission regulations to operate in the United States and its territories. Our readers and gateways are certified for operation in more than 40 countries worldwide including the United States, Canada, Mexico, China, Japan, South Korea and all of the European Union.
Competition
Each of our competitors competes with some, but not all, of our products. Our primary competition includes:
|
|
• |
Endpoint ICs: NXP B.V., or NXP, and Alien Technology Corporation, or Alien. |
|
|
• |
Reader ICs: STMicroelectronics N.V., or ST, Phychips Inc, Zhikun Semiconductor Co. Ltd, or Iotelligent, and MagicRF. |
|
|
• |
Readers and Gateways: Alien, which also purchases our reader ICs, and Zebra Technologies Corporation, or Zebra. |
The market for RAIN, our platform and our products is highly competitive. New entrants can and do come into our market at any time, and we expect our competition to increase as the market and end-user adoption grow. The competitive factors that impact our platform and product sales include:
|
|
• |
portfolio, performance, features, lead times, reliability and price; |
|
|
• |
support, ease of use and availability of reference designs; |
|
|
• |
development tools and APIs (except in the endpoint IC market); |
|
|
• |
integration and certification with end-user applications; and |
|
|
• |
company reputation. |
Although we believe we compete favorably on the above factors, our future competitiveness will depend on our ability to design, develop and deliver compelling products and enable compelling end-user solutions.
We occasionally experience competitive pressures due to prevailing exchange rates as our product pricing is denominated in U.S. dollars. In addition, our competitive position depends on our ability to continue to attract and retain talent while protecting our intellectual property. For additional information on the risks associated with our business, see “Risk Factors.”
Employees and Culture
As of December 31, 2020, we had 310 employees. None of our employees are represented by a labor union, and we believe our employee relations are excellent.
Our corporate culture embodies a set of principles centered around respect, collaboration, accountability, empowerment and thinking big. We believe our principles and the culture that derives from them are essential to the health and success of our business. We focus on aligning our employees to those principles, promoting and fostering diversity, inclusion, passion and commitment.
11
Corporate Information
We were incorporated in Delaware in April 2000. Our principal executive office is located at 400 Fairview Avenue North, Suite 1200, Seattle, Washington 98109. Our telephone number is (206) 517-5300. Our website is www.impinj.com. Information contained in, or that can be accessed through, our website is not a part of, and is not incorporated into, this report.
Where You Can Find More Information
Our filings with the Securities and Exchange Commission, or SEC, including our annual reports on Form 10-K, quarterly reports on Form 10-Q, current reports on Form 8-K, and amendments to those reports, are available on our website at www.investor.impinj.com, free of charge, as soon as reasonably practicable after the electronic filing of these reports with the SEC. The information contained on our website is not a part of this report or any other document we file with the SEC.
Item 1A. Risk Factors
You should carefully consider the following risk factors, in addition to the other information contained in this report, including the section of this report captioned “Management’s Discussion and Analysis of Financial Condition and Results of Operations” and our financial statements and related notes. If any of the events described in the following risk factors and the risks described elsewhere in this report occur, our business, operating results and financial condition could be materially impacted. This report also contains forward-looking statements that involve risks and uncertainties. Our actual results could differ materially from those anticipated in the forward-looking statements as a result of factors that are described below and elsewhere in this report.
Risks Relating to Our Platform, Products and Technologies
The extent and pace of RAIN market adoption is uncertain. If RAIN market adoption does not continue to develop, or develops slower than we expect, our business will suffer.
The RAIN market is still developing. RAIN adoption, and adoption of our products and platform, depend on numerous factors, including:
|
|
• |
the extent to which end users understand and embrace the benefits that RAIN offers; |
|
|
• |
whether the benefits of RAIN adoption outweigh the cost and time to replace or modify end users’ existing systems and processes; and |
|
|
• |
whether RAIN products and applications meet end users’ current or anticipated needs. |
In the past, we have, at times, anticipated and forecasted a pace of end-user adoption that exceeded the actual pace. Additionally, adoption has not progressed evenly for many reasons, such as the project-based nature of many end-user deployments. We expect continued difficulty forecasting the pace of adoption. As a result, we may be unable to accurately forecast our future operating results, including revenue, gross margins, cash flows and profitability, any or all of which could negatively impact our financial performance.
RAIN adoption is concentrated in key industries, particularly retail. If retailer adoption does not continue at the rate we expect, our business will be adversely affected.
Our financial performance depends on the pace of end-user RAIN adoption in key industries such as retail, our largest market. Retailers with primarily a physical marketplace presence have experienced financial stress in recent periods. Many of these same retailers have deployed RAIN to improve their competitiveness. If they fail to compete effectively then the number of stores they maintain, and the scope of their RAIN deployments, may decrease. Other industries that we currently regard as being key for RAIN adoption include supply chain and logistics, aviation and automotive, many of which face similar stressors as the retail market.
12
Our market is very competitive. If we fail to compete successfully, our business and operating results will suffer.
We face significant competition from both established and emerging competitors. We believe our principal current competitors are: in endpoint ICs, NXP and Alien; in reader ICs, ST, Phychips, Iotelligent and MagicRF; in readers and gateways, Alien and Zebra. Our channel partners, including our OEMs, ODMs, distributors, SIs, VARs and software solution partners may choose to compete with us rather than purchase our products, which would not only reduce our customer base but also increase competition in the market, adversely affecting our operating results, business and prospects. Companies in adjacent markets or newly formed companies may decide to enter our market, particularly as RAIN adoption grows. Further, the Chinese government has made development of the Chinese semiconductor industry a priority, potentially increasing competition for us globally while possibly restricting our ability to participate in the Chinese market.
Competition for customers is intense. Because the RAIN market is evolving rapidly, winning customer and end-user accounts at an early stage in the development of the market is critical to growing our business. End users that instead use competing products and technologies may face high switching costs, which may affect our and our channel partners’ ability to successfully convert them to our products. Failure to obtain orders from customers and end users, for competitive reasons or otherwise, will materially adversely affect our operating results, business and prospects.
Some of our competitors may devote more resources than we can to the development, promotion, sale and support of their products. Our competitors include companies that have much greater financial, operating, research and development, marketing and other resources than us. These competitors may discount their products to gain market share. In doing so, they could simply accept smaller margins, or they could maintain margins by achieving cost savings through better, more efficient designs or production methods. They may also bundle other technologies, including those we do not have in our product portfolio, with their RAIN products. Further, the Chinese government has made development of the Chinese semiconductor industry a priority, increasing competitive pressures on us while possibly restricting our access to the Chinese market. Our channel partners, including our OEMs, ODMs, distributors, SIs, VARs and software solution partners may also choose to compete with us rather than purchase our products.
We are expected to introduce new products and product enhancements on a regular basis.
We introduce new products and services to keep pace with technology advancements, satisfy increasingly demanding end-user requirements and grow market acceptance. We commit significant resources to developing these new products and services while improving performance, reliability and reducing costs. Because our products are often used in, and incorporated into, complex business processes and use cases, new products and services may take time to be successful or may not succeed at all.
In the future, our success in developing the technologies or processes necessary for new or enhanced products and services, or in licensing or otherwise acquiring these technologies from third parties, and our ability to introduce new products and services before our competition, will depend on various factors, including:
|
|
• |
our timely and efficient completion of the design process; |
|
|
• |
our timely and efficient implementation of manufacturing, assembly and testing procedures; |
|
|
• |
product or service performance; |
|
|
• |
product certification; |
|
|
• |
our ability to attract, retain and manage technical personnel; |
|
|
• |
the quality, reliability and selling price of the product or service; and |
|
|
• |
effective marketing, sales and service. |
13
An inability or limited ability of enterprise systems to exploit RAIN information may adversely affect the market for our products.
A successful end-user RAIN deployment requires not only tags and readers or gateways, but RAIN integration with information systems and applications that derive business value from RAIN data. Unless third parties continue developing and advancing business analytics tools, and end users enhance their information systems to use these tools, RAIN deployments could stall. Our efforts to foster third-party development and deployment of these tools could fail. In addition, our guidance to business-analytics providers for integrating our products with their tools could prove ineffective.
Solution providers and SIs are essential to the RAIN market. They provide deployment know-how to enable end users to successfully deploy RAIN solutions. Integrating our products with end-user information systems could prove more difficult or time consuming than we or they anticipate, which could delay deployments.
Selling prices of our products could decrease substantially, which could have a material adverse effect on our revenue and gross margins.
The average selling price, or ASP, of our products has decreased over time and RAIN market development. We expect continued price decreases, but cannot predict the future rate. From time-to-time we reduce the selling prices of our products to meet end-user demands or to respond to market pressure from our competition. We also sometimes reduce prices to encourage adoption, address macroeconomic conditions or for other reasons. If, in the future, we are unable to offset ASP reductions with increased sales volumes or reduced product costs, then our revenue and gross margins will suffer.
Rapid market innovation, which we continue to experience, can drive intense pricing pressure, particularly for older products or products using older technology. New market requirements can render old products uncompetitive for new opportunities. When demand for older products declines, ASPs may decrease quickly. To profitably sell our products we must continually improve our technology and processes, and reduce costs in line with the lower selling prices. If we and our third-party suppliers and manufacturers cannot develop and implement processes or improve efficiencies sufficient to maintain required margins, we may not be able to sell our products profitably.
We generate most of our revenue from our endpoint ICs, and a decline in sales of these products or increased price competition in the market for endpoint ICs could adversely affect our operating results and financial condition.
We derive, and expect to continue to derive, a majority of our product revenue from our endpoint ICs. Accordingly, we are vulnerable to fluctuations in endpoint IC demand. If demand declines then our business and operating results will suffer. In addition, the continued adoption of, and demand for, our existing endpoint ICs, as well as for our new endpoint ICs, derives in part from our ability to continually innovate and to demonstrate the benefits of using our endpoint ICs with our reader ICs, readers and gateways. If we fail to establish the benefits of using our endpoint ICs with our platform, we may not be successful in countering competitive pressures to lower prices for our endpoint ICs and our business and operating results could be adversely affected.
Changes in our product mix could adversely affect our overall gross margin.
We generate most of our revenue from endpoint IC sales, with lower gross margins than our other products. In addition, endpoint IC gross margins are affected by product mix, which can fluctuate based on competitive pressures and end-user demand. A further shift in sales mix away from our higher margin products to lower margin products, especially to our endpoint ICs, will negatively affect our gross margins.
14
Our products must meet demanding technical and quality specifications. Defects, errors or interoperability issues with our products, the failure of our products to operate as expected, or undue difficulty in deploying our products in actual operations could affect our reputation, result in significant costs to us and impair our ability to sell our products.
Our products must meet demanding customer specifications for quality, reliability and performance. They are also highly technical and are deployed in large, complex systems. Our channel partners and end users may discover errors, defects or incompatibilities in our products, including after deploying them. In addition, our channel partners or end users may find compatibility or interoperability issues between our products and their enterprise software systems, or between our products and other RAIN products. They may also experience problems when our products are combined with or incorporated into products from other vendors, such as our tag OEMs using our endpoint ICs with their antennas, or our reader partners using our reader ICs in their readers. We may have difficulty identifying and correcting the problems when third parties are combining, incorporating or assembling our products.
If we are unable to fix errors or other problems, we could experience:
|
|
• |
loss of customers or customer orders; |
|
|
• |
lost or delayed market acceptance and sales of our products; |
|
|
• |
loss of market share; |
|
|
• |
damage to our brand and reputation; |
|
|
• |
impaired ability to attract new customers or achieve market acceptance; |
|
|
• |
diversion of development resources; |
|
|
• |
increased service and warranty costs; |
|
|
• |
replacement costs; |
|
|
• |
legal actions by our customers; and |
|
|
• |
increased insurance costs. |
Currently, certain of our products are experiencing production issues. While we believe that these issues can be resolved in a timely manner, if we are unable to resolve these issues in a timely manner, or at all, our operating results could be adversely affected.
Given the technical and business requirements against which end users evaluate RAIN and our products and platform, our business results and prospects could suffer if we are unable to make our products and our platform easy to deploy. To demonstrate the benefits of our platform in meeting business needs and to develop deployment methods to meet those needs, we frequently enter into proof-of-concept deployments, or POCs, with prospective end users. These POCs can extend for relatively long periods of time, and they may not be successful for a variety of reasons, including changes in end-user requirements, changes in end-user commitment or deployment challenges.
End users or our direct customers must design our products into their products and systems. If they fail to do so, our operating results and prospects will be adversely affected.
Convincing end users or our direct customers to design RAIN and our products into their products and systems requires educating them about RAIN’s value over other technologies. They may currently use other technologies or products and may not feel the need to learn about how RAIN or our products can improve their systems. Even when convinced, they often undertake long pilots or qualification processes prior to placing orders. We spend significant time and resources to have RAIN and our products selected by a potential end user or customer. End users or our direct customers adopting RAIN often involves them weighing the benefits of RAIN against the costs of modifying or replacing their existing systems, and if they remain unconvinced, they may not deploy. If we fail to develop new products that adequately or competitively address the needs of end users or our direct customers, they may not select our products to be designed into their systems, which could adversely affect our business, prospects and operating results.
15
Our visibility into the length of the sales and deployment cycles for our products is limited.
We have limited visibility into the length of product sales and deployment cycles, and these cycles are often longer than we anticipate. Many factors contribute to our uncertainty, including the time channel partners and end users spend evaluating our products, time educating them on RAIN’s benefits, and time integrating our products with their systems. The length and uncertain timing of the sales and deployment cycles can lead to delayed product orders. In anticipation of those orders, we may incur substantial costs before the sales cycle is complete and before we receive any customer orders or payments, if we receive them at all.
Alternative technologies, or changes in RAIN standards, may enable competitive products and services and may adversely affect RAIN market growth and our business.
Technology developments may affect our business negatively. Breakthroughs in legacy RFID technologies or markets, including those using low frequency or high frequency technology, could adversely affect RAIN market growth generally and demand for our products in particular. Likewise, new technologies may allow lower-cost ICs than our current silicon-based technology allows. If we are unable to innovate using new or enhanced technologies or processes or are slow to react to changes in existing technologies or in the market, or have difficulty competing with advances in new or legacy technologies, then our development of new or enhanced products could be impacted and result in product obsolescence, decreased revenue and reduced market share.
Significant changes in RAIN standards bodies, standards or qualification processes could impede our ability to sell our products and services.
We participate in developing RAIN industry standards, including with GS1 and ISO, and have designed our products to comply with those standards. We have historically taken a leadership positing in standards development. In the future, we could lose that leadership position or our influence in standards development.
New industry standards, or changes to existing standards, could render our products obsolete and cause us to incur substantial development costs to adapt to the new or changed standards. If the industry standards diverge from our or the RAIN market’s needs, then our products may fail to keep pace with the market or cause end users to delay their deployments. Moreover, the adoption or expected adoption of new or changed standards could slow our sale of existing products before we can introduce new products that meet the new or changed standards. New standards or changes to existing standards could also limit our ability to implement new features in our products if those features do not meet the new or changed standards. The lost opportunities as well as time and expense for us to develop new products or change our existing products to comply with new or changed standards could be substantial, and we may not successfully develop products that comply with new or changed standards.
Certain organizations develop requirements for RAIN tags and test tags against those requirements. As one example, the ARC Program at Auburn University, or ARC, develops tag performance and quality requirements for end users that engage them. Some participants in the RAIN market are ARC sponsors, but we are not among them. Some other organizations perform this function as well. ARC or a similar organization could develop specifications that few or none of our endpoint ICs meet.
Changes in government spectrum regulations or their enforcement could adversely affect our ability to sell our products.
Government radio regulations require that our readers and gateways be certified for spectral compliance in jurisdictions where they are sold or operated. Our readers and gateways are collectively certified for use in more than 40 countries worldwide, including the United States, Canada, Mexico, China, Japan, South Korea and every country in the EU. If one of our reader or gateway products is found to be noncompliant despite being certified, we could be required to modify field-deployed readers or gateways and could spend significant resources and miss sales opportunities in the process.
Government regulations may change, possibly without notice, requiring us to redesign our products to conform with the new regulations or constraining our ability to incorporate new features into our products. Such changes could cause us to incur significant costs, including costs associated with obsolete inventory. Regulatory changes may also cause us forego opportunities to improve our products, potentially delaying our time-to-market.
16
Sales of some of our products could cannibalize revenue from other products.
Our sales of some of our products enable our channel partners to develop their own products that compete with other of our products. For example, sales of our reader ICs allow our OEM partners to build and sell readers and gateways that may compete with our readers and gateways. Similarly, sales of our readers allow our channel partners to build and sell gateways that compete with our xArray and xSpan. In the future, we may see one product line expand at the expense of another, or we may be asked by partners to disadvantage or divest a product line. We cannot predict whether we can manage such conflicts in the future or retain channel partners despite conflicts.
Pricing commitments and other restrictive provisions in our customer agreements could adversely affect our operating results.
In the ordinary course of business, we enter into agreements containing pricing terms that could, in some instances, adversely affect our operating results and gross margins. For example, some contracts specify future IC, reader or gateway pricing or contain most-favored customer pricing for certain products. Other agreements contain exclusivity terms that prevent us from pursuing certain business with other customers during the exclusivity period. Reducing prices or offering favorable terms to one customer could adversely affect our ability to negotiate favorable terms with other customers.
Risks Relating to Our Personnel and Business Operations
We obtain the products we sell through third parties with whom we do not have long-term supply contracts. If we are unable to effectively manage our relationships with suppliers, our operating results and financial condition would be adversely affected.
Our ability to secure cost-effective, quality products in a timely manner could be adversely affected by many factors, including:
|
|
• |
Third-party manufacturing capacity may not be available when we need it. |
|
|
• |
Some products have long lead times and we place orders for them five or more months before our anticipated delivery dates to our customers. If we inaccurately forecast customer demand, we may be unable to meet our customers’ delivery requirements or we may accumulate excess inventory. |
|
|
• |
Supply disruptions may affect our ability to meet our customers’ demand, potentially causing customers to cancel orders, qualify alternative suppliers or purchase from our competitors. Supply disruptions can also distort demand, making it even harder to meet true demand with finished products. |
If our suppliers fail to manufacture our products at reasonable prices or with satisfactory quality levels, then our ability to bring those products to market and our reputation could both suffer. If supplier capacity diminishes, whether from closures, bankruptcy, capacity allocation, in response to Covid-19, catastrophic loss of facilities or otherwise, we could have difficulty fulfilling orders, our revenue could decline and our growth prospects could be impaired. Transitioning our assembly services or IC foundries to new providers would take many months and, in the case of ICs, could take several years. And transition would require a requalification by our customers or end users, which could also adversely affect our ability to sell our products and our operating results. Moreover, in the event of a quality issue, the process of testing failed products and diagnosing and fixing defects is time consuming and costly and could constrain our ability to supply customers with new products.
We are vulnerable to silicon wafer shortages, which may adversely affect our ability to meet demand for our products.
The semiconductor industry frequently has periods of capacity shortfall. Some semiconductor industry analysts predict such a shortfall in 2021. These shortfalls may decrease sales and cause market-share losses if our customers purchase competitive products, or alternatively, may artificially increase sales as customers overbuy our products, followed by sales declines in future periods as they consume their accumulated inventory.
At times, our suppliers ask us to purchase excess products to ensure we do not face a subsequent shortage. For example, in certain quarters of 2014, 2015 and 2016, we purchased more endpoint IC wafers than we needed, which reduced our available cash. In addition, we may invest in inventory to support anticipated business growth,
17
as we did with endpoint IC inventory in 2017. If we are unable to sell the inventory we purchased, or if we must sell it at lower prices due to excess inventory or obsolescence, then our business will be negatively impacted.
We bear inventory risks due to our reliance on channel partners to sell and distribute our products.
We typically manufacture our products based on channel-partner forecasts before we receive purchase orders. However, many of our channel partners have difficulty accurately forecasting end-user demand and the timing of that demand. They also sometimes cancel purchase orders or reschedule product shipments, in some cases with little or no advance notice to us. We also sometimes receive soft commitments for large orders which do not materialize. In addition, when we introduce new products, we may initially carry higher inventory or have slower inventory turns depending on market acceptance. We have additional uncertainty arising from our competition’s business practices and from unanticipated external events, such as changes in regulatory standards, all of which can adversely affect demand and consequently our inventory levels, sales and operating results.
Covid-19 has adversely affected our business, and the magnitude and duration of future Covid-19 effects on our business are uncertain.
Covid-19 has created significant worldwide economic volatility, uncertainty and disruption, and those effects are likely to persist for some time. Covid-19 has already, and will likely continue to, adversely affect our financial position, results of operations, cash flows and future business prospects. Our significant Covid-19 risks include:
|
|
• |
uncertain product demand given the decline in many business activities globally, particularly in the retail industry, as well as overall delays in RAIN market adoption; |
|
|
• |
decreased visibility into market demand and consequent challenges in effectively managing our inventory; |
|
|
• |
partner-requested preordering or rescheduling as a result of supply concerns which can increase channel inventory; |
|
|
• |
increased operating costs such as those associated with work-from-home edicts and increased legal and regulatory demands; |
|
|
• |
delays in customer pilots which can delay project-based deployments; |
|
|
• |
delays in research and development efforts which can, in turn, delay new product introductions or product enhancements; |
|
|
• |
inability to engage in in-person sales and market activities, which can reduce our ability to effectively sell our products and drive future demand; |
|
|
• |
cost-reduction initiatives, such as lay-offs and furloughs; and |
|
|
• |
maintaining employee engagement and productivity in a prolonged work-from-home environment. |
With respect to market demand, in 2020, Covid-19 caused widespread venue closures, materially affecting demand for our products. Covid-19 is expected to continue impacting venues into 2021, with a particularly adverse impact in retail, including retail apparel, where RAIN is widely adopted. Covid-19 may accelerate a long-term shift in consumer behavior away from physical stores which may further reduce demand for our products over the longer term. The extent and duration to which Covid-19 impacts the retail industry and any retailer’s plans with respect to capital expenditures is unclear, as is the extent to which it will impact our product sales.
Covid-19 has affected many other markets that use our products, including aviation, sporting events such as footraces, and many others. Many of these markets will continue to feel Covid-19’s impacts into 2021. If we fail to make our products and platform easy-to-deploy and economical for these markets, or if participants in these markets delay or forgo RAIN investments in response to Covid-19 or otherwise, our ability to penetrate them may suffer.
18
Uncertainties surrounding global trade policies could have a material adverse effect on us.
Changes in U.S. and foreign laws and policies governing foreign trade, manufacturing, development and investment in the jurisdictions where we currently develop and sell products, and any negative consequences resulting from such changes, could materially affect our business.
In recent years, the U.S. government has imposed significant tariffs on a variety of items imported other countries, particularly China. China has responded by imposing significant tariffs on a variety of items imported from the United States. Such tariffs could have a material adverse impact on our ability to compete internationally. The United States and China signed a preliminary trade agreement in early 2020. However, the tariffs remain in place as negotiations between the countries continue.
Other causes of uncertainty include the Chinese government’s efforts to promote China’s domestic semiconductor industry and lingering uncertainties stemming from the United Kingdom’s separation from the EU.
We are subject to risks inherent in operating abroad and may not be able to successfully maintain or expand our international operations.
In 2020, we derived 80% of our total revenue from sales outside the United States. We anticipate growing our business, in part, by continuing to expand our international operations, which has a variety of significant risks, including:
|
|
• |
changes, some unexpected or unanticipated, in regulatory requirements, taxes, trade laws, tariffs, export quotas, custom duties or other trade restrictions; |
|
|
• |
lack of established, clear, or fairly implemented standards or regulations with which our products must comply; |
|
|
• |
greater difficulty in enforcing contracts, judgments and arbitration awards in international courts, and in collecting accounts receivable and longer payment and collection periods; |
|
|
• |
limited or unfavorable intellectual property protection; |
|
|
• |
misappropriation of our intellectual property; |
|
|
• |
inflation and fluctuations in foreign currency exchange rates and interest rates; |
|
|
• |
restrictions, or changes thereof, on foreign trade or investment, including currency-exchange controls; |
|
|
• |
changes in a country’s or region’s political, regulatory, legal or economic conditions, including, for example, global and regional economic disruptions caused by Covid-19; |
|
|
• |
political uncertainty, strife, unrest, or conflict, including, for example, the United Kingdom’s departure from the EU and political unrest in Hong Kong; |
|
|
• |
differing regulations with regard to maintaining operations, products and public information; |
|
|
• |
inequities or difficulties obtaining or maintaining export and import licenses; |
|
|
• |
differing labor regulations, including where labor laws may be more advantageous to employees than in the United States; |
|
|
• |
restrictions on earnings repatriation; |
|
|
• |
corrupt or unethical practices in foreign jurisdictions that may subject us to exposure under applicable anti-corruption and anti-bribery laws such as the U.S. Foreign Corrupt Practices Act of 1977, as amended, or FCPA, and the United Kingdom Bribery Act of 2010, or U.K. Bribery Act; and |
|
|
• |
regulations, and changes thereof, relating to data privacy, cybersecurity, and the unauthorized use of, or access to, commercial and personal information, particularly in Europe. |
Various foreign regulatory or governmental bodies may issue rulings that invalidate prior laws, regulations, or legal frameworks in ways that may adversely impact our business. For example, the European Union Court of Justice in October 2015 invalidated the EU-U.S. Safe Harbor Framework, which facilitated personal data transfers to the
19
United States in compliance with applicable EU data-protection laws. The EU-U.S. Privacy Shield subsequently adopted in 2016 to provide a mechanism for companies to transfer EU personal data to the United States, was also invalidated by the European Union Court of Justice in July 2020. As another example, the European Commission adopted the General Data Protection Regulation, or GDPR, which became effective on May 25, 2018. The GDPR imposes more stringent data-protection requirements than the former regulatory regime in the EU and provides for greater penalties for noncompliance of up to the greater of 4% of worldwide annual revenue or €20 million. Significant regulatory uncertainty remains surrounding data transfers from the European Economic Area to the United States. In China, we are monitoring legal and government advisory developments regarding cybersecurity-focused legislation for impacts to our business related to cross-border transfer limitations and evolving privacy, security, or data protection requirements. We may be required to change our policies and practices with respect to data transfer and other aspects of our data processing and security, which may be burdensome or involve substantial cost and expense, in an effort to address new and evolving limitations and requirements relating to privacy, security, data storage, and data protection.
Additionally, the United Kingdom, or UK, has enacted legislation that substantially implements the GDPR and which provides for penalties of up to the greater of 4% of worldwide annual revenue and 17.5 million British Pounds. Following the UK’s exit from the EU, however, which became effective January 31, 2020, with a transition period ending December 31, 2020, significant uncertainty remains regarding matters such as data transfers between the UK, the EU and other jurisdictions. This uncertainty and other developments could require us to further change the way we conduct our business and transmit data between the U.S., the UK, the EU, and the rest of the world. Likewise, the California Consumer Privacy Act of 2018, or the CCPA, became effective on January 1, 2020. The CCPA imposes stringent data privacy and data protection requirements for certain data of California residents, and provides for noncompliance penalties of up to $7,500 per violation. In addition, the California Privacy Rights Act, or CPRA, was passed by voters in California’s November 2020 election. The CPRA significantly modifies the CCPA, creating additional obligations with respect to consumer data commencing on January 1, 2022, and going into effect generally on January 1, 2023. Aspects of the CCPA, the CPRA, the GDPR and other laws and regulations relating to privacy, data protection, and security remain unclear as of the date of this report, but these laws and regulations potentially are far reaching. Laws and regulations relating to privacy, data protection and security, and continued evolution of such laws and regulations and their interpretation and enforcement, may require us to modify our practices and policies, which we may not be able to do on commercially reasonable terms or at all, and otherwise cause us to incur substantial costs and expenses in an effort to comply. Any failure or perceived failure by us or any third parties with which we do business to comply with these laws and regulations may result in actions against us by governmental entities, private claims and litigation, the expenditure of legal and other costs and of substantial time and resources, and fines, penalties or other liabilities. Any such actions may be expensive to defend, may require the expenditure of substantial legal and other costs and substantial time and resources and likely would damage our reputation and adversely affect our business, financial condition and results of operations.
We opened an office in Shanghai, China in 2011. In addition to the risks listed above, our China operations expose us to risks associated with Chinese laws and policies governing Chinese operations and also to U.S. laws and regulations relating to foreign trade and investment. To date, legal, policy or regulatory changes have not had a material adverse effect on our business or financial condition, but they may in the future. We may experience increased costs for, or significant impact to, our Chinese operations in the event of changes in Chinese government policies or political unrest or unstable economic conditions in China. The nationalization or other expropriation of private enterprises by the Chinese government could result in total loss of our China investment. Any of these matters could materially and adversely affect our business and results of operations.
20
Our failure to comply with anti-corruption and anti-bribery laws related to our foreign activities could subject us to penalties and other adverse consequences. Anti-corruption and anti-bribery laws generally prohibit companies and their employees and intermediaries from making payments to foreign officials for the purpose of obtaining or keeping business, securing an advantage or directing business to another person, and require companies to maintain accurate books and records and a system of internal accounting controls. Under the FCPA, U.S. companies may be held liable for corrupt actions taken by directors, officers, employees, agents, or other strategic or local partners or representatives. If we, our intermediaries or our solution providers, SIs, OEMs, ODMs, VARs, distributors, tag manufacturers or other partners fail to comply with FCPA or similar legislation, government authorities in the United States and elsewhere could seek to impose civil or criminal fines and penalties which could have a material adverse effect on our business, operating results and financial conditions. Moreover, China is an area of heightened exposure regarding compliance with anticorruption laws such as the FCPA and the U.K. Bribery Act. We intend to increase our international sales and business in China and, as such, our risk of violating laws such as the FCPA or U.K. Bribery Act also increases.
We generally conduct our China operations through a wholly owned subsidiary and our European operations through our U.K. subsidiary. For other worldwide jurisdictions, we generally report our taxable income based on our business operations in those jurisdictions. The relevant taxing authorities may disagree with our determinations as to the income and expenses attributable to the jurisdiction or subsidiary. In the event of a disagreement, if our position is not sustained, we could be required to pay additional taxes, interest and penalties, which could result in tax charges, higher effective tax rates, reduced cash flows and lower overall profitability.
We are subject to governmental export and import controls that could subject us to liability or impair our ability to compete in international markets.
The U.S. and various foreign governments have imposed controls, export license requirements and restrictions on the import or export of certain products, technologies and software. We must export our products in compliance with U.S. export controls, including the Commerce Department’s Export Administration Regulations and various economic and trade sanctions established by the Treasury Department’s Office of Foreign Assets Controls. We may not always be successful in obtaining necessary export licenses, and our failure to obtain required import or export approval for our products or limitations on our ability to export or sell our products imposed by these laws may harm our international and domestic sales and adversely affect our revenue. Noncompliance with these laws could have negative consequences, including government investigations, penalties and reputational harm.
Changes in our products or changes in export, import and economic sanctions laws and regulations may delay us introducing new products in international markets, prevent our customers from using our products internationally or, in some cases, prevent the export or import of our products to or from certain countries altogether. The U.S. government has imposed significant tariffs on a variety of items imported from China. China has responded by imposing significant tariffs on a variety of items imported from the United States. Such tariffs could have a material impact on our product costs and decrease our ability to sell our products to existing or potential customers and harm our ability to compete internationally. Further, it is possible that additional sanctions or restrictions may be imposed by the U.S. government on items imported into the United States from China and any such measures could further adversely affect our ability to sell our products to existing or potential customers and harm our ability to compete internationally. Any change in export or import regulations or legislation; shift or change in enforcement; or change in the countries, persons or technologies targeted by these regulations could result in decreased use of our products by, or in our decreased ability to export or sell our products to, existing or potential customers with international operations, adversely affecting our business and results of operations.
Instability or deterioration in the political, social, business or economic conditions in key production jurisdictions could harm our business, financial condition and operating results.
We outsource our manufacturing and production to suppliers in a small number of jurisdictions including Thailand, Malaysia, Taiwan and China. These jurisdictions have experienced significant changes in political, social, business or economic conditions in the past and may experience them in the future. Some of these jurisdictions have also experienced, and may continue to experience, intermittent or sustained mandatory shutdowns or other restrictions to combat the spread of Covid-19.
21
Deterioration in the political, social, business or economic conditions in any jurisdictions in which we have significant suppliers could slow or halt product shipments or disrupt our ability to test or post-process products. In response, we could be forced to transfer our manufacturing, testing and post-processing activities to more stable, and potentially more costly regions or find alternative suppliers.
Our business operations could be disrupted by natural disasters.
In addition to the pandemic risk discussed earlier under “—Covid-19 has adversely affected our business, and the magnitude and duration of future Covid-19 effects on our business are uncertain,” other disasters, whether natural or manmade, could decrease demand for our products, disable our facilities, disrupt operations or cause catastrophic losses. We have facilities in areas with known seismic activity, such as our headquarters in Seattle, Washington. We have facilities in areas with known flooding, such as our office in Shanghai, China. We have a wafer testing and dicing subcontractor in Thailand, a region with a known, and recent, history of flooding. A loss at any of these or other of our or our suppliers’ facilities could disrupt operations, delay production and shipments, reduce revenue and engender potentially large expenses to repair or replace the facility. We do not carry insurance that covers potential losses caused by pandemics, earthquakes, floods or other disasters.
Risks Relating to Our Relationships with Customers, Channel Partners and End Users.
We rely on a small number of customers for a large share of our revenues.
We sell our endpoint ICs directly to inlay and tag OEMs and ODMs. We sell our reader ICs to OEMs and ODMs, primarily through distribution. We sell our readers and gateways to VARs and SIs, primarily through distribution. In 2020, sales to tag OEMs Avery Dennison and Arizon accounted for 32% and 10% of our total revenue, respectively. In March 2020, Avery Dennison acquired Smartrac’s RFID inlay segment. Sales concentration to a smaller number of OEMs decreases our bargaining power and increases the risk that our pricing or sales could decline based on sales measures taken by our competitors or our own failure to compete effectively.
If we fail to retain our endpoint IC, reader IC, reader or gateway partners or distributors or fail to establish new relationships, our business, financial condition or operating results could be harmed. Our competitors’ relationships with, or acquisitions of, these partners or distributors could interfere with our relationships with them. Any such interference could impair or delay our product sales or increase our cost of sales.
We engage directly with end users to adopt our products in large projects. These projects, often involving large purchases of our readers and gateways, are often discrete deployments that can result in significant sales for periods of time. They also increase the volatility of our revenues and operating results. For example, we generated 14% of our total 2019 revenue from a North American systems customer. If we are unable to replace project-based revenue with new revenue streams, or if end users with large projects change or delay them without giving us with adequate notice, our sales could decline from period to period and harm our stock price.
Because we sell and fulfill through channel partners, our ability to affect or determine end-user demand is limited.
End users drive demand for our products but, because we sell our products through channel partners, we are one step removed from those end users and unable to directly assess their demand. Our channel partners may choose to prioritize selling our competitors’ products over ours, or they may offer products that compete with our products or limit sales of our products. If our channel partners do not sell enough of our products or if they choose to decrease their inventories of our products for any reason, our sales to these channel partners and our revenue will decline.
Our channel partners may not properly forecast end users’ demand for our products.
Our channel partners may purchase more of our products than they need to satisfy end-user demand, increasing their inventory and reducing future sales. Distributors may return products in exchange for other products, subject to time and quantity limitations. Our reserve estimates for products stocked by our distributors are based principally on reports provided to us by our distributors, typically on a monthly basis. If the inventory and resale information our partners and distributors provide is inaccurate, or if we do not receive it in a timely manner, then we may not have a reliable view of products being sold to end users which could impact our operating results.
22
Our growth strategy depends in part on the success of strategic relationships with third parties and their continued performance and alignment.
We invest in relationships with SIs, VARs and software providers whose product offerings complement ours and through which we fulfill our product sales. Our business will be harmed if we fail to develop and grow these partner relationships. For example, our operating results may suffer if our efforts developing partner relationships increase costs but do not increase revenue. Partner relationships may also involve exclusivity provisions, multiple levels of distribution, discount pricing or investments in other companies. The cost of developing and maintaining partner relationships may go unrecovered and our efforts may not generate a corresponding increase in revenue.
Our business depends on our brand recognition and reputation, and if we fail to maintain or enhance our brand recognition or reputation then our business could be harmed.
We believe that building our brand and reputation is key to our relationships with partners and end users and to our ability to attract new partners and end users. We also believe that our brand and reputation will be increasingly important as market competition increases. Our success depends on a range of factors, including:
|
|
• |
continuing to deliver high-quality, innovative and defect-free products; |
|
|
• |
maintaining high customer satisfaction; |
|
|
• |
successfully differentiating our products from those of our competitors; and |
|
|
• |
appropriately managing both positive and negative publicity. |
Risks Relating to Our Intellectual Property
If we are unable to protect our intellectual property then our business could be adversely affected.
Our success depends in part upon our ability to obtain, maintain and enforce patents, copyrights, trade secrets, trademarks and other intellectual property rights and to prevent third parties from infringing, misappropriating or circumventing those rights. We rely on a variety of intellectual property rights, including patents in the United States and copyrights, trademarks and trade secrets in the United States and foreign countries. We have historically focused on filing U.S. patent applications for a number of reasons including the fact that many RAIN products are used in or imported into the United States. By seeking patent protection primarily in the United States, our ability to assert our intellectual property rights outside the United States is limited, including in some significant foreign markets such as China. We have registered trademarks and domain names in selected foreign countries where we believe filing for such protection is appropriate and we have a small number of foreign patent applications and issued and allowed foreign patents. Regardless, some of our products and technologies may not be adequately protected by any patent, patent application, trademark, copyright, trade secret or domain name. Also, effective intellectual property protection may be unavailable or more limited in one or more relevant jurisdictions relative to those protections available in the United States.
We cannot guarantee that:
|
|
• |
any of the patents, trademarks, copyrights, trade secrets or other intellectual property rights we presently employ in our business will not lapse or be invalidated, circumvented, challenged or abandoned; |
|
|
• |
our intellectual property rights will provide competitive advantages to us; |
|
|
• |
our ability to assert our intellectual property rights against potential competitors or to settle current or future disputes will not be limited by our agreements with third parties; |
|
|
• |
any of our pending or future patent applications will be issued or have the coverage we originally sought; |
|
|
• |
our intellectual property rights can or will be enforced, particularly in jurisdictions where competition may be intense or where legal protections may be weak; |
|
|
• |
we will not lose the ability to assert our intellectual property rights against, or to license our technology to, others and collect royalties or other payments; or |
23
|
|
• |
we will retain the right to ask for a royalty-bearing license to an industry standard if we fail to file an intellectual property declaration pursuant to the standards process. |
Monitoring and addressing unauthorized use of our intellectual property is difficult and costly. Unauthorized use of our intellectual property has already occurred and may occur again. Our failure to identify unauthorized use or otherwise adequately protect our intellectual property could adversely affect our business.
Litigation to enforce our intellectual property rights is time consuming, distracting, expensive and could result in outcomes or consequences that are harmful to us. We could incur significant costs and divert our attention and the attention of our employees by threatening or initiating litigation, which could, in turn, decrease revenue and increase expenses. Because litigation outcomes are uncertain, we could lose an enforcement action or weaken our intellectual property rights in litigation. An adverse decision could impair our intellectual property rights, limit the value of our technology or otherwise negatively impact our business, financial condition and operating results. At the same time, a decision not to enforce our intellectual property rights could embolden others to violate or potentially violate our intellectual property rights and thus weaken those rights over time.
On June 6, 2019, we filed a patent infringement lawsuit against NXP USA, Inc., a Delaware corporation and subsidiary of NXP Semiconductors N.V., or NXP, in the U.S. District Court for the Northern District of California, or the Court. For further information regarding this litigation, please refer to Note 11 of our condensed consolidated financial statements included elsewhere in this report.
If we are unsuccessful in prosecuting our patent-infringement claims against NXP or in defending ourselves against NXP’s counterclaims, or to the extent we cannot maintain the validity and enforceability of our patents, we could see a material adverse effect on our business, results of operations or financial condition. Regardless of the outcome, our lawsuit against NXP will increase our expenses and distract management and key employees, and could negatively impact our relationships with partners or end users and result in retaliatory claims against us.
Some of our technology is not patented or patentable and constitutes trade secrets. To protect our trade secrets, we require our employees, consultants, advisors and other collaborators to enter into confidentiality agreements. We also rely on contractual protections with our channel partners, suppliers and end users, and we implement security measures to protect our trade secrets and other confidential information. We cannot guarantee we have entered into appropriate agreements with all parties that have access to our trade secrets or confidential information. Moreover, the agreements we have entered into may not provide sufficient protection for our trade secrets or other confidential information in the event of any unauthorized use or disclosure. Our trade secrets and other confidential information could also be obtained by third parties by breaches of our security systems. Our suppliers, employees or consultants could also assert rights to our trade secrets or other confidential information.
Our use of overseas manufacturers has extra risk. The intellectual property protection in countries where our third-party contractors operate is weaker than in the United States. If the steps we have taken and the protection provided by law do not adequately safeguard our intellectual property rights then we could suffer lost profits due to sales of competing products that exploit our intellectual property rights.
We may become party to intellectual property disputes which could be time consuming, costly to prosecute, defend or settle, result in the loss of significant rights, and adversely affect RAIN adoption generally.
Many companies in our industry, as well as non-practicing entities, hold patents and other intellectual property rights and may pursue, protect and enforce those intellectual property rights. We have received, and may receive in the future, invitations to license patent and other intellectual property rights to technologies that could be important to our business. We also receive assertions against us, our channel partners and or end users claiming that we or they infringe patent or other intellectual property rights. Offers to purchase patents or other intellectual property rights, or claims that we infringe patents or other intellectual property rights, regardless of their merit or resolution, are costly to resolve and divert the efforts and attention of our management and technical personnel. If we decline to accept an offer or refute a claim, then the offering or claiming party may pursue litigation against us.
Intellectual property disputes have adversely affected RAIN adoption. As one example, in 2011 Round Rock Research filed lawsuits against 11 end users, including Walmart and Macy’s, for RAIN-related patent infringement. We believe those lawsuits adversely affected demand for our products from 2011 to 2014. In 2013, Round Rock Research entered into licensing agreements with many RAIN suppliers, including us; in early 2015 they reached a settlement agreement with the last of the end-user defendants. The licensed Round Rock patents all expired by the
24
end of 2019. However, we, our channel partners, suppliers or end users could be involved in similar disputes in the future which could adversely affect our operating results and growth prospects.
We may be forced, or choose, to take action to protect our own intellectual property against infringement by others. Our actions could adversely affect RAIN adoption as well as our own operating and growth prospects. For example, in June, 2019 we filed a patent infringement lawsuit against NXP USA, Inc., a Delaware corporation and subsidiary of NXP, in the U.S. District Court for the Northern District of California and in October 2019, NXP USA, Inc. and NXP filed a patent infringement lawsuit against us in the U.S. District Court for the District of Delaware. For more information, see “-If we are unable to protect our intellectual property, our business could be adversely affected.”
Many of our agreements require us to indemnify and defend our channel partners and end users from third-party infringement claims and pay damages in the case of adverse rulings. These damages could be sizable and disproportionate to the business we derive from the accused channel partners or end users. Moreover, we may not know whether we are infringing a third party’s rights due to the large number of RAIN-related patents or to other systemic factors. For example, patent applications in the United States are maintained in confidence for up to 18 months after filing or, in some instances, for the entire time prior to patent issuance. Consequently, we may not be able to account for such rights until after a patent issues.
Competitors may file patent applications or receive patents that block or compete with our patents. Claims of this sort can harm our relationships with our channel partners or end users and may deter these partners or end users from doing business with us. Further, we may or may not prevail in patent-related proceedings given the complexity and inherent uncertainties in intellectual property litigation. If any pending or future proceedings result in an adverse outcome, then we could be required to:
|
|
• |
cease the manufacture, use or sale of the infringing products, processes or technology; |
|
|
• |
pay substantial damages for infringement; |
|
|
• |
expend significant resources to develop non-infringing products, processes or technology; |
|
|
• |
license technology from the party claiming infringement, which license may not be available on commercially reasonable terms, or at all; |
|
|
• |
cross-license our technology to a competitor to resolve an infringement claim, which could weaken our ability to compete with that competitor; or |
|
|
• |
pay substantial damages to our channel partners or end users to cause them to discontinue their use of, or replace, infringing products with non-infringing products. |
Any of the foregoing could have an adverse effect on our business, financial condition and operating results.
Intellectual property licensing from or to others, including competitors, may subject us to requirements or limitations that could adversely affect our business and prospects.
Various intellectual-property license agreements give us access to the patents and intellectual property of others, for example to necessary intellectual property in GS1 EPCglobal protocols and ISO standards. We have similarly licensed some of our patents and intellectual property to others, for example pursuant to agreements in connection with us participating in developing GS1 EPCglobal protocols and ISO standards.
For the former, in the course of us participating in developing GS1 EPCglobal UHF Gen2, UHF Gen2 V2, tag data standards, low-level reader protocol and other protocols, we agreed to license on a royalty-free basis those of our patents that are necessarily infringed by the practice of these protocols to other GS1 EPCglobal members, subject to reciprocal royalty-free rights from those other members. For the latter, in the course of us participating in developing ISO standards, we agreed to license on a RAND basis those of our patents that are necessarily infringed by the practice of those ISO standards, again subject to reciprocal royalty-free rights from the other ISO members.
Because it may not be clear whether a member’s intellectual property is necessary to the practice of a protocol or standard, disputes could arise among members, resulting in our inability to receive a license on royalty-free or RAND terms or to assert our not-necessary patents against others. Further, some GS1 EPCglobal members declined to license their intellectual property on royalty-free terms, instead demanding reasonable and nondiscriminatory, or RAND, terms. Disputes or confusion may arise about whether we may invoke our necessary
25
intellectual property if those members choose to assert their RAND intellectual property, potentially causing or at least complicating any ensuing litigation and harming our business, financial condition and operating results.
In the course of us participating in ISO, we may be required to grant to all users worldwide a license to those of our patents that are necessarily infringed by the practice of other standards, including at frequencies other than UHF, on RAND terms, again subject to reciprocity. As a result, we are not always able to limit to whom and, to a certain extent, on what terms we license our technologies, and our control over and our ability to generate licensing revenue from some of our patents may be limited. We may also choose to license our patents or intellectual property to others in the future. We cannot guarantee that any patents and technology that we provide in any will not be used against us.
We rely on third-party license agreements; impairment of those agreements may cause production or shipment delays that could harm our business.
We have license agreements with third parties for patents, software and technology we use in our operations and in our products. For example, we license tools from design-automation software vendors to design our silicon products. Third-party licenses for patents, software and other technology important to our business may not continue to be available on commercially reasonable terms, if at all. Loss of any such licenses could cause manufacturing interruptions or delays or reductions in product shipments until we can develop, license, integrate, and deploy alternative technologies, if even possible, which could harm our business and operating results.
Our use of open-source software may expose us to additional risks and harm our intellectual property.
Our products, processes and technology sometimes use or incorporate software that is subject to an open-source license. Open-source software is typically freely accessible, usable and modifiable, and is made available to the general public on an “as-is” basis under the terms of a nonnegotiable license. Use and distribution of open-source software may entail greater risks than use of third-party commercial software. Certain open-source software licenses require a user who intends to distribute the open-source software as a component of the user’s software to disclose publicly part or all of the user’s source code. In addition, certain open-source software licenses require the user of such software to make derivative works of the open-source code available to others at low or no cost. Consequently, open-source licensing can subject our previously proprietary software to open-source licensing terms, which could enable our competitors to create similar offerings with lower development effort and time and ultimately could result in a loss of sales. In addition, open-source licensors generally do not provide warranties or other contractual protections regarding infringement claims or the quality of their code, opening us to business risks that could materially harm our operating results.
We may face claims alleging noncompliance with open-source license terms or infringement or misappropriation of proprietary software. These claims could result in litigation, require us to purchase a costly license, or require us to devote research and development resources to change our software, any of which would have a negative effect on our business and operating results. Few courts have interpreted open-source licenses, and these licenses could be construed in a way that could impose unanticipated conditions or restrictions on our ability to commercialize our offerings. In addition, if there are changes in the licensing terms for the open-source software we use, we may be forced to re-engineer our solutions, incur additional costs or discontinue the sale of our products. We cannot guarantee that we have incorporated all open-source software in a manner that is consistent with our current policies and procedures, or in a manner that will not subject us to liability.
Risks Relating to Privacy and Cybersecurity
Privacy and security concerns relating to RAIN could damage our reputation and deter current or potential customers from using our products.
Privacy advocates and others have raised and may continue raising concerns about RAIN compromising consumer privacy or facilitating theft. These concerns include unauthorized parties potentially collecting personally identifiable information or personal data, tracking consumers, stealing identities or causing other issues relating to privacy or data protection. If such concerns increase, or if actual malicious or inadvertent breaches of privacy or theft occur or are perceived to have occurred, then our reputation could be damaged, our business and prospects may suffer, and we could incur significant liability. We may be or be alleged to be subject to contractual or self-regulatory obligations, in addition to legal and regulatory obligations, relating to privacy, data protection and
26
security with respect to RAIN. These actual or asserted obligations may require us to modify our practices and policies, which we may not be able to do on commercially reasonable terms or at all, and otherwise cause us to incur substantial costs and expenses. Any failure or perceived failure to comply with any laws, regulations, or contractual or other obligations to which we are or may be asserted to be subject may result in regulatory actions, private claims and litigation, the expenditure of legal and other costs and of substantial time and resources, and fines, penalties or other liabilities. Any such actions may be expensive to defend, may require the expenditure of substantial legal and other costs and substantial time and resources and likely would damage our reputation and adversely affect our business, financial condition and results of operations.
In addition to concerns over privacy or theft, it is possible for those with malicious intent to misuse RAIN to facilitate theft or damage the public trust. If a theft or other damaging incident occurs or is perceived to occur and customer or end-user data, personally identifiable information or other confidential information is accessed or used without authorization, then our and our customers’ operations could be disrupted and our customers or we could be the target of regulatory investigations or proceedings and private claims, demands or litigation, and we could face potential liability and significant costs and expenses to remediate and otherwise respond to the incident. Concerns about security and privacy, even if unfounded, could also damage our reputation and operating results or could delay overall RAIN industry development. In such an event, our business and prospects may suffer, and we could incur claims, proceedings and significant liability. We also could be required to expend significant capital and resources to address any security incident or breach and to implement measures to prevent further breaches or incidents.
We cannot ensure that any limitation-of-liability provisions in our customer and user agreements, contracts with third-party vendors and service providers or other contracts are enforceable or adequate or would protect us from any liabilities or damages against claims relating to a security breach or other security-related matter.
Government regulations and guidelines and other standards relating to consumer privacy may adversely impact adoption of our products, require us to make design changes or constrain our ability to implement new and desired product features.
Our customers are subject to laws and regulations related to collecting, storing, transmitting and using personal information and personal data, as well as additional laws and regulations that address privacy and security related to RFID in general. Because RAIN is a type of RFID, we believe these laws and regulations apply to RAIN.
The European Commission, or the EC, has issued guidance to address privacy concerns about RFID. In May 2009, the EC issued a recommendation that retailers in the EU inform their customers when RFID tags are either on or embedded within products. In April 2011, the EC signed a voluntary agreement with private and public entities to develop privacy guidelines for companies using RFID in the EU. While compliance with the guidelines is voluntary, our customers that do business in the EU may have a preference for products that comply with the guidelines. If our RAIN products do not provide the necessary functionality to allow customers to comply with the guidelines then our business may suffer.
The data-security and privacy legislative and regulatory landscape in the United States, EU and other foreign jurisdictions continues to evolve, and new or changed laws, regulations, guidelines and standards may adversely impact our business, including our ability to develop future products. If we fail to develop products that meet end-user privacy requirements, then end users may choose not to use our products.
Although the Gen2 V2 protocol includes features for addressing consumer privacy and authenticating a tag, and although we have incorporated custom features in our products to further protect consumer privacy, a third party may still breach these features, including as implemented in our products, in which case our reputation could be damaged and our business and prospects could suffer.
A breach of our security systems could have an adverse effect on our business.
We use security systems to maintain our facility’s physical and information-technology security and to protect our proprietary and confidential information, including that of our customers, suppliers and employees. We face risks of security breaches from a variety of sources, including viruses, ransomware, hacking, malicious code, and social engineering and other forms of employee or contractor negligence, unintentional acts, or malfeasance. Accidental or willful security breaches or other unauthorized access to our facilities or information systems could compromise access to and the integrity of this information. The consequences of loss and possible misuse of our
27
proprietary and confidential information, including information relating to individuals, could include, among other things, unfavorable publicity, damage to our reputation, difficulty marketing or selling our products, customer allegations of breach of contract, loss or theft of intellectual property, claims and litigation, governmental and regulatory proceedings, and possible fines, penalties and other damages and liabilities, any of which could have a material adverse effect on our business, financial condition, reputation and relationships with customers and partners.
We rely on third-party providers of corporate infrastructure services such as for human resources, electronic communications and financial functions, and we are therefore dependent on the security systems of these third-party providers. These third-party providers also face risks of security breaches, and our ability to monitor their security is limited. Any security breaches or other unauthorized access to our service-providers’ systems or viruses, loggers, or other malfeasant code in their data or software could expose us to loss or misappropriation of, or unauthorized use or disclosure of, confidential and proprietary information. Because the techniques used to obtain unauthorized access to or sabotage security systems change frequently and are often not recognized until after an attack, we may be unable to anticipate the techniques or implement adequate preventative measures, thereby exposing us to material adverse effect on our business, operations and financial condition. We use Solarwinds products, including those compromised by the security breach Solarwinds announced on December 14, 2020. Although we do not believe our system was compromised, and have patched the Solarwinds products, we remain susceptible to security breaches in the future.
We may incur significant costs in an effort to detect and prevent security breaches and other security-related incidents. In the event of an actual or perceived security breach, we could be required to expend significant capital and other resources to mitigate, notify third parties of, and otherwise address, the breach and its root cause and to take steps to prevent further breaches. Claims relating to an actual or perceived security breach may not be adequately covered by our insurance and may result in increased insurance costs or insurance not being available to us at all.
Risks Relating to Our Financial Position and Capital Needs
We have a history of losses and have only achieved profitability intermittently. We cannot be certain that we will attain or sustain profitability in the future.
We have incurred losses since our inception in 2000. While we were profitable between 2013 and 2015, we had a net loss of $51.9 million for the year ended and an accumulated deficit of $314.7 million as of December 31, 2020. Our ability to attain or sustain profitability depends on numerous factors, many of which are out of our control, including continued RAIN adoption and us maintaining or growing our market share. We expect significant expenses to support operations, product development and business and headcount expansion in sales, engineering, and marketing and may, for periods of time, choose to invest to grow the market and our share, reduce costs, improve our efficiencies or shorten our supply chain. If we fail to increase our revenue or manage our expenses, or if our investments in growing the market or our market share do not succeed, then we may not attain or sustain profitability in the future.
We have a history of significant fluctuations in our quarterly and annual operating results.
You should consider our business and its prospects in light of the risks and difficulties we encounter in the uncertain and rapidly evolving RAIN market. Because this market is new, large and evolving, predicting its growth rate and ultimate size is difficult. The rapidly evolving nature of the markets in which we sell our products, as well as other factors that are beyond our control, reduce our ability to accurately gauge our future prospects and forecast our quarterly or annual performance. If endpoint IC sales exceed expectations or if we reduce prices to win a large opportunity or in response to competition, then our revenue and profitability may be positively affected, but gross margins may be negatively affected. If research analysts or investors view our decisions negatively, the trading price of our common stock could decline.
Historically, our success predicting future sales of our products and platform has been limited. End users drive demand for our products, but we sell nearly all our products through channel partners so our ability to forecast end-user demand is limited. We rely on those same channel partners to integrate our products with end-user information systems and this integration has been uneven and unpredictable in scope, timing and implementation. Also, RAIN-based systems often require time-consuming proofs-of-concepts and other steps such
28
as designing and implementing new business processes, which make sales of our products difficult to forecast. Partly as a consequence, in the past, both we and other industry participants have at times overestimated the RAIN market size and growth rates, then failed to meet expectations.
Our history shows sales volatility and highlights our limited ability to forecast sales. For example, in 2016 our endpoint IC sales exceeded both our expectations and those of our industry’s analysts due in large part to several coincident large end-user deployments. Then, in the latter part of 2017 and in early 2018, the pace of endpoint IC unit-volume growth slowed relative to 2016, we believe due to multiple factors including, but not limited to, delays in new deployments and in planned expansions at several large retailers as well as a correction in our endpoint IC channel inventory. Then, in the latter part of 2018 and in 2019, due to shorter lead times for our endpoint ICs, we were increasingly receiving orders and shipping the ordered products within the same quarter. Those shortened lead times decreased our ability to predict both optimal inventory and order volume for a quarter. Then, in early 2020, Covid-19 introduced even greater uncertainty in our business, and its full scope and duration remain unpredictable.
We expect that for the foreseeable future our visibility to future sales, including volumes and prices, will continue to be limited. Our poor visibility may cause fluctuations, particularly on a quarterly basis, in our actual operating results and in differences between our expected and actual operating results.
Many factors, most of which are outside our control, may cause or contribute to fluctuations in our quarterly and annual operating results. These fluctuations make financial planning and forecasting difficult. In addition, these fluctuations may cause unanticipated decreases in our available cash, which could negatively affect our business and prospects. Material factors that contribute to fluctuations in our operating results and revenue include:
|
|
• |
the impact of Covid-19 on macroeconomic conditions, our business and our customers, end-users, suppliers and other business partners; |
|
|
• |
variations in RAIN adoption and deployment delays by end users; |
|
|
• |
fluctuations in demand for our products or platform, including by tag manufacturers and other significant customers on which we rely for a substantial portion of our revenue; |
|
|
• |
fluctuations in the availability or supply of our products; |
|
|
• |
variations in the quality of our products and return rates; |
|
|
• |
delays in new-product introductions; |
|
|
• |
decreases in selling prices for our products; |
|
|
• |
delays in our product-shipment timing, customer or end-user sales or deployment cycles, or work performed under development contracts; |
|
|
• |
intellectual property disputes involving us, our customers, end users or other participants in our industry; |
|
|
• |
adverse outcomes of litigation or governmental proceedings; |
|
|
• |
timing variability in product introductions, enhancements, services, and technologies by us and our competitors and market acceptance of these new or enhanced products, services and technologies; |
|
|
• |
unanticipated excess or obsolete inventory as a result of supply-chain mismanagement, new-product introduction, quality issues or otherwise; |
|
|
• |
changes in the amount and timing of our operating costs, including those related to the expansion of our business, operations and infrastructure; |
|
|
• |
changes in business cycles or seasonal fluctuations that may affect the markets in which we sell; |
|
|
• |
changes in industry standards or specifications, or changes in government regulations, relating to RAIN, or to our products or our platform; |
|
|
• |
late, delayed or cancelled payments from our customers; and |
|
|
• |
unanticipated impairment of long-lived assets and goodwill. |
29
A substantial portion of our operating expenses are fixed for the short term, and as a result, fluctuations in revenue or unanticipated expenses can have a material and immediate impact on our profitability and negatively affect our operating results, which could cause the price of our common stock to decline.
Risks Relating to U.S. Federal Income Tax
Our ability to use net operating losses to offset future taxable income may be limited.
As of December 31, 2020, we had federal net operating loss carryforwards, or NOLs, of $213.5 million and federal research and development credit carryforwards of $14.0 million which we may use to reduce future taxable income or offset income taxes due. We have established a valuation allowance against the carrying value of these deferred tax assets. The tax loss and research and development credit carryforwards began expiring in 2020. Insufficient future taxable income will adversely affect our ability to utilize these NOLs and credit carryforwards. Reductions in corporate tax rates may also reduce our ability to utilize the NOLs.
Under Sections 382 and 383 of the U.S. Internal Revenue Code, or the Code, a corporation that experiences a more-than 50% ownership change over a three-year testing period is limited in its ability to use its pre-change NOLs and other tax assets to offset future taxable income or income taxes. Our existing NOLs and credit carryforwards may be subject to limitations arising from previous ownership changes; if we undergo a future ownership change then our ability to use our NOLs and credit carryforwards could be further limited by Sections 382 and 383 of the Code. Future changes in our stock ownership, the causes of which may be outside our control, could result in an ownership change under Sections 382 and 383 of the Code. Our NOLs may also be impaired under state law. As a result of these limitations, we may not be able to utilize a material portion of, or possibly any of, the NOLs and credit carryforwards.
We could be subject to additional income tax liabilities.
We are subject to income taxes in the United States and certain foreign jurisdictions. During the ordinary course of business we use significant judgment in evaluating our worldwide income-tax obligations and we conduct many transactions for which the ultimate tax determination is uncertain. Additionally, our effective tax rates could be adversely affected by earnings being lower than anticipated in countries where we have lower statutory rates and higher than anticipated in countries where we have higher statutory rates, by changes in currency exchange rates, by changes in the valuation of our deferred tax assets and liabilities or by changes in the relevant tax, accounting and other laws, regulations, principles and interpretations. We are subject to audit in various jurisdictions and these jurisdictions may assess additional income tax against us. Although we believe our tax determinations are proper, the final determination of any tax audits and possible litigation could be materially different from our historical income-tax provisions and accruals. The results of an audit or litigation could have a material effect on our operating results or cash flows in the period or periods for which that determination is made.
Taxing authorities may successfully assert that we should have collected or in the future should collect sales and use, value-added or similar taxes, and we could be subject to liability with respect to past or future sales, any of which could negatively affect our operating results.
We do not collect sales and use, value-added or similar taxes in all jurisdictions in which we have sales, based on our belief that such taxes are either not applicable or an exemption from such taxes applies. Sales and use, value-added and similar tax laws and rates vary greatly by jurisdiction. Certain jurisdictions in which we do not collect such taxes may assert that such taxes are applicable, which could result in tax assessments, penalties and interest, and we may be required to collect such taxes in the future, including as a result of a change in law. Such tax assessments, penalties and interest or future requirements may negatively affect our operating results.
30
Risks Relating to Our Financial Reporting and Disclosure
We are subject to additional regulatory compliance requirements, including Section 404 of the Sarbanes-Oxley Act of 2002. If we fail to maintain an effective system of internal controls, we may not be able to accurately report our consolidated financial results or prevent fraud. We previously identified a material weakness in our internal control over financial reporting and cannot guarantee we will not have a future material weakness.
We have a short history as a public company. Although our management team and other company personnel devote substantial time to regulatory compliance, we may not effectively or efficiently manage our maturation as a public company. Additionally, we have incurred and will continue to incur significant legal, accounting and other expenses related to compliance with laws, regulations and standards applicable to public companies.
We expect rules and regulations such as the Sarbanes-Oxley Act of 2002, or the Sarbanes-Oxley Act, to continue increasing the time and costs we must devote to compliance as well as to other activities. For example, Section 404 of the Sarbanes-Oxley Act, or Section 404, requires management to report on, and after we no longer qualify as an emerging growth company that our independent registered public accounting firm attest to, the effectiveness of our internal controls over financial reporting. Effective internal controls are necessary for us to provide reliable financial reports and prevent fraud. Section 404 compliance will continue to divert resources and take significant time and effort. We may be unable to successfully complete the procedures, certifications and attestation requirements of Section 404 in a timely manner. We or our independent registered public accounting firm may find internal controls that need improvement or may uncover a material weakness. A material weakness, even if quickly remedied, could reduce the market’s confidence in our financial statements and harm our stock price. Any inability to provide reliable financial reports or prevent fraud could harm our business.
We may be unable to effectively implement, or effectively implement in a timely manner, the controls and employee training necessary to ensure continued compliance with the Sarbanes-Oxley Act and other regulatory and reporting requirements. In addition, the Sarbanes-Oxley Act may be modified, supplemented or amended from time to time, in which case implementing the requisite changes may take us significant time and may require additional controls and employee training. Our growth will challenge our ability to maintain these internal control and disclosure standards. If we fail to successfully complete the procedures, certifications and attestation requirements of Section 404, or if our chief executive officer, chief financial officer or independent registered public accounting firm determine that our internal control over financial reporting is not effective as defined under Section 404, we could be subject to sanctions or investigations by the SEC or by other regulatory authorities. Investor perceptions of our company may suffer, likely causing a decline in our stock price. We may not be able to fully comply with the requirements of the Sarbanes-Oxley Act or management or our independent registered public accounting firm may conclude that our internal controls will not be effective in future periods. Regardless of compliance with Section 404, any failure of our internal controls could have a material adverse effect on our stated operating results and harm our reputation.
A material weakness is a deficiency, or a combination of deficiencies, in internal controls over financial reporting. A consequence of a material weakness is a reasonable possibility that a material misstatement in our annual or interim consolidated financial statements will not be prevented or detected on a timely basis.
In the course of preparing our consolidated financial statements in prior years, we, in conjunction with our independent registered public accounting firm, identified errors which, combined with other identified control deficiencies, were considered to indicate a material weakness in our internal control over financial reporting. These errors related to accounting and financial disclosure of complex accounting matters related to the cash flow statement presentation of lease incentives in our consolidated interim financial statements for the nine months ended September 30, 2015. In 2016, we identified that we did not reflect the correction of the identified error in our consolidated interim financial statements for the nine months ended September 30, 2015 on the statement of cash flows in our Quarterly Report on Form 10-Q filed with the SEC on November 7, 2016.
We remediated this material weakness as of December 31, 2018, including increasing the depth and experience in our accounting and finance organization, as well as designing and implementing improved processes and internal controls. However, our remediation may not be effective in future periods or may not prevent other material weaknesses or significant deficiencies in our internal control over financial reporting from arising in the future.
31
If we fail to retain finance personnel or fail to maintain our financial reporting systems and infrastructure, we may be unable to timely and accurately report our financial results or comply with the requirements of being a public company, including compliance with the Sarbanes-Oxley Act and SEC reporting requirements, which in turn could significantly harm our reputation and our business.
We have hired employees with financial reporting and Sarbanes-Oxley Act compliance expertise. Our inability to retain these employees could adversely impact our ability to timely and accurately prepare and file our financial statements, as well as adversely affect our future financial statements because new employees need time and training to learn our business and operating procedures. If our finance and accounting organization is unable, for any reason, to meet the demands of being a public company then the quality and timeliness of our financial reporting may suffer, which could result in errors, filing delays and/or material weaknesses in our internal controls. The consequences of errors or delays in our reported financial statements could cause the trading price of our stock to decline and could harm our business, operating results and financial condition.
As an emerging growth company within the meaning of the Securities Act, we utilize certain modified disclosure requirements, and those requirements may make our common stock less attractive to investors.
We are an emerging growth company, and for as long as we remain an emerging growth company we may choose to take advantage of exemptions from some reporting requirements applicable to other public companies but not to emerging growth companies, including:
|
|
• |
not being required to have our independent registered public accounting firm audit our internal control over financial reporting under Section 404 of the Sarbanes-Oxley Act; |
|
|
• |
reduced disclosure obligations regarding executive compensation in our periodic reports and proxy statements; and |
|
|
• |
exemptions from the requirements to hold a nonbinding advisory vote on executive compensation and receive stockholder approval of any golden parachute payments not previously approved. |
We plan in our filings with the SEC to continue to use the modified disclosure requirements available to emerging growth companies. As a result, our stockholders may not have access to certain information they may deem important.
We can remain an emerging growth company until the earliest of:
|
|
• |
December 31, 2021; |
|
|
• |
the last day of the first fiscal year in which our annual gross revenue exceeds $1 billion; |
|
|
• |
the date that we become a “large accelerated filer” as defined in Rule 12b-2 under the Exchange Act, which would occur if the market value of our common stock held by non-affiliates exceeds $700 million as of the last business day of our most recently completed second fiscal quarter; or |
|
|
• |
the date on which we have issued more than $1 billion in non-convertible debt during the preceding three-year period. |
We have incurred and, in the future, will incur higher costs by being a public company.
We have incurred significant legal, accounting and other costs associated with public-company reporting requirements. Those costs will increase as we transition to no-longer being an emerging growth company. For as long as we remain an emerging growth company, we will use the exemption from the requirement under Section 404 that our independent registered public accounting firm attest to the effectiveness of our internal control over financial reporting. At the time when our independent registered public accounting firm is required to assess our internal control over financial reporting, the cost of our compliance with Section 404 will increase. If we are unable to comply with those requirements of Section 404 applicable to us, or if we or our independent registered public accounting firm identify deficiencies in our internal control over financial reporting, we could incur sanctions or investigations by the SEC or other regulatory authorities which would require additional financial and management resources and further increase costs, all of which could cause the market price of our stock to decline.
32
We have and will continue to incur costs associated with recently adopted corporate governance requirements, including those of the SEC and The Nasdaq Global Select Market. We expect those governance requirements to lead to ongoing legal and financial costs and make some activities more time consuming and costly. We also expect those requirements to increase the difficulty and expense for us to obtain director and officer liability insurance, and we may need to accept reduced policy limits and coverage or pay substantially higher costs to obtain similar or higher coverage to what we have today. As a result, we may find it difficult to attract and retain qualified persons to serve on our board of directors or as executive officers or may need to pay higher compensation to attract and retain them. Although we monitor developments with respect to those requirements, we cannot predict or estimate the additional costs we may incur or the timing of such costs.
Risks Relating to Owning or Trading of Our Securities
The market price of our common stock has been and will likely continue to be volatile, and the value of your investment could decline significantly.
Since July 2016, when we sold shares of our common stock in our initial public offering through December 31, 2020, our stock price has ranged from $9.95 to $60.85. The following factors, in addition to general risks and other risks described in this report, may have a material effect on the trading price of our common stock:
|
|
• |
price and volume fluctuations in the overall stock market; |
|
|
• |
changes in operating performance, stock market valuations, and volatility in the market prices of other technology companies generally, or those in our industry in particular; |
|
|
• |
actual or anticipated quarterly variations in our results of operations or those of our competitors; |
|
|
• |
actual or anticipated changes in our growth rate relative to our competitors; |
|
|
• |
delays in end-user deployments of RAIN systems; |
|
|
• |
announcements by us or our competitors of acquisitions, new products, significant contracts, commercial relationships or capital commitments; |
|
|
• |
supply interruptions; |
|
|
• |
developments relating to intellectual property rights or in disputes relating to those rights; |
|
|
• |
our ability to develop and market new and enhanced products on a timely basis; |
|
|
• |
commencement of, or our involvement in, litigation; |
|
|
• |
changes in our board of directors or management; |
|
|
• |
changes in governmental regulations or in the status of our regulatory approvals; |
|
|
• |
unstable regional political and economic conditions; |
|
|
• |
the trading volume of our stock; |
|
|
• |
actual or perceived security breaches; |
|
|
• |
limited public float; |
|
|
• |
any future sales of our common stock or other securities; |
|
|
• |
financial analysts dropping or reducing their coverage of us; changes in financial estimates by analysts who do cover us; or our failure to meet analyst estimates or investor expectations; |
|
|
• |
fluctuations in the values of companies investors perceive to be comparable to us; and |
|
|
• |
the financial projections we may provide to the public, any changes in these projections or our failure to meet these projections. |
|
|
• |
general economic conditions and slow or negative growth of markets in which we operate. |
33
Technology company stocks like ours have experienced extreme price and volume fluctuations often unrelated or disproportionate to the operating performance of those companies. Securities class-action litigation is frequently instituted against companies whose stock prices decline significantly, as it was against us. The litigation against us causes substantial costs and a diversion of management’s attention and resources. For further information regarding this litigation risk, please refer to Note 11 of our consolidated financial statements included elsewhere in this report.
We may need to raise additional capital which may not be available on favorable terms, if at all, causing dilution to stockholders, restricting our operations or adversely affecting our ability to operate our business.
In the course of running our business we may need to raise capital, potentially diluting our stockholders. In December 2019, we issued and sold $86.3 million aggregate principal amount of 2.00% convertible senior notes due 2026, or the 2019 Notes, and we may in the future engage in additional equity, equity-linked or debt financings to secure additional funds. If unforeseen circumstances drive our financing needs, such as unforeseen expenditures or if our operating results are worse than we expect, then we may not be able to raise capital on favorable terms, if at all. Debt financing, if available, may include covenants limiting or restricting our ability to take specific actions such as incurring additional debt, expending capital or declaring dividends, or which impose financial covenants that limit our ability to achieve our business objectives. If we need but cannot raise additional capital on acceptable terms then we may not be able to meet our business objectives, our stock price may fall, and you may lose some or all of your investment.
Transactions relating to the 2019 Notes may affect our stock’s value.
If the 2019 Notes are converted by holders, then we have the ability under the indenture for the 2019 Notes to deliver cash, stock or any combination of cash or stock, at our election. If we elect to deliver stock, then doing so will dilute the ownership interests of our existing stockholders. Any sales in the public market of the stock issuable upon a conversion could negatively affect the price of our stock. Anticipated future conversions of the 2019 Notes into shares of our stock could depress the price of our stock. Certain holders of the 2019 Notes may also engage in short selling to hedge their position in the 2019 Notes, which could decrease the price of our stock.
In connection with the issuance of the 2019 Notes, we entered into privately negotiated capped-call transactions with financial counterparties. The capped-call transactions are generally designed to reduce potential dilution to our stock upon any conversion or settlement of the 2019 Notes or offset any cash payments we are required to make in excess of the principal amount of converted 2019 Notes, as the case may be, with such reduction or offset subject to a cap based on the cap price. From time to time, the financial counterparties to the capped calls may modify their hedge positions by entering into or unwinding various derivative transactions with respect to our stock or purchasing or selling our stock or other securities of ours in secondary market transactions prior to the maturity of the capped calls. This activity could cause a decrease in the market price of our stock.
For more information on the 2019 Notes and the capped-call transactions, see Note 7 of our consolidated financial statements included elsewhere in this report.
Our principal stockholders and management own a significant percentage of our stock and are able to exercise significant influence over matters subject to stockholder approval.
As of December 31, 2020, our executive officers, directors and principal stockholders, together with their respective affiliates, beneficially owned approximately 35.6% of our stock. As a result, our executive officers, directors and principal stockholders may be able to significantly influence, in their capacity as stockholders, matters requiring approval by our stockholders, including electing directors and approving mergers, acquisitions or other transactions. They may have interests that differ from yours and may vote in a way with which you disagree, and which may be adverse to your interests. This concentration of ownership could have the effect of delaying or preventing a change in our control or otherwise discouraging a potential acquirer from attempting to obtain control of us, which in turn could have a material adverse effect on our stock price and may prevent attempts by our stockholders to replace or remove our board of directors or management.
34
Servicing the 2019 Notes may require a significant amount of cash, and we may not have sufficient cash flow or the ability to raise the funds necessary to satisfy our obligations under the 2019 Notes, and our current and future indebtedness may limit our operating flexibility or otherwise affect our business.
Our ability to make scheduled payments of the principal of, to pay interest on or to refinance any current or future indebtedness, including the 2019 Notes, or to make cash payments in connection with any conversion of the 2019 Notes or upon any fundamental change if holders require us to repurchase their 2019 Notes for cash, depends on our future performance, which is subject to economic, financial, competitive and other factors beyond our control. Our business may not generate sufficient future cash from operations to service our indebtedness and make necessary capital expenditures. If we are unable to generate sufficient cash flow, we may be required to adopt one or more alternatives, such as selling assets, restructuring indebtedness or obtaining additional equity capital on terms that may be onerous or highly dilutive. Our ability to refinance any of our indebtedness, including the 2019 Notes, will depend on the capital markets and our financial condition at such time. We may not be able to engage in any of these activities or engage in these activities on desirable terms, which could result in us defaulting on our debt obligations. In addition, our existing and future indebtedness could have important consequences to our stockholders and significant effects on our business. For example, it could:
|
|
• |
make it more difficult for us to satisfy our debt obligations, including the 2019 Notes; |
|
|
• |
increase our vulnerability to general adverse economic and industry conditions; |
|
|
• |
require us to dedicate a substantial portion of our cash flow from operations to payments on our indebtedness, thereby reducing the cash available to run our business; |
|
|
• |
limit our flexibility in planning for, or reacting to, changes in our business or in the RAIN industry; |
|
|
• |
restrict us from exploiting business opportunities; |
|
|
• |
place us at a competitive disadvantage compared to our competitors that have less indebtedness; and |
|
|
• |
limit our availability to borrow additional funds for working capital, capital expenditures, acquisitions, debt service requirements, execution of our business strategy or for other purposes. |
Anti-takeover provisions in our charter documents and under Delaware or Washington law could make an acquisition of us difficult, limit attempts by our stockholders to replace or remove our current management and limit our stock price.
Provisions of our certificate of incorporation and our bylaws may delay or discourage transactions involving an actual or potential change in our control or change in our management, including transactions in which stockholders might otherwise receive a premium for their shares, or transactions that our stockholders might otherwise deem to be in their best interests. Therefore, these provisions could adversely affect our stock price. Among other things, our certificate of incorporation and bylaws:
|
|
• |
permit our board of directors to issue up to 5,000,000 shares of preferred stock, with any rights, preferences and privileges as they may designate; |
|
|
• |
provide that the authorized number of directors may be changed only by resolution of the board of directors; |
|
|
• |
provide that all vacancies, including newly created directorships, may, except as otherwise required by law, be filled by the affirmative vote of a majority of directors then in office, even if less than a quorum; |
|
|
• |
divide our board of directors into three classes (subject to gradual declassification beginning at the 2021 annual meeting of stockholders, such that our board of directors will be fully declassified beginning at the 2023 annual meeting of stockholders); |
|
|
• |
restrict the forum for certain litigation against us to Delaware; |
|
|
• |
require that any action taken by our stockholders be effected at a duly called annual or special meeting of stockholders and not by written consent; |
35
|
|
|
|
• |
provide that stockholders seeking to present proposals before a meeting of stockholders or to nominate candidates for election as directors at a meeting of stockholders must provide notice in writing in a timely manner, and also specify requirements as to the form and content of a stockholder’s notice; |
|
|
• |
do not provide for cumulative voting rights (therefore allowing the holders of a majority of the shares of common stock entitled to vote in any uncontested election of directors to elect all of the directors standing for election, if they should so choose); |
|
|
• |
provide that special meetings of our stockholders may be called only by the chair of the board, our chief executive officer or by the board of directors; and |
|
|
• |
provide that stockholders will be permitted to amend our bylaws only upon receiving at least two-thirds of the total votes entitled to be cast by holders of all outstanding shares then entitled to vote generally in the election of directors, voting together as a single class. |
In addition, because we are incorporated in Delaware, we are governed by the provisions of Section 203 of the Delaware General Corporation Law, which generally prohibits a Delaware corporation from engaging in any of a broad range of business combinations with any “interested” stockholder for a period of three years following the date on which the stockholder became an “interested” stockholder. Likewise, because our principal executive offices are located in Washington, the anti-takeover provisions of the Washington Business Corporation Act may apply to us under certain circumstances now or in the future. These provisions prohibit a “target corporation” from engaging in any of a broad range of business combinations with any stockholder constituting an “acquiring person” for a period of five years following the date on which the stockholder became an “acquiring person.”
Our bylaws provide that the Court of Chancery of the State of Delaware is the exclusive forum for substantially all disputes between us and our stockholders, which could limit our stockholders’ ability to obtain a favorable judicial forum for disputes with us or our directors, officers or employees.
Our bylaws provide that, unless we otherwise consent in writing, the Court of Chancery of the State of Delaware is the exclusive forum for any derivative action or proceeding brought on our behalf, any action asserting a breach of fiduciary duty, any action asserting a claim against us arising pursuant to the Delaware General Corporation Law, our certificate of incorporation or our bylaws or any action asserting a claim against us that is governed by the internal affairs doctrine. The choice of forum provision may limit stockholders’ ability to bring a claim in a judicial forum favorable for disputes with us or our directors, officers or other employees, which may discourage such lawsuits against us and our directors, officers and other employees. Alternatively, if a court were to find the choice of forum provision contained in our bylaws to be inapplicable or unenforceable in an action, we may incur additional costs associated with resolving such action in other jurisdictions, which could adversely affect our business and financial condition.
Item 1B. Unresolved Staff Comments
Not applicable.
Item 2. Properties
We have several operating leases for office space, which are summarized as of December 31, 2020 in the table below. We believe that our facilities are adequate for our current needs.
|
Location |
|
Purpose |
|
Approximate Square Feet |
|
|
Principal Lease Expiration Dates |
|
|
Seattle, Washington |
|
Corporate headquarters |
|
|
109,000 |
|
|
2026 |
|
Seattle, Washington |
|
Design laboratory |
|
|
11,000 |
|
|
2021 |
|
Shanghai, China |
|
General office space |
|
|
4,000 |
|
|
2021 |
We hold a lease for approximately 39,000 square feet of commercial office space in Seattle, Washington that expires in 2023. We have sublet the entirety of this office space through the expiration date. We also lease offices in Thailand. For more information about our lease commitments, please refer to Note 10 to our consolidated financial statements included elsewhere in this report.
36
Item 3. Legal Proceedings
In the normal course of business, we may be named as a party to various legal claims, actions and complaints. We cannot predict whether any resulting liability will have a material adverse effect on our financial position, results of operations, cash flows, market position or stock price.
Stockholder Litigation
Between July 2018 and December 2020, four class action complaints for violation of federal securities laws (one of which was subsequently voluntarily dismissed by the plaintiffs) and three shareholder derivative actions were filed against us and certain of our officers and, in the derivative actions, against certain of our directors. For further information on these complaints, please refer to Note 11 of our consolidated financial statements included elsewhere in this report.
Patent Litigation
On June 6, 2019, we filed a patent infringement lawsuit against a competitor, NXP, USA Inc., and on October 4, 2019, NXP USA, Inc. and its parent NXP Semiconductors N.V., filed a patent infringement lawsuit against Impinj. The outcome of this patent litigation remains uncertain, and we may file additional lawsuits against NXP USA, Inc. and/or its parent or they may file additional lawsuits against us. For further information on these lawsuits, please refer to Note 11 of our consolidated financial statements included elsewhere in this report.
Item 4. Mine Safety Disclosures
Not applicable.
37
PART II
Item 5. Market for Registrant’s Common Equity, Related Stockholder Matters and Issuer Purchases of Equity Securities
Market Information
Our common stock has traded on The Nasdaq Global Select Market under the symbol “PI” since July 21, 2016.
Holders of Record
As of February 5, 2021, there were 55 holders of record of our common stock. The actual number of stockholders is greater than the number of holders of record and includes stockholders who are beneficial owners but whose shares are held in street name by brokers and other nominees. The number of holders of record also does not include stockholders whose shares may be held in trust by other entities.
Dividends
We have never declared or paid a cash dividend on our common stock and we intend to retain all available funds and any future earnings to fund the development and growth of our business. We therefore do not anticipate paying any cash dividends on our common stock for the foreseeable future. In addition, future debt instruments, if any, may materially restrict our ability to pay dividends on our common stock. Any future determination to pay dividends on our common stock will depend at least on our results of operations, our financial condition and liquidity requirements, restrictions that may be imposed by applicable law or by contracts, and any other factors that our board of directors may consider relevant.
38
Performance Graph
The following graph compares our cumulative total stockholder return on Impinj’s common stock with the NASDAQ Composite Index and the Philadelphia Semiconductor Index:
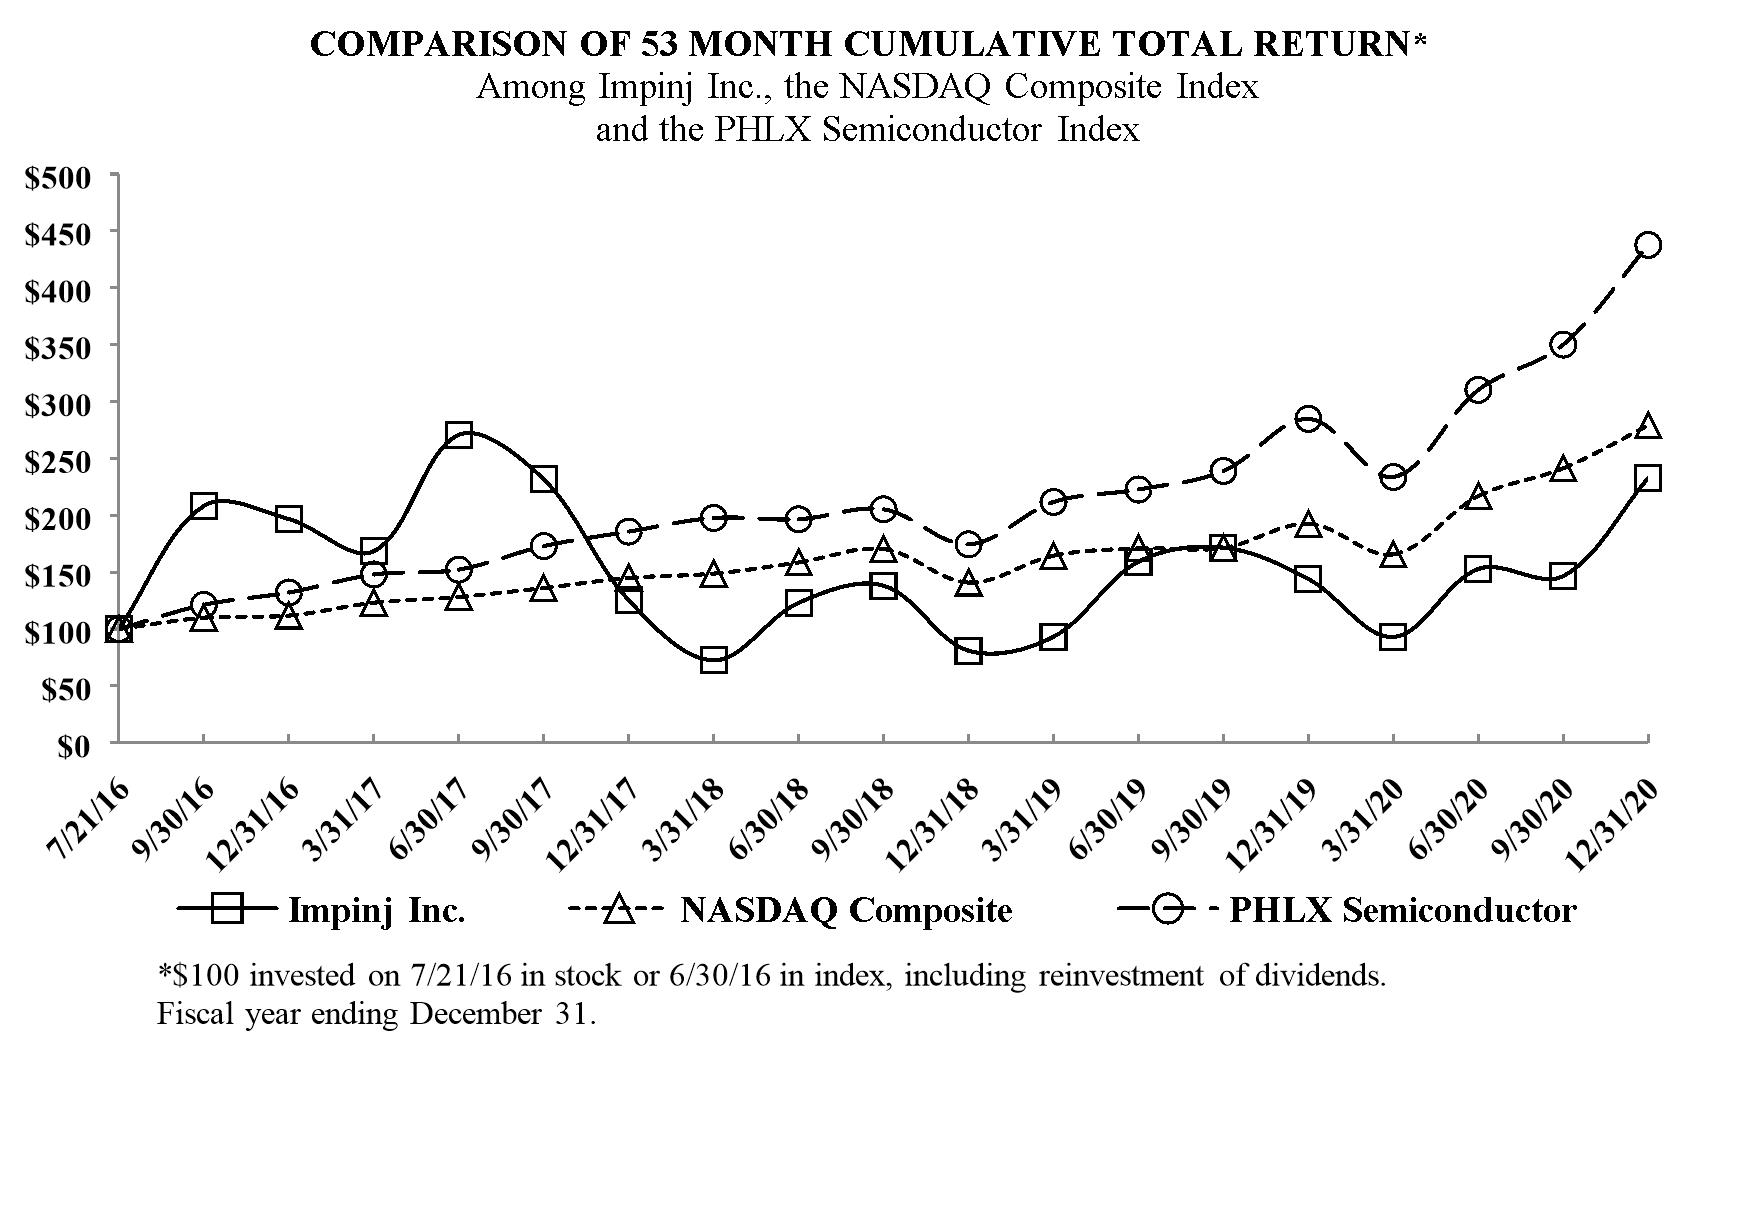
This graph covers the period from July 21, 2016, using the closing price for the first day of trading immediately following the effectiveness of our initial public offering per SEC regulations, through December 31, 2020. This graph assumes that the value of the investment in Impinj’s common stock and each index (including reinvestment of dividends) was $100 on July 21, 2016.
39
Item 6. Selected Financial Data
You should read the selected financial data set forth below in conjunction with the information in “Management’s Discussion and Analysis of Financial Condition and Results of Operations”, our audited consolidated financial statements and related notes included elsewhere in this report and our previous financial statements, the latter not included in this report.
|
|
|
|
|
|||||||||||||||||
|
|
|
Year Ended December 31, |
|
|||||||||||||||||
|
|
|
2020 |
|
|
2019 |
|
|
2018 |
|
|
2017 |
|
|
2016 |
|
|||||
|
|
|
(in thousands, except per share data) |
|
|||||||||||||||||
|
Statements of Operations Data: |
|
|
|
|
|
|
|
|
|
|
|
|
|
|
|
|
|
|
|
|
|
Revenue |
|
$ |
138,923 |
|
|
$ |
152,836 |
|
|
$ |
122,633 |
|
|
$ |
125,300 |
|
|
$ |
112,287 |
|
|
Cost of revenue |
|
|
73,783 |
|
|
|
78,834 |
|
|
|
64,352 |
|
|
|
60,359 |
|
|
|
52,834 |
|
|
Gross profit |
|
|
65,140 |
|
|
|
74,002 |
|
|
|
58,281 |
|
|
|
64,941 |
|
|
|
59,453 |
|
|
Operating expenses: |
|
|
|
|
|
|
|
|
|
|
|
|
|
|
|
|
|
|
|
|
|
Research and development expense |
|
|
48,590 |
|
|
|
38,880 |
|
|
|
34,168 |
|
|
|
32,220 |
|
|
|
25,185 |
|
|
Sales and marketing expense |
|
|
28,663 |
|
|
|
32,642 |
|
|
|
32,934 |
|
|
|
31,579 |
|
|
|
22,330 |
|
|
General and administrative expense |
|
|
34,958 |
|
|
|
24,141 |
|
|
|
22,299 |
|
|
|
18,161 |
|
|
|
12,426 |
|
|
Restructuring costs |
|
|
— |
|
|
|
— |
|
|
|
3,749 |
|
|
|
— |
|
|
|
— |
|
|
Total operating expenses |
|
|
112,211 |
|
|
|
95,663 |
|
|
|
93,150 |
|
|
|
81,960 |
|
|
|
59,941 |
|
|
Income (loss) from operations |
|
|
(47,071 |
) |
|
|
(21,661 |
) |
|
|
(34,869 |
) |
|
|
(17,019 |
) |
|
|
(488 |
) |
|
Other income, net |
|
|
650 |
|
|
|
1,242 |
|
|
|
808 |
|
|
|
508 |
|
|
|
616 |
|
|
Interest expense |
|
|
(5,413 |
) |
|
|
(1,794 |
) |
|
|
(1,403 |
) |
|
|
(908 |
) |
|
|
(1,633 |
) |
|
Loss on debt extinguishment |
|
|
— |
|
|
|
(576 |
) |
|
|
— |
|
|
|
— |
|
|
|
— |
|
|
Income (loss) before income taxes |
|
|
(51,834 |
) |
|
|
(22,789 |
) |
|
|
(35,464 |
) |
|
|
(17,419 |
) |
|
|
(1,505 |
) |
|
Income tax benefit (expense) |
|
|
(89 |
) |
|
|
(198 |
) |
|
|
233 |
|
|
|
97 |
|
|
|
(168 |
) |
|
Net income (loss) |
|
|
(51,923 |
) |
|
|
(22,987 |
) |
|
|
(35,231 |
) |
|
|
(17,322 |
) |
|
|
(1,673 |
) |
|
Less: Accretion of preferred stock |
|
|
— |
|
|
|
— |
|
|
|
— |
|
|
|
— |
|
|
|
(6,258 |
) |
|
Net loss attributable to common stockholders |
|
$ |
(51,923 |
) |
|
$ |
(22,987 |
) |
|
$ |
(35,231 |
) |
|
$ |
(17,322 |
) |
|
$ |
(7,931 |
) |
|
Net loss per share attributable to common stockholders — basic and diluted |
|
$ |
(2.28 |
) |
|
$ |
(1.05 |
) |
|
$ |
(1.65 |
) |
|
$ |
(0.84 |
) |
|
$ |
(0.74 |
) |
|
Weighted-average shares used to compute net loss per share attributable to common stockholders — basic and diluted |
|
|
22,819 |
|
|
|
21,847 |
|
|
|
21,334 |
|
|
|
20,680 |
|
|
|
10,778 |
|
|
|
|
As of December 31, |
|
|||||||||||||||||
|
|
|
2020 |
|
|
2019 |
|
|
2018 |
|
|
2017 |
|
|
2016 |
|
|||||
|
|
|
(in thousands) |
|
|||||||||||||||||
|
Balance Sheet Data (1): |
|
|
|
|
|
|
|
|
|
|
|
|
|
|
|
|
|
|
|
|
|
Cash, cash equivalents and short-term investments |
|
$ |
106,089 |
|
|
$ |
116,495 |
|
|
$ |
56,073 |
|
|
$ |
58,116 |
|
|
$ |
100,541 |
|
|
Working capital |
|
|
143,771 |
|
|
|
157,272 |
|
|
|
98,189 |
|
|
|
109,879 |
|
|
|
123,345 |
|
|
Total assets |
|
|
207,616 |
|
|
|
215,046 |
|
|
|
145,069 |
|
|
|
152,034 |
|
|
|
167,536 |
|
|
Total long-term debt |
|
|
54,556 |
|
|
|
50,876 |
|
|
|
23,563 |
|
|
|
9,588 |
|
|
|
12,265 |
|
|
Accumulated deficit |
|
|
(314,666 |
) |
|
|
(262,743 |
) |
|
|
(239,756 |
) |
|
|
(204,525 |
) |
|
|
(187,203 |
) |
|
Total stockholders’ equity (deficit) |
|
$ |
109,119 |
|
|
$ |
125,239 |
|
|
$ |
97,883 |
|
|
$ |
118,942 |
|
|
$ |
124,023 |
|
|
(1) The summary balance sheet data for the year ended December 31, 2020 and 2019 reflects the adoption of Accounting Standard Update (“ASU”) No. 2016-02, Leases (“Topic 842”). The summary balance sheets for the years ended December 2018, 2017 and 2016 does not reflect the adoption of Topic 842. |
|
|||||||||||||||||||
40
Item 7. Management’s Discussion and Analysis of Financial Condition and Results of Operations
You should read the following discussion and analysis together with our consolidated financial statements and the related notes to those statements included elsewhere in this report. This discussion contains forward-looking statements that involve risks and uncertainties. As a result of many factors, such as those set forth under “Risk Factors” and elsewhere in this report, our actual results may differ materially from those anticipated in these forward-looking statements.
Overview
Our vision is a boundless Internet of Things, or IoT. We are driving a future in which everyday physical items are wirelessly connected to digital counterparts, or digital twins, in the cloud, and in which businesses and people access information about an item from its digital twin. Our mission is to connect every thing. We deliver a platform that powers item-to-cloud connectivity, and on which enterprise solution providers innovate IoT whole products.
Today, we deliver the identity, location and authenticity of billions of physical items. We believe our future is extending that delivery to trillions of physical items and enabling ubiquitous access to cloud-based digital twins of those items, each storing an item’s ownership, history and links. We believe the item-to-cloud connectivity that our platform will deliver will enhance businesses efficiencies and commerce and, ultimately, improve peoples’ lives.
Our platform, which comprises multiple product families wirelessly connects individual items and delivers data about the connected items to business and consumer applications enabled by our partner network. We link the products within our platform to deliver capabilities and performance that surpasses mix-and-match solutions built from competitor products.
We and our partners connect the items via a miniature radio chip embedded in the item or in its packaging, reading and delivering each item’s identity, location and authenticity. To date, we have enabled connectivity to nearly 50 billion items, enabling businesses and consumers to derive timely information from those connected items.
Our platform uses RAIN, a type of radio-frequency identification, or RFID, technology we pioneered. We spearheaded development of the RAIN radio standard, lobbied governments to allocate frequency spectrum and cofounded the RAIN Alliance that today has more than 160 member companies. Our industry uses free spectrum in 78 countries encompassing roughly 96.5% of the world’s GDP and has connected many tens of billions of items to date. We believe RAIN’s capabilities – in particular, endpoint ICs with serialized identifiers, 30-foot range reading up to 1000 items per second without line-of-sight, radio-frequency energy harvesting for battery-free operation, essentially unlimited life and, in the future, cryptographic item authentication – position RAIN to be the leading item-to-cloud connectivity technology for the IoT.
Factors Affecting Our Performance
Covid-19
We are actively monitoring and mitigating the impacts of Covid-19 in all aspects of our business, including for our employees, suppliers, partners and end users.
For our endpoint IC business, forecasting was already difficult without Covid-19, because we sell our ICs to inlay partners and therefore have limited visibility to end-user demand. The myriad uncertainties that Covid-19 has introduced, especially at retail end users contending with store closures and reduced customer traffic, have exacerbated that forecasting difficulty. Covid-19’s impact has been further complicated by countries reopening at different rates, with some seemingly able to manage subsequent outbreaks and others not. Covid-19 has also caused uncertain long-term shifts, mostly negative, in other industries important to us besides retail apparel, such as aviation and sports. Even in supply chain and logistics, or SC&L, which has seen shipment volumes surge, end users have been reticent to deploy new technologies. Consequently, Covid-19 negatively impacted our 2020 endpoint IC demand. Additionally, although we introduced our new Impinj M700 in 2020 and it was in full production by the end of 2020, we saw a slower demand ramp relative to our expectations. Due to overall endpoint IC demand decline, we remain uncertain of its impact in 2021 or beyond.
41
For our systems business, Covid-19 delayed pilots and deployments. These delays were due in some cases to businesses being closed by local regulations and in others by reduced or deferred capital expenditures. The delays impacted our 2020 operating results and we expect those impacts will persist into 2021. Some end users have accelerated their investments in business-process modernization technologies like RAIN during the pandemic, but even in those cases, Covid-19 can delay deployments for reasons of health and safety, product and labor availability, and store closures. Consequently, although we see evidence of continued demand for RAIN systems, the extent to which adoption will rebound in 2021 and the degree to which it withstands the negative impacts of Covid-19, remain unclear.
From an operations standpoint, Covid-19 caused some of our suppliers to temporarily shut down, operate at reduced capacity, or both. For the most part we navigated these closures and capacity shortfalls successfully. We also navigated shipping challenges due to reduced transport capacity, albeit with higher shipping costs.
Most of our facilities and employees are in Seattle, where government restrictions to slow Covid-19’s spread have impacted our business, albeit modestly. Almost all our employees, except for those essential few who must be in the office, are working from home. We are striving to minimize Covid-19’s impact on our operations. However, our first priority is, and will continue to be, our employees’ health and safety. Covid-19’s travel restrictions have also adversely affected our business, again modestly, by slowing new-product launches and typical sales activities. There can be no assurance that Covid-19’s impact on our employees or business activities in 2021 will remain modest. We may experience issues due to necessary changes in our business practices, to governmental action, or to difficulties responding to unanticipated events like a natural disaster. Increased remote working may result in privacy, data security and fraud risks. Our understanding of the legal and regulatory requirements, as well as the guidance from authorities, related to Covid-19 may be subject to future challenge, particularly as guidance evolves in response to future Covid-19 developments.
Despite Covid-19, we have continued investing in research and development and the long-term opportunities RAIN offers. Although we plan to continue making these investments in 2021, depending on the business impact from Covid-19, we may choose to slow or suspend our investments, for example in research and development, potentially impairing our ability to meet our long-term strategic objectives.
While the effects of Covid-19 and our responses to it negatively impacted our results of operations, cash flows and financial position for 2020, the uncertainty over its duration and the severity of its epidemiological, economic and operational impacts mean we cannot reasonably estimate the magnitude of its financial impact. The extent to which Covid-19 impacts our results will depend on future developments that are unpredictable, including actions we and others need to take to contain its spread and reduce its impact on public health.
For more information on Covid-19’s impact on our business, please refer to Part I, Item 1A (Risk Factors) of this report.
Investing for Growth
We have invested in, and plan to continue investing in, research and development to enhance and extend our platform, including enhancing existing products, introducing new products and tightening the platform linkages between our products. Although we sell our products into nearly all verticals, relying significantly on our partner channel, we are today focusing particular attention on retail self-checkout and loss prevention and SC&L portal and conveyor opportunities.
Most of our investments precede any sales benefit from the investment, and in some instances we may never see a benefit. The potential causes of the latter are many, including the market not being receptive to our product or sales approach, late or failed product development, personnel departures or other causes. We sometimes enter into arrangements with end users, suppliers or channel partners for them to fund a portion of our investment, but even in those instances the results of our investments remain uncertain, and in some cases we may be required to refund the investment if the development is unsuccessful or the market opportunity fails to materialize. In some instances, we delay or cancel investments without or until we obtain such funding. The outcome of an investment is almost always uncertain, and if our results do not meet expectations then our operating results, profitability and stock price may be adversely affected.
While our long-term plan to invest for growth remains unchanged, Covid-19 has introduced new uncertainty to our business. We will continue to monitor the impacts of Covid-19 on our supply chain, market and opportunities and adjust our investment strategy as appropriate.
42
Market Adoption
Our financial performance depends on the pace and scope of end-user adoption of our products in multiple industries, but especially in retail which is our largest market. Covid-19 has had, and we expect it to continue to have, a materially adverse impact on the retail industry. Covid-19 may also accelerate an ongoing shift in consumer shopping away from physical stores, which could adversely impact demand for endpoint ICs by retailers. The extent to which Covid-19 materially impacts the retail industry is unclear, as is the extent to which it will impact our product sales. Other industries that are potential future drivers of RAIN adoption have also been impacted by Covid-19, although the long-term impact on our business is unclear. For example, the aviation industry, which had proposed widespread luggage tagging, has been negatively impacted by Covid-19. By contrast, SC&L has experienced increased demand which could positively impact our financial performance if such industry further adopts RAIN technology. See the section captioned “Covid-19” for additional information.
The pace and scope of end-user adoption, slowed by Covid-19, remains uncertain, potentially causing large fluctuations in our operating results. For a historical example of the potential impact of those fluctuations, in 2015 and 2016 several major retailers commenced deployments that significantly increased our endpoint IC sales, lengthening our product lead times. In 2017 we invested in endpoint IC inventory to reduce those lead times, but in second-half 2017 the endpoint IC growth rate slowed, we believe was due primarily to delays in new deployments at several large retailers. That decelerating growth rate engendered an endpoint IC channel inventory correction that negatively impacted our operating results for several subsequent quarters. For another historical example, in late 2018 and in 2019 a large north American logistics provider deployed significant quantities of our gateway products, positively impacting our operating results for several quarters, and then transitioning to an operational phase in first-half 2020.
Given the uncertainties in our market, we cannot be certain that RAIN adoption will continue; that we will have appropriate product inventory; that we will not experience future product inventory shortfalls or overages; or that Covid-19 will not materially impact our business. We also cannot be certain that we will be able to maintain or grow our market share for any of our products, whether because of insufficient inventory, Covid-19, competitors copying our products, competition generally or for a host of other reasons, many of which are outside our control.
Regardless of the uneven pace of retail, SC&L and other industry adoption, we believe the underlying, long-term trend is continued RAIN adoption and as a result we have continued to invest in new products. In our endpoint IC business, in 2020 we introduced our new Impinj M700, which offers significant performance advantages and we believe will foster adoption. In our systems business, in 2020 we introduced our new Impinj R700 reader, which likewise offers significant performance advantages, and we believe will also foster adoption. Despite us being in full production with both products by the end of 2020, Covid-19 has impacted demand and the speed with which we were able ramp up production, and the pace of adoption has been slower than we had anticipated.
We sell our products through partners and distributors and have limited ability to determine end-user demand. Consequently, we may incorrectly forecast that demand or not identify market shifts in a timely fashion, potentially affecting our business adversely. If RAIN market adoption, and adoption of our products specifically, does not meet our expectations or if we are unable to meet partner or end-user volume or performance expectations, because of the impact of Covid-19 or otherwise, then our operating results and growth prospects will be adversely affected. If we reduce prices to win opportunities, then our gross margins may be negatively affected. In contrast, if our endpoint IC, reader IC, reader or gateway sales exceed expectations, then our revenue and profitability may be positively affected.
Timing and Complexity of End User Deployments
From 2010 to 2020, our endpoint IC sales volumes increased at a compounded annual growth rate of 25%. However, the pace and scope of RAIN adoption has been uneven and unpredictable. For example, our endpoint IC unit sales volumes increased significantly in 2016, declined in second-half 2017 and in first-half 2018, returned to growth in second-half 2018 and in 2019 (the latter albeit not at the same pace as in 2016), and then declined again in second- and third-quarter 2020 due to Covid-19. Short-term demand will remain unpredictable in scope and timing. Longer term, we believe our endpoint IC opportunity will continue to grow, but we cannot predict whether historical annual growth rates are indicative of the pace of future growth. Additionally, Covid-19 may cause end users to eliminate or significantly reduce or delay spending on RAIN-based solutions, impacting endpoint IC growth.
43
Our systems business relies disproportionally on large-scale deployments at discrete end users. The timing of those large deployments causes large variability in our systems revenue. For example, we generated 14% of total 2019 revenue from a North American logistics provider in connection with a project-based gateway deployment and we did not have a comparable new project-base revenue in 2020. Notably, Covid-19 has caused delays in some of our pending global system deployments as SIs, VARs and their end users’ business locations are temporarily closed, impacting our ability to replace project-based revenue in a timely fashion.
Finally, although we promote our platform as an integrated offering, we sell our products individually, and end users often use only certain of our products. For any given end-user solution, whether an end user chooses to deploy our entire platform or only a portion will also affect our operating results.
Average Selling Price
Our product ASPs fluctuate based on competitive pressures and the discounting we offer to win opportunities, but generally decline over time. We expect that trend to continue. Historically, we have been able to implement manufacturing and quality improvements that effectively reduce the per-unit cost of most of our products, as well as introduce newer and lower-cost products, but the timing of these cost reductions and product introductions fluctuates and may not materialize in any given quarter or year.
Seasonality
We typically renegotiate pricing with most of our endpoint IC OEMs with an effective date of the first quarter of the calendar year, reducing both revenue and gross margins in the first quarter compared to prior periods. The impact tends to decline in subsequent quarters as we reduce costs and, to the extent we can migrate our customers to newer, lower-cost products, adjust product mix. Endpoint IC volumes also tend to be lower in the fourth quarter than in the third quarter.
System sales tend to be stronger in the fourth quarter of the calendar year, and less strong in the first quarter. We believe this seasonality is due to the availability of residual funding for capital expenditures prior to the end of many customers’ fiscal years.
While, over the longer term, we expect these seasonal trends to continue, quarter-to-quarter variability in our revenue can be caused by a number of factors including uncertainty in demand and supply as a result of Covid-19, the timing of large deployments, competitor product availability as well as supply constraints, any or all of which can mask seasonality in any given year. These risks and uncertainties, as well as other risks and uncertainties that could cause our actual results to differ significantly from management’s expectations, are described in greater detail in the sections of this report captioned “Covid-19” and in Part II, Item 1A (Risk Factors).
Inventory Supply
From time to time we experience inventory overages or shortages, either due to us mis-estimating customer or end-user demand, constrained supplier manufacturing capacity or our product availability, fluctuations in our market, including competitor product availability, or the global economy, changes in regulations or tariffs or for a host of other reasons. These inventory dynamics can impact some or all of our products. High inventory levels can result in product obsolescence, increases in reserves or unexpected expenses that adversely affect our business. Low inventory levels can affect our ability to meet customer demand, lengthen lead times and potentially causing us to miss opportunities, lose market share and/or damage customer relationships, also adversely affecting our business. For example, in 2010 we experienced wafer shortages from TSMC relative to our submitted endpoint IC wafer purchase orders because of high worldwide demand for semiconductor foundry capacity. These shortages adversely affected our ability to meet our customers’ demand and, in some cases, caused customers to cancel orders, qualify alternative suppliers or purchase from our competitors. Our existing ICs use 200mm and 300mm wafers, with most of our volume still at 200mm, and some semiconductor industry analysts predict 200mm wafer demand to remain high throughout at least 2021.
44
Results of Operations
|
|
|
Year Ended December 31, |
|
|
2020 vs 2019 |
|
|
2019 vs 2018 |
|
|||||||||||
|
(in thousands, except percentages) |
|
2020 |
|
|
2019 |
|
|
2018 |
|
|
Change |
|
|
Change |
|
|||||
|
Revenue |
|
$ |
138,923 |
|
|
$ |
152,836 |
|
|
$ |
122,633 |
|
|
$ |
(13,913 |
) |
|
$ |
30,203 |
|
|
Gross profit |
|
$ |
65,140 |
|
|
$ |
74,002 |
|
|
$ |
58,281 |
|
|
$ |
(8,862 |
) |
|
$ |
15,721 |
|
|
Gross margin |
|
|
46.9 |
% |
|
|
48.4 |
% |
|
|
47.5 |
% |
|
|
(1.5 |
)% |
|
|
0.9 |
% |
|
Loss from operations |
|
$ |
(47,071 |
) |
|
$ |
(21,661 |
) |
|
$ |
(34,869 |
) |
|
$ |
(25,410 |
) |
|
$ |
13,208 |
|
Year ended December 31, 2020 compared with year ended December 31, 2019
Revenue and gross profit decreased due primarily to lower systems revenue, partially offset by higher endpoint IC revenue. Gross margin decreased due primarily to revenue mix with systems revenue comprising a smaller portion of our total revenue. Loss from operations increased due primarily to increased operating expenses and decreased gross profit. The increase in operating expenses was primarily due to increased stock-based compensation expense, litigation-settlement and related costs incurred in second-quarter 2020, and increased research and development personnel expenses, partially offset by decreased sales and marketing personnel expenses.
Year ended December 31, 2019 compared with year ended December 31, 2018
Revenue and gross profit increased from increased endpoint IC and systems revenue. Gross margin increased primarily due to revenue mix with systems revenue representing a larger portion of our total revenue, and from leverage derived from comparable overhead costs on increased revenue, partially offset by higher excess and obsolescence charges. Loss from operations decreased due to increased gross profit, partially offset by increased operating expenses. The increase in operating expenses was due to increased stock-based compensation expense and higher product development costs, partially offset by decreased restructuring costs and decreased personnel expenses.
Revenue
|
|
|
Year Ended December 31, |
|
|
2020 vs 2019 |
|
|
2019 vs 2018 |
|
|||||||||||
|
(in thousands) |
|
2020 |
|
|
2019 |
|
|
2018 |
|
|
Change |
|
|
Change |
|
|||||
|
Endpoint ICs |
|
$ |
102,326 |
|
|
$ |
97,657 |
|
|
$ |
84,974 |
|
|
$ |
4,669 |
|
|
$ |
12,683 |
|
|
Systems |
|
|
36,597 |
|
|
|
55,179 |
|
|
|
37,659 |
|
|
|
(18,582 |
) |
|
|
17,520 |
|
|
Total revenue |
|
$ |
138,923 |
|
|
$ |
152,836 |
|
|
$ |
122,633 |
|
|
$ |
(13,913 |
) |
|
$ |
30,203 |
|
We currently derive substantially all our revenue from sales of endpoint ICs, reader ICs, readers and gateways. We sell our endpoint ICs primarily to inlay manufacturers; our reader ICs primarily to OEMs and ODMs through distributors; and our readers and gateways to value-added resellers, or VARs, and system integrators, or SIs, primarily through distributors. We expect endpoint IC sales to represent the majority of our revenue for the foreseeable future.
Year ended December 31, 2020 compared with year ended December 31, 2019
Endpoint IC revenue increased $4.7 million, due primarily to a $7.0 million increase in shipment volumes, partially offset by a $2.3 million decrease due to lower ASPs. The ASP decrease was due primarily to our annual price negotiations as discussed above under “—Factors Affecting Our Performance—Seasonality”, partially offset by favorable product mix. The increase in shipment volumes was due primarily to growth in our customers’ underlying business before Covid-19 negatively impacted global retail apparel sales starting second-quarter 2020 and subsequent demand recovery in fourth-quarter 2020.
Systems revenue decreased $18.6 million, due primarily to decreases of $14.8 million in gateway revenue and $5.2 million in reader revenue, partially offset by a $1.3 million increase in reader IC revenue. Gateway revenue decreased due primarily to the North American logistics provider in connection with a project-based gateway deployment described above; reader revenue decreased due primarily to lower shipment volumes, in part caused by Covid-19 related delays in systems deployments; reader IC revenue increased primarily due to higher shipment volumes.
45
For more information, see the sections captioned “—Factors Affecting Our Performance—Covid-19” and “Risk Factors—Covid-19 has adversely affected our business, and the magnitude and duration of future Covid-19 effects on our financial position, results of operations, cash flows and business prospects are uncertain.”
Year ended December 31, 2019 compared with year ended December 31, 2018
Endpoint IC revenue increased $12.7 million, due primarily to a $19.5 million increase in shipment volumes, partially offset by a $3.6 million decrease due to lower ASPs and $3.2 million from the one-time product exchange we completed in the first quarter 2018. The ASP decrease was due primarily to our annual price negotiation as discussed above and, to a lesser extent, product mix.
Systems revenue increased $17.5 million, due primarily to increases of $16.5 million in gateway revenue and $3.2 million in reader revenue. These gateway and reader revenue increases were due primarily to increased shipment volumes, with gateway revenue favorably impacted by the North American logistics provider in connection with a project-based gateway deployment described above. The systems revenue increases were partially offset by a $2.1 million decrease in reader IC revenue due to both lower shipment volumes and ASPs.
Gross Profit and Gross Margin
|
|
|
Year Ended December 31, |
|
|
2020 vs 2019 |
|
|
2019 vs 2018 |
|
|||||||||||
|
(in thousands, except percentages) |
|
2020 |
|
|
2019 |
|
|
2018 |
|
|
Change |
|
|
Change |
|
|||||
|
Cost of revenue |
|
$ |
73,783 |
|
|
$ |
78,834 |
|
|
$ |
64,352 |
|
|
$ |
(5,051 |
) |
|
$ |
14,482 |
|
|
Gross profit |
|
$ |
65,140 |
|
|
$ |
74,002 |
|
|
$ |
58,281 |
|
|
$ |
(8,862 |
) |
|
$ |
15,721 |
|
|
Gross margin |
|
|
46.9 |
% |
|
|
48.4 |
% |
|
|
47.5 |
% |
|
|
(1.5 |
)% |
|
|
0.9 |
% |
Cost of revenue includes costs associated with manufacturing our endpoint ICs, reader ICs, readers and gateways, including direct materials and outsourced manufacturing costs as well as associated overhead costs such as logistics, quality control, planning and procurement. Cost of revenue also includes charges for excess and obsolescence and warranty costs. Our gross margin varies from period to period based on mix of endpoint IC and systems revenue, underlying product margins driven by changes in ASPs or costs, as well as from inventory excess and obsolescence charges.
Year ended December 31, 2020 compared with year ended December 31, 2019
Cost of revenue decreased $5.1 million, due primarily to decreased systems revenue partially offset by increased endpoint IC revenue. Gross margin decreased 1.5%, due primarily to revenue mix with systems revenue comprising a smaller portion of our total revenue. Inventory excess and obsolescence charges had an unfavorable net gross-margin impact of 2.2% in 2020.
Year ended December 31, 2019 compared with year ended December 31, 2018
Cost of revenue increased $14.5 million, due primarily to increased revenue of both endpoint ICs and systems and to a lesser extent higher excess and obsolescence charges. Gross margin increased 0.9% due primarily to revenue mix with systems revenue comprising a larger portion of our total revenue, as well as from leverage derived from comparable overhead costs on increased revenue, partially offset by higher excess and obsolescence charges. Inventory excess and obsolescence charges had an unfavorable net gross-margin impact of 1.7% in 2019.
Operating Expenses
Research and Development
|
|
|
Year Ended December 31, |
|
|
2020 vs 2019 |
|
|
2019 vs 2018 |
|
|||||||||||
|
(in thousands) |
|
2020 |
|
|
2019 |
|
|
2018 |
|
|
Change |
|
|
Change |
|
|||||
|
Research and development |
|
$ |
48,590 |
|
|
$ |
38,880 |
|
|
$ |
34,168 |
|
|
$ |
9,710 |
|
|
$ |
4,712 |
|
46
Research and development expense comprises primarily personnel expenses (salaries, benefits and other employee related costs) and stock-based compensation expense for our product-development personnel; prototype materials; other new-product development costs, including external consulting and service costs; and an allocated portion of infrastructure costs which include occupancy, depreciation and software costs. We expect research and development expense to increase in absolute dollars in future periods as we focus on new product development and introductions; however, we will continue to monitor the impacts of Covid-19 on our business and may adjust our research and development investment strategy as appropriate.
Year ended December 31, 2020 compared with year ended December 31, 2019
Research and development expense increased $9.7 million, due primarily to increases of $4.2 million in personnel expenses from higher headcount, $3.9 million in stock-based compensation expense from PSUs and an increased number of stock options and RSUs and $1.2 million in product development costs as a result of fluctuations in the timing of development activities and $589,000 in infrastructure costs from increased software costs.
Year ended December 31, 2019 compared with year ended December 31, 2018
Research and development expense increased $4.7 million, due primarily to increases of $2.8 million in stock-based compensation expense from PSUs and an increased number of stock options and RSUs, $778,000 in product development costs as a result of fluctuations in the timing of development activities, $554,000 in personnel expenses from a change in headcount mix and $463,000 in infrastructure costs.
Sales and Marketing
|
|
|
Year Ended December 31, |
|
|
2020 vs 2019 |
|
|
2019 vs 2018 |
|
|||||||||||
|
(in thousands) |
|
2020 |
|
|
2019 |
|
|
2018 |
|
|
Change |
|
|
Change |
|
|||||
|
Sales and marketing |
|
$ |
28,663 |
|
|
$ |
32,642 |
|
|
$ |
32,934 |
|
|
$ |
(3,979 |
) |
|
$ |
(292 |
) |
Sales and marketing expense comprises primarily personnel expenses (salaries, incentive sales compensation, or commission, benefits and other employee related costs) and stock-based compensation expense for our sales and marketing personnel; travel, advertising and promotional expenses; and an allocated portion of infrastructure costs which include occupancy, depreciation and software costs. We expect sales and marketing expense to remain approximately constant on an absolute dollar basis, except for incentive sales compensation which fluctuates as a function of revenue and travel-related expense which depends on Covid-19’s travel restrictions. In addition, we will continue to monitor the impacts of Covid-19 on our business and may adjust our sales and marketing expense as appropriate.
Year ended December 31, 2020 compared with year ended December 31, 2019
Sales and marketing expense decreased $4.0 million, due primarily to decreases of $3.3 million in personnel expenses from lower commission expense and, to a lesser extent, lower headcount, and $1.3 million from travel related expense due to Covid-19. These decreases were partially offset by a $ 516,000 increase in infrastructure costs from increased software costs.
Year ended December 31, 2019 compared with year ended December 31, 2018
Sales and marketing expense in 2019 remained comparable to 2018; we had a decrease of $1.3 million in personnel expense due to lower headcount and bonus expense partially offset by higher commission expense, and decreases of $354,000 in infrastructure costs and $312,000 in travel related expense. These decreases were offset by a $1.8 million increase in stock-based compensation expense from PSUs and an increased number of stock options and RSUs.
General and Administrative
|
|
|
Year Ended December 31, |
|
|
2020 vs 2019 |
|
|
2019 vs 2018 |
|
|||||||||||
|
(in thousands) |
|
2020 |
|
|
2019 |
|
|
2018 |
|
|
Change |
|
|
Change |
|
|||||
|
General and administrative |
|
$ |
34,958 |
|
|
$ |
24,141 |
|
|
$ |
22,299 |
|
|
$ |
10,817 |
|
|
$ |
1,842 |
|
47
General and administrative expense comprises primarily personnel expenses (salaries, benefits, and other employee related costs) and stock-based compensation expense for our executive, finance, human resources and information technology personnel; legal, accounting and other professional service fees; travel and insurance expense; and an allocated portion of infrastructure costs which include, occupancy, depreciation and software costs. We will continue to monitor the impacts of Covid-19 on our business and may adjust our general and administrative expense as appropriate.
Year ended December 31, 2020 compared with year ended December 31, 2019
General and administrative expense increased $10.8 million due primarily to increases of $5.4 million in the litigation settlement and related costs described above, $3.1 million in stock-based compensation expense from PSUs and an increased number of stock options and RSUs, $1.3 million in non-settlement related legal fees and $723,000 in personnel expenses from higher headcount.
Year ended December 31, 2019 compared with year ended December 31, 2018
General and administrative expense increased $1.8 million, due primarily to an increase of $2.3 million in stock-based compensation from PSUs and an increased number of stock options and RSUs, partially offset by a $455,000 decrease in personnel expenses from lower bonus expense. Our professional service fees in 2019 remained comparable to 2018 with higher non-settlement related legal fees offset by no third-party investigation costs in 2019 in connection with the complaint filed by a former employee.
Restructuring costs
|
|
|
Year Ended December 31, |
|
|
2020 vs 2019 |
|
|
2019 vs 2018 |
|
|||||||||||
|
(in thousands) |
|
2020 |
|
|
2019 |
|
|
2018 |
|
|
Change |
|
|
Change |
|
|||||
|
Restructuring costs |
|
$ |
— |
|
|
$ |
— |
|
|
$ |
3,749 |
|
|
$ |
— |
|
|
$ |
(3,749 |
) |
On February 13, 2018, we initiated a restructuring plan to align our strategic and financial objectives and optimize our resources for long-term growth, including a reduction-in-force affecting approximately 9% of our employees, subleasing unused office space and closing some remote offices. The restructuring was substantially complete as of June 30, 2018. As a result of the restructuring, we recorded a $3.7 million restructuring charge in 2018.
Other Income, Net
|
|
|
Year Ended December 31, |
|
|
2020 vs 2019 |
|
|
2019 vs 2018 |
|
|||||||||||
|
(in thousands) |
|
2020 |
|
|
2019 |
|
|
2018 |
|
|
Change |
|
|
Change |
|
|||||
|
Other income, net |
|
$ |
650 |
|
|
$ |
1,242 |
|
|
$ |
808 |
|
|
$ |
(592 |
) |
|
$ |
434 |
|
Other income, net comprises primarily interest income on our short-term investments.
Year ended December 31, 2020 compared with year ended December 31, 2019
Other income, net decreased $592,000, due primarily to a lower interest rate on our short-term investments.
Year ended December 31, 2019 compared with year ended December 31, 2018
Other income, net increased $434,000, due primarily to increased interest income from higher average short-term-investments in 2019 compared to 2018.
Interest Expense
|
|
|
Year Ended December 31, |
|
|
2020 vs 2019 |
|
|
2019 vs 2018 |
|
|||||||||||
|
(in thousands) |
|
2020 |
|
|
2019 |
|
|
2018 |
|
|
Change |
|
|
Change |
|
|||||
|
Interest expense |
|
$ |
5,413 |
|
|
$ |
1,794 |
|
|
$ |
1,403 |
|
|
$ |
3,619 |
|
|
$ |
391 |
|
48
Interest expense comprises primarily cash interest, amortization of debt issuance costs and debt discount on our long-term debt.
Year ended December 31, 2020 compared with year ended December 31, 2019
Interest expense increased $3.6 million, due primarily to an increase in amortization of debt discount related to our subordinated convertible notes, or the 2019 Notes. For further information on the 2019 Notes, please refer to Note 7 to our consolidated financial statements included elsewhere in this report.
Year ended December 31, 2019 compared with year ended December 31, 2018
Interest expense increased $391,000 primarily due to higher average outstanding borrowings under our senior credit facility in 2019 compared to 2018.
Loss on Debt Extinguishment
|
|
|
Year Ended December 31, |
|
|
2020 vs 2019 |
|
|
2019 vs 2018 |
|
|||||||||||
|
(in thousands) |
|
2020 |
|
|
2019 |
|
|
2018 |
|
|
Change |
|
|
Change |
|
|||||
|
Loss on debt extinguishment |
|
$ |
— |
|
|
$ |
(576 |
) |
|
$ |
— |
|
|
$ |
576 |
|
|
$ |
(576 |
) |
In December 2019, we used $24.0 million of the net proceeds from the 2019 Notes to repay our senior credit facility in full, which was terminated pursuant to its terms. In connection with this repayment, we recorded a $576,000 loss on debt extinguishment, comprising a $470,000 prepayment penalty fees and a $106,000 write-off of unamortized debt issuance costs.
Income Tax Benefit (Expense)
|
|
|
Year Ended December 31, |
|
|
2020 vs 2019 |
|
|
2019 vs 2018 |
|
|||||||||||
|
(in thousands) |
|
2020 |
|
|
2019 |
|
|
2018 |
|
|
Change |
|
|
Change |
|
|||||
|
Income tax benefit (expense) |
|
$ |
(89 |
) |
|
$ |
(198 |
) |
|
$ |
233 |
|
|
$ |
109 |
|
|
$ |
(431 |
) |
We are subject to federal and state income taxes in the United States and foreign jurisdictions.
Year ended December 31, 2020 compared with year ended December 31, 2019
Income tax expense remained comparable to the prior period.
Year ended December 31, 2019 compared with year ended December 31, 2018
Income tax benefit for 2018 was primarily due to the enactment-date effects of the Tax Cuts and Jobs Act of 2017 that included adjusting deferred tax assets and liabilities.
Non-GAAP Financial Measures
Our key non-GAAP performance measures include adjusted EBITDA and non-GAAP net income (loss), as defined below. We use adjusted EBITDA and non-GAAP net income (loss) as key measures to understand and evaluate our core operating performance and trends, to prepare and approve our annual budget and to develop short- and long-term operating plans. We believe these measures provide useful information for period-to-period comparisons of our business to allow investors and others to understand and evaluate our operating results in the same manner as our management and board of directors. Our presentation of these non-GAAP financial measures is not meant to be considered in isolation or as a substitute for our financial results prepared in accordance with GAAP, and our non-GAAP measures may be different from similarly termed non-GAAP measures used by other companies.
49
Adjusted EBITDA
We define adjusted EBITDA as net income (loss) determined in accordance with GAAP, excluding, if applicable for the periods presented, the effects of stock-based compensation; depreciation; investigation costs; restructuring costs; settlement and related costs; other income, net; interest expense; loss on debt extinguishment; and income tax benefit (expense). In fourth-quarter 2019, we revised our definition of adjusted EBITDA to exclude loss on debt extinguishment incurred in connection with the December 2019 repayment of our senior credit facility. In second-quarter 2020, we revised our definition of adjusted EBITDA to exclude litigation settlement costs for the class-action and derivative lawsuits, including related costs. We have excluded these costs and expenses because we do not believe they reflect our core operations and us excluding them enables more consistent evaluation of our operating performance. Neither revision to the definition of adjusted EBITDA impacted adjusted EBITDA previously reported for prior periods preceding the revisions. The following table presents a reconciliation of net loss to adjusted EBITDA:
|
|
|
Year Ended December 31, |
|
|
2020 vs 2019 |
|
|
2019 vs 2018 |
|
|||||||||||
|
(in thousands) |
|
2020 |
|
|
2019 |
|
|
2018 |
|
|
Change |
|
|
Change |
|
|||||
|
Net loss |
|
$ |
(51,923 |
) |
|
$ |
(22,987 |
) |
|
$ |
(35,231 |
) |
|
$ |
(28,936 |
) |
|
$ |
12,244 |
|
|
Adjustments: |
|
|
|
|
|
|
|
|
|
|
|
|
|
|
|
|
|
|
|
|
|
Other income, net |
|
|
(650 |
) |
|
|
(1,242 |
) |
|
|
(808 |
) |
|
|
592 |
|
|
|
(434 |
) |
|
Interest expense |
|
|
5,413 |
|
|
|
1,794 |
|
|
|
1,403 |
|
|
|
3,619 |
|
|
|
391 |
|
|
Loss on debt extinguishment |
|
|
— |
|
|
|
576 |
|
|
|
— |
|
|
|
(576 |
) |
|
|
576 |
|
|
Income tax expense (benefits) |
|
|
89 |
|
|
|
198 |
|
|
|
(233 |
) |
|
|
(109 |
) |
|
|
431 |
|
|
Depreciation |
|
|
4,504 |
|
|
|
4,809 |
|
|
|
4,534 |
|
|
|
(305 |
) |
|
|
275 |
|
|
Stock-based compensation |
|
|
25,675 |
|
|
|
18,486 |
|
|
|
11,317 |
|
|
|
7,189 |
|
|
|
7,169 |
|
|
Restructuring costs |
|
|
— |
|
|
|
— |
|
|
|
3,749 |
|
|
|
- |
|
|
|
(3,749 |
) |
|
Investigation costs |
|
|
— |
|
|
|
— |
|
|
|
1,449 |
|
|
|
- |
|
|
|
(1,449 |
) |
|
Settlement and related costs |
|
|
5,359 |
|
|
|
— |
|
|
|
— |
|
|
|
5,359 |
|
|
|
— |
|
|
Adjusted EBITDA |
|
$ |
(11,533 |
) |
|
$ |
1,634 |
|
|
$ |
(13,820 |
) |
|
$ |
(18,526 |
) |
|
$ |
15,454 |
|
Non-GAAP Net Income (Loss)
We define non-GAAP net income (loss) as net income (loss), excluding, if applicable for the periods presented, the effects of stock-based compensation; depreciation; investigation costs; restructuring costs; settlement and related costs; amortization of debt discount related to the equity component of our convertible notes; and prepayment penalty on debt extinguishment. In fourth-quarter 2019, we revised our definition of non-GAAP net income (loss) to exclude the prepayment penalty on debt extinguishment incurred in connection with the December 2019 repayment of our senior credit facility and amortization of debt discount related to the equity component of the 2019 Notes. We have revised the prior period non-GAAP net income (loss) to conform to our current period presentation. In second-quarter 2020, we revised our definition of non-GAAP net income (loss) to exclude litigation settlement costs for the class-action and derivative lawsuits, including related costs. Excluding settlement and related costs did not impact non-GAAP net income (loss) previously reported for prior periods preceding the revision.
GAAP requires that certain convertible debt instruments that may be settled in cash on conversion be accounted for as separate liability and equity components in a manner that reflects our non-convertible debt borrowing rate. This accounting results in the debt component being treated as though it was issued at a discount, with the debt discount being amortized as additional non-cash interest expense over the debt instrument term using the effective interest method. As a result, we believe that excluding this non-cash interest expense attributable to the debt discount in calculating our non-GAAP net income (loss) is useful because this interest expense is not indicative of our ongoing operational performance.
50
The following table presents a reconciliation of net loss to non-GAAP net income (loss):
|
|
|
Year Ended December 31, |
|
|
2020 vs 2019 |
|
|
2019 vs 2018 |
|
|||||||||||
|
(in thousands) |
|
2020 |
|
|
2019 |
|
|
2018 |
|
|
Change |
|
|
Change |
|
|||||
|
Net loss |
|
$ |
(51,923 |
) |
|
$ |
(22,987 |
) |
|
$ |
(35,231 |
) |
|
$ |
(28,936 |
) |
|
$ |
12,244 |
|
|
Adjustments: |
|
|
|
|
|
|
|
|
|
|
|
|
|
|
|
|
|
|
|
|
|
Depreciation |
|
|
4,504 |
|
|
|
4,809 |
|
|
|
4,534 |
|
|
|
(305 |
) |
|
|
275 |
|
|
Stock-based compensation |
|
|
25,675 |
|
|
|
18,486 |
|
|
|
11,317 |
|
|
|
7,189 |
|
|
|
7,169 |
|
|
Restructuring costs |
|
|
— |
|
|
|
— |
|
|
|
3,749 |
|
|
|
— |
|
|
|
(3,749 |
) |
|
Investigation costs |
|
|
— |
|
|
|
— |
|
|
|
1,449 |
|
|
|
— |
|
|
|
(1,449 |
) |
|
Amortization of debt discount |
|
|
3,566 |
|
|
|
140 |
|
|
|
— |
|
|
|
3,426 |
|
|
|
140 |
|
|
Prepayment penalty on debt extinguishment |
|
|
— |
|
|
|
470 |
|
|
|
— |
|
|
|
(470 |
) |
|
|
470 |
|
|
Settlement and related costs |
|
|
5,359 |
|
|
|
— |
|
|
|
— |
|
|
|
5,359 |
|
|
|
— |
|
|
Non-GAAP net income (loss) |
|
$ |
(12,819 |
) |
|
$ |
918 |
|
|
$ |
(14,182 |
) |
|
$ |
(13,737 |
) |
|
$ |
15,100 |
|
Quarterly Results of Operations
The following tables set forth our unaudited quarterly statements of operations data for the last eight quarters. In the opinion of management, these data have been prepared on the same basis as the audited consolidated financial statements included elsewhere in this report and reflect all adjustments, including normal recurring adjustments, necessary for a fair presentation of the data. The results of historical periods are not indicative of expectations for any future period. You should read these data together with our audited consolidated financial statements and the related notes included elsewhere in this report.
|
|
|
Three Months Ended |
|
|||||||||||||||||||||||||||||
|
|
|
Dec. 31, |
|
|
Sep. 30, |
|
|
Jun. 30, |
|
|
Mar. 31, |
|
|
Dec. 31, |
|
|
Sep. 30, |
|
|
Jun. 30, |
|
|
Mar. 31, |
|
||||||||
|
|
|
2020 |
|
|
2020 |
|
|
2020 |
|
|
2020 |
|
|
2019 |
|
|
2019 |
|
|
2019 |
|
|
2019 |
|
||||||||
|
|
|
(in thousands, except percentages) |
|
|||||||||||||||||||||||||||||
|
Statements of Operations Data: |
|
|
|
|
|
|
|
|
|
|
|
|
|
|
|
|
|
|
|
|
|
|
|
|
|
|
|
|
|
|
|
|
|
Revenue |
|
$ |
36,448 |
|
|
$ |
28,196 |
|
|
$ |
26,457 |
|
|
$ |
47,822 |
|
|
$ |
40,821 |
|
|
$ |
40,762 |
|
|
$ |
38,190 |
|
|
$ |
33,063 |
|
|
Cost of revenue |
|
|
19,034 |
|
|
|
14,824 |
|
|
|
13,497 |
|
|
|
26,428 |
|
|
|
20,889 |
|
|
|
20,981 |
|
|
|
19,774 |
|
|
|
17,190 |
|
|
Gross profit |
|
|
17,414 |
|
|
|
13,372 |
|
|
|
12,960 |
|
|
|
21,394 |
|
|
|
19,932 |
|
|
|
19,781 |
|
|
|
18,416 |
|
|
|
15,873 |
|
|
Gross margin |
|
|
47.8 |
% |
|
|
47.4 |
% |
|
|
49.0 |
% |
|
|
44.7 |
% |
|
|
48.8 |
% |
|
|
48.5 |
% |
|
|
48.2 |
% |
|
|
48.0 |
% |
|
Operating expenses: |
|
|
|
|
|
|
|
|
|
|
|
|
|
|
|
|
|
|
|
|
|
|
|
|
|
|
|
|
|
|
|
|
|
Research and development expense |
|
|
14,971 |
|
|
|
11,901 |
|
|
|
10,661 |
|
|
|
11,057 |
|
|
|
11,202 |
|
|
|
10,344 |
|
|
|
8,773 |
|
|
|
8,561 |
|
|
Sales and marketing expense |
|
|
8,086 |
|
|
|
6,964 |
|
|
|
6,123 |
|
|
|
7,490 |
|
|
|
8,063 |
|
|
|
7,842 |
|
|
|
8,188 |
|
|
|
8,549 |
|
|
General and administrative expense |
|
|
8,743 |
|
|
|
7,527 |
|
|
|
12,446 |
|
|
|
6,242 |
|
|
|
7,488 |
|
|
|
5,503 |
|
|
|
5,455 |
|
|
|
5,695 |
|
|
Restructuring costs (benefits) |
|
|
— |
|
|
|
— |
|
|
|
— |
|
|
|
— |
|
|
|
— |
|
|
|
— |
|
|
|
— |
|
|
|
— |
|
|
Total operating expenses |
|
|
31,800 |
|
|
|
26,392 |
|
|
|
29,230 |
|
|
|
24,789 |
|
|
|
26,753 |
|
|
|
23,689 |
|
|
|
22,416 |
|
|
|
22,805 |
|
|
Loss from operations |
|
|
(14,386 |
) |
|
|
(13,020 |
) |
|
|
(16,270 |
) |
|
|
(3,395 |
) |
|
|
(6,821 |
) |
|
|
(3,908 |
) |
|
|
(4,000 |
) |
|
|
(6,932 |
) |
|
Other income (expense), net |
|
|
66 |
|
|
|
49 |
|
|
|
126 |
|
|
|
409 |
|
|
|
295 |
|
|
|
317 |
|
|
|
309 |
|
|
|
321 |
|
|
Interest expense |
|
|
(1,392 |
) |
|
|
(1,360 |
) |
|
|
(1,349 |
) |
|
|
(1,312 |
) |
|
|
(531 |
) |
|
|
(413 |
) |
|
|
(421 |
) |
|
|
(429 |
) |
|
Loss on debt extinguishment |
|
|
— |
|
|
|
— |
|
|
|
— |
|
|
|
— |
|
|
|
(576 |
) |
|
|
— |
|
|
|
— |
|
|
|
— |
|
|
Loss before income taxes |
|
|
(15,712 |
) |
|
|
(14,331 |
) |
|
|
(17,493 |
) |
|
|
(4,298 |
) |
|
|
(7,633 |
) |
|
|
(4,004 |
) |
|
|
(4,112 |
) |
|
|
(7,040 |
) |
|
Income tax benefit (expense) |
|
|
(5 |
) |
|
|
(15 |
) |
|
|
(41 |
) |
|
|
(28 |
) |
|
|
(47 |
) |
|
|
(77 |
) |
|
|
(46 |
) |
|
|
(28 |
) |
|
Net loss |
|
|
(15,717 |
) |
|
$ |
(14,346 |
) |
|
$ |
(17,534 |
) |
|
$ |
(4,326 |
) |
|
$ |
(7,680 |
) |
|
$ |
(4,081 |
) |
|
$ |
(4,158 |
) |
|
$ |
(7,068 |
) |
|
Net loss per share — basic and diluted |
|
$ |
(0.68 |
) |
|
$ |
(0.63 |
) |
|
$ |
(0.77 |
) |
|
$ |
(0.19 |
) |
|
$ |
(0.35 |
) |
|
$ |
(0.19 |
) |
|
$ |
(0.19 |
) |
|
$ |
(0.33 |
) |
|
Weighted-average shares: |
|
|
|
|
|
|
|
|
|
|
|
|
|
|
|
|
|
|
|
|
|
|
|
|
|
|
|
|
|
|
|
|
|
Basic |
|
|
23,218 |
|
|
|
22,931 |
|
|
|
22,716 |
|
|
|
22,412 |
|
|
|
22,173 |
|
|
|
21,961 |
|
|
|
21,709 |
|
|
|
21,544 |
|
|
Diluted |
|
|
23,218 |
|
|
|
22,931 |
|
|
|
22,716 |
|
|
|
22,412 |
|
|
|
22,173 |
|
|
|
21,961 |
|
|
|
21,709 |
|
|
|
21,544 |
|
51
Liquidity and Capital Resources
As of December 31, 2020, we had cash, cash equivalents and short-term investments of $106.1 million, comprising cash deposits held at major financial institutions and short-term investments in a variety of securities, including U.S. government agencies, treasury bills, corporate notes and bonds, commercial paper and money market funds. As of December 31, 2020, we had working capital of $143.8 million.
Historically, we have funded our operations primarily through cash generated from operations and by issuing equity securities, convertible-debt offerings and/or borrowing under our prior senior credit facility. In 2021, our principal use of cash is funding operations to capture our market opportunity and capital expenditures.
We believe, based on our current operating plan, that our existing cash, cash equivalents and short-term investments will be sufficient to meet our anticipated cash needs for at least the next 12 months.
Sources of Funds
From time to time, we may explore additional financing sources and means to lower our cost of capital, which could include equity, equity-linked and debt financing. In addition, in connection with any future acquisitions, we may pursue additional funding which may be in the form of additional debt, equity or equity-linked financing or a combination thereof. We can provide no assurance that any additional financing will be available to us on acceptable terms.
2019 Notes
In December 2019, we issued the 2019 Notes in an aggregate principal amount of $86.3 million. The 2019 Notes are our senior unsecured obligations. The 2019 Notes bear interest at a fixed rate of 2.00% per year, payable semi-annually in arrears on June 15 and December 15 of each year, beginning on June 15, 2020. The 2019 Notes will be convertible into cash, shares of our common stock or a combination thereof, at our election. The 2019 Notes will mature on December 15, 2026, unless earlier repurchased, redeemed, or converted in accordance with the terms of the indenture for the 2019 Notes.
The net proceeds from issuing the 2019 Notes were approximately $83.5 million after deducting fees and expenses. We used the net proceeds from issuing the 2019 Notes to pay the cost of the capped call transactions and repay our senior credit facility. We intend to use the remainder of the net proceeds for general corporate purposes.
For further information on the terms of this debt, please refer to Note 7 to our consolidated financial statements included elsewhere in this report.
Historical Cash Flow Trends
The following table shows a summary of our cash flows for the periods indicated:
|
|
|
Year Ended December 31, |
|
|||||||||
|
(in thousands) |
|
2020 |
|
|
2019 |
|
|
2018 |
|
|||
|
Net cash provided by (used in) operating activities |
|
$ |
(16,877 |
) |
|
$ |
4,708 |
|
|
$ |
(11,777 |
) |
|
Net cash used in investing activities |
|
|
(36,287 |
) |
|
|
(13,099 |
) |
|
|
(5,666 |
) |
|
Net cash provided by financing activities |
|
|
9,902 |
|
|
|
57,759 |
|
|
|
15,688 |
|
Operating Cash Flows
For the year ended December 31, 2020, we used $16.9 million of net cash from operating activities. The net cash usage was driven primarily by $17.8 million of net loss adjusted for non-cash items, partially offset by $963,000 of working capital contribution.
For the year ended December 31, 2019, we generated $4.7 million of net cash from operating activities. The net cash proceeds were driven primarily by $4.1 million of working capital contribution and $584,000 of a net loss adjusted for non-cash items. The working capital contribution was primarily due to lower cash usage in inventory purchases, partially offset by lower cash collections in accounts receivable due to timing of when amounts became due.
52
For the year ended December 31, 2018, we used $11.8 million of net cash from operating activities. The net cash usage was driven primarily by $20.6 million of net loss adjusted for non-cash items, offset by $8.8 million of working capital contribution. The working capital contribution was primarily due to higher cash collection in accounts receivable due to timing of when amounts became due and lower cash usage in inventory purchases.
Investing Cash Flows
For the year ended December 31, 2020, we used $36.3 million of net cash from investing activities. The net cash usage was driven primarily by investments and equipment purchases of $82.7 million and $3.1 million, respectively, partially offset by investment maturities of $49.5 million.
For the year ended December 31, 2019, we used $13.1 million of net cash from investing activities. The net cash usage was driven primarily by investments and equipment purchases of $72.4 million and $2.4 million, respectively, partially offset by investment maturities of $61.7 million.
For the year ended December 31, 2018, we used $5.7 million of net cash from investing activities. The net cash usage was driven primarily by investments and equipment purchases of $51.7 million and $6.4 million, partially offset by investment maturities of $52.4 million.
Financing Cash Flows
For the year ended December 31, 2020, we generated $9.9 million of net cash from financing activities. The net cash proceeds were driven primarily by $10.2 million from exercised stock options and our employee stock purchase plan.
For the year ended December 31, 2019, we generated $57.8 million of net cash from financing activities. The net cash proceeds were driven primarily by $83.5 million from issuance of the 2019 Notes, $9.1 million from exercised stock options and our employee stock purchase plan and $4.0 million in term loan borrowings, net of debt issuance costs. These proceeds were partially offset by repayments of indebtedness of $28.2 million of principal under our senior credit facility and $10.1 million of premium we paid for the capped call transactions.
For the year ended December 31, 2018, we generated $15.7 million of net cash from financing activities. The net cash proceeds were driven primarily by $16.4 million in term loan borrowings, net of debt issuance costs and $2.7 million from exercised stock options and our employee stock purchase plan. These proceeds were partially offset by repayments of indebtedness of $2.5 million of principal under our senior credit facility and payments of $0.9 million for finance-lease obligations.
Contractual Obligations
The following table reflects a summary of our contractual obligations as of December 31, 2020:
|
|
|
Payments Due By Period |
|
|||||||||||||||||
|
|
|
Total |
|
|
Less Than 1 Year |
|
|
1-3 Years |
|
|
3-5 Years |
|
|
More Than 5 Years |
|
|||||
|
(in thousands) |
|
|
|
|
|
|
|
|
|
|
|
|
|
|
|
|
|
|
|
|
|
Convertible senior notes (1) |
|
$ |
96,600 |
|
|
$ |
1,725 |
|
|
$ |
3,450 |
|
|
$ |
3,450 |
|
|
$ |
87,975 |
|
|
Operating lease obligations |
|
|
|
|
|
|
|
|
|
|
|
|
|
|
|
|
|
|
|
|
|
Operating lease obligations |
|
|
22,650 |
|
|
|
4,790 |
|
|
|
7,913 |
|
|
|
6,534 |
|
|
|
3,413 |
|
|
Sublease income |
|
|
(2,994 |
) |
|
|
(1,414 |
) |
|
|
(1,580 |
) |
|
|
— |
|
|
|
— |
|
|
Net operating lease commitments |
|
|
19,656 |
|
|
|
3,376 |
|
|
|
6,333 |
|
|
|
6,534 |
|
|
|
3,413 |
|
|
Purchase commitments (2) |
|
|
12,234 |
|
|
|
12,234 |
|
|
|
— |
|
|
|
— |
|
|
|
— |
|
|
Total |
|
$ |
128,490 |
|
|
$ |
17,335 |
|
|
$ |
9,783 |
|
|
$ |
9,984 |
|
|
$ |
91,388 |
|
(1) 2019 Notes include $10.4 million of interest payments.
(2) Purchase commitments comprise primarily non-cancelable commitments to purchase $9.9 million of inventory as of December 31, 2020, as well as non-cancelable software license agreements with vendors.
53
Off-Balance Sheet Arrangements
Since inception, we have not had any relationships with unconsolidated entities or financial partnerships, such as entities often referred to as structured finance or special purpose entities, which would have been established for the purpose of facilitating off-balance sheet arrangements or for another contractually narrow or limited purpose.
Critical Accounting Policies and Significant Estimates
Our discussion and analysis of our financial condition and results of operations are based upon our consolidated financial statements which we have prepared in accordance with GAAP. The preparation of these consolidated financial statements requires us to make estimates and judgments that affect the reported amounts of assets and liabilities and related disclosure of contingent assets and liabilities, revenue and expenses at the date of the consolidated financial statements. Generally, we base our estimates on historical experience and on various other assumptions, in accordance with GAAP, that we believe to be reasonable under the circumstances. Actual results may differ from these estimates under other assumptions or conditions.
Critical accounting policies and estimates are those that we consider the most important to the portrayal of our financial condition and results of operations because they require our most difficult, subjective or complex judgments, often as a result of the need to make estimates about the effect of matters that are inherently uncertain. Our critical accounting policies and estimates include those related to:
|
|
• |
revenue recognition; |
|
|
• |
inventory; |
|
|
• |
income taxes; and |
|
|
• |
stock-based compensation. |
Revenue Recognition
We generate revenue primarily from sales of hardware products. We also generate revenue from software, extended warranties, enhanced maintenance, support services, and nonrecurring engineering development services, all of which are not material.
We recognize revenue when control of the promised goods or services is transferred to our customers, which for hardware sales is generally at the time of product shipment as determined by the agreed-upon shipping terms. We measure revenue based on the amount of consideration we expect to be entitled-to in exchange for those goods or services. The period between when we transfer control of promised goods or services and when we receive payment is expected to be one year or less, and that expectation is consistent with our historical experience. As such, we do not adjust our revenues for the effects of a significant financing component. We recognize any variable consideration, which primarily comprises sales incentives, as a reduction of revenue at the time of revenue recognition. We estimate sales incentives based on our historical experience and current expectations at the time of revenue recognition and update them at the end of each reporting period as additional information becomes available.
Our reader and gateway products are highly dependent on embedded software and cannot function without this embedded software. In these cases, we account for the hardware and software license as a single performance obligation and recognize revenue at the point in time when control is transferred.
Our contracts with customers with multiple performance obligations generally include a combination of hardware products, standalone software, extended warranty and enhanced maintenance and support services. For these contracts, we account for individual performance obligations separately if they are distinct. The transaction price is allocated to the separate performance obligations on a relative standalone selling-price basis. In instances where the standalone selling price is not directly observable, such as when we do not sell the product or service separately, we determine the standalone selling price using one, or a combination of, the adjusted market assessment or expected cost-plus margin. Amounts allocated to extended warranty and enhanced maintenance sold with our reader and gateway products are deferred and recognized on a straight-line basis over the term of the arrangement, which is typically from one to three years. Amounts allocated to support services sold with our reader and gateway products are deferred and recognized when control of the promised services is transferred to our customers.
54
For nonrecurring engineering development agreements that involve significant production, modification or customization of our products, we generally recognize revenue over the performance period using the cost-input method because it best depicts the transfer of services to the customer. We receive payments under these agreements based on a billing schedule. Contract assets relate to our conditional right to consideration for our completed performance under these agreements. Accounts receivable are recorded when the right to consideration becomes unconditional. For the periods presented in this report, our contract assets, deferred revenue and the value of unsatisfied performance obligations for nonrecurring engineering development agreements are not material.
If our customer pays consideration before we transfer a good or service to the customer under the contract, those amounts are classified as contract liabilities, or deferred revenue. Contract liabilities are recognized as revenue as we transfer control of the promised goods or services to our customers.
Payment terms typically range from 30 to 120 days. We present revenue net of sales tax in our consolidated statements of operations. Shipping charges billed to customers are included in revenue and the related shipping costs are included in cost of revenue.
Practical Expedients and Exemptions: We expense sales commissions when incurred because the amortization period would have been one year or less. We record these costs within sales and marketing expenses. We do not disclose the value of unsatisfied performance obligations for (1) contracts with an original expected length of one year or less and (2) contracts for which we recognize revenue at the amount to which we have the right to invoice for services performed.
Inventory
Inventories are stated at the lower of cost or estimated net realizable value using the average costing method, which approximates the first-in, first-out method. Inventories comprise raw materials, work-in-process and finished goods. We continuously assess the value of our inventory and write down its value for estimated excess and obsolete inventory. This evaluation includes an analysis of inventory on hand, current and forecasted demand, product development plans, and market conditions. If future demand or market conditions are less favorable than our projections, or our product development plans change from current expectations, a write-down of excess or obsolete inventory may be required, and would be reflected in cost of goods sold in the period the updated information is known.
We recorded inventory excess and obsolescence charges, which had an unfavorable net impact of 2.2%, 1.7% and 1.2% on our gross margin for 2020, 2019 and 2018, respectively.
Income Taxes
We use the asset and liability approach for accounting, which requires recognizing deferred tax assets and liabilities for the expected future tax consequences of temporary differences between the financial statement and tax bases. We measure deferred tax assets and liabilities using enacted tax rates expected to be in effect when such assets and liabilities are recovered or settled. The effect on deferred tax assets and liabilities of a change in tax rates is recognized in the year that includes the enactment date. We determine deferred tax assets, including historical net operating losses, and deferred tax liabilities, based on temporary differences between the book and tax bases of assets and liabilities. We believe that it is currently more likely than not that our deferred tax assets will not be realized and as such, we have recorded a full valuation allowance for these assets. We evaluate the likelihood of our ability to realize deferred tax assets in future periods on a quarterly basis, and when appropriate evidence indicates we would revise our valuation allowance accordingly.
We utilize a two-step approach for evaluating uncertain tax positions. First, we evaluate recognition, which requires us to determine if the weight of available evidence indicates that a tax position is more likely than not to be sustained upon audit, including resolution of related appeals or litigation processes. If a tax position is not considered more likely than not to be sustained, no benefits of the position are recognized. Second, we measure the uncertain tax position based on the largest amount of benefit which is more likely than not to be realized on effective settlement. This process involves estimating our actual current tax exposure, including assessing the risks associated with tax audits, together with assessing temporary differences resulting from the different treatment of items for tax and financial reporting purposes. If actual results differ from our estimates, our net operating loss and credit carryforwards could be materially impacted.
55
Our realization of the benefits of the NOLs and credit carryforwards depends on sufficient taxable income in future years. We have established a valuation allowance against the carrying value of our deferred tax assets, as it is currently more likely than not that we will not be able to realize these deferred tax assets. In addition, using NOLs and credits to offset future income subject to taxes may be subject to substantial annual limitations due to the “change in ownership” provisions of the Code and similar state provisions. Events that cause limitations in the amount of NOLs that we may use in any one year include, but are not limited to, a cumulative ownership change of more than 50%, as defined by Code Sections 382 and 383, over a three-year period. Utilizing our NOLs and tax credit carryforwards could be significantly reduced if a cumulative ownership change of more than 50% has occurred in our past or occurs in our future.
We do not anticipate that the amount of our existing unrecognized tax benefits will significantly increase or decrease within the next 12 months. Due to the presence of NOLs in most jurisdictions, our tax years remain open for examination by taxing authorities back to 2000.
Stock-Based Compensation
We measure stock-based compensation costs for all share-based awards at fair value on the grant date and recognize compensation expense on a straight-line basis over the requisite service period, which typically vest over four years. We account for forfeitures as they occur. We determine the fair value of RSUs based on the closing price of our common stock at the date of grant. We determine the fair value of stock options at the date of grant by using the Black-Scholes option-pricing model. We also use the Black-Scholes option-pricing model to determine the fair value of each common share issued under the ESPP. We determine the fair value of the ESPP grants on the first day of each offering period.
In 2019, we began granting RSUs with performance conditions, or PSUs, replacing what has historically been our annual cash-bonus program for our senior executives and other bonus-eligible employees. The number of PSUs that ultimately vest will depend on the extent to which we achieve specified fiscal year financial performance metrics. We record compensation expense each period on a straight-line basis based on our estimate of the most probable number of PSUs that will vest and recognize that expense over the requisite service period.
Recent Accounting Pronouncements
For information on recent accounting pronouncements, please refer to Note 2 in our consolidated financial statements included elsewhere in this report.
JOBS Act
We are an emerging growth company under the JOBS Act. The JOBS Act provides that an emerging growth company can delay adoption of new or revised accounting pronouncements applicable to public companies until such pronouncements are made applicable to private companies, unless we otherwise irrevocably elect not to avail itself of this exemption. While we have not made such an irrevocable election, we have not delayed the adoption of any applicable accounting standards.
Subject to certain conditions set forth in the JOBS Act, if, as an “emerging growth company,” we choose to rely on certain exemptions provided for in the JOBS Act we may not be required to, among other things, (1) provide an auditor’s attestation report on our system of internal controls over financial reporting pursuant to Section 404, (2) provide all of the compensation disclosure that may be required of non-emerging growth public companies under the Dodd-Frank Wall Street Reform and Consumer Protection Act, (3) comply with any requirement that may be adopted by the PCAOB regarding mandatory audit firm rotation or a supplement to the auditor’s report providing additional information about the audit and the financial statements (auditor discussion and analysis) and (4) disclose certain executive compensation related items such as the correlation between executive compensation and performance, and comparisons of the CEO’s compensation to median employee compensation. These exemptions apply for a period of five years following the completion of our 2016 initial public offering or until we are no longer an “emerging growth company,” whichever is earlier.
56
Item 7A. Quantitative and Qualitative Disclosures About Market Risk
We are exposed to market risks in the ordinary course of our business. Some of these risks are related to fluctuations in interest rates.
Interest Rate Risk
Under our current investment policy, we invest our excess cash in money market funds, U.S. government agency securities, corporate bonds and notes and commercial paper. Our current investment policy seeks first to preserve principal, second to provide liquidity for our operating and capital needs and third to maximize yield without putting our principal at risk. We do not enter into investments for trading or speculative purposes.
We had cash, cash equivalents and short-term investments of $106.1 million and $116.5 million as of December 31, 2020 and 2019, respectively. Our investments are exposed to market risk due to fluctuations in prevailing interest rates, which may reduce the yield on our investments or their fair value. Because our investment portfolio is short-term in nature, we do not believe an immediate 10% increase in interest rates would have a material effect on the fair market value of our portfolio, and therefore we do not expect our results of operations or cash flows to be materially affected by a sudden change in market interest rates.
Our convertible notes have fixed interest rates, thus a hypothetical 100 basis point increase in interest rates would not impact interest expense.
Inflation Risk
We do not believe that inflation has had a material effect on our business, financial condition or results of operations. If our costs were to become subject to significant inflationary pressures, we may not be able to fully offset such higher costs through price increases. Our inability or failure to do so could adversely affect our business, financial condition and results of operations.
Foreign Currency Exchange Risk
Our foreign subsidiaries are considered to be extensions of the U.S. Company. The functional currency of our foreign subsidiaries is the U.S. dollar. Accordingly, gains and losses resulting from remeasuring transactions denominated in currencies other than U.S. dollars are included in other income, net on the consolidated statements of operations. For any of the periods presented, we did not have material impact from exposure to foreign currency fluctuation. As we grow operations, our exposure to foreign currency risk will likely become more significant.
57
Item 8. Financial Statements and Supplementary Data
|
|
|
Page |
|
|
59 |
|
|
|
61 |
|
|
|
62 |
|
|
|
63 |
|
|
|
64 |
|
|
|
65 |
|
|
|
66 |
The supplementary financial information required by this Item 8 is included in Item 7 under the caption “Quarterly Results of Operations.”
58
Report of Independent Registered Public Accounting Firm
The Board of Directors and Stockholders
Impinj, Inc.
Opinion on the Financial Statements
We have audited the accompanying consolidated balance sheet of Impinj, Inc and subsidiaries (the Company) as of December 31, 2020, the related consolidated statements of operations, comprehensive loss, changes in stockholders' equity and cash flows for the year ended December 31, 2020, and the related notes (collectively referred to as the “consolidated financial statements”). In our opinion, the consolidated financial statements present fairly, in all material respects, the financial position of the Company at December 31, 2020, and the results of its operations and its cash flows for the year ended December 31, 2020, in conformity with U.S. generally accepted accounting principles.
Basis for Opinion
These consolidated financial statements are the responsibility of the Company's management. Our responsibility is to express an opinion on the Company’s consolidated financial statements based on our audit. We are a public accounting firm registered with the Public Company Accounting Oversight Board (United States) (PCAOB) and are required to be independent with respect to the Company in accordance with the U.S. federal securities laws and the applicable rules and regulations of the Securities and Exchange Commission and the PCAOB.
We conducted our audit in accordance with the standards of the PCAOB. Those standards require that we plan and perform the audit to obtain reasonable assurance about whether the consolidated financial statements are free of material misstatement, whether due to error or fraud. The Company is not required to have, nor were we engaged to perform, an audit of its internal control over financial reporting. As part of our audit we are required to obtain an understanding of internal control over financial reporting but not for the purpose of expressing an opinion on the effectiveness of the Company's internal control over financial reporting. Accordingly, we express no such opinion.
Our audit included performing procedures to assess the risks of material misstatement of the consolidated financial statements, whether due to error or fraud, and performing procedures that respond to those risks. Such procedures included examining, on a test basis, evidence regarding the amounts and disclosures in the consolidated financial statements. Our audit also included evaluating the accounting principles used and significant estimates made by management, as well as evaluating the overall presentation of the consolidated financial statements. We believe that our audit provides a reasonable basis for our opinion.
/s/ Ernst & Young LLP
We have served as the Company’s auditor since 2020.
Seattle, Washington
February 17, 2021
59
Report of Independent Registered Public Accounting Firm
To the Board of Directors and Shareholders of Impinj, Inc.
Opinion on the Financial Statements
We have audited the consolidated balance sheet of Impinj, Inc. and its subsidiaries (the “Company”) as of December 31, 2019, and the related consolidated statements of operations, of comprehensive loss, of changes in stockholder’s equity and of cash flows for each of the two years in the period ended December 31, 2019, including the related notes (collectively referred to as the “consolidated financial statements”). In our opinion, the consolidated financial statements present fairly, in all material respects, the financial position of the Company as of December 31, 2019, and the results of its operations and its cash flows for each of the two years in the period ended December 31, 2019 in conformity with accounting principles generally accepted in the United States of America.
Change in Accounting Principle
As discussed in Note 2 to the consolidated financial statements, the Company changed the manner in which it accounts for leases in 2019.
Basis for Opinion
These consolidated financial statements are the responsibility of the Company's management. Our responsibility is to express an opinion on the Company’s consolidated financial statements based on our audits. We are a public accounting firm registered with the Public Company Accounting Oversight Board (United States) (PCAOB) and are required to be independent with respect to the Company in accordance with the U.S. federal securities laws and the applicable rules and regulations of the Securities and Exchange Commission and the PCAOB.
We conducted our audits of these consolidated financial statements in accordance with the standards of the PCAOB. Those standards require that we plan and perform the audit to obtain reasonable assurance about whether the consolidated financial statements are free of material misstatement, whether due to error or fraud.
Our audits included performing procedures to assess the risks of material misstatement of the consolidated financial statements, whether due to error or fraud, and performing procedures that respond to those risks. Such procedures included examining, on a test basis, evidence regarding the amounts and disclosures in the consolidated financial statements. Our audits also included evaluating the accounting principles used and significant estimates made by management, as well as evaluating the overall presentation of the consolidated financial statements. We believe that our audits provide a reasonable basis for our opinion.
/s/ PricewaterhouseCoopers LLP
Seattle, Washington
March 2, 2020
We served as the Company's auditor from 2003 to 2019.
60
Impinj, Inc.
Consolidated Balance Sheets
(in thousands, except par value)
|
|
December 31, 2020 |
|
|
December 31, 2019 |
|
||
|
Assets: |
|
|
|
|
|
|
|
|
Current assets: |
|
|
|
|
|
|
|
|
Cash and cash equivalents |
$ |
|
|
|
$ |
|
|
|
Short-term investments |
|
|
|
|
|
|
|
|
Accounts receivable, net of allowances of $ |
|
|
|
|
|
|
|
|
Inventory |
|
|
|
|
|
|
|
|
Prepaid expenses and other current assets |
|
|
|
|
|
|
|
|
Total current assets |
|
|
|
|
|
|
|
|
Property and equipment, net |
|
|
|
|
|
|
|
|
Operating lease right-of-use assets |
|
|
|
|
|
|
|
|
Other non-current assets |
|
|
|
|
|
|
|
|
Goodwill |
|
|
|
|
|
|
|
|
Total assets |
$ |
|
|
|
$ |
|
|
|
Liabilities and stockholders' equity: |
|
|
|
|
|
|
|
|
Current liabilities: |
|
|
|
|
|
|
|
|
Accounts payable |
$ |
|
|
|
$ |
|
|
|
Accrued compensation and employee related benefits |
|
|
|
|
|
|
|
|
Accrued and other current liabilities |
|
|
|
|
|
|
|
|
Current portion of operating lease liabilities |
|
|
|
|
|
|
|
|
Current portion of deferred revenue |
|
|
|
|
|
|
|
|
Total current liabilities |
|
|
|
|
|
|
|
|
Long-term debt, net of current portion |
|
|
|
|
|
|
|
|
Operating lease liabilities, net of current portion |
|
|
|
|
|
|
|
|
Other long-term liabilities |
|
|
|
|
|
|
|
|
Deferred revenue, net of current portion |
|
|
|
|
|
|
|
|
Total liabilities |
|
|
|
|
|
|
|
|
Commitments and contingencies (Note 11) |
|
|
|
|
|
|
|
|
Stockholders' equity: |
|
|
|
|
|
|
|
|
Preferred stock, $ |
|
|
|
|
|
|
|
|
Common stock, $ |
|
|
|
|
|
|
|
|
Additional paid-in capital |
|
|
|
|
|
|
|
|
Accumulated other comprehensive income |
|
|
|
|
|
|
|
|
Accumulated deficit |
|
( |
) |
|
|
( |
) |
|
Total stockholders' equity |
|
|
|
|
|
|
|
|
Total liabilities and stockholders' equity |
$ |
|
|
|
$ |
|
|
The accompanying notes are an integral part of these consolidated financial statements.
61
Impinj, Inc.
Consolidated Statements of Operations
(in thousands, except per share data)
|
|
Year Ended December 31, |
|
|||||||||
|
|
2020 |
|
|
2019 |
|
|
2018 |
|
|||
|
Revenue |
$ |
|
|
|
$ |
|
|
|
$ |
|
|
|
Cost of revenue |
|
|
|
|
|
|
|
|
|
|
|
|
Gross profit |
|
|
|
|
|
|
|
|
|
|
|
|
Operating expenses: |
|
|
|
|
|
|
|
|
|
|
|
|
Research and development |
|
|
|
|
|
|
|
|
|
|
|
|
Sales and marketing |
|
|
|
|
|
|
|
|
|
|
|
|
General and administrative |
|
|
|
|
|
|
|
|
|
|
|
|
Restructuring costs |
|
— |
|
|
|
— |
|
|
|
|
|
|
Total operating expenses |
|
|
|
|
|
|
|
|
|
|
|
|
Loss from operations |
|
( |
) |
|
|
( |
) |
|
|
( |
) |
|
Other income, net |
|
|
|
|
|
|
|
|
|
|
|
|
Interest expense |
|
( |
) |
|
|
( |
) |
|
|
( |
) |
|
Loss on debt extinguishment |
|
— |
|
|
|
( |
) |
|
|
— |
|
|
Loss before income taxes |
|
( |
) |
|
|
( |
) |
|
|
( |
) |
|
Income tax benefit (expense) |
|
( |
) |
|
|
( |
) |
|
|
|
|
|
Net loss |
$ |
( |
) |
|
$ |
( |
) |
|
$ |
( |
) |
|
|
|
|
|
|
|
|
|
|
|
|
|
|
Net loss per share — basic and diluted |
$ |
( |
) |
|
$ |
( |
) |
|
$ |
( |
) |
|
Weighted-average shares outstanding — basic and diluted |
|
|
|
|
|
|
|
|
|
|
|
The accompanying notes are an integral part of these consolidated financial statements.
62
Impinj, Inc.
Consolidated Statements of Comprehensive Loss
(in thousands)
|
|
Year Ended December 31, |
|
|||||||||||
|
|
2020 |
|
|
|
|
2019 |
|
|
2018 |
|
|||
|
Net loss |
$ |
( |
) |
|
|
|
$ |
( |
) |
|
$ |
( |
) |
|
Other comprehensive income (loss), net of tax: |
|
|
|
|
|
|
|
|
|
|
|
|
|
|
Unrealized gain (loss) on investments |
|
( |
) |
|
|
|
|
|
|
|
|
|
|
|
Total other comprehensive income (loss) |
|
( |
) |
|
|
|
|
|
|
|
|
|
|
|
Comprehensive loss |
$ |
( |
) |
|
|
|
$ |
( |
) |
|
$ |
( |
) |
The accompanying notes are an integral part of these consolidated financial statements.
63
Impinj, Inc.
Consolidated Statements of Changes in Stockholders’ Equity
(in thousands)
|
|
|
|
|
|
|
|
|
|
|
|
|
|
|
|
|
|
|
Accumulated |
|
|
|
|
|
|
|
|
|
|
|
|
|
|
|
|
|
Additional |
|
|
|
|
|
|
Other |
|
|
Total |
|
|||
|
|
|
Common Stock |
|
|
Paid-in |
|
|
Accumulated |
|
|
Comprehensive |
|
|
Stockholders' |
|
|||||||||
|
|
|
Shares |
|
|
Amount |
|
|
Capital |
|
|
Deficit |
|
|
Income (loss) |
|
|
Equity |
|
||||||
|
Balance at December 31, 2017 |
|
|
|
|
|
$ |
|
|
|
$ |
|
|
|
$ |
( |
) |
|
$ |
( |
) |
|
$ |
|
|
|
Issuance of common stock |
|
|
|
|
|
|
— |
|
|
|
|
|
|
|
— |
|
|
|
— |
|
|
|
|
|
|
Stock-based compensation |
|
|
— |
|
|
|
— |
|
|
|
|
|
|
|
— |
|
|
|
— |
|
|
|
|
|
|
Net loss |
|
|
— |
|
|
|
— |
|
|
|
— |
|
|
|
( |
) |
|
|
— |
|
|
|
( |
) |
|
Other comprehensive income |
|
|
— |
|
|
|
— |
|
|
|
— |
|
|
|
— |
|
|
|
|
|
|
|
|
|
|
Balance at December 31, 2018 |
|
|
|
|
|
|
|
|
|
|
|
|
|
|
( |
) |
|
|
( |
) |
|
|
|
|
|
Issuance of common stock |
|
|
|
|
|
|
|
|
|
|
|
|
|
|
— |
|
|
|
— |
|
|
|
|
|
|
Stock-based compensation |
|
|
— |
|
|
|
— |
|
|
|
|
|
|
|
— |
|
|
|
— |
|
|
|
|
|
|
Net loss |
|
|
— |
|
|
|
— |
|
|
|
— |
|
|
|
( |
) |
|
|
— |
|
|
|
( |
) |
|
Other comprehensive income |
|
|
— |
|
|
|
— |
|
|
|
— |
|
|
|
— |
|
|
|
|
|
|
|
|
|
|
Equity component of issuance of 2019 Notes, net of issuance costs of $ |
|
|
— |
|
|
|
— |
|
|
|
|
|
|
|
|
|
|
|
— |
|
|
|
|
|
|
Premiums paid for Capped Call Transactions (Note 7) |
|
|
— |
|
|
|
— |
|
|
|
( |
) |
|
|
— |
|
|
|
— |
|
|
|
( |
) |
|
Balance at December 31, 2019 |
|
|
|
|
|
|
|
|
|
|
|
|
|
|
( |
) |
|
|
|
|
|
|
|
|
|
Issuance of common stock |
|
|
|
|
|
|
|
|
|
|
|
|
|
|
— |
|
|
|
— |
|
|
|
|
|
|
Stock-based compensation |
|
|
— |
|
|
|
— |
|
|
|
|
|
|
|
— |
|
|
|
— |
|
|
|
|
|
|
Net loss |
|
|
— |
|
|
|
— |
|
|
|
— |
|
|
|
( |
) |
|
|
— |
|
|
|
( |
) |
|
Other comprehensive loss |
|
|
— |
|
|
|
— |
|
|
|
— |
|
|
|
— |
|
|
|
( |
) |
|
|
( |
) |
|
Balance at December 31, 2020 |
|
|
|
|
|
$ |
|
|
|
$ |
|
|
|
$ |
( |
) |
|
$ |
|
|
|
$ |
|
|
The accompanying notes are an integral part of these consolidated financial statements.
64
Impinj, Inc.
Consolidated Statements of Cash Flows
(in thousands)
|
|
Year Ended December 31, |
|
|||||||||
|
|
2020 |
|
|
2019 |
|
|
2018 |
|
|||
|
Operating activities: |
|
|
|
|
|
|
|
|
|
|
|
|
Net loss |
$ |
( |
) |
|
$ |
( |
) |
|
$ |
( |
) |
|
Adjustments to reconcile net loss to net cash provided by (used in) operating activities: |
|
|
|
|
|
|
|
|
|
|
|
|
Depreciation |
|
|
|
|
|
|
|
|
|
|
|
|
Stock-based compensation |
|
|
|
|
|
|
|
|
|
|
|
|
Non-cash restructuring benefit |
|
— |
|
|
|
— |
|
|
|
( |
) |
|
Accretion of discount or amortization of premium on short-term investments |
|
|
|
|
|
( |
) |
|
|
( |
) |
|
Amortization of debt issuance costs and debt discount |
|
|
|
|
|
|
|
|
|
|
|
|
Loss on debt extinguishment |
|
— |
|
|
|
|
|
|
|
— |
|
|
Deferred income taxes |
|
— |
|
|
|
— |
|
|
|
( |
) |
|
Changes in operating assets and liabilities: |
|
|
|
|
|
|
|
|
|
|
|
|
Accounts receivable |
|
( |
) |
|
|
( |
) |
|
|
|
|
|
Inventory |
|
( |
) |
|
|
|
|
|
|
|
|
|
Prepaid expenses and other assets |
|
( |
) |
|
|
( |
) |
|
|
|
|
|
Deferred revenue |
|
|
|
|
|
( |
) |
|
|
( |
) |
|
Deferred rent |
|
— |
|
|
|
— |
|
|
|
( |
) |
|
Accounts payable |
|
|
|
|
|
|
|
|
|
|
|
|
Accrued compensation and employee related benefits |
|
( |
) |
|
|
( |
) |
|
|
|
|
|
Operating lease right-of-use assets |
|
|
|
|
|
|
|
|
|
— |
|
|
Operating lease liabilities |
|
( |
) |
|
|
( |
) |
|
|
— |
|
|
Accrued liabilities and other liabilities |
|
( |
) |
|
|
|
|
|
|
( |
) |
|
Restructuring liabilities |
|
— |
|
|
|
— |
|
|
|
|
|
|
Net cash provided by (used in) operating activities |
|
( |
) |
|
|
|
|
|
|
( |
) |
|
Investing activities: |
|
|
|
|
|
|
|
|
|
|
|
|
Purchases of investments |
|
( |
) |
|
|
( |
) |
|
|
( |
) |
|
Proceeds from maturities of investments |
|
|
|
|
|
|
|
|
|
|
|
|
Purchases of property and equipment |
|
( |
) |
|
|
( |
) |
|
|
( |
) |
|
Net cash used in investing activities |
|
( |
) |
|
|
( |
) |
|
|
( |
) |
|
Financing activities: |
|
|
|
|
|
|
|
|
|
|
|
|
Proceeds from issuance of 2019 Notes, net of issuance costs |
|
— |
|
|
|
|
|
|
|
— |
|
|
Premiums paid for capped call transactions |
|
— |
|
|
|
( |
) |
|
|
— |
|
|
Principal payments on finance lease obligations |
|
( |
) |
|
|
( |
) |
|
|
( |
) |
|
Payments on term and equipment loans |
|
— |
|
|
|
( |
) |
|
|
( |
) |
|
Proceeds from term loans, net of debt issuance costs |
|
— |
|
|
|
|
|
|
|
|
|
|
Proceeds from exercise of stock options and employee stock purchase plan |
|
|
|
|
|
|
|
|
|
|
|
|
Net cash provided by financing activities |
|
|
|
|
|
|
|
|
|
|
|
|
Net increase (decrease) in cash and cash equivalents |
|
( |
) |
|
|
|
|
|
|
( |
) |
|
Cash and cash equivalents |
|
|
|
|
|
|
|
|
|
|
|
|
Beginning of period |
|
|
|
|
|
|
|
|
|
|
|
|
End of period |
$ |
|
|
|
$ |
|
|
|
$ |
|
|
|
|
|
|
|
|
|
|
|
|
|
|
|
|
Supplemental disclosure of cashflow information: |
|
|
|
|
|
|
|
|
|
|
|
|
Cash paid for interest |
|
|
|
|
|
|
|
|
|
|
|
|
Purchases of property and equipment not yet paid |
|
|
|
|
|
|
|
|
|
|
|
|
Disposal of fully depreciated property and equipment |
|
|
|
|
|
|
|
|
|
|
|
The accompanying notes are an integral part of these consolidated financial statements.
65
IMPINJ, INC.
NOTES TO CONSOLIDATED FINANCIAL STATEMENTS
Note 1. Description of Business
Impinj, Inc., a Delaware corporation, is headquartered in Seattle, Washington. Impinj platform comprising multiple product families, wirelessly connects individual items and delivers data about the connected items to business and consumer applications enabled by our partner network. Impinj derives revenue from selling endpoint ICs, reader ICs, readers, gateways and software as well as from development, service and license agreements.
Note 2. Summary of Significant Accounting Policies
Basis of Presentation and Principles of Consolidation
The accompanying consolidated financial statements include Impinj, Inc. and its wholly owned subsidiaries. We have eliminated intercompany balances and transactions in consolidation. Certain amounts on our consolidated balance sheets in prior period have been reclassified to conform to current period presentation. We have prepared these consolidated financial statements in conformity with U.S. generally accepted accounting principles, or GAAP.
Use of Estimates
The preparation of financial statements in conformity with GAAP requires management to make certain estimates, judgments and assumptions that affect the reported amounts of assets and liabilities and the related disclosures as of the date of the financial statements, as well as the reported amounts of revenue and expenses during the periods presented. On an ongoing basis, we evaluate our estimates, including those related to revenue recognition, sales incentives, estimate to complete development contracts, deferred revenue, inventory excess and obsolescence, income taxes, determination of the fair value of stock awards and compensation and employee-related benefits. To the extent there are material differences between these estimates, judgments, or assumptions and actual results, our financial statements will be affected. Covid-19 has introduced significant additional uncertainty with respect to estimates, judgments and assumptions about current and forecasted demand, which may materially impact the estimates previously listed, among others.
Concentrations of Credit Risk
Financial instruments, which potentially subject us to concentrations of credit risk, consist primarily of cash equivalents, investments and accounts receivable. We place cash and cash equivalents and investments with major financial institutions, which management assesses to be of high credit quality, to limit our investments exposure. We extend credit to customers based upon our evaluation of the customer’s financial condition and generally collateral is not required.
|
|
|
Year Ended December 31, |
|
|||||||||
|
|
|
2020 |
|
|
2019 |
|
|
2018 |
|
|||
|
Revenue: |
|
|
|
|
|
|
|
|
|
|
|
|
|
Avery Dennison(1) |
|
|
|
% |
|
|
|
% |
|
|
|
% |
|
North American logistics provider |
|
* |
|
|
|
|
|
|
* |
|
||
|
Arizon |
|
|
|
|
|
* |
|
|
|
|
|
|
|
|
|
|
|
% |
|
|
|
% |
|
|
|
% |
|
* Less than 10% |
|
|
|
|
|
|
|
|
|
|
|
|
|
(1) Includes concentration of revenue related to Smartrac NV, or Smartrac. In March 2020, Avery Dennison completed an acquisition of Smartrac. |
|
|
|
|
|
|||||||
66
|
|
|
As of December 31, |
|
|||||
|
|
|
2020 |
|
|
2019 |
|
||
|
Accounts Receivable: |
|
|
|
|
|
|
|
|
|
Avery Dennison(1) |
|
|
|
% |
|
|
|
% |
|
Arizon |
|
|
|
|
|
* |
|
|
|
Xindeco |
|
|
|
|
|
* |
|
|
|
Blue Star |
|
* |
|
|
|
|
|
|
|
|
|
|
|
% |
|
|
|
% |
|
* Less than 10% |
|
|
|
|
|
|
|
|
|
(1) Includes concentration of accounts receivable related to Smartrac. |
|
|||||||
Concentration of Supplier Risk
We outsource the manufacturing and production of our hardware products to a small number of suppliers. Although there are a limited number of manufacturers for hardware products, we believe that other suppliers could provide similar products on comparable terms. A change in suppliers, however, could cause a delay in manufacturing and a possible loss of sales, which would adversely affect our operating results.
Cash and Cash Equivalents
Cash includes demand deposits with banks or financial institutions. Cash equivalents include short-term, highly liquid investments that are both readily convertible to known amounts of cash and so near their maturity that they present minimal risk of changes in value because of changes in interest rates. Our cash equivalents include only investments with an original or remaining maturity of three months or less at the date of purchase. We regularly maintain cash in excess of federally insured limits at financial institutions.
Investments
Our investments consist of fixed income securities, which include U.S. government agency securities, corporate notes and bonds and commercial paper. Because we use the investments to support current operations, the contractual maturities of our available-for-sale, or AFS, debt securities are due in one year or less and are classified as short-term investments. AFS debt securities are carried at fair value with unrealized gains and losses reported as a component of other comprehensive income (loss). For AFS debt securities where fair value is less than cost, we intend to hold or more-likely-than-not will not be required to sell such securities; if any, we record credit-related impairment in the consolidated statements of operations through an allowance for credit losses and adjust each period for changes in credit risk. The gross unrealized gains or losses on short-term investments as of December 31, 2020 and 2019 were not material.
Fair Value Measurement
Accounting standards define fair value as the price that would be received to sell an asset or paid to transfer a liability (an exit price) in the principal or most advantageous market in an orderly transaction between market participants on the measurement date. The standards also establish a fair value hierarchy, which requires an entity to maximize the use of observable inputs and minimize the use of unobservable inputs when measuring fair value. There are three levels of inputs that may be used to measure fair value:
|
|
• |
Level 1 — Quoted prices in active markets for identical assets or liabilities. |
|
|
• |
Level 2 — Assets and liabilities valued based on observable market data for similar instruments, such as quoted prices for similar assets or liabilities. |
|
|
• |
Level 3 — Unobservable inputs that are supported by little or no market activity; instruments valued based on the best available data, some of which is internally developed, and considers risk premiums that a market participant would require. |
We applied the following methods and assumptions in estimating our fair value measurements:
67
Cash Equivalents — Cash equivalents consist of highly liquid investments, including money market funds with original or remaining maturities of less than three months at the acquisition date. We record the fair value measurement of these assets based on quoted market prices in active markets.
Investments — Our investments comprise fixed income securities, which include U.S. government agency securities, corporate notes and bonds, commercial paper and treasury bills. The fair value measurement of these assets is based on observable market-based inputs or inputs that are derived principally from or corroborated by observable market data by correlation or other means.
Long-term Debt —See Note 7 for the carrying amount and estimated fair value of our convertible senior notes due 2026.
Accounts Receivable and Allowances
Accounts receivable comprises amounts billed currently due from customers, net of an allowance for doubtful accounts, an allowance for sales returns and price exceptions.
The allowance for doubtful accounts is our best estimate of the amount of probable lifetime-expected credit losses in existing accounts receivable and is determined based on our historical collections experience, age of the receivable, knowledge of the customer and the condition of the general economy and industry as a whole. We record changes in our estimate to the allowance for doubtful accounts through bad debt expense and write off the receivable and corresponding allowance when accounts are ultimately determined to be uncollectible. Bad debt expense is included in general and administrative expenses. For the periods presented in this report, bad debt expense and the allowance for doubtful account were not material.
We derive a majority of our accounts receivable from sales to original equipment manufacturers, or OEMs, original design manufacturers, or ODMs, as well as to distributors who are large, well-established companies. We do not have customers that represent a significant credit risk based on current economic conditions and past collection experience. Also, we have not had material past-due balances on our accounts receivable as of December 31, 2020 or 2019; except for $
The allowance for sales returns and price exceptions is our best estimate based on our historical experience and currently available evidence. We record changes in our estimate to the allowance for sales returns and price exceptions through revenue and relieve the allowance when product returns are received for sales returns and when claims are processed for price exceptions.
|
|
|
Balance at Beginning of Year |
|
|
Additional Reserve |
|
|
Applied Sales Return |
|
|
Balance at End of Year |
|
||||
|
Allowance for sales returns and price exceptions: |
|
|
|
|
|
|
|
|
|
|
|
|
|
|
|
|
|
During year ended December 31, 2020 |
|
$ |
|
|
|
$ |
|
|
|
$ |
( |
) |
|
$ |
|
|
|
During year ended December 31, 2019 |
|
|
|
|
|
|
|
|
|
|
( |
) |
|
|
|
|
|
During year ended December 31, 2018 |
|
|
|
|
|
|
|
|
|
|
( |
) |
|
|
|
|
Inventory
Inventories are stated at the lower of cost or estimated net realizable value using the average costing method, which approximates the first-in, first-out method. Inventories comprise raw materials, work-in-process and finished goods. We continuously assess the value of our inventory and write down its value for estimated excess and obsolete inventory. This evaluation includes an analysis of inventory on hand, current and forecasted demand, product development plans, and market conditions. If future demand or market conditions are less favorable than our projections, or our product development plans change from current expectations, a write-down of excess or obsolete inventory may be required, and would be reflected in cost of goods sold in the period the updated information is known.
68
We recorded inventory excess and obsolescence charges, which had an unfavorable net impact of
Property and Equipment
We record property and equipment at cost and depreciate it using the straight-line method over the estimated useful lives of the related assets. The useful lives are as follows:
|
Category |
|
Useful Life |
|
|
|
Laboratory equipment |
|
|
|
|
|
Computer equipment and software |
|
|
|
|
|
Furniture and fixtures |
|
|
|
|
|
Equipment acquired under finance leases |
|
|
|
|
|
Leasehold improvements |
|
|
||
Maintenance and repair costs are charged to expense as incurred. Major improvements, which extend the useful life of the related asset, are capitalized. Upon disposal of a fixed asset, we record a gain or loss based on the differences between the proceeds received and the net book value of the disposed asset.
Other Assets
Other assets primarily comprise capitalized implementation costs from cloud computing arrangements and security deposits. We capitalize eligible costs associated with cloud computing arrangements over the term of the arrangement, plus reasonably certain renewals, and recognize those costs on a straight-line basis in the same line item in the consolidated statement of operations as the expense for fees associated with the cloud computing arrangement. Cloud computing arrangement costs, included in prepaid expenses and other current assets were $
Goodwill
Goodwill is measured as the excess of the cost of acquisition over the sum of the amounts assigned to identifiable tangible and intangible assets acquired less liabilities assumed. We perform an annual impairment assessment of goodwill at the reporting unit level as of September 30, or more frequently if indicators of potential impairment exist. Our annual impairment assessment requires a comparison of the fair value of our reporting unit to the carrying value. If the fair value of a reporting unit exceeds its carrying amount, goodwill of the reporting unit is considered not impaired. If the carrying value of a reporting unit is greater than its fair value, an impairment loss will be recognized in an amount equal to that excess, limited to the total amount of goodwill allocated to that reporting unit. Additionally, we will consider the income tax effect from any tax deductible goodwill on the carrying amount of the reporting unit when measuring the goodwill impairment loss.
Revenue Recognition
We generate revenue primarily from sales of hardware products. We also generate revenue from software, extended warranties, enhanced maintenance, support services, and nonrecurring engineering development services, all of which are not material.
69
We recognize revenue when control of the promised goods or services is transferred to our customers, which for hardware sales is generally at the time of product shipment as determined by the agreed-upon shipping terms. We measure revenue based on the amount of consideration we expect to be entitled-to in exchange for those goods or services. The period between when we transfer control of promised goods or services and when we receive payment is expected to be
Our reader and gateway products are highly dependent on embedded software and cannot function without this embedded software. In these cases, we account for the hardware and software license as a single performance obligation and recognize revenue at the point in time when control is transferred.
Our contracts with customers with multiple performance obligations generally include a combination of hardware products, standalone software, extended warranty and enhanced maintenance and support services. For these contracts, we account for individual performance obligations separately if they are distinct. The transaction price is allocated to the separate performance obligations on a relative standalone selling-price basis. In instances where the standalone selling price is not directly observable, such as when we do not sell the product or service separately, we determine the standalone selling price using one, or a combination of, the adjusted market assessment or expected cost-plus margin. Amounts allocated to extended warranty and enhanced maintenance sold with our reader and gateway products are deferred and recognized on a straight-line basis over the term of the arrangement, which is typically from
For nonrecurring engineering development agreements that involve significant production, modification or customization of our products, we generally recognize revenue over the performance period using the cost-input method because it best depicts the transfer of services to the customer. We receive payments under these agreements based on a billing schedule. Contract assets relate to our conditional right to consideration for our completed performance under these agreements. Accounts receivable are recorded when the right to consideration becomes unconditional. For the periods presented in this report, our contract assets, deferred revenue and the value of unsatisfied performance obligations for nonrecurring engineering development agreements are not material.
If our customer pays consideration before we transfer a good or service to the customer under the contract, those amounts are classified as contract liabilities, or deferred revenue. Contract liabilities are recognized as revenue as we transfer control of the promised goods or services to our customers.
Payment terms typically range from
Practical Expedients and Exemptions: We expense sales commissions when incurred because the amortization period is expected to be
Product Warranties
We provide limited warranty coverage for most products, generally ranging from a period of
70
In February 2016, the FASB, issued guidance on leases. We adopted this standard on January 1, 2019 using the effective-date modified retrospective transition method.
We determine whether an arrangement is or contains a lease at inception. Right-of-use, or ROU, assets represent our right to use an identified asset for the lease term and lease liabilities represent our obligation to make lease payments arising from the lease. Operating lease ROU assets and liabilities are recognized at commencement date based on the present value of future lease payments over the lease term. We use an incremental borrowing rate in determining the present value of future lease payments as our operating leases do not provide an implicit rate. Our incremental borrowing rate is based on a credit-adjusted risk-free rate, which best approximates a secured rate over a similar term of lease. Lease expense for lease payments is recognized on a straight-line basis over the lease term. Our lease agreements may contain variable costs such as common area maintenance, insurance, real estate taxes or other costs. Variable lease costs are expensed as incurred on the consolidated statements of operations. Our lease agreements generally do not contain any residual value guarantees or restrictive covenants.
We have various non-cancellable operating lease agreements for office, warehouse and research and development space in the U.S., China, Thailand and Malaysia, with expiration dates from
Leases with an initial term of 12 months or less are not recorded on our consolidated balance sheet; we recognize lease expense for these leases on a straight-line basis over the lease term.
Research and Development Costs
Research and development expense comprises primarily personnel expenses (salaries, benefits and other employee related costs) and stock-based compensation expense for our product-development personnel; external consulting and service costs; prototype materials; other new-product development costs; and an allocated portion of infrastructure costs which include occupancy, depreciation and software costs.
Foreign Currency
Our foreign subsidiaries are considered to be extensions of the U.S. Company. The functional currency of the foreign subsidiaries is the U.S. dollar. Accordingly, gains and losses resulting from remeasuring transactions denominated in currencies other than U.S. dollars are included in other income, net on the consolidated statements of operations.
Income Taxes
We use the asset and liability approach for accounting, which requires recognizing deferred tax assets and liabilities for the expected future tax consequences of temporary differences between the financial statement and tax bases. We measure deferred tax assets and liabilities using enacted tax rates expected to be in effect when such assets and liabilities are recovered or settled. The effect on deferred tax assets and liabilities of a change in tax rates is recognized in the year that includes the enactment date. We determine deferred tax assets, including historical net operating losses, and deferred tax liabilities, based on temporary differences between the book and tax bases of assets and liabilities. We believe that it is currently more likely than not that our deferred tax assets will not be realized and as such, we have recorded a full valuation allowance for these assets. We evaluate the likelihood of our ability to realize deferred tax assets in future periods on a quarterly basis, and when appropriate evidence indicates we would revise our valuation allowance accordingly.
71
We utilize a two-step approach for evaluating uncertain tax positions. First, we evaluate recognition, which requires us to determine if the weight of available evidence indicates that a tax position is more likely than not to be sustained upon audit, including resolution of related appeals or litigation processes. If a tax position is not considered more likely than not to be sustained, no benefits of the position are recognized. Second, we measure the uncertain tax position based on the largest amount of benefit which is more likely than not to be realized on effective settlement. This process involves estimating our actual current tax exposure, including assessing the risks associated with tax audits, together with assessing temporary differences resulting from the different treatment of items for tax and financial reporting purposes. If actual results differ from our estimates, our net operating loss and credit carryforwards could be materially impacted.
Our realization of the benefits of the NOLs and credit carryforwards depends on sufficient taxable income in future years. We have established a valuation allowance against the carrying value of our deferred tax assets, as it is currently more likely than not that we will not be able to realize these deferred tax assets. In addition, using NOLs and credits to offset future income subject to taxes may be subject to substantial annual limitations due to the “change in ownership” provisions of the Code and similar state provisions. Events that cause limitations in the amount of NOLs that we may use in any one year include, but are not limited to, a cumulative ownership change of more than
We do not anticipate that the amount of our existing unrecognized tax benefits will significantly increase or decrease within the next 12 months.
Stock-Based Compensation
We have equity incentive plans that are more fully described in “Note 9 Stock-Based Awards”.
We measure stock-based compensation costs for all share-based awards at fair value on the grant date and recognize compensation expense on a straight-line basis over the requisite service period, which typically vest over
In 2019, we began granting RSUs with performance conditions, or PSUs, replacing what has historically been our annual cash-bonus program for our senior executives and other bonus-eligible employees. The number of PSUs that ultimately vest will depend on the extent to which we achieve specified fiscal year financial performance metrics. We record compensation expense each period on a straight-line basis based on our estimate of the most probable number of PSUs that will vest and recognize that expense over the requisite service period.
Net Loss per Share
Net loss per share is computed by dividing net loss by the weighted-average number of shares of common stock outstanding. We have outstanding stock options, RSUs, PSUs, and ESPPs which we include in the calculation of diluted net loss per share if their effect would be dilutive. The diluted net loss per share is computed by giving effect to all potential dilutive common stock equivalents outstanding for the period.
We use the treasury stock method for calculating any potential dilutive effect of the conversion spread on diluted net loss per share, if applicable since we expect to settle the principal amount of the outstanding 2019 Notes in cash. For more information about the 2019 Notes, please refer to Note 7 to our consolidated financial statements.
72
Recently Adopted Accounting Standards
In June 2016, the Financial Accounting Standards Board, or FASB, issued guidance on the measurement of credit losses on financial instruments. This guidance requires measurement and recognition of expected credit losses for financial assets held at amortized cost. This guidance is effective for interim and annual reporting periods beginning after December 15, 2019, and early adoption is permitted. We adopted this standard on
Recently Issued Accounting Standards Not Yet Adopted
In August 2020, the FASB issued guidance on debt with conversion and other options. This guidance eliminates the beneficial- and cash-conversion accounting models for convertible instruments, amends the derivative scope exception for contracts in an entity’s own equity. Additionally, the guidance requires the application of the “if-converted” method to calculate the impact of convertible instruments on diluted earnings per share. Although we are still evaluating the impact of the updated guidance and the effects on our financial statements, we anticipate using modified retrospective transition on January 1, 2021 to account for our convertible notes due 2026, or the 2019 Notes, on a whole-instrument basis. As a result, we anticipate long-term debt to increase approximately $
Other recent accounting pronouncements issued by the FASB (including its Emerging Issues Task Force), the American Institute of Certified Public Accountants, and the SEC did not have, or are not expected to have, a material impact on our present or future consolidated financial statements.
Note 3. Fair Value Measurements
The following table presents the balances of assets measured at fair value on a recurring basis, by level within the fair value hierarchy, as of the dates presented (in thousands):
|
|
|
December 31, 2020 |
|
|
December 31, 2019 |
|
||||||||||||||||||
|
|
|
Level 1 |
|
|
Level 2 |
|
|
Total |
|
|
Level 1 |
|
|
Level 2 |
|
|
Total |
|
||||||
|
Cash equivalents: |
|
|
|
|
|
|
|
|
|
|
|
|
|
|
|
|
|
|
|
|
|
|
|
|
|
Money market funds |
|
$ |
|
|
|
$ |
— |
|
|
$ |
|
|
|
$ |
|
|
|
$ |
— |
|
|
$ |
|
|
|
Total cash equivalents |
|
|
|
|
|
|
— |
|
|
|
|
|
|
|
|
|
|
|
— |
|
|
|
|
|
|
Short-term investments: |
|
|
|
|
|
|
|
|
|
|
|
|
|
|
|
|
|
|
|
|
|
|
|
|
|
U.S. government agency securities |
|
|
— |
|
|
|
|
|
|
|
|
|
|
|
— |
|
|
|
|
|
|
|
|
|
|
Corporate notes and bonds |
|
|
— |
|
|
|
|
|
|
|
|
|
|
|
— |
|
|
|
|
|
|
|
|
|
|
Commercial paper |
|
|
— |
|
|
|
|
|
|
|
|
|
|
|
— |
|
|
|
|
|
|
|
|
|
|
Treasury bill |
|
|
— |
|
|
|
|
|
|
|
|
|
|
|
— |
|
|
|
— |
|
|
|
— |
|
|
Total short-term investments |
|
|
— |
|
|
|
|
|
|
|
|
|
|
|
— |
|
|
|
|
|
|
|
|
|
|
Total |
|
$ |
|
|
|
$ |
|
|
|
$ |
|
|
|
$ |
|
|
|
$ |
|
|
|
$ |
|
|
We did
73
Note 4. Inventory
The following table presents the detail of inventories as of the dates presented (in thousands):
|
|
|
|
|
|
|
|
|
|
|
|
|
December 31, 2020 |
|
|
December 31, 2019 |
|
||
|
Raw materials |
|
$ |
|
|
|
$ |
|
|
|
Work-in-process |
|
|
|
|
|
|
|
|
|
Finished goods |
|
|
|
|
|
|
|
|
|
Total inventory |
|
$ |
|
|
|
$ |
|
|
Note 5. Property and Equipment
The following table presents the detail of property and equipment as of the dates presented (in thousands):
|
|
|
|
|
|
|
|
|
|
|
|
|
December 31, 2020 |
|
|
December 31, 2019 |
|
||
|
Laboratory equipment |
|
$ |
|
|
|
$ |
|
|
|
Computer equipment and software |
|
|
|
|
|
|
|
|
|
Furniture and fixtures |
|
|
|
|
|
|
|
|
|
Equipment acquired under finance leases |
|
|
|
|
|
|
|
|
|
Leasehold improvements |
|
|
|
|
|
|
|
|
|
Total property and equipment, gross |
|
|
|
|
|
|
|
|
|
Less: Accumulated depreciation |
|
|
( |
) |
|
|
( |
) |
|
Total property and equipment, net |
|
$ |
|
|
|
$ |
|
|
Depreciation expense, which includes amortization of finance lease assets, was $
Note 6. Income Taxes
We are subject to federal and state income taxes in the United States and foreign jurisdictions.
The following table presents U.S. and foreign components of income (loss) before incomes taxes:
|
|
|
Year Ended December 31, |
|
|||||||||
|
|
|
2020 |
|
|
2019 |
|
|
2018 |
|
|||
|
U.S. |
|
$ |
( |
) |
|
$ |
( |
) |
|
$ |
( |
) |
|
Foreign |
|
|
|
|
|
|
|
|
|
|
|
|
|
Loss before income taxes |
|
$ |
( |
) |
|
$ |
( |
) |
|
$ |
( |
) |
74
|
|
|
Year Ended December 31, |
|
|||||||||
|
|
|
2020 |
|
|
2019 |
|
|
2018 |
|
|||
|
Current: |
|
|
|
|
|
|
|
|
|
|
|
|
|
U.S. - Federal |
|
$ |
— |
|
|
$ |
— |
|
|
$ |
— |
|
|
U.S. - State |
|
|
( |
) |
|
|
( |
) |
|
|
( |
) |
|
Foreign |
|
|
( |
) |
|
|
( |
) |
|
|
( |
) |
|
|
|
|
( |
) |
|
|
( |
) |
|
|
( |
) |
|
Deferred: |
|
|
|
|
|
|
|
|
|
|
|
|
|
U.S. - Federal |
|
|
|
|
|
|
( |
) |
|
|
|
|
|
U.S. - State |
|
|
|
|
|
|
( |
) |
|
|
( |
) |
|
Foreign |
|
|
— |
|
|
|
— |
|
|
|
— |
|
|
|
|
|
|
|
|
|
( |
) |
|
|
|
|
|
Total income tax benefit (expense) |
|
$ |
( |
) |
|
$ |
( |
) |
|
$ |
|
|
We have not recorded a liability for U.S. income taxes and foreign withholding taxes on the undistributed earnings of foreign subsidiaries as of December 31, 2020 as we intend to permanently reinvest future such earnings outside the United States. The amount of the unrecognized deferred tax liability, if incurred, is expected to be immaterial.
The following table presents a reconciliation of the federal statutory rate and our effective tax rate for the periods presented:
|
|
|
Year Ended December 31, |
|
|||||||||
|
|
|
2020 |
|
|
2019 |
|
|
2018 |
|
|||
|
U.S. Statutory Rate |
|
|
|
% |
|
|
|
% |
|
|
|
% |
|
Change in valuation allowance |
|
|
( |
) |
|
|
( |
) |
|
|
( |
) |
|
State taxes (net of federal benefit) |
|
|
( |
) |
|
|
( |
) |
|
|
|
|
|
Federal research and development credit |
|
|
|
|
|
|
|
|
|
|
|
|
|
Incentive stock options |
|
|
|
|
|
|
( |
) |
|
|
( |
) |
|
Unrecognized tax benefits |
|
|
( |
) |
|
|
( |
) |
|
|
( |
) |
|
Other, net |
|
|
( |
) |
|
|
( |
) |
|
|
( |
) |
|
Effective income tax rate |
|
|
( |
%) |
|
|
( |
%) |
|
|
|
% |
We continue to maintain a full valuation allowance against our net deferred tax assets in the U.S., but recognize deferred income tax expense (benefit) due to the change in the indefinite deferred tax liability related to goodwill, which is partially offset by indefinite tax attributes.
Deferred federal, state and foreign income taxes reflect the net tax impact of temporary differences between the carrying amounts of assets and liabilities for financial reporting purposes and such amounts for tax purposes.
75
The following table presents the significant components of our deferred tax assets and liabilities as of the dates presented (in thousands):
|
|
|
|
|
|
|
|
|
|
|
|
|
December 31, 2020 |
|
|
December 31, 2019 |
|
||
|
Net operating loss carryforwards |
|
$ |
|
|
|
$ |
|
|
|
Credit carryforwards |
|
|
|
|
|
|
|
|
|
Capitalized research and development |
|
|
|
|
|
|
|
|
|
Operating lease liabilities |
|
|
|
|
|
|
|
|
|
Allowances |
|
|
|
|
|
|
|
|
|
Deferred compensation |
|
|
|
|
|
|
|
|
|
Deferred revenue |
|
|
|
|
|
|
|
|
|
Stock-based compensation |
|
|
|
|
|
|
|
|
|
Other |
|
|
|
|
|
|
|
|
|
Deferred tax assets |
|
|
|
|
|
|
|
|
|
Less: Valuation allowance |
|
|
( |
) |
|
|
( |
) |
|
Net deferred tax assets |
|
|
|
|
|
|
|
|
|
Deferred tax liability: |
|
|
|
|
|
|
|
|
|
Goodwill |
|
|
( |
) |
|
|
( |
) |
|
Depreciation and amortization |
|
|
( |
) |
|
|
( |
) |
|
Operating lease ROU assets |
|
|
( |
) |
|
|
( |
) |
|
2019 Notes |
|
|
( |
) |
|
|
( |
) |
|
Deferred tax liabilities |
|
|
( |
) |
|
|
( |
) |
|
Net deferred tax liability |
|
$ |
( |
) |
|
$ |
( |
) |
Realization of deferred tax assets is dependent upon the generation of future taxable income, if any, the timing and amount of which are uncertain. We have provided a full valuation allowance against the net deferred tax assets as of December 31, 2020 and 2019 because, based on the weight of available evidence, it is more likely than not that the deferred tax assets will not be realized.
We have accumulated federal tax losses of approximately $
We are currently not under audit in any tax jurisdiction. Tax years from 2000 through 2020 are currently open for audit by federal and state taxing authorities.
We establish reserves for tax positions based on estimates of whether, and the extent to which, additional taxes will be due. The reserves are established when we believe that positions might be challenged by taxing authorities despite our belief that our tax return positions are fully supportable.
76
The following table presents the total balance of unrecognized tax benefits as of the dates presented (in thousands):
|
|
|
Year Ended December 31, |
|
|||||||||
|
|
|
2020 |
|
|
2019 |
|
|
2018 |
|
|||
|
Balance at beginning of period |
|
$ |
|
|
|
$ |
|
|
|
$ |
|
|
|
Gross decreases to tax positions in prior periods |
|
|
( |
) |
|
|
— |
|
|
|
— |
|
|
Gross increases to tax positions in current periods |
|
|
|
|
|
|
|
|
|
|
|
|
|
Balance at end of period |
|
$ |
|
|
|
$ |
|
|
|
$ |
|
|
At December 31, 2020, the total amount of unrecognized tax benefits of $
Note 7. Long-term debt
Convertible Senior Notes
In December 2019, we issued convertible senior notes due 2026, or the 2019 Notes, in an aggregate principal amount of $
Our net proceeds from issuing the 2019 Notes were approximately $
The 2019 Notes are convertible at an initial conversion rate of shares of our common stock per $1,000 principal amount of the 2019 Notes, which is equal to an initial conversion price of approximately $
|
|
• |
during any fiscal quarter commencing after the fiscal quarter ending on March 31, 2020 (and only during such fiscal quarter), if the last reported sale price of our common stock, for at least |
|
|
• |
during the |
|
|
• |
prior to the close of business on the second scheduled trading day immediately preceding the redemption date if we call the 2019 Notes for redemption; or |
|
|
• |
upon the occurrence of specified corporate events, as described in the indenture. |
77
We may redeem the 2019 Notes for cash, at our option, on or after December 20, 2023, if the last reported sale price of our common stock has been at least
Holders of the 2019 Notes who convert their 2019 Notes in connection with certain corporate events that constitute a make-whole fundamental change (as defined in the indenture) are, under certain circumstances, entitled to an increase in the conversion rate. Additionally in the event of a corporate event constituting a fundamental change (as defined in the indenture), holders of the 2019 Notes may require us to repurchase all or a portion of their 2019 Notes at a repurchase price equal to
Certain convertible debt instruments that may be settled in cash on conversion are required to be separated into a liability and an equity component. The total proceeds are first allocated to the liability component based on the fair value of a similar debt instrument without the conversion option. The remaining proceeds are allocated to the equity component and recognized in additional paid-in capital.
Accordingly, we separated the 2019 Notes into a liability and an equity component. We determined the fair value of the liability component to be $
As of December 31, 2020, the “if-converted value” exceeded the principal amounts by $
We allocated the 2019 Notes total issuance costs of $
The effective interest rate on the liability component of the 2019 Notes for the year ended December 31, 2020 is
The following table presents the interest expense related to the 2019 Notes for the periods presented (in thousands):
|
|
|
Year Ended December 31, |
|
|||||||||
|
|
|
2020 |
|
|
2019 |
|
|
2018 |
|
|||
|
Amortization of debt discount |
|
$ |
|
|
|
$ |
|
|
|
$ |
— |
|
|
Amortization of debt issuance costs |
|
|
|
|
|
|
|
|
|
|
— |
|
|
Cash interest expense |
|
|
|
|
|
|
|
|
|
|
— |
|
|
Total interest expense |
|
$ |
|
|
|
$ |
|
|
|
$ |
— |
|
Our estimated fair value of the 2019 Notes was $
78
The following table presents the outstanding principal amount and carrying value of the 2019 Notes as of the date presented (in thousands):
|
|
|
December 31, 2020 |
|
|
December 31, 2019 |
|
||
|
Outstanding principal amount |
|
$ |
|
|
|
$ |
|
|
|
Unamortized debt discount and debt issuance costs |
|
|
( |
) |
|
|
( |
) |
|
Carrying value |
|
$ |
|
|
|
$ |
|
|
In connection with the issuance of the 2019 Notes, we entered into privately negotiated capped-call transactions with certain financial counterparties. The capped-call transactions are generally designed to reduce the potential dilution to our common stock upon any conversion or settlement of the 2019 Notes, or to offset any cash payments we are required to make in excess of the principal amount upon conversion of the 2019 Notes, as the case may be, with such reduction or offset subject to a cap based on the cap price. If, however, the market price per share of our common stock exceeds the cap price of the capped-call transactions, then our stock would experience some dilution and/or the capped call would not fully offset the potential cash payments, in each case, to the extent then-market price per share of our common stock exceeds the cap price. The initial cap price of the capped call transactions is $
The capped-call transactions meet the criteria for classification in equity, are not accounted for as derivatives, and are not remeasured each reporting period. We paid $
Senior Credit Facility
On December 16, 2019, we used $
Note 8. Stockholders’ Equity
Preferred Stock
Our board of directors has the authority to fix the designations, powers, preferences and rights, and the qualifications, limitations or restrictions thereof, of any wholly unissued series of preferred stock, and to increase or decrease the number of shares in any series of preferred stock, subject to limitations prescribed by law or by our certificate of incorporation. There was
Common Stock
As of December 31, 2020, we had authorized
79
The following shares of common stock have been reserved for future issuance as of the date presented (in thousands):
|
|
|
|
|
|
|
|
|
December 31, 2020 |
|
|
|
Option awards outstanding |
|
|
|
|
|
Restricted stock units outstanding |
|
|
|
|
|
Common stock reserved under equity incentive plans |
|
|
|
|
|
Common stock reserved under employee stock purchase plan |
|
|
|
|
|
Total |
|
|
|
|
Note 9. Stock-Based Awards
2016 Equity Incentive Plan
In June 2016, our board of directors adopted and our stockholders approved the 2016 Equity Incentive Plan, or the 2016 Plan, which became effective in at which time the 2010 Equity Incentive Plan, or the 2010 Plan, was terminated. Our 2000 Stock Plan was terminated in March 2010.
All options granted under the 2000 Stock Plan, the 2010 Plan and the 2016 Plan have a maximum
Stock Options
The following table summarizes option award activity for the year ended December 31, 2020 (in thousands, except per share data and years):
|
|
|
Number of Underlying Shares |
|
|
Weighted-Average Exercise Price Per Share |
|
|
Weighted-Average Remaining Contractual Life (Years) |
|
|
Total Intrinsic Value |
|
||||
|
Outstanding at December 31, 2019 |
|
|
|
|
|
$ |
|
|
|
|
|
|
|
$ |
|
|
|
Granted |
|
|
|
|
|
|
|
|
|
|
|
|
|
|
|
|
|
Exercised |
|
|
( |
) |
|
|
|
|
|
|
|
|
|
|
|
|
|
Forfeited or expired |
|
|
( |
) |
|
|
|
|
|
|
|
|
|
|
|
|
|
Outstanding at December 31, 2020 |
|
|
|
|
|
|
|
|
|
|
|
|
|
|
|
|
|
Vested and exercisable at December 31, 2020 |
|
|
|
|
|
$ |
|
|
|
|
|
|
|
$ |
|
|
We estimate the fair value of options granted at the date of grant using the Black-Scholes option-pricing model with the following assumptions for the periods presented:
80
|
|
|
Year Ended December 31, |
|
|||||||||
|
|
|
2020 |
|
|
2019 |
|
|
2018 |
|
|||
|
Risk-free interest rate |
|
|
|
|
|
|
|
|
|
|||
|
Expected dividends yield |
|
|
|
|
|
|
|
|
|
|||
|
Expected volatility |
|
|
|
|
|
|
|
|
|
|||
|
Weighted-average expected term |
|
|
|
|
|
|
|
|
|
|
||
|
Weighted-average fair value of options granted |
|
$ |
|
|
|
$ |
|
|
|
$ |
|
|
We determined that it was not practicable to calculate the volatility of our share price because we do not have an extensive public trading history for shares of our common stock. Therefore, we estimated our volatility based on a combination of our historical volatility since becoming a publicly traded company and reported market value data for a group of publicly-traded entities that we believe are relatively comparable after consideration of their size, stage of lifecycle, profitability, growth and risk and return on investment.
To determine the expected term, we generally apply and have historically applied the simplified approach in which the expected term of an award is presumed to be the mid-point between the vesting date and the expiration date of the options as we do not have sufficient historical exercise data to provide a reasonable basis for an estimate of expected term.
The total intrinsic value of options exercised during 2020, 2019 and 2018 was $
As of December 31, 2020, our total unrecognized stock-based compensation cost related to unvested stock options was $
Restricted Stock Units
The following table summarizes activity for restricted stock units, RSUs, including RSUs with performance conditions, or PSUs, for the year ended December 31, 2020 (in thousands, except per share data):
|
|
|
|
Number of Underlying Shares |
|
|
Weighted-Average Grant Date Fair Value |
|
||||||||||
|
|
|
|
RSUs |
|
|
PSUs |
|
|
RSUs |
|
|
PSUs |
|
||||
|
Outstanding at December 31, 2019 |
|
|
|
|
|
|
|
|
|
|
$ |
|
|
|
$ |
|
|
|
Granted |
|
|
|
|
|
|
|
|
|
|
|
|
|
|
|
|
|
|
Vested |
|
|
|
( |
) |
|
|
( |
) |
|
|
|
|
|
|
|
|
|
Forfeited |
|
|
|
( |
) |
|
|
( |
) |
|
|
|
|
|
|
|
|
|
Outstanding at December 31, 2020 |
|
|
|
|
|
|
|
|
|
|
$ |
|
|
|
$ |
|
|
We granted PSUs in 2019 and 2020 under our annual bonus program to our senior executives and other bonus-eligible employees. The number of annual PSUs that ultimately vest depends on us attaining a financial metric for the fiscal year as well as on the employee’s continued employment through the vesting date. The compensation committee and board of directors certified achievement of the financial metric for PSUs granted in 2019, vesting
We record compensation expense for each period based on our estimate of the most probable number of PSUs that will vest, and we recognize the expense over the related service period. The stock-based compensation expense we recognized for PSUs was $
The total fair value of RSUs vested was $
81
Employee Stock Purchase Plan
In 2016, we adopted the 2016 Employee Stock Purchase Plan, or the ESPP, which became effective in July 2016. Under the ESPP, eligible employees can authorize payroll deductions for amounts up to
As of December 31, 2020, the total unrecognized stock-based compensation related to the ESPP was $
|
|
|
Year Ended December 31, |
|||||
|
|
|
2020 |
|
2019 |
|
2018 |
|
|
Risk-free interest rate |
|
0.1% – 1.6% |
|
1.9% – 2.5% |
|
|
|
|
Expected term |
|
|
|
|
|
|
|
|
Expected volatility |
|
46.9% – 91.0% |
|
66.5% – 72.3% |
|
|
|
Stock-Based Compensation Expense
The following table presents the detail of stock-based compensation expense amounts included in our consolidated statements of operations for the periods presented (in thousands):
|
|
Year Ended December 31, |
|
|||||||||
|
|
2020 |
|
|
2019 |
|
|
2018 |
|
|||
|
Cost of revenue |
$ |
|
|
|
$ |
|
|
|
$ |
|
|
|
Research and development expense |
|
|
|
|
|
|
|
|
|
|
|
|
Sales and marketing expense |
|
|
|
|
|
|
|
|
|
|
|
|
General and administrative expense |
|
|
|
|
|
|
|
|
|
|
|
|
Total stock-based compensation expense |
$ |
|
|
|
$ |
|
|
|
$ |
|
|
Note 10. Leases
The following table presents the components of lease expense in our consolidated statements of operations for the periods presented (in thousands):
|
|
Year Ended December 31, |
|
|||||
|
|
2020 |
|
|
2019 |
|
||
|
Operating lease costs(a) |
|
|
|
|
|
|
|
|
Single lease costs |
$ |
|
|
|
$ |
|
|
|
Variable lease costs |
|
|
|
|
|
|
|
|
Sublease income(b) |
|
( |
) |
|
|
( |
) |
|
Total operating lease costs |
$ |
|
|
|
$ |
|
|
|
|
|
|
|
|
|
|
|
|
(a) Includes short-term lease costs, which are immaterial. |
|
||||||
|
(b) Sublease income is related to unused office space that was sublet as part of the restructuring in fiscal 2018 where we continue to have the primary obligations. |
|
||||||
82
The following table presents supplemental cash flow information related to operating leases for the periods presented (in thousands):
|
|
Year Ended December 31, |
|
|||||
|
|
2020 |
|
|
2019 |
|
||
|
Cash paid for amounts included in the measurement of lease liabilities |
|
||||||
|
Operating cash flows used |
$ |
|
|
|
$ |
|
|
The following table presents weighted-average remaining lease term and weighted-average discount rate related to operating leases as of:
|
|
2020 |
|
|
2019 |
|
||
|
Weighted-average remaining lease term (years) |
|
|
|
|
|
|
|
|
Weighted-average discount rate |
|
|
% |
|
|
|
% |
The following table presents future lease payments under operating leases as of December 31, 2020 (in thousands):
|
|
|
Operating Leases |
|
|||||||||
|
|
|
Lease Payments |
|
|
Sublease Income |
|
|
Net |
|
|||
|
2021 |
|
$ |
|
|
|
$ |
( |
) |
|
$ |
|
|
|
2022 |
|
|
|
|
|
|
( |
) |
|
|
|
|
|
2023 |
|
|
|
|
|
|
( |
) |
|
|
|
|
|
2024 |
|
|
|
|
|
|
— |
|
|
|
|
|
|
2025 |
|
|
|
|
|
|
— |
|
|
|
|
|
|
Thereafter |
|
|
|
|
|
|
— |
|
|
|
|
|
|
Total lease payments |
|
$ |
|
|
|
$ |
( |
) |
|
$ |
|
|
|
Less: Imputed interest |
|
|
( |
) |
|
|
|
|
|
|
|
|
|
Present value of lease liabilities |
|
|
|
|
|
|
|
|
|
|
|
|
|
Less: Current portion of lease liabilities |
|
|
( |
) |
|
|
|
|
|
|
|
|
|
Lease liabilities, net of current portion |
|
$ |
|
|
|
|
|
|
|
|
|
|
Note 11. Commitments and Contingencies
Indemnifications
In the normal course of business, we may enter into agreements that require us to indemnify either customers or suppliers for specific risks. While we cannot estimate our maximum exposure under these indemnification provisions, to date they have not had a material impact on our consolidated results of operations or financial condition.
Litigation
From time to time, we are subject to various legal proceedings or claims that arise in the ordinary course of business. We accrue a liability when management believes that it is both probable that a liability has been incurred and the amount of loss can be reasonably estimated. For the year ended December 31, 2020, we recorded and paid $
83
Federal Securities Class Actions
On August 7, 2018, a class-action complaint for violation of the federal securities laws was filed in the U.S. District Court for the Central District of California against us, our chief executive officer and former chief operating officer. Captioned Schultz v. Impinj, Inc., et al, the complaint, purportedly brought on behalf of all purchasers of our common stock from May 7, 2018 through and including August 2, 2018, asserted claims that our quarterly statement filed on Form 10-Q for first-quarter 2018 and a concurrent press release made false or misleading statements about our business prospects and financial condition. The complaint sought monetary damages, costs and expenses. On October 3, 2018, the plaintiff voluntarily dismissed this complaint.
On August 27, 2018, a second class-action complaint for violation of the federal securities laws was filed in the U.S. District Court for the Western District of Washington against us, our chief executive officer, former chief operating officer and former chief financial officer. Captioned Montemarano v. Impinj, Inc., et al., the complaint, purportedly brought on behalf of all purchasers of our common stock from May 4, 2017 through and including August 2, 2018, asserted claims that we made false or misleading statements in our financial statements, press releases and conference calls during the purported class period in violation of Section 10(b) of the Securities Exchange Act of 1934, as amended, or the Securities Exchange Act. The complaint sought monetary damages, costs and expenses.
On October 2, 2018, a third class-action complaint for violation of the federal securities laws was filed in the U.S. District Court for the Western District of Washington against us, our chief executive officer, former chief operating officer and former chief financial officer. Captioned Employees’ Retirement System of the City of Baton Rouge and Parish of East Baton Rouge v. Impinj, Inc., et al., the complaint, purportedly brought on behalf of all purchasers of our common stock from November 3, 2016 through and including February 15, 2018, asserted claims that we made false or misleading statements about customer demand for our products and inventory in SEC filings, press releases and conference calls in violation of Section 10(b) of the Securities Exchange Act. The complaint sought monetary damages, costs and expenses.
On January 14, 2019, the U.S. District Court for the Western District of Washington consolidated the Montemarano and Baton Rouge actions and appointed the Employees’ Retirement System of the City of Baton Rouge and Parish of East Baton Rouge as lead plaintiff. On February 13, 2019, lead plaintiff filed a consolidated amended complaint. The consolidated amended complaint alleged that from July 21, 2016 through February 15, 2018, we made false or misleading statements about customer demand and the capability of our products and platform in violation of Section 10(b) of the Securities Exchange Act.
On March 19, 2019, we filed a motion to dismiss the consolidated amended complaint, and on October 4, 2019, the court entered an order granting in part and denying in part the motion. The court dismissed the Section 10(b) claim against our former chief operating officer, dismissed product-capability-related allegations against our former chief financial officer, and dismissed allegations that defendants made false or misleading statements concerning increasing demand prior to first-quarter 2017. The court denied the motion as to all other claims and defendants.
On July 9, 2020, following a private settlement mediation with the lead plaintiff in the federal securities class actions and plaintiff in the New York State securities class action discussed below, the parties in both actions executed a stipulation of settlement that resolved the claims asserted in both actions. The settlement provided for a payment to the plaintiff class of $
84
New York State Securities Class Action
On January 31, 2019, a fourth class-action complaint for violation of the federal securities laws was filed in the Supreme Court of the State of New York for the County of New York against us, our chief executive officer, former chief operating officer, former chief financial officer, members of our board of directors and the underwriters of our July 2016 initial public stock offering, or IPO, and December 2016 secondary public offering, or SPO. Captioned Plymouth County Retirement System v. Impinj, Inc., et al., the complaint, purportedly brought on behalf of purchasers of our stock pursuant to or traceable to our IPO and SPO, alleged that we made false or misleading statements in the registration statements and prospectuses in those offerings concerning demand for our products and inventory in violation of Section 11 of the Securities Act of 1933. On April 9, 2019, the New York Supreme Court entered an order staying the action and requiring the parties to update the court every 90 days as to the status of the pending federal securities class actions discussed above.
As discussed above in connection with the federal securities class action, on July 9, 2020, the parties in both this action and the federal securities class actions executed a stipulation of settlement that resolved the claims in both actions. On November 20, 2020, the U.S. District Court for the Western District of Washington entered an order approving the settlement. Pursuant to the terms of the settlement, the parties in this action filed stipulation discontinuing this action with prejudice. The New York State court, significantly hampered by COVID-19, has not yet entered an order discontinuing the action with prejudice.
Shareholder Derivative Actions
On October 26, 2018, two shareholder derivative actions were filed in the U.S. District Court for the District of Delaware against our chief executive officer, former chief operating officer, former chief financial officer and certain of our directors. We were a nominal defendant. On November 8, 2018, a third shareholder derivative action was filed in this same court against the same defendants. Captioned Weiss v. Diorio, et al., Fotouhi v. Diorio, et al., and De la Fuente v. Diorio, et al., the derivative complaints, purportedly brought on behalf of us, alleged that the defendants breached their fiduciary duties to us and allegedly made false or misleading statements and omissions of material fact in violation of Section 14(a) of the Securities Exchange Act regarding our business and operations. The derivative actions included claims for, among other things, unspecified damages in favor of us, corporate actions to purportedly improve our corporate governance, and an award of costs and expenses to the derivative plaintiffs, including attorneys’ fees. On January 28, 2019, the Delaware federal court entered a stipulated order that stayed these derivative actions until resolution of the pending federal securities class actions described above.
On July 10, 2020, following a private settlement mediation, the parties in this action executed a stipulation of settlement to settle and resolve the claims asserted in this consolidated derivative action. The settlement required us to implement certain corporate governance changes and the payment of up to $
Patent Infringement Claims and Counterclaims
Impinj Patent Infringement Claims Against NXP
On June 6, 2019, we filed a patent infringement lawsuit against NXP USA, Inc., a Delaware corporation and subsidiary of NXP Semiconductors N.V., or NXP, in the U.S. District Court for the Northern District of California, or the Court. The original complaint alleged that certain NXP integrated circuit products infringe
85
In February 2020, NXP filed inter partes review, or IPR, petitions with the Patent Trial and Appeal Board for the U.S. Patent and Trademark Office, or PTAB, against
On September 24, 2020, the Court lifted the stay on
NXP Patent Infringement Claims Against Impinj
On October 4, 2019, NXP USA, Inc. and NXP, filed a patent infringement lawsuit against us in the U.S. District Court for the District of Delaware. The complaint alleges that certain of our products infringe
On December 7, 2020, Impinj Radio Frequency Technology (Shanghai) Co., Ltd., or Impinj Shanghai, was served with patent infringement lawsuits filed in the Intellectual Property Court in Shanghai, China, or Shanghai Intellectual Property Court, in which NXP asserts that certain of our products infringe
Obligations with Third-Party Manufacturers
We manufacture products with third-party manufacturers. We are committed to purchase $
Note 12. Deferred Revenue
Deferred revenue, comprising individually immaterial amounts for extended warranty, enhanced maintenance and advanced payments on nonrecurring engineering services contracts, represents contracted revenue that has not yet been recognized. Deferred revenue as of December 31, 2020 includes a $
The following table presents the changes in deferred revenue for the periods presented (in thousands):
86
|
|
Year Ended December 31, |
|
|||||
|
|
2020 |
|
|
2019 |
|
||
|
Balance at beginning of period |
$ |
|
|
|
$ |
|
|
|
Deferral of revenue |
|
|
|
|
|
|
|
|
Recognition of deferred revenue |
|
( |
) |
|
|
( |
) |
|
Balance at end of period |
$ |
|
|
|
$ |
|
|
During 2020, we recognized $
Note 13. Segment Reporting
We have
Information by Revenue Categories
Our chief executive officer reviews information about revenue categories, including endpoint ICs and systems. We define systems as reader ICs, readers, gateways and software.
|
|
|
Year Ended December 31, |
|
|||||||||
|
|
|
2020 |
|
|
2019 |
|
|
2018 |
|
|||
|
Endpoint ICs |
|
$ |
|
|
|
$ |
|
|
|
$ |
|
|
|
Systems |
|
|
|
|
|
|
|
|
|
|
|
|
|
Total revenue |
|
$ |
|
|
|
$ |
|
|
|
$ |
|
|
Information by Geography
The following table summarizes our long-lived assets, which consist of property and equipment, less accumulated depreciation (in thousands):
|
|
|
December 31, 2020 |
|
|
December 31, 2019 |
|
||
|
United States |
|
$ |
|
|
|
$ |
|
|
|
Malaysia |
|
|
|
|
|
|
|
|
|
Others |
|
|
|
|
|
|
|
|
|
Total |
|
$ |
|
|
|
$ |
|
|
Revenue presented in the following table is based on the location of the value-added resellers, inlay manufacturers, reader OEMs, distributors or end users who purchased products and services directly from us. For sales to our resellers and distributors, their location may be different from the locations of the ultimate end users.
|
|
|
Year Ended December 31, |
|
|||||||||
|
|
|
2020 |
|
|
2019 |
|
|
2018 |
|
|||
|
Americas |
|
$ |
|
|
|
$ |
|
|
|
$ |
|
|
|
Asia Pacific |
|
|
|
|
|
|
|
|
|
|
|
|
|
Europe, Middle East and Africa |
|
|
|
|
|
|
|
|
|
|
|
|
|
Total revenue |
|
$ |
|
|
|
$ |
|
|
|
$ |
|
|
87
Total revenue in the United States, included in Americas, was $
Note 14. Net Loss per Share
For the periods presented, the following table provides a reconciliation of the numerator and denominator used in computing basic and diluted net loss per share (in thousands, expect per share amounts):
|
|
|
Year Ended December 31, |
|
|||||||||
|
|
|
2020 |
|
|
2019 |
|
|
2018 |
|
|||
|
Numerator: |
|
|
|
|
|
|
|
|
|
|
|
|
|
Net loss |
|
$ |
( |
) |
|
$ |
( |
) |
|
$ |
( |
) |
|
Denominator: |
|
|
|
|
|
|
|
|
|
|
|
|
|
Weighted-average shares outstanding — basic and diluted |
|
|
|
|
|
|
|
|
|
|
|
|
|
Net loss per share — basic and diluted |
|
$ |
( |
) |
|
$ |
( |
) |
|
$ |
( |
) |
The following presents the outstanding shares of our common stock equivalents excluded from the computation of diluted net loss per share as of the dates presented because their effect would have been antidilutive (in thousands):
|
|
Year Ended December 31, |
|
|||||||||
|
|
2020 |
|
|
2019 |
|
|
2018 |
|
|||
|
Stock options |
|
|
|
|
|
|
|
|
|
|
|
|
Restricted stock units and restricted stock units with performance conditions |
|
|
|
|
|
|
|
|
|
|
|
|
Employee stock purchase plan shares |
|
|
|
|
|
|
|
|
|
|
|
Since we expect to settle the principal amount of the outstanding 2019 Notes in cash, we use the treasury stock method for calculating any potential dilutive effect of the conversion spread on diluted net income per share, if applicable. For the 2019 Notes, the conversion spread for the notes has a dilutive impact on diluted net income per share when the average market price of our common stock during each reporting period exceeds $
Note 15. Related-Party Transactions
We have a consulting agreement with a limited liability company owned by Cathal Phelan, a member of our board of directors, pursuant to which Mr. Phelan provides advisory and consulting services. The term of the consulting agreement began in May 2020 through December 2020, which was extended by an additional
Note 16. Retirement Plans
In 2001, we adopted a salary deferral 401(k) plan for our employees. The plan allows employees to contribute a percentage of their pretax earnings annually, subject to limitations imposed by the Internal Revenue Service. The plan also allows us to make a matching contribution, subject to certain limitations. To date, we have not made any contributions to the plan.
88
Note 17. Subsequent Events
89
Item 9. Changes in and Disagreements with Accountants on Accounting and Financial Disclosure
None.
Item 9A. Controls and Procedures
Evaluation of Disclosure Controls and Procedures
Our management, with the participation of our chief executive officer and our principal financial officer, evaluated the effectiveness of our disclosure controls and procedures as of December 31, 2020. Disclosure controls and procedures, as defined in Rules 13a-15(e) and 15d-15(e) under the Exchange Act, are designed to ensure that information required to be disclosed by a company in the reports that it files or submits under the Exchange Act is (1) recorded, processed, summarized and reported within the time periods specified in the SEC’s rules and forms and (2) accumulated and communicated to management, including its principal executive officer and principal financial officer, as appropriate to allow timely decisions regarding required disclosure. Based on the evaluation of our disclosure controls and procedures, our chief executive officer and principal financial officer concluded that our disclosure controls and procedures were effective at a reasonable assurance level as of December 31, 2020.
Management’s Report on Internal Control Over Financial Reporting
Our management is responsible for establishing and maintaining adequate internal control over financial reporting, as such term is defined under Rule 13a-15(f) and 15d-15(f) under the Exchange Act. We conducted an evaluation of the effectiveness of our internal control over financial reporting based on the framework in Internal Control – Integrated Framework issued by the Committee of Sponsoring Organizations of the Treadway Commission (2013 framework). Based on our evaluation, our management concluded that our internal control over financial reporting was effective as of December 31, 2020.
This annual report does not include an attestation report of our independent registered public accounting firm regarding internal control over financial reporting. Management’s report was not subject to attestation by our registered public accounting firm pursuant to rules of the Securities and Exchange Commission for emerging growth companies that permit us to provide only management’s report in this annual report.
Changes in Internal Control over Financial Reporting
There were no changes that have materially affected, or are reasonably likely to materially affect, our internal control over financial reporting during the three months ended December 31, 2020.
Limitations on Controls
Our disclosure controls and procedures and internal control over financial reporting are designed to provide reasonable assurance of achieving the desired control objectives. Our management recognizes that any control system, no matter how well designed and operated, is based upon certain judgments and assumptions and cannot provide absolute assurance that its objectives will be met. Similarly, an evaluation of controls cannot provide absolute assurance that misstatements due to error or fraud will not occur or that all control issues and instances of fraud, if any, have been detected.
Item 9B. Other Information
None.
90
PART III
Item 10. Directors, Executive Officers and Corporate Governance
The information required by this item is incorporated by reference to our definitive proxy statement relating to the 2021 annual meeting of stockholders. The definitive proxy statement will be filed with the SEC within 120 days after the end of the 2020 fiscal year.
We have adopted a Code of Ethics that applies to our Chief Executive Officer, Chief Financial Officer, principal accounting officer and controller and persons performing similar functions. The Code of Ethics is posted on our website at http://corporate-governance.impinj.com. We intend to satisfy the disclosure requirements under Item 5.05 of Form 8-K regarding an amendment to, or waiver from, a provision of the Code of Ethics by posting such information on our website at the address specified above.
Item 11. Executive Compensation
The information required by this item is incorporated by reference to our definitive proxy statement relating to the 2021 annual meeting of stockholders. The definitive proxy statement will be filed with the SEC within 120 days after the end of the 2020 fiscal year.
Item 12. Security Ownership of Certain Beneficial Owners and Management and Related Stockholder Matters
The information required by this item is incorporated by reference to our definitive proxy statement relating to the 2021 annual meeting of stockholders. The definitive proxy statement will be filed with the SEC within 120 days after the end of the 2020 fiscal year.
Item 13. Certain Relationships and Related Transactions, and Director Independence
The information required by this item is incorporated by reference to our definitive proxy statement relating to the 2021 annual meeting of stockholders. The definitive proxy statement will be filed with the SEC within 120 days after the end of the 2020 fiscal year.
Item 14. Principal Accounting Fees and Services
The information required by this item is incorporated by reference to our definitive proxy statement relating to the 2021 annual meeting of stockholders. The definitive proxy statement will be filed with the SEC within 120 days after the end of the 2020 fiscal year.
91
PART IV
Item 15. Exhibits and Financial Statement Schedules
(a)(1) Financial Statements
We have filed the financial statements listed in the Index to Consolidated Financial Statements as a part of this report.
(a)(2) Financial Statement Schedules
All financial statement schedules have been omitted because they are not applicable, not material or the required information is presented in the financial statements or the notes thereto.
(a)(3) Exhibits
The list of exhibits included in the Exhibit Index to this report is incorporated herein by reference.
92
|
10.14B |
|
Second Amendment to Lease, dated March 4, 2016, between the registrant and 400 Fairview LLC |
|
S-1 |
|
6/2/2016 |
|
10.21B |
|
|
|
|
|
|
|
|
|
|
|
10.14C |
|
Third Amendment to Lease, dated March 28, 2016, between the registrant and 400 Fairview LLC |
|
S-1 |
|
6/2/2016 |
|
10.21C |
|
|
|
|
|
|
|
|
|
|
|
10.15 |
|
|
S-1 |
|
6/2/2016 |
|
10.22 |
|
|
|
|
|
|
|
|
|
|
|
|
10.16† |
|
License Agreement, dated July 3, 2008, between the registrant and Intel Corporation |
|
10-Q |
|
10/28/2020 |
|
10.1 |
|
|
|
|
|
|
|
|
|
|
|
10.17† |
|
|
10-Q |
|
10/28/2020 |
|
10.2 |
|
|
|
|
|
|
|
|
|
|
|
|
10.18† |
|
|
10-Q |
|
10/28/2020 |
|
10.3 |
|
|
|
|
|
|
|
|
|
|
|
|
10.19† |
|
|
10-Q |
|
10/28/2020 |
|
10.4 |
|
|
|
|
|
|
|
|
|
|
|
|
10.20† |
|
|
10-Q |
|
10/28/2020 |
|
10.5 |
|
|
|
|
|
|
|
|
|
|
|
|
10.21† |
|
|
10-Q |
|
10/28/2020 |
|
10.6 |
|
|
|
|
|
|
|
|
|
|
|
|
10.22† |
|
|
10-Q |
|
10/28/2020 |
|
10.7 |
|
|
|
|
|
|
|
|
|
|
|
|
10.23+ |
|
|
|
10-Q |
|
8/14/2017 |
|
10.1 |
|
10.24 |
|
|
8-K |
|
6/26/2018 |
|
10.1 |
|
|
10.25+ |
|
Executive Employment Agreement, dated April 28, 2017, between the registrant and Jeff Dossett |
|
10-K |
|
2/28/2020 |
|
10.32 |
|
10.26 |
|
|
8-K |
|
12/16/2019 |
|
10.1 |
|
|
16.1 |
|
Letter from PricewaterhouseCoopers LLP to Securities and Exchange Commission, dated April 29, 2020 |
|
8-K |
|
4/29/2020 |
|
16.1 |
|
|
|
|
|
|
|
|
|
|
|
21.1 |
|
|
S-1 |
|
6/2/2016 |
|
21.1 |
93
|
|
|
|
|
|
|
|
|
|
|
23.1 |
|
Consent of Ernst & Young, LLP, Independent Registered Public Accounting Firm |
|
|
|
|
|
|
|
|
|
|
|
|
|
|
|
|
|
23.2 |
|
Consent of PricewaterhouseCoopers LLP, Independent Registered Public Accounting Firm |
|
|
|
|
|
|
|
|
|
|
|
|
|
|
|
|
|
24.1 |
|
|
|
|
|
|
|
|
|
|
|
|
|
|
|
|
|
|
|
31.1 |
|
|
|
|
|
|
|
|
|
|
|
|
|
|
|
|
|
|
|
31.2 |
|
|
|
|
|
|
|
|
|
|
|
|
|
|
|
|
|
|
|
32.1* |
|
|
|
|
|
|
|
|
|
|
|
|
|
|
|
|
|
|
|
32.2* |
|
|
|
|
|
|
|
|
|
|
|
|
|
|
|
|
|
|
|
101.INS |
|
Inline XBRL Instance Document |
|
|
|
|
|
|
|
|
|
|
|
|
|
|
|
|
|
101.SCH |
|
Inline XBRL Taxonomy Extension Schema Linkbase Document |
|
|
|
|
|
|
|
|
|
|
|
|
|
|
|
|
|
101.CAL |
|
Inline XBRL Taxonomy Extension Calculation Linkbase Document |
|
|
|
|
|
|
|
|
|
|
|
|
|
|
|
|
|
101.DEF |
|
Inline XBRL Taxonomy Extension Definition Linkbase Document |
|
|
|
|
|
|
|
|
|
|
|
|
|
|
|
|
|
101.LAB |
|
Inline XBRL Taxonomy Extension Label Linkbase Document |
|
|
|
|
|
|
|
|
|
|
|
|
|
|
|
|
|
101.PRE |
|
Inline XBRL Taxonomy Extension Presentation Linkbase Document |
|
|
|
|
|
|
|
|
|
|
|
|
|
|
|
|
|
+ |
|
Indicates management contract or compensatory plan, contract or arrangement. |
||||||
|
|
|
|
||||||
|
* |
|
The certifications attached as Exhibits 32.1 and 32.2 that accompany this Annual Report on Form 10-K are not deemed filed with the Securities and Exchange Commission and are not to be incorporated by reference into any filing of Impinj, Inc. under the Securities Act of 1933, as amended, or the Securities Exchange Act of 1934, as amended, whether made before or after the date of this Form 10-K, irrespective of any general incorporation language contained in such filing. |
||||||
|
|
|
|
||||||
|
† |
|
Certain portions of this exhibit have been omitted because they are not material and would likely cause competitive harm to the registrant if disclosed. |
||||||
Item 16. Form 10-K Summary
None.
94
SIGNATURES
Pursuant to the requirements of Section 13 or 15(d) of the Securities Exchange Act of 1934, the registrant has duly caused this report to be signed on its behalf by the undersigned, thereunto duly authorized.
|
|
|
Impinj, Inc. |
||
|
|
|
|
|
|
|
Date: February 17, 2021 |
|
By: |
|
/s/ Cary Baker |
|
|
|
|
|
Cary Baker |
|
|
|
|
|
Chief Financial Officer (Principal Financial and Accounting Officer) |
POWER OF ATTORNEY
KNOW ALL PERSONS BY THESE PRESENTS, that each person whose signature appears below constitutes and appoints Chris Diorio, Ph.D. and Cary Baker, and each of them, with full power of substitution and resubstitution and full power to act without the other, as his or her true and lawful attorney-in-fact and agent to act in his or her name, place and stead and to execute in the name and on behalf of each person, individually and in each capacity stated below, and to file, any and all documents in connection therewith, with the Securities and Exchange Commission, granting unto said attorneys-in-fact and agents, and each of them, full power and authority to do and perform each and every act and thing, ratifying and confirming all that said attorneys-in-fact and agents or any of them or their and his or her substitute or substitutes, may lawfully do or cause to be done by virtue thereof.
Pursuant to the requirements of the Securities Exchange Act of 1934, this report has been signed below by the following persons on behalf of the registrant in the capacities and in the capacities and on the dates indicated.
|
Name |
|
Title |
|
Date |
|
|
|
|
|
|
|
/s/Chris Diorio |
|
Chief Executive Officer and Vice Chair (Principal Executive Officer) |
|
February 17, 2021 |
|
Chris Diorio, Ph.D. |
|
|
|
|
|
|
|
|
|
|
|
/s/ Cary Baker |
|
Chief Financial Officer |
|
February 17, 2021 |
|
Cary Baker |
|
(Principal Financial and Accounting Officer) |
|
|
|
|
|
|
|
|
|
/s/ Peter van Oppen |
|
Chair |
|
February 17, 2021 |
|
Peter van Oppen |
|
|
|
|
|
|
|
|
|
|
|
/s/ Tom A. Alberg |
|
Director |
|
February 17, 2021 |
|
Tom A. Alberg |
|
|
|
|
|
|
|
|
|
|
|
/s/ Clinton Bybee |
|
Director |
|
February 17, 2021 |
|
Clinton Bybee |
|
|
|
|
|
|
|
|
|
|
|
/s/ Gregory Sessler |
|
Director |
|
February 17, 2021 |
|
Gregory Sessler |
|
|
|
|
|
|
|
|
|
|
|
/s/ Theresa Wise |
|
Director |
|
February 17, 2021 |
|
Theresa Wise
|
|
|
|
|
|
/s/ Daniel Gibson |
|
Director |
|
February 17, 2021 |
|
Daniel Gibson |
|
|
|
|
|
|
|
|
|
|
|
/s/ Umesh Padval |
|
Director |
|
February 17, 2021 |
|
Umesh Padval |
|
|
|
|
|
|
|
|
|
|
|
/s/ Cathal Phelan |
|
Director |
|
February 17, 2021 |
|
Cathal Phelan |
|
|
|
|
95