
Form 8-K FNB CORP/PA/ For: Feb 04
Exhibit 99.1 F.N.B. Corporation Investor Presentation February 2021 1Exhibit 99.1 F.N.B. Corporation Investor Presentation February 2021 1

Cautionary Statement Regarding Forward-Looking Information and Non-GAAP Financial Information This document may contain statements regarding F.N.B. Corporation’s outlook for earnings, revenues, expenses, tax rates, capital and liquidity levels and ratios, asset quality levels, financial position and other matters regarding or affecting our current or future business and operations. These statements can be considered as “forward-looking statements” within the meaning of the Private Securities Litigation Reform Act of 1995. These forward-looking statements involve various assumptions, risks and uncertainties which can change over time. Actual results or future events may be different from those anticipated in our forward-looking statements and may not align with historical performance and events. As forward-looking statements involve significant risks and uncertainties, caution should be exercised against placing undue reliance upon such statements. Forward-looking statements are typically identified by words such as believe, plan, expect, anticipate, intend, outlook, estimate, forecast, will, should, project, goal, and other similar words and expressions. F.N.B. does not assume any duty to update forward-looking statements, except as required by federal securities laws. F.N.B.’s forward-looking statements are subject to the following principal risks and uncertainties: Our business, financial results and balance sheet values are affected by business and economic circumstances, including, but not limited to: (i) developments with respect to the U.S. and global financial markets; (ii) actions by the Federal Reserve Board, U.S. Treasury Department, Office of the Comptroller of the Currency and other governmental agencies, especially those that impact money supply, market interest rates or otherwise affect business activities of the financial services industry; (iii) a slowing of the U.S. economic environment; and (iv) the impacts of tariffs or other trade policies of the U.S.. Business and operating results are affected by our ability to identify and effectively manage risks inherent in our businesses, including, where appropriate, through effective use of systems and controls, third-party insurance, derivatives, and capital management techniques, and to meet evolving regulatory capital and liquidity standards. Competition can have an impact on customer acquisition, growth and retention, and on credit spreads, deposit gathering and product pricing, which can affect market share, deposits and revenues. Our ability to anticipate and continue to respond to technological changes and COVID-19 challenges can also impact our ability to respond to customer needs and meet competitive demands. Business and operating results can also be affected by widespread natural and other disasters, pandemics, including the COVID-19 pandemic crisis, dislocations, terrorist activities, system failures, security breaches, significant political events, cyber-attacks or international hostilities through impacts on the economy and financial markets generally, or on us or our counterparties specifically. Legal, regulatory and accounting developments could have an impact on our ability to operate and grow our businesses, financial condition, results of operations, competitive position, and reputation. Reputational impacts could affect matters such as business generation and retention, liquidity, funding, and the ability to attract and retain management. These developments could include: Changes resulting from a U.S. presidential administration or legislative and regulatory reforms, different approaches to supervisory or enforcement priorities, including changes affecting oversight of the financial services industry, regulatory obligations or restrictions, consumer protection, pension, bankruptcy and other industry aspects, and changes in accounting policies and principles. Changes to regulations governing bank capital and liquidity standards. Unfavorable resolution of legal proceedings or other claims and regulatory and other governmental investigations or other inquiries. These matters may result in monetary judgments or settlements or other remedies, including fines, penalties, restitution or alterations in our business practices, and in additional expenses and collateral costs, and may cause reputational harm to F.N.B. Results of the regulatory examination and supervision process, including our failure to satisfy requirements imposed by the federal bank regulatory agencies or other governmental agencies. The impact on our financial condition, results of operations, financial disclosures and future business strategies related to the implementation of the new FASB Accounting Standards Update 2016-13 Financial Instruments -Credit Losses commonly referred to as the “current expected credit loss” standard or CECL. A failure or disruption in or breach of our operational or security systems or infrastructure, or those of third parties, including as a result of cyber-attacks or campaigns. The COVID-19 pandemic and the regulatory and governmental actions implemented in response to COVID-19 have resulted in significant deterioration and disruption in financial markets, national and local economic conditions and record levels of unemployment and could have a material impact on, among other things, our business, financial condition, results of operations or liquidity, or on our management, employees, customers and critical vendors and suppliers. In view of the many unknowns associated with the COVID-19 pandemic, our forward-looking statements continue to be subject to various conditions that may be substantially different than what we are currently expecting, including, but not limited to, a weakened U.S. economic recovery, prolonged economic recovery, deterioration of commercial and consumer customer fundamentals and sentiments and impairment of the recovery of the U.S. labor market. As a result, the COVID-19 outbreaks and its consequences, including responsive measures to manage it and the uncertainty regarding its duration, may possibly have a material adverse impact on our business, operations and financial performance. The risks identified here are not exclusive. Actual results may differ materially from those expressed or implied as a result of these risks and uncertainties, including, but not limited to, the risk factors and other uncertainties described under Item 1A Risk Factors and Risk Management sections of our Annual Report on Form 10-K (including the MD&A section) for the year ended December 31, 2019, our subsequent 2020 Quarterly Reports on Form 10-Q (including the risk factors and risk management discussions) and our other subsequent filings with the SEC, which are available on our corporate website at https://www.fnb-online.com/about-us/investor-relations-shareholder- services. The F.N.B web address is included as an inactive textual reference only. Information on the F.N.B website is not part of this presentation. To supplement F.N.B.’s Consolidated Financial Statements presented in accordance with GAAP, we use certain non-GAAP financial measures, such as operating net income available to common stockholders, operating earnings per diluted common share, return on average tangible equity, return on average tangible common equity, operating return on tangible common equity, return on average tangible assets, operating net income, operating return on tangible assets, operating return on average assets, tangible book value per common share, the ratio of tangible common equity to tangible assets, allowance for credit losses to loans and leases, excluding PPP loans, non- performing loans to loans and leases, excluding PPP loans, non-performing loans + OREO to loans and leases + OREO, excluding PPP loans, non-performing loans and 90 days past due and OREO to loans and leases plus OREO, excluding PPP loans, net loan charge-offs to average loans and leases, excluding PPP loans, past due and non-accrual loans to loans and leases, excluding PPP loans, pre-provision net revenue to average tangible common equity, efficiency ratio, and net interest margin (FTE) to provide information useful to investors in understanding our operating performance and trends, and to facilitate comparisons with the performance of our peers. Management uses these measures internally to assess and better understand our underlying business performance and trends related to core business activities. The non-GAAP financial measures and key performance indicators we use may differ from the non-GAAP financial measures and key performance indicators other financial institutions use to assess their performance and trends. More specifically, our forward-looking statements may be subject to the evolving risks and uncertainties related to the COVID-19 pandemic and its macro-economic impact and the resulting governmental, business and societal responses to it. These non-GAAP financial measures should be viewed as supplemental in nature, and not as a substitute for, or superior to, our reported results prepared in accordance with GAAP. The “Supplemental Information” at the end of this presentation contains a reconciliation of the differences between the non-GAAP financial measure presented and the most directly comparable financial measure calculated and presented in accordance with GAAP. The information should be reviewed in conjunction with F.N.B.’s financial results disclosed on January 19, 2021 as well as F.N.B’s Annual Report on Form 10-K for the year ended December 31, 2019, subsequent quarterly 2020 Form 10-Q filings, and other subsequent filings with the SEC. 2Cautionary Statement Regarding Forward-Looking Information and Non-GAAP Financial Information This document may contain statements regarding F.N.B. Corporation’s outlook for earnings, revenues, expenses, tax rates, capital and liquidity levels and ratios, asset quality levels, financial position and other matters regarding or affecting our current or future business and operations. These statements can be considered as “forward-looking statements” within the meaning of the Private Securities Litigation Reform Act of 1995. These forward-looking statements involve various assumptions, risks and uncertainties which can change over time. Actual results or future events may be different from those anticipated in our forward-looking statements and may not align with historical performance and events. As forward-looking statements involve significant risks and uncertainties, caution should be exercised against placing undue reliance upon such statements. Forward-looking statements are typically identified by words such as believe, plan, expect, anticipate, intend, outlook, estimate, forecast, will, should, project, goal, and other similar words and expressions. F.N.B. does not assume any duty to update forward-looking statements, except as required by federal securities laws. F.N.B.’s forward-looking statements are subject to the following principal risks and uncertainties: Our business, financial results and balance sheet values are affected by business and economic circumstances, including, but not limited to: (i) developments with respect to the U.S. and global financial markets; (ii) actions by the Federal Reserve Board, U.S. Treasury Department, Office of the Comptroller of the Currency and other governmental agencies, especially those that impact money supply, market interest rates or otherwise affect business activities of the financial services industry; (iii) a slowing of the U.S. economic environment; and (iv) the impacts of tariffs or other trade policies of the U.S.. Business and operating results are affected by our ability to identify and effectively manage risks inherent in our businesses, including, where appropriate, through effective use of systems and controls, third-party insurance, derivatives, and capital management techniques, and to meet evolving regulatory capital and liquidity standards. Competition can have an impact on customer acquisition, growth and retention, and on credit spreads, deposit gathering and product pricing, which can affect market share, deposits and revenues. Our ability to anticipate and continue to respond to technological changes and COVID-19 challenges can also impact our ability to respond to customer needs and meet competitive demands. Business and operating results can also be affected by widespread natural and other disasters, pandemics, including the COVID-19 pandemic crisis, dislocations, terrorist activities, system failures, security breaches, significant political events, cyber-attacks or international hostilities through impacts on the economy and financial markets generally, or on us or our counterparties specifically. Legal, regulatory and accounting developments could have an impact on our ability to operate and grow our businesses, financial condition, results of operations, competitive position, and reputation. Reputational impacts could affect matters such as business generation and retention, liquidity, funding, and the ability to attract and retain management. These developments could include: Changes resulting from a U.S. presidential administration or legislative and regulatory reforms, different approaches to supervisory or enforcement priorities, including changes affecting oversight of the financial services industry, regulatory obligations or restrictions, consumer protection, pension, bankruptcy and other industry aspects, and changes in accounting policies and principles. Changes to regulations governing bank capital and liquidity standards. Unfavorable resolution of legal proceedings or other claims and regulatory and other governmental investigations or other inquiries. These matters may result in monetary judgments or settlements or other remedies, including fines, penalties, restitution or alterations in our business practices, and in additional expenses and collateral costs, and may cause reputational harm to F.N.B. Results of the regulatory examination and supervision process, including our failure to satisfy requirements imposed by the federal bank regulatory agencies or other governmental agencies. The impact on our financial condition, results of operations, financial disclosures and future business strategies related to the implementation of the new FASB Accounting Standards Update 2016-13 Financial Instruments -Credit Losses commonly referred to as the “current expected credit loss” standard or CECL. A failure or disruption in or breach of our operational or security systems or infrastructure, or those of third parties, including as a result of cyber-attacks or campaigns. The COVID-19 pandemic and the regulatory and governmental actions implemented in response to COVID-19 have resulted in significant deterioration and disruption in financial markets, national and local economic conditions and record levels of unemployment and could have a material impact on, among other things, our business, financial condition, results of operations or liquidity, or on our management, employees, customers and critical vendors and suppliers. In view of the many unknowns associated with the COVID-19 pandemic, our forward-looking statements continue to be subject to various conditions that may be substantially different than what we are currently expecting, including, but not limited to, a weakened U.S. economic recovery, prolonged economic recovery, deterioration of commercial and consumer customer fundamentals and sentiments and impairment of the recovery of the U.S. labor market. As a result, the COVID-19 outbreaks and its consequences, including responsive measures to manage it and the uncertainty regarding its duration, may possibly have a material adverse impact on our business, operations and financial performance. The risks identified here are not exclusive. Actual results may differ materially from those expressed or implied as a result of these risks and uncertainties, including, but not limited to, the risk factors and other uncertainties described under Item 1A Risk Factors and Risk Management sections of our Annual Report on Form 10-K (including the MD&A section) for the year ended December 31, 2019, our subsequent 2020 Quarterly Reports on Form 10-Q (including the risk factors and risk management discussions) and our other subsequent filings with the SEC, which are available on our corporate website at https://www.fnb-online.com/about-us/investor-relations-shareholder- services. The F.N.B web address is included as an inactive textual reference only. Information on the F.N.B website is not part of this presentation. To supplement F.N.B.’s Consolidated Financial Statements presented in accordance with GAAP, we use certain non-GAAP financial measures, such as operating net income available to common stockholders, operating earnings per diluted common share, return on average tangible equity, return on average tangible common equity, operating return on tangible common equity, return on average tangible assets, operating net income, operating return on tangible assets, operating return on average assets, tangible book value per common share, the ratio of tangible common equity to tangible assets, allowance for credit losses to loans and leases, excluding PPP loans, non- performing loans to loans and leases, excluding PPP loans, non-performing loans + OREO to loans and leases + OREO, excluding PPP loans, non-performing loans and 90 days past due and OREO to loans and leases plus OREO, excluding PPP loans, net loan charge-offs to average loans and leases, excluding PPP loans, past due and non-accrual loans to loans and leases, excluding PPP loans, pre-provision net revenue to average tangible common equity, efficiency ratio, and net interest margin (FTE) to provide information useful to investors in understanding our operating performance and trends, and to facilitate comparisons with the performance of our peers. Management uses these measures internally to assess and better understand our underlying business performance and trends related to core business activities. The non-GAAP financial measures and key performance indicators we use may differ from the non-GAAP financial measures and key performance indicators other financial institutions use to assess their performance and trends. More specifically, our forward-looking statements may be subject to the evolving risks and uncertainties related to the COVID-19 pandemic and its macro-economic impact and the resulting governmental, business and societal responses to it. These non-GAAP financial measures should be viewed as supplemental in nature, and not as a substitute for, or superior to, our reported results prepared in accordance with GAAP. The “Supplemental Information” at the end of this presentation contains a reconciliation of the differences between the non-GAAP financial measure presented and the most directly comparable financial measure calculated and presented in accordance with GAAP. The information should be reviewed in conjunction with F.N.B.’s financial results disclosed on January 19, 2021 as well as F.N.B’s Annual Report on Form 10-K for the year ended December 31, 2019, subsequent quarterly 2020 Form 10-Q filings, and other subsequent filings with the SEC. 2
Corporate Profile and Overview 3Corporate Profile and Overview 3
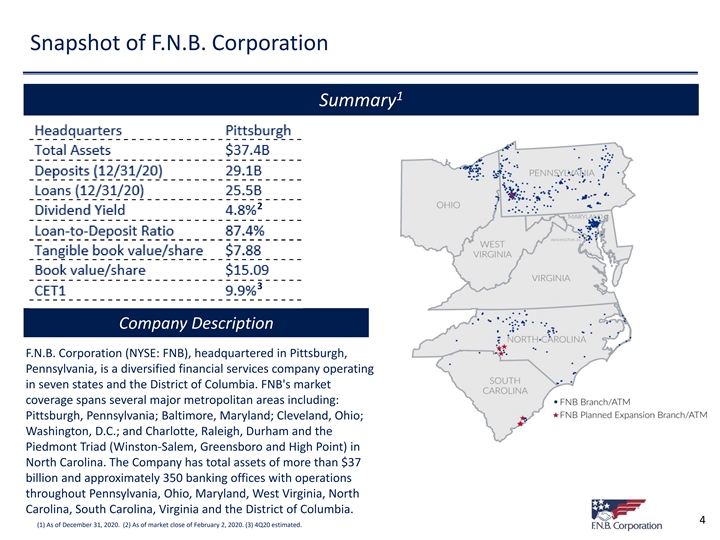
Snapshot of F.N.B. Corporation 1 Summary 2 3 Company Description F.N.B. Corporation (NYSE: FNB), headquartered in Pittsburgh, Pennsylvania, is a diversified financial services company operating in seven states and the District of Columbia. FNB's market coverage spans several major metropolitan areas including: Pittsburgh, Pennsylvania; Baltimore, Maryland; Cleveland, Ohio; Washington, D.C.; and Charlotte, Raleigh, Durham and the Piedmont Triad (Winston-Salem, Greensboro and High Point) in North Carolina. The Company has total assets of more than $37 billion and approximately 350 banking offices with operations throughout Pennsylvania, Ohio, Maryland, West Virginia, North Carolina, South Carolina, Virginia and the District of Columbia. 4 (1) As of December 31, 2020. (2) As of market close of February 2, 2020. (3) 4Q20 estimated.Snapshot of F.N.B. Corporation 1 Summary 2 3 Company Description F.N.B. Corporation (NYSE: FNB), headquartered in Pittsburgh, Pennsylvania, is a diversified financial services company operating in seven states and the District of Columbia. FNB's market coverage spans several major metropolitan areas including: Pittsburgh, Pennsylvania; Baltimore, Maryland; Cleveland, Ohio; Washington, D.C.; and Charlotte, Raleigh, Durham and the Piedmont Triad (Winston-Salem, Greensboro and High Point) in North Carolina. The Company has total assets of more than $37 billion and approximately 350 banking offices with operations throughout Pennsylvania, Ohio, Maryland, West Virginia, North Carolina, South Carolina, Virginia and the District of Columbia. 4 (1) As of December 31, 2020. (2) As of market close of February 2, 2020. (3) 4Q20 estimated.

The Six Pillars of our Long-Term Strategy FNB drives performance to further improve on long-term strategic planning metrics Optimize the Build a Strong, Drive Organic Retail Bank Differentiated Brand Growth Promote Core Maintain Build a Durable, Values including Scalable Efficiency and Diversity & Infrastructure Expense Control Inclusion 5The Six Pillars of our Long-Term Strategy FNB drives performance to further improve on long-term strategic planning metrics Optimize the Build a Strong, Drive Organic Retail Bank Differentiated Brand Growth Promote Core Maintain Build a Durable, Values including Scalable Efficiency and Diversity & Infrastructure Expense Control Inclusion 5
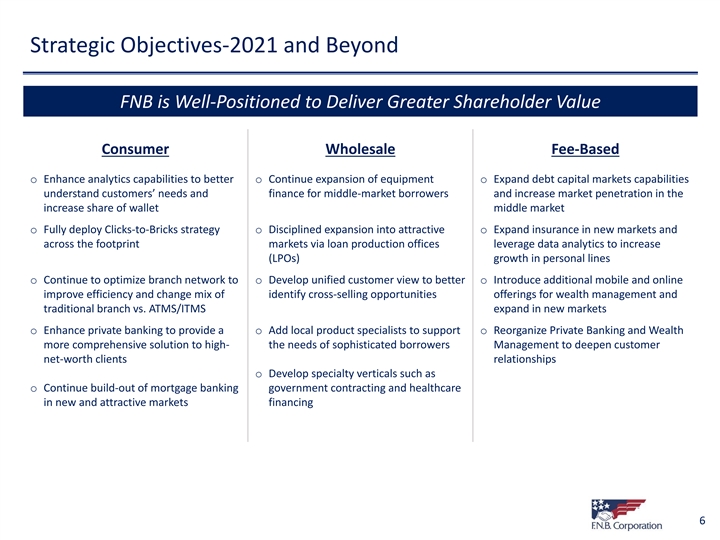
Strategic Objectives-2021 and Beyond FNB is Well-Positioned to Deliver Greater Shareholder Value Consumer Wholesale Fee-Based o Enhance analytics capabilities to better o Continue expansion of equipment o Expand debt capital markets capabilities understand customers’ needs and finance for middle-market borrowers and increase market penetration in the increase share of wallet middle market o Fully deploy Clicks-to-Bricks strategy o Disciplined expansion into attractive o Expand insurance in new markets and across the footprint markets via loan production offices leverage data analytics to increase (LPOs) growth in personal lines o Continue to optimize branch network to o Develop unified customer view to better o Introduce additional mobile and online improve efficiency and change mix of identify cross-selling opportunities offerings for wealth management and traditional branch vs. ATMS/ITMS expand in new markets o Enhance private banking to provide a o Add local product specialists to support o Reorganize Private Banking and Wealth more comprehensive solution to high- the needs of sophisticated borrowers Management to deepen customer net-worth clients relationships o Develop specialty verticals such as o Continue build-out of mortgage banking government contracting and healthcare in new and attractive markets financing 6Strategic Objectives-2021 and Beyond FNB is Well-Positioned to Deliver Greater Shareholder Value Consumer Wholesale Fee-Based o Enhance analytics capabilities to better o Continue expansion of equipment o Expand debt capital markets capabilities understand customers’ needs and finance for middle-market borrowers and increase market penetration in the increase share of wallet middle market o Fully deploy Clicks-to-Bricks strategy o Disciplined expansion into attractive o Expand insurance in new markets and across the footprint markets via loan production offices leverage data analytics to increase (LPOs) growth in personal lines o Continue to optimize branch network to o Develop unified customer view to better o Introduce additional mobile and online improve efficiency and change mix of identify cross-selling opportunities offerings for wealth management and traditional branch vs. ATMS/ITMS expand in new markets o Enhance private banking to provide a o Add local product specialists to support o Reorganize Private Banking and Wealth more comprehensive solution to high- the needs of sophisticated borrowers Management to deepen customer net-worth clients relationships o Develop specialty verticals such as o Continue build-out of mortgage banking government contracting and healthcare in new and attractive markets financing 6

Market Strategy 7Market Strategy 7

FNB’s Market Strategy Customer Acquisition Market Entry Customer Service Targeting large and growing markets Developing new opportunities Building lasting relationships o Made significant investment in o FNB’s Northeastern, Mid-Atlantic, o Digital infrastructure and virtual digital and omnichannel ecosystem helped with 1:1 and Southeastern markets are applications designed to be marketing efforts large and among some of the customer centric fastest growing in the country o Added leadership in key growth o FNB’s partnership with PAI and o Collectively, these markets have markets to continue building out Royal Farms will deploy more than the franchise and foster almost 615k businesses with 190 ATMs in the Mid-Atlantic relationships with new customers revenues greater than $100k and markets increasing ATM network have a projected compound by 30% o Deposits in new markets annual population growth rate of 1% increased 5% over the last five years, exceeding average total market growth rate 8 (1) S&P Global Intelligence: Average of 5 year CAGRs of FNBs new markets listed on page 9. (2) S&P Global Intelligence FNB’s Market Strategy Customer Acquisition Market Entry Customer Service Targeting large and growing markets Developing new opportunities Building lasting relationships o Made significant investment in o FNB’s Northeastern, Mid-Atlantic, o Digital infrastructure and virtual digital and omnichannel ecosystem helped with 1:1 and Southeastern markets are applications designed to be marketing efforts large and among some of the customer centric fastest growing in the country o Added leadership in key growth o FNB’s partnership with PAI and o Collectively, these markets have markets to continue building out Royal Farms will deploy more than the franchise and foster almost 615k businesses with 190 ATMs in the Mid-Atlantic relationships with new customers revenues greater than $100k and markets increasing ATM network have a projected compound by 30% o Deposits in new markets annual population growth rate of 1% increased 5% over the last five years, exceeding average total market growth rate 8 (1) S&P Global Intelligence: Average of 5 year CAGRs of FNBs new markets listed on page 9. (2) S&P Global Intelligence

1 FNB’s Deposit Growth has Outpaced Competitors’ in New Markets FNB’s new market deposit CAGR is 5% over the last 5 years, exceeding the market growth rate 5 1 Cleveland Winston-Salem 1 Population: 683k Population: 2.1 million # of 100k Bus: 68k # of 100k Bus: 19k Deposit Market Share Rank: 12 Deposit Market Share Rank: 5 Deposit Market Share: 7.5% Deposit Market Share: 1.0% 2 2 2 6 Pittsburgh Greensboro Population: 2.3 million 3 Population: 781k # of 100k Bus: 24k # of 100k Bus: 86k 4 Deposit Market Share Rank: 3 Deposit Market Share Rank: 7 Deposit Market Share: 4.0% Deposit Market Share: 6.0% 3 Raleigh Baltimore 7 Population: 2.8 million Population: 1.4 million 5 6 # of 100k Bus: 40k # of 100k Bus: 91k 7 Deposit Market Share Rank: 7 Deposit Market Share Rank: 10 Deposit Market Share: 2.0% Deposit Market Share: 2.0% 8 4 Charlotte Washington D.C 8 Population: 6.3 million Population: 2.7 million # of 100k Bus: 206k # of 100k Bus: 79k FNB Branch FNB Planned Branch Deposit Market Share Rank: 8 Deposit Market Share Rank: 40 Deposit Market Share: 0.1% Deposit Market Share: 0.3% 9 (1) Per S&P Global Market Intelligence, as of June 30, 2020. (2) Excludes custodial banks.1 FNB’s Deposit Growth has Outpaced Competitors’ in New Markets FNB’s new market deposit CAGR is 5% over the last 5 years, exceeding the market growth rate 5 1 Cleveland Winston-Salem 1 Population: 683k Population: 2.1 million # of 100k Bus: 68k # of 100k Bus: 19k Deposit Market Share Rank: 12 Deposit Market Share Rank: 5 Deposit Market Share: 7.5% Deposit Market Share: 1.0% 2 2 2 6 Pittsburgh Greensboro Population: 2.3 million 3 Population: 781k # of 100k Bus: 24k # of 100k Bus: 86k 4 Deposit Market Share Rank: 3 Deposit Market Share Rank: 7 Deposit Market Share: 4.0% Deposit Market Share: 6.0% 3 Raleigh Baltimore 7 Population: 2.8 million Population: 1.4 million 5 6 # of 100k Bus: 40k # of 100k Bus: 91k 7 Deposit Market Share Rank: 7 Deposit Market Share Rank: 10 Deposit Market Share: 2.0% Deposit Market Share: 2.0% 8 4 Charlotte Washington D.C 8 Population: 6.3 million Population: 2.7 million # of 100k Bus: 206k # of 100k Bus: 79k FNB Branch FNB Planned Branch Deposit Market Share Rank: 8 Deposit Market Share Rank: 40 Deposit Market Share: 0.1% Deposit Market Share: 0.3% 9 (1) Per S&P Global Market Intelligence, as of June 30, 2020. (2) Excludes custodial banks.
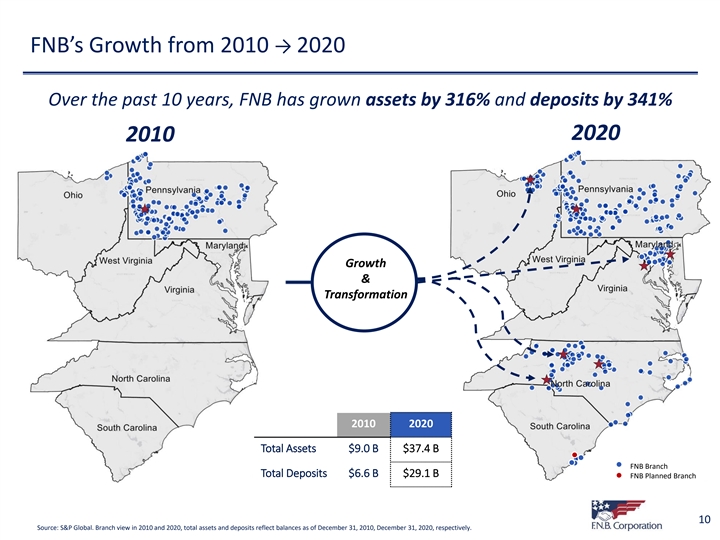
FNB’s Growth from 2010 → 2020 Over the past 10 years, FNB has grown assets by 316% and deposits by 341% 2020 2010 Growth & Transformation 2010 2020 Total Assets $9.0 B $37.4 B FNB Branch Total Deposits $6.6 B $29.1 B FNB Planned Branch 10 Source: S&P Global. Branch view in 2010 and 2020, total assets and deposits reflect balances as of December 31, 2010, December 31, 2020, respectively.FNB’s Growth from 2010 → 2020 Over the past 10 years, FNB has grown assets by 316% and deposits by 341% 2020 2010 Growth & Transformation 2010 2020 Total Assets $9.0 B $37.4 B FNB Branch Total Deposits $6.6 B $29.1 B FNB Planned Branch 10 Source: S&P Global. Branch view in 2010 and 2020, total assets and deposits reflect balances as of December 31, 2010, December 31, 2020, respectively.

FNB is committed to serving small business customers As a % of Total Commercial loans, Loan Balances, 1,2 1 Commercial Loans Sized $0k - $1 million Commercial Loans Sized $0k - $1 million ($Bn) 31% 7.0 6.8 29% 6.1 26% 25% 25% 5.3 5.1 5.1 22% 4.7 20% 19% 19% 18% 3.8 16% 3.6 3.5 15% 15% 14% 3.0 3.0 13% 2.7 10% 2.2 2.1 7% 1.3 1.1 3% 0.3 1. Call Report data via SNL Financial, as of 3Q20 vs. Peer Group 2. Commercial Loans include reported Non-Farm & Non-Residential Loans and Commercial & Industrial Loans $0k-$1 million. Loans in the $750k-$1 million cohort for FNB would be part of 11 wholesale banking. Total Commercial Loans include reported CRE loans and Commercial & Industrial Loans. FNB is committed to serving small business customers As a % of Total Commercial loans, Loan Balances, 1,2 1 Commercial Loans Sized $0k - $1 million Commercial Loans Sized $0k - $1 million ($Bn) 31% 7.0 6.8 29% 6.1 26% 25% 25% 5.3 5.1 5.1 22% 4.7 20% 19% 19% 18% 3.8 16% 3.6 3.5 15% 15% 14% 3.0 3.0 13% 2.7 10% 2.2 2.1 7% 1.3 1.1 3% 0.3 1. Call Report data via SNL Financial, as of 3Q20 vs. Peer Group 2. Commercial Loans include reported Non-Farm & Non-Residential Loans and Commercial & Industrial Loans $0k-$1 million. Loans in the $750k-$1 million cohort for FNB would be part of 11 wholesale banking. Total Commercial Loans include reported CRE loans and Commercial & Industrial Loans.

FNB Funded $2.5 Billion of net PPP Loans PPP Funded PPP as % of as of 9/30/20 ($B) Total Loans Peer 1 $3.2 18.0% Peer 2 $6.8 12.6% Peer 3 $2.3 10.6% Peer 4 $2.0 10.4% Peer 5 $3.4 10.3% Peer 6 $2.3 10.1% FNB $2.5 9.8% Peer 7 $1.5 9.3% Peer 8 $2.0 8.8% Peer 9 $6.3 7.9% Peer 10 $7.8 7.6% Peer 11 $2.3 7.1% Peer 12 $4.2 7.0% Peer 13 $1.3 7.0% Peer 14 $2.7 6.8% Peer 15 $1.4 6.3% Peer 16 $2.6 5.7% Peer 17 $1.0 4.1% Peer 18 $0.1 0.3% Median $2.3 7.9% Per S&P Global as of September 30, 2020: Peers include ASB, CBSH, CFR, FHN, FULT, HWC, IBKC, NYCB, PBCT, PNFP, SNV, UBSI, UMPQ, VLY, WBS, and WTFC 12 (1) Excludes Peers 2, 9, and 10FNB Funded $2.5 Billion of net PPP Loans PPP Funded PPP as % of as of 9/30/20 ($B) Total Loans Peer 1 $3.2 18.0% Peer 2 $6.8 12.6% Peer 3 $2.3 10.6% Peer 4 $2.0 10.4% Peer 5 $3.4 10.3% Peer 6 $2.3 10.1% FNB $2.5 9.8% Peer 7 $1.5 9.3% Peer 8 $2.0 8.8% Peer 9 $6.3 7.9% Peer 10 $7.8 7.6% Peer 11 $2.3 7.1% Peer 12 $4.2 7.0% Peer 13 $1.3 7.0% Peer 14 $2.7 6.8% Peer 15 $1.4 6.3% Peer 16 $2.6 5.7% Peer 17 $1.0 4.1% Peer 18 $0.1 0.3% Median $2.3 7.9% Per S&P Global as of September 30, 2020: Peers include ASB, CBSH, CFR, FHN, FULT, HWC, IBKC, NYCB, PBCT, PNFP, SNV, UBSI, UMPQ, VLY, WBS, and WTFC 12 (1) Excludes Peers 2, 9, and 10

Clicks-to-Bricks 13Clicks-to-Bricks 13
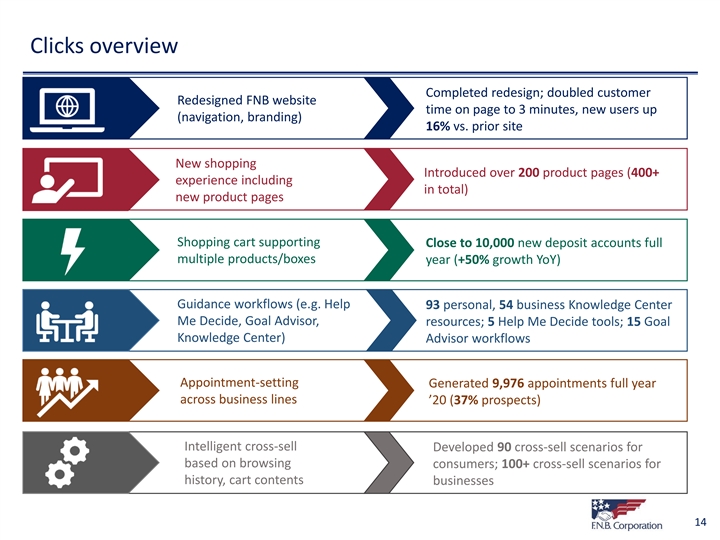
Clicks overview Completed redesign; doubled customer Redesigned FNB website time on page to 3 minutes, new users up (navigation, branding) 16% vs. prior site New shopping Introduced over 200 product pages (400+ experience including in total) new product pages Shopping cart supporting Close to 10,000 new deposit accounts full multiple products/boxes year (+50% growth YoY) Guidance workflows (e.g. Help 93 personal, 54 business Knowledge Center Me Decide, Goal Advisor, resources; 5 Help Me Decide tools; 15 Goal Knowledge Center) Advisor workflows Appointment-setting Generated 9,976 appointments full year across business lines ’20 (37% prospects) Intelligent cross-sell Developed 90 cross-sell scenarios for based on browsing consumers; 100+ cross-sell scenarios for history, cart contents businesses 14Clicks overview Completed redesign; doubled customer Redesigned FNB website time on page to 3 minutes, new users up (navigation, branding) 16% vs. prior site New shopping Introduced over 200 product pages (400+ experience including in total) new product pages Shopping cart supporting Close to 10,000 new deposit accounts full multiple products/boxes year (+50% growth YoY) Guidance workflows (e.g. Help 93 personal, 54 business Knowledge Center Me Decide, Goal Advisor, resources; 5 Help Me Decide tools; 15 Goal Knowledge Center) Advisor workflows Appointment-setting Generated 9,976 appointments full year across business lines ’20 (37% prospects) Intelligent cross-sell Developed 90 cross-sell scenarios for based on browsing consumers; 100+ cross-sell scenarios for history, cart contents businesses 14

FNB’s Data Strategy FNB’s virtual ecosystem utilizes disciplined data management, leverages analytics, and adds value for customers Data Management Analytics Digital Banking 1:1 Marketing o 100 servers running o 60 proprietary o More than o More than 700,000 SQL managing 50 models and 7,000,000 online banking users terabytes of data as an algorithms built in marketing offers o Replicating the retail asset house via direct mail and shopping experience o Championing o Advanced analytical email in the last 18 o Creating an enterprise data quality problem solving months omnichannel and integrity o Implementation of o Relevant product application o Establishing an test and learning and service o Digital content for 0 enterprise data culture recommendations products and 360 foundation to digitize o Development and o Product-based customer dashboard the bank maintenance of promotional offers o Deploying foundational CECL/DFAST models o Customized data infrastructure to website homepage support goals images 15FNB’s Data Strategy FNB’s virtual ecosystem utilizes disciplined data management, leverages analytics, and adds value for customers Data Management Analytics Digital Banking 1:1 Marketing o 100 servers running o 60 proprietary o More than o More than 700,000 SQL managing 50 models and 7,000,000 online banking users terabytes of data as an algorithms built in marketing offers o Replicating the retail asset house via direct mail and shopping experience o Championing o Advanced analytical email in the last 18 o Creating an enterprise data quality problem solving months omnichannel and integrity o Implementation of o Relevant product application o Establishing an test and learning and service o Digital content for 0 enterprise data culture recommendations products and 360 foundation to digitize o Development and o Product-based customer dashboard the bank maintenance of promotional offers o Deploying foundational CECL/DFAST models o Customized data infrastructure to website homepage support goals images 15
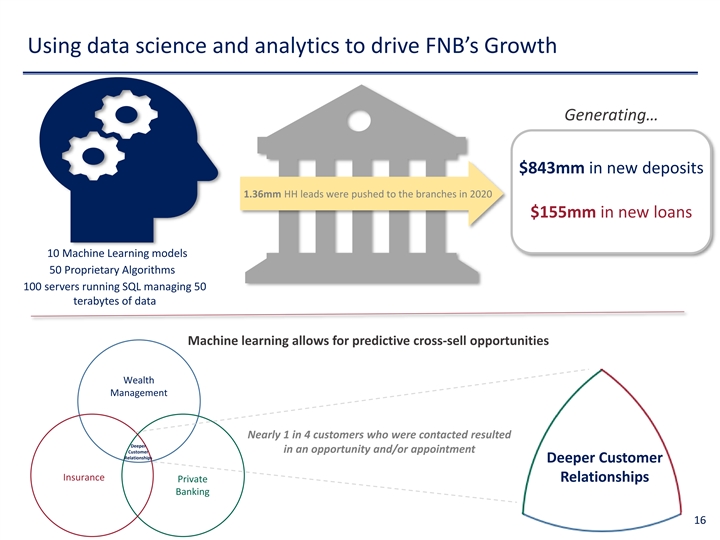
Using data science and analytics to drive FNB’s Growth Generating… $843mm in new deposits 1.36mm HH leads were pushed to the branches in 2020 $155mm in new loans 10 Machine Learning models 50 Proprietary Algorithms 100 servers running SQL managing 50 terabytes of data Machine learning allows for predictive cross-sell opportunities Wealth Management Nearly 1 in 4 customers who were contacted resulted Deeper in an opportunity and/or appointment Customer Relationships Deeper Customer Insurance Private Relationships Banking 16Using data science and analytics to drive FNB’s Growth Generating… $843mm in new deposits 1.36mm HH leads were pushed to the branches in 2020 $155mm in new loans 10 Machine Learning models 50 Proprietary Algorithms 100 servers running SQL managing 50 terabytes of data Machine learning allows for predictive cross-sell opportunities Wealth Management Nearly 1 in 4 customers who were contacted resulted Deeper in an opportunity and/or appointment Customer Relationships Deeper Customer Insurance Private Relationships Banking 16

Clicks-to-Bricks: Expediting multi-product account opening (2021) 2021 Timeline Q1 ‘21 Q2 ‘21 Q3 ‘21 Q4 ‘21 Both mobile and desktop responsive, will allow users to quickly and easily apply online for multiple products Credit Card Mortgage Consumer Deposits Consumer Lending Small Business Deposits Small Business Lending Unified Online Application Loans Deposits Mortgage Wealth & Other Draft: Universal Application on Laptop and Phone (concept only; designs not finalized) 17Clicks-to-Bricks: Expediting multi-product account opening (2021) 2021 Timeline Q1 ‘21 Q2 ‘21 Q3 ‘21 Q4 ‘21 Both mobile and desktop responsive, will allow users to quickly and easily apply online for multiple products Credit Card Mortgage Consumer Deposits Consumer Lending Small Business Deposits Small Business Lending Unified Online Application Loans Deposits Mortgage Wealth & Other Draft: Universal Application on Laptop and Phone (concept only; designs not finalized) 17

Clicks-to-Bricks: 360-Degree Customer Dashboard (~2022) Customer Benefits • Provides the customer a complete high-level view of their FNB relationship • Allows customers to easily access balances and recent transactions • Will facilitate single sign-on to individual sub-systems for speedy transactions FNB Benefits • Customers are assigned a persona based upon their on-site browsing (i.e. lending-focused, deposit focused, etc.) • Cross-sell products are customized based upon these personas • Major site resources such as the main site image are customized to promote products important to customers in those personas 18 Draft: 360-degree Dashboard (default view) on Laptop and Phone (concept only; designs not finalized)Clicks-to-Bricks: 360-Degree Customer Dashboard (~2022) Customer Benefits • Provides the customer a complete high-level view of their FNB relationship • Allows customers to easily access balances and recent transactions • Will facilitate single sign-on to individual sub-systems for speedy transactions FNB Benefits • Customers are assigned a persona based upon their on-site browsing (i.e. lending-focused, deposit focused, etc.) • Cross-sell products are customized based upon these personas • Major site resources such as the main site image are customized to promote products important to customers in those personas 18 Draft: 360-degree Dashboard (default view) on Laptop and Phone (concept only; designs not finalized)
Fourth Quarter 2020 & Full Year 2020 Financial Results Recap 19Fourth Quarter 2020 & Full Year 2020 Financial Results Recap 19
Key Highlights – Fourth Quarter 2020 o Reported earnings per diluted common share of $0.22, operating earnings per share of $0.28 o Average loan balances decreased $0.4 billion, or 6% linked-quarter annualized, due to impact from the November indirect auto loan sale (totaled $0.4 billion in average balances), as commercial loan balances were flat (average PPP loan balances declined $0.1 billion linked-quarter due to forgiveness during the fourth quarter) o Average deposit growth of $0.6 billion, or 8% linked-quarter annualized, with non-interest bearing deposit growth of $0.2 billion, or 10% annualized o Net interest income totaled $234.4 million, as interest-bearing deposit costs improved 12 bps from 3Q20 o Operating non-interest income of $80.7 million, led by mortgage banking and capital markets o Operating non-interest expense totaled $184.2 million; efficiency ratio of 56.5% o Continue to closely monitor impact of COVID-19 on asset quality & reduced exposure to sensitive industries o Tangible book value per share of $7.88, 5% increase from 4Q19 o Tangible Common Equity to Tangible Assets ratio of 7.24% (7.70% excluding PPP), up 5 bps from September 30, 2020 o Repurchased 1.63 million shares during 4Q20 at weighted average price of $8.22, totaling $13.4 million 20Key Highlights – Fourth Quarter 2020 o Reported earnings per diluted common share of $0.22, operating earnings per share of $0.28 o Average loan balances decreased $0.4 billion, or 6% linked-quarter annualized, due to impact from the November indirect auto loan sale (totaled $0.4 billion in average balances), as commercial loan balances were flat (average PPP loan balances declined $0.1 billion linked-quarter due to forgiveness during the fourth quarter) o Average deposit growth of $0.6 billion, or 8% linked-quarter annualized, with non-interest bearing deposit growth of $0.2 billion, or 10% annualized o Net interest income totaled $234.4 million, as interest-bearing deposit costs improved 12 bps from 3Q20 o Operating non-interest income of $80.7 million, led by mortgage banking and capital markets o Operating non-interest expense totaled $184.2 million; efficiency ratio of 56.5% o Continue to closely monitor impact of COVID-19 on asset quality & reduced exposure to sensitive industries o Tangible book value per share of $7.88, 5% increase from 4Q19 o Tangible Common Equity to Tangible Assets ratio of 7.24% (7.70% excluding PPP), up 5 bps from September 30, 2020 o Repurchased 1.63 million shares during 4Q20 at weighted average price of $8.22, totaling $13.4 million 20
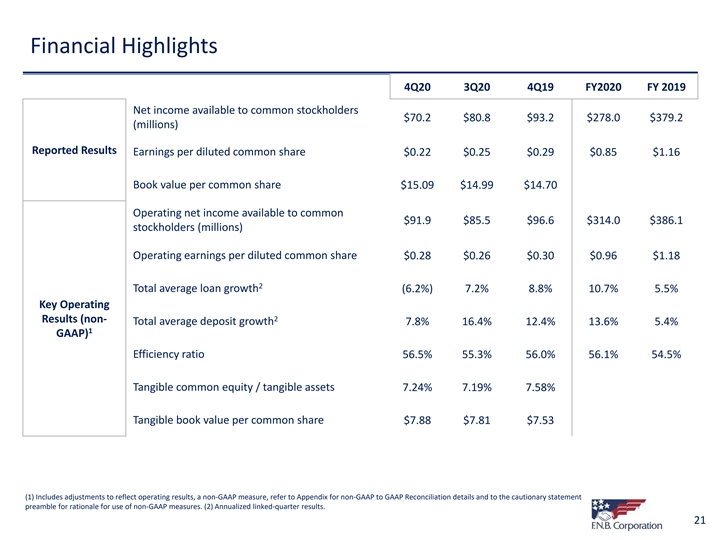
Financial Highlights 4Q20 3Q20 4Q19 FY2020 FY 2019 Net income available to common stockholders $70.2 $80.8 $93.2 $278.0 $379.2 (millions) Reported Results Earnings per diluted common share $0.22 $0.25 $0.29 $0.85 $1.16 Book value per common share $15.09 $14.99 $14.70 Operating net income available to common $91.9 $85.5 $96.6 $314.0 $386.1 stockholders (millions) Operating earnings per diluted common share $0.28 $0.26 $0.30 $0.96 $1.18 2 Total average loan growth (6.2%) 7.2% 8.8% 10.7% 5.5% Key Operating 2 Results (non- Total average deposit growth 7.8% 16.4% 12.4% 13.6% 5.4% 1 GAAP) Efficiency ratio 56.5% 55.3% 56.0% 56.1% 54.5% Tangible common equity / tangible assets 7.24% 7.19% 7.58% Tangible book value per common share $7.88 $7.81 $7.53 (1) Includes adjustments to reflect operating results, a non-GAAP measure, refer to Appendix for non-GAAP to GAAP Reconciliation details and to the cautionary statement preamble for rationale for use of non-GAAP measures. (2) Annualized linked-quarter results. 21Financial Highlights 4Q20 3Q20 4Q19 FY2020 FY 2019 Net income available to common stockholders $70.2 $80.8 $93.2 $278.0 $379.2 (millions) Reported Results Earnings per diluted common share $0.22 $0.25 $0.29 $0.85 $1.16 Book value per common share $15.09 $14.99 $14.70 Operating net income available to common $91.9 $85.5 $96.6 $314.0 $386.1 stockholders (millions) Operating earnings per diluted common share $0.28 $0.26 $0.30 $0.96 $1.18 2 Total average loan growth (6.2%) 7.2% 8.8% 10.7% 5.5% Key Operating 2 Results (non- Total average deposit growth 7.8% 16.4% 12.4% 13.6% 5.4% 1 GAAP) Efficiency ratio 56.5% 55.3% 56.0% 56.1% 54.5% Tangible common equity / tangible assets 7.24% 7.19% 7.58% Tangible book value per common share $7.88 $7.81 $7.53 (1) Includes adjustments to reflect operating results, a non-GAAP measure, refer to Appendix for non-GAAP to GAAP Reconciliation details and to the cautionary statement preamble for rationale for use of non-GAAP measures. (2) Annualized linked-quarter results. 21
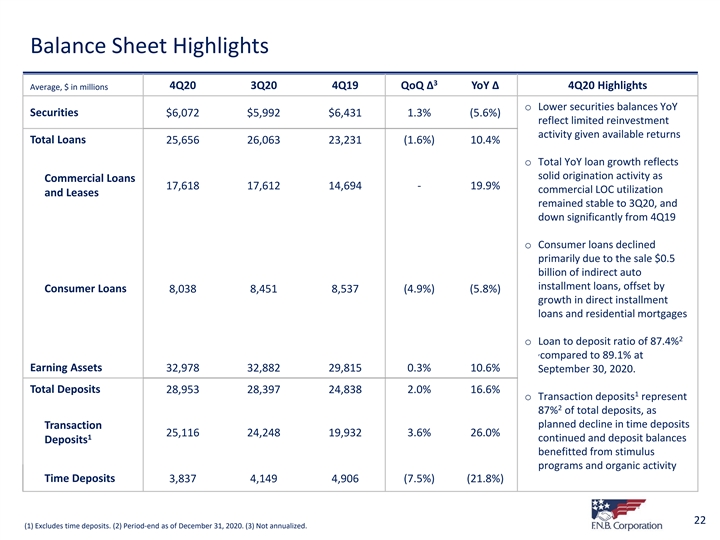
Balance Sheet Highlights 3 4Q20 3Q20 4Q19 QoQ Δ YoY Δ 4Q20 Highlights Average, $ in millions o Lower securities balances YoY Securities $6,072 $5,992 $6,431 1.3% (5.6%) reflect limited reinvestment activity given available returns Total Loans 25,656 26,063 23,231 (1.6%) 10.4% o Total YoY loan growth reflects solid origination activity as Commercial Loans 17,618 17,612 14,694 - 19.9% commercial LOC utilization and Leases remained stable to 3Q20, and down significantly from 4Q19 o Consumer loans declined primarily due to the sale $0.5 billion of indirect auto installment loans, offset by Consumer Loans 8,038 8,451 8,537 (4.9%) (5.8%) growth in direct installment loans and residential mortgages 2 o Loan to deposit ratio of 87.4% , compared to 89.1% at Earning Assets 32,978 32,882 29,815 0.3% 10.6% September 30, 2020. Total Deposits 28,953 28,397 24,838 2.0% 16.6% 1 o Transaction deposits represent 2 87% of total deposits, as planned decline in time deposits Transaction 25,116 24,248 19,932 3.6% 26.0% 1 continued and deposit balances Deposits benefitted from stimulus programs and organic activity Time Deposits 3,837 4,149 4,906 (7.5%) (21.8%) 22 (1) Excludes time deposits. (2) Period-end as of December 31, 2020. (3) Not annualized.Balance Sheet Highlights 3 4Q20 3Q20 4Q19 QoQ Δ YoY Δ 4Q20 Highlights Average, $ in millions o Lower securities balances YoY Securities $6,072 $5,992 $6,431 1.3% (5.6%) reflect limited reinvestment activity given available returns Total Loans 25,656 26,063 23,231 (1.6%) 10.4% o Total YoY loan growth reflects solid origination activity as Commercial Loans 17,618 17,612 14,694 - 19.9% commercial LOC utilization and Leases remained stable to 3Q20, and down significantly from 4Q19 o Consumer loans declined primarily due to the sale $0.5 billion of indirect auto installment loans, offset by Consumer Loans 8,038 8,451 8,537 (4.9%) (5.8%) growth in direct installment loans and residential mortgages 2 o Loan to deposit ratio of 87.4% , compared to 89.1% at Earning Assets 32,978 32,882 29,815 0.3% 10.6% September 30, 2020. Total Deposits 28,953 28,397 24,838 2.0% 16.6% 1 o Transaction deposits represent 2 87% of total deposits, as planned decline in time deposits Transaction 25,116 24,248 19,932 3.6% 26.0% 1 continued and deposit balances Deposits benefitted from stimulus programs and organic activity Time Deposits 3,837 4,149 4,906 (7.5%) (21.8%) 22 (1) Excludes time deposits. (2) Period-end as of December 31, 2020. (3) Not annualized.

Balance Sheet Actions Taken during 2H2020 o FNB took proactive measures to strengthen balance sheet and reduce credit risk in the second half of 2020 • In November, sold $0.5 billion of lower FICO indirect auto installment loans • Reduced COVID-19 sensitive industries exposure • Sold Visa B shares at a $13.8 million gain • Pre-paid $715 million of FHLB borrowings with a rate paid of 2.49%, for a breakage fee of $25.6 million • Paid $165 million in cash dividends in FY 2020 • Share buybacks totaled $38 million under current $150M share repurchase program during FY2020 Estimated CET1 Ratio 9.9% 9.4% Estimated CET1 Ratio will be strongest in company’s history 4Q19 Estimated 4Q20 CET1 Ratio 23Balance Sheet Actions Taken during 2H2020 o FNB took proactive measures to strengthen balance sheet and reduce credit risk in the second half of 2020 • In November, sold $0.5 billion of lower FICO indirect auto installment loans • Reduced COVID-19 sensitive industries exposure • Sold Visa B shares at a $13.8 million gain • Pre-paid $715 million of FHLB borrowings with a rate paid of 2.49%, for a breakage fee of $25.6 million • Paid $165 million in cash dividends in FY 2020 • Share buybacks totaled $38 million under current $150M share repurchase program during FY2020 Estimated CET1 Ratio 9.9% 9.4% Estimated CET1 Ratio will be strongest in company’s history 4Q19 Estimated 4Q20 CET1 Ratio 23

Revenue Highlights 4Q20 3Q20 4Q19 QoQ Δ YoY Δ 4Q20 Highlights $ in thousands o Net interest income reflects Total interest income $270,889 $272,431 $306,064 (0.6%) (11.5%) growth in average earning assets, reductions in the Total interest expense 36,497 45,333 79,627 (19.5%) (54.2%) cost of interest-bearing deposits, increased Net interest income $234,392 $227,098 $226,437 3.2% 3.5% contribution from PPP loans, strong growth in non- 68,364 80,038 74,041 (14.6%) (7.7%) Non-interest income interest bearing deposits and the termination of Total revenue $302,756 $307,136 $300,478 (1.4%) 0.8% higher-rate FHLB borrowings o Non-interest income was 1 driven by near-record Net interest margin (FTE) 2.87% 2.79% 3.07% 8 bps (20 bps) mortgage banking income and solid contributions from 1 capital markets, wealth Average earning asset yields (FTE) 3.31% 3.34% 4.13% (3 bps) (82 bps) management and insurance 1 Average loan yield (FTE) 3.67% 3.62% 4.54% 5 bps (87 bps) o Net interest margin Cost of funds 0.45% 0.56% 1.08% (11 bps) (63 bps) increased 8 bps as cost of interest-bearing deposits Cost of interest-bearing liabilities improved 12 basis points 0.62% 0.77% 1.38% (15 bps) (76 bps) from 3Q20 & PPP benefits offset lower earning asset Cost of interest-bearing deposits 0.43% 0.55% 1.19% (12 bps) (76 bps) yields on variable-rate loans & investments (1) A non-GAAP measure, refer to Non-GAAP to GAAP Reconciliation for further information 24Revenue Highlights 4Q20 3Q20 4Q19 QoQ Δ YoY Δ 4Q20 Highlights $ in thousands o Net interest income reflects Total interest income $270,889 $272,431 $306,064 (0.6%) (11.5%) growth in average earning assets, reductions in the Total interest expense 36,497 45,333 79,627 (19.5%) (54.2%) cost of interest-bearing deposits, increased Net interest income $234,392 $227,098 $226,437 3.2% 3.5% contribution from PPP loans, strong growth in non- 68,364 80,038 74,041 (14.6%) (7.7%) Non-interest income interest bearing deposits and the termination of Total revenue $302,756 $307,136 $300,478 (1.4%) 0.8% higher-rate FHLB borrowings o Non-interest income was 1 driven by near-record Net interest margin (FTE) 2.87% 2.79% 3.07% 8 bps (20 bps) mortgage banking income and solid contributions from 1 capital markets, wealth Average earning asset yields (FTE) 3.31% 3.34% 4.13% (3 bps) (82 bps) management and insurance 1 Average loan yield (FTE) 3.67% 3.62% 4.54% 5 bps (87 bps) o Net interest margin Cost of funds 0.45% 0.56% 1.08% (11 bps) (63 bps) increased 8 bps as cost of interest-bearing deposits Cost of interest-bearing liabilities improved 12 basis points 0.62% 0.77% 1.38% (15 bps) (76 bps) from 3Q20 & PPP benefits offset lower earning asset Cost of interest-bearing deposits 0.43% 0.55% 1.19% (12 bps) (76 bps) yields on variable-rate loans & investments (1) A non-GAAP measure, refer to Non-GAAP to GAAP Reconciliation for further information 24

FNB Net Interest Income and Net Interest Margin(FTE) o During 4Q20, reduced cost of deposits and borrowings helped support a higher net interest margin, as well as increased contributions from Payment Protection Program loans (PPP). o PPP benefitted FNB in 2H2020 with $32 million of unamortized fees remaining at 12/31/2020. 3Q20 to 4Q20 Net Interest Margin and Net Interest Income Net Interest Net Interest Income (FTE) Margin (FTE) 3Q20 reported $230.1 2.79% 4Q20 / 3Q20 B (W) $7.3 0.08% (1) Incremental PPP impact 8.8 0.11% Interest-bearing Deposits 5.9 0.07% Borrowings 2.9 0.04% Investments (1.9) (0.02%) (2) Purchase Accounting Accretion (PAA) (2.0) (0.02%) Loans (excluding PPP) (2.6) (0.03%) (3) Cash position (3.0) (0.03%) Indirect Auto Sale (3.8) (0.05%) Other 3.0 0.03% 4Q20 Reported $237.4 2.87% 3Q20 excluding PPP & PAA $197.3 2.60% 4Q20 excluding PPP & PAA $197.9 2.59% 4Q20 PAA 8.9 0.11% 4Q20 PPP $30.6 0.17% Coupon Interest Income 6.3 Net Fees 24.6 Funding Expense (0.3) (1) Variance for 4Q20 relative to 3Q20 levels. (2) PAA contribution from acquired loans. (3) Variance for higher average cash balances in 4Q20 compared to 3Q20 average cash balances. 25FNB Net Interest Income and Net Interest Margin(FTE) o During 4Q20, reduced cost of deposits and borrowings helped support a higher net interest margin, as well as increased contributions from Payment Protection Program loans (PPP). o PPP benefitted FNB in 2H2020 with $32 million of unamortized fees remaining at 12/31/2020. 3Q20 to 4Q20 Net Interest Margin and Net Interest Income Net Interest Net Interest Income (FTE) Margin (FTE) 3Q20 reported $230.1 2.79% 4Q20 / 3Q20 B (W) $7.3 0.08% (1) Incremental PPP impact 8.8 0.11% Interest-bearing Deposits 5.9 0.07% Borrowings 2.9 0.04% Investments (1.9) (0.02%) (2) Purchase Accounting Accretion (PAA) (2.0) (0.02%) Loans (excluding PPP) (2.6) (0.03%) (3) Cash position (3.0) (0.03%) Indirect Auto Sale (3.8) (0.05%) Other 3.0 0.03% 4Q20 Reported $237.4 2.87% 3Q20 excluding PPP & PAA $197.3 2.60% 4Q20 excluding PPP & PAA $197.9 2.59% 4Q20 PAA 8.9 0.11% 4Q20 PPP $30.6 0.17% Coupon Interest Income 6.3 Net Fees 24.6 Funding Expense (0.3) (1) Variance for 4Q20 relative to 3Q20 levels. (2) PAA contribution from acquired loans. (3) Variance for higher average cash balances in 4Q20 compared to 3Q20 average cash balances. 25

Line Utilization Trends If commercial utilization returned to December 2019 levels, it would translate into an additional $491mm of commercial loan growth Commercial LOC Utilization Trends 50.0% 45.0% 40.0% 35.0% 30.0% 12.19 1.20 2.20 3.20 4.20 5.20 6.20 7.20 8.20 9.20 10.20 11.20 12.20 Commercial Retail Business Banking Total Commercial If HELOC utilization returned to December 2019 levels, it would translate into an additional $215mm of consumer loan growth HELOC Utilization Trends 50.00% 48.00% 46.00% 44.00% 42.00% 40.00% 12.19 1.20 2.20 3.20 4.20 5.20 6.20 7.20 8.20 9.20 10.20 11.20 12.20 Senior Lein HELOC Junior Lein HELOC Total HELOC 26Line Utilization Trends If commercial utilization returned to December 2019 levels, it would translate into an additional $491mm of commercial loan growth Commercial LOC Utilization Trends 50.0% 45.0% 40.0% 35.0% 30.0% 12.19 1.20 2.20 3.20 4.20 5.20 6.20 7.20 8.20 9.20 10.20 11.20 12.20 Commercial Retail Business Banking Total Commercial If HELOC utilization returned to December 2019 levels, it would translate into an additional $215mm of consumer loan growth HELOC Utilization Trends 50.00% 48.00% 46.00% 44.00% 42.00% 40.00% 12.19 1.20 2.20 3.20 4.20 5.20 6.20 7.20 8.20 9.20 10.20 11.20 12.20 Senior Lein HELOC Junior Lein HELOC Total HELOC 26

Non-Interest Income 4Q20 3Q20 4Q19 QoQ Δ YoY Δ 4Q20 Highlights $ in thousands 1 o Service charges increased as Service charges $29,784 $28,076 $33,121 6.1% (10.1%) customer transaction Trust income 8,204 7,733 7,151 6.1% 14.7% volume increased linked- quarter and activity levels Insurance commissions and fees 5,424 6,401 5,014 (15.3%) 8.2% continue to trend favorably, given COVID-19 impact Securities commissions and fees 4,645 4,494 3,957 3.4% 17.4% o Growth in wealth Capital markets income 7,507 8,202 8,608 (8.5%) (12.8%) management reflects benefits from geographic Mortgage banking operations 15,317 18,831 10,417 (18.7%) 47.0% expansion and higher equity valuations on assets under Dividends on non-marketable 3,796 2,496 4,918 52.1% (22.8%) management securities o Full-year capital markets Bank owned life insurance 2,867 3,867 3,130 (25.9%) (8.4%) income increased 18.4%, Net securities gains (losses) 20 112 35 n/m n/m reflecting FNB's strong relationships with new and 1 Other 3,095 3,104 1,969 (0.3%) 57.2% existing commercial customers Non-interest income excluding $80,659 $83,316 $78,320 (3.2%) 3.0% 1 significant items impacting earnings o Mortgage banking reflects near-record sold production Significant items impacting volume and above average (12,295) (3,278) (4,279) - - 1 earnings gain-on-sale margins relative to historical levels Total reported non-interest income $68,364 $80,038 $74,041 (14.6%) (7.7%) (1) Excludes amounts related to significant items impacting earnings. Significant items include ($12.3) million loss on FHLB debt extinguishment in 4Q20. ($4.4) million loss on FHLB debt extinguishment, ($8.9) million derivative termination loss, $13.8 million gain on sale of Visa Class B stock , ($3.8) million of service charge refunds in Q320. ($4.3) million of service charge refunds in 4Q19. 27Non-Interest Income 4Q20 3Q20 4Q19 QoQ Δ YoY Δ 4Q20 Highlights $ in thousands 1 o Service charges increased as Service charges $29,784 $28,076 $33,121 6.1% (10.1%) customer transaction Trust income 8,204 7,733 7,151 6.1% 14.7% volume increased linked- quarter and activity levels Insurance commissions and fees 5,424 6,401 5,014 (15.3%) 8.2% continue to trend favorably, given COVID-19 impact Securities commissions and fees 4,645 4,494 3,957 3.4% 17.4% o Growth in wealth Capital markets income 7,507 8,202 8,608 (8.5%) (12.8%) management reflects benefits from geographic Mortgage banking operations 15,317 18,831 10,417 (18.7%) 47.0% expansion and higher equity valuations on assets under Dividends on non-marketable 3,796 2,496 4,918 52.1% (22.8%) management securities o Full-year capital markets Bank owned life insurance 2,867 3,867 3,130 (25.9%) (8.4%) income increased 18.4%, Net securities gains (losses) 20 112 35 n/m n/m reflecting FNB's strong relationships with new and 1 Other 3,095 3,104 1,969 (0.3%) 57.2% existing commercial customers Non-interest income excluding $80,659 $83,316 $78,320 (3.2%) 3.0% 1 significant items impacting earnings o Mortgage banking reflects near-record sold production Significant items impacting volume and above average (12,295) (3,278) (4,279) - - 1 earnings gain-on-sale margins relative to historical levels Total reported non-interest income $68,364 $80,038 $74,041 (14.6%) (7.7%) (1) Excludes amounts related to significant items impacting earnings. Significant items include ($12.3) million loss on FHLB debt extinguishment in 4Q20. ($4.4) million loss on FHLB debt extinguishment, ($8.9) million derivative termination loss, $13.8 million gain on sale of Visa Class B stock , ($3.8) million of service charge refunds in Q320. ($4.3) million of service charge refunds in 4Q19. 27

Non-Interest Expense 4Q20 3Q20 4Q19 QoQ Δ YoY Δ 4Q20 Highlights $ in thousands o On an operating basis, 1 Salaries and employee benefits $104,663 $100,265 $95,913 4.4% 9.1% salaries and benefits increased $8.8 million, or 1 Occupancy and equipment 30,716 30,656 30,547 0.2% 0.6% 9.1%, due primarily to higher production-related commissions and the Amortization of intangibles 3,341 3,339 3,607 0.1% (7.4%) normal impact from annual merit increases compared 1 Outside services 18,342 16,425 17,285 11.7% 6.1% to 4Q19 FDIC insurance 5,083 4,064 5,621 25.1% (9.6%) o Occupancy and equipment remained relatively flat with 3Q20 and 4Q19, as benefit Bank shares tax and franchise taxes 2,477 3,778 2,348 (34.4%) 5.5% from branch rationalization fully offset expansion in key 1 Other 19,557 19,011 22,044 2.9% (11.3%) regions such as the Mid- Atlantic and South Carolina Non-interest expense excluding $184,179 $177,538 $177,365 3.7% 3.8% 1 and continued digital significant items impacting earnings investment Significant items impacting 15,137 2,671 0 - - 1 earnings Total reported non-interest expense $199,316 $180,209 $177,365 10.6% 12.4% (1) Excludes amounts related to significant items impacting earnings, representing branch consolidation costs of $10.5 million in 4Q20 and COVID-19 expense in 4Q20 and 3Q20 of $4.7 million and $2.7 million, respectively. 28Non-Interest Expense 4Q20 3Q20 4Q19 QoQ Δ YoY Δ 4Q20 Highlights $ in thousands o On an operating basis, 1 Salaries and employee benefits $104,663 $100,265 $95,913 4.4% 9.1% salaries and benefits increased $8.8 million, or 1 Occupancy and equipment 30,716 30,656 30,547 0.2% 0.6% 9.1%, due primarily to higher production-related commissions and the Amortization of intangibles 3,341 3,339 3,607 0.1% (7.4%) normal impact from annual merit increases compared 1 Outside services 18,342 16,425 17,285 11.7% 6.1% to 4Q19 FDIC insurance 5,083 4,064 5,621 25.1% (9.6%) o Occupancy and equipment remained relatively flat with 3Q20 and 4Q19, as benefit Bank shares tax and franchise taxes 2,477 3,778 2,348 (34.4%) 5.5% from branch rationalization fully offset expansion in key 1 Other 19,557 19,011 22,044 2.9% (11.3%) regions such as the Mid- Atlantic and South Carolina Non-interest expense excluding $184,179 $177,538 $177,365 3.7% 3.8% 1 and continued digital significant items impacting earnings investment Significant items impacting 15,137 2,671 0 - - 1 earnings Total reported non-interest expense $199,316 $180,209 $177,365 10.6% 12.4% (1) Excludes amounts related to significant items impacting earnings, representing branch consolidation costs of $10.5 million in 4Q20 and COVID-19 expense in 4Q20 and 3Q20 of $4.7 million and $2.7 million, respectively. 28

Full Year 2021 Financial Objectives – Updated February 2021 Category FY 2021 Target 1Q21 & Commentary Mid-single digit growth from o Assumes at least $500 million of Spot loans 12/31/2020, excluding PPP additional PPP forgiveness in 1Q21 Balance Sheet Transaction deposits, excluding o 1Q21 net interest income excluding PPP & stimulus, to increase Spot deposits PPP and PAA expected at similar mid-single digits from end of level to 4Q20 12/31/2020 1 Total Revenue Stable from FY 2020 o Continued strong contributions in mortgage banking and capital markets, 1Q21 fee income in mid-to- Provision expense $70-$80 million high $70 million range Non-interest income Income o Expense savings target of $20 million Statement Non-interest expense Down slightly from 2020 levels in FY 2021 and expenses to be down of $720 million slightly in 1Q21 from 4Q20 operating level 19% Effective tax rate Note: Targets are relative to FY2020 results. (1) Reported total revenue of $1.2 billion. 29Full Year 2021 Financial Objectives – Updated February 2021 Category FY 2021 Target 1Q21 & Commentary Mid-single digit growth from o Assumes at least $500 million of Spot loans 12/31/2020, excluding PPP additional PPP forgiveness in 1Q21 Balance Sheet Transaction deposits, excluding o 1Q21 net interest income excluding PPP & stimulus, to increase Spot deposits PPP and PAA expected at similar mid-single digits from end of level to 4Q20 12/31/2020 1 Total Revenue Stable from FY 2020 o Continued strong contributions in mortgage banking and capital markets, 1Q21 fee income in mid-to- Provision expense $70-$80 million high $70 million range Non-interest income Income o Expense savings target of $20 million Statement Non-interest expense Down slightly from 2020 levels in FY 2021 and expenses to be down of $720 million slightly in 1Q21 from 4Q20 operating level 19% Effective tax rate Note: Targets are relative to FY2020 results. (1) Reported total revenue of $1.2 billion. 29

Asset Quality 30Asset Quality 30
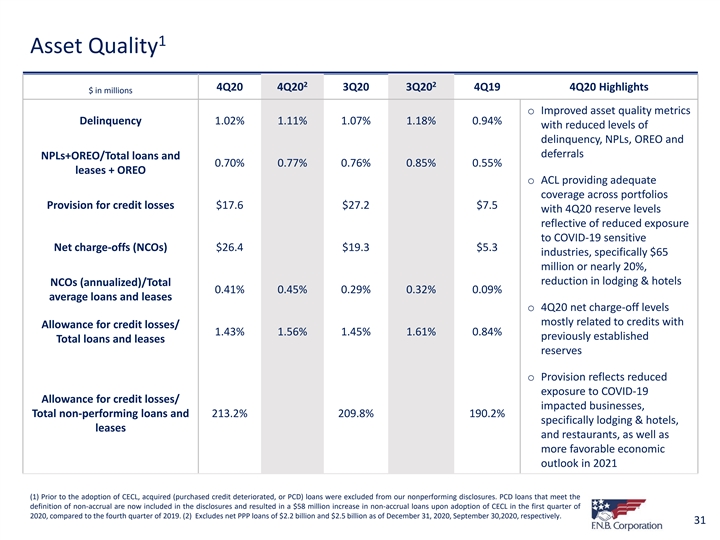
1 Asset Quality 2 2 4Q20 4Q20 3Q20 3Q20 4Q19 4Q20 Highlights $ in millions o Improved asset quality metrics Delinquency 1.02% 1.11% 1.07% 1.18% 0.94% with reduced levels of delinquency, NPLs, OREO and deferrals NPLs+OREO/Total loans and 0.70% 0.77% 0.76% 0.85% 0.55% leases + OREO o ACL providing adequate coverage across portfolios Provision for credit losses $17.6 $27.2 $7.5 with 4Q20 reserve levels reflective of reduced exposure to COVID-19 sensitive Net charge-offs (NCOs) $26.4 $19.3 $5.3 industries, specifically $65 million or nearly 20%, reduction in lodging & hotels NCOs (annualized)/Total 0.41% 0.45% 0.29% 0.32% 0.09% average loans and leases o 4Q20 net charge-off levels mostly related to credits with Allowance for credit losses/ 1.43% 1.56% 1.45% 1.61% 0.84% previously established Total loans and leases reserves o Provision reflects reduced exposure to COVID-19 Allowance for credit losses/ impacted businesses, Total non-performing loans and 213.2% 209.8% 190.2% specifically lodging & hotels, leases and restaurants, as well as more favorable economic outlook in 2021 (1) Prior to the adoption of CECL, acquired (purchased credit deteriorated, or PCD) loans were excluded from our nonperforming disclosures. PCD loans that meet the definition of non-accrual are now included in the disclosures and resulted in a $58 million increase in non-accrual loans upon adoption of CECL in the first quarter of 2020, compared to the fourth quarter of 2019. (2) Excludes net PPP loans of $2.2 billion and $2.5 billion as of December 31, 2020, September 30,2020, respectively. 311 Asset Quality 2 2 4Q20 4Q20 3Q20 3Q20 4Q19 4Q20 Highlights $ in millions o Improved asset quality metrics Delinquency 1.02% 1.11% 1.07% 1.18% 0.94% with reduced levels of delinquency, NPLs, OREO and deferrals NPLs+OREO/Total loans and 0.70% 0.77% 0.76% 0.85% 0.55% leases + OREO o ACL providing adequate coverage across portfolios Provision for credit losses $17.6 $27.2 $7.5 with 4Q20 reserve levels reflective of reduced exposure to COVID-19 sensitive Net charge-offs (NCOs) $26.4 $19.3 $5.3 industries, specifically $65 million or nearly 20%, reduction in lodging & hotels NCOs (annualized)/Total 0.41% 0.45% 0.29% 0.32% 0.09% average loans and leases o 4Q20 net charge-off levels mostly related to credits with Allowance for credit losses/ 1.43% 1.56% 1.45% 1.61% 0.84% previously established Total loans and leases reserves o Provision reflects reduced exposure to COVID-19 Allowance for credit losses/ impacted businesses, Total non-performing loans and 213.2% 209.8% 190.2% specifically lodging & hotels, leases and restaurants, as well as more favorable economic outlook in 2021 (1) Prior to the adoption of CECL, acquired (purchased credit deteriorated, or PCD) loans were excluded from our nonperforming disclosures. PCD loans that meet the definition of non-accrual are now included in the disclosures and resulted in a $58 million increase in non-accrual loans upon adoption of CECL in the first quarter of 2020, compared to the fourth quarter of 2019. (2) Excludes net PPP loans of $2.2 billion and $2.5 billion as of December 31, 2020, September 30,2020, respectively. 31
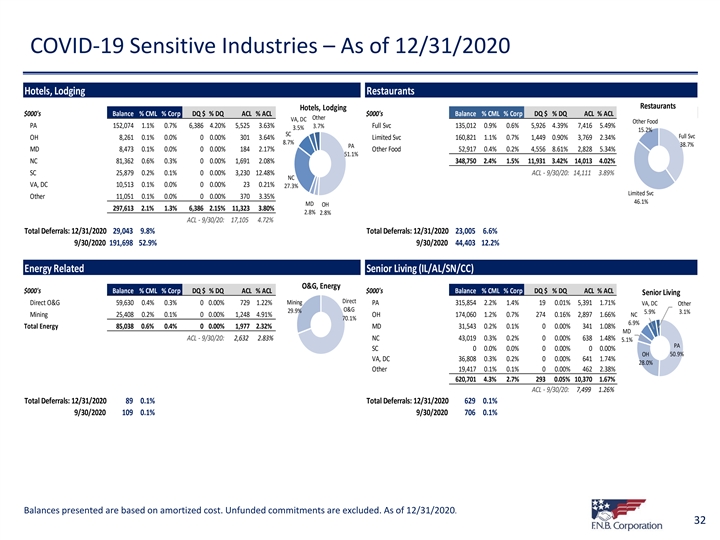
COVID-19 Sensitive Industries – As of 12/31/2020 Hotels, Lodging Restaurants Restaurants Hotels, Lodging $000's Balance % CML % Corp DQ $ % DQ ACL % ACL $000's Balance % CML % Corp DQ $ % DQ ACL % ACL Other VA, DC Other Food PA 152,074 1.1% 0.7% 6,386 4.20% 5,525 3.63% 3.7% Full Svc 135,012 0.9% 0.6% 5,926 4.39% 7,416 5.49% 3.5% 15.2% SC Full Svc OH 8,261 0.1% 0.0% 0 0.00% 301 3.64% Limited Svc 160,821 1.1% 0.7% 1,449 0.90% 3,769 2.34% 8.7% 38.7% PA MD 8,473 0.1% 0.0% 0 0.00% 184 2.17% Other Food 52,917 0.4% 0.2% 4,556 8.61% 2,828 5.34% 51.1% NC 81,362 0.6% 0.3% 0 0.00% 1,691 2.08% 348,750 2.4% 1.5% 11,931 3.42% 14,013 4.02% SC 25,879 0.2% 0.1% 0 0.00% 3,230 12.48% ACL - 9/30/20: 14,111 3.89% NC VA, DC 10,513 0.1% 0.0% 0 0.00% 23 0.21% 27.3% Limited Svc Other 11,051 0.1% 0.0% 0 0.00% 370 3.35% 46.1% MD OH 297,613 2.1% 1.3% 6,386 2.15% 11,323 3.80% 2.8% 2.8% ACL - 9/30/20: 17,105 4.72% Total Deferrals: 12/31/2020 29,043 9.8% Total Deferrals: 12/31/2020 23,005 6.6% 9/30/2020 191,698 52.9% 9/30/2020 44,403 12.2% Energy Related Senior Living (IL/AL/SN/CC) O&G, Energy $000's Balance % CML % Corp DQ $ % DQ ACL % ACL $000's Balance % CML % Corp DQ $ % DQ ACL % ACL Senior Living Direct Direct O&G 59,630 0.4% 0.3% 0 0.00% 729 1.22% Mining PA 315,854 2.2% 1.4% 19 0.01% 5,391 1.71% VA, DC Other O&G 29.9% 5.9% 3.1% Mining 25,408 0.2% 0.1% 0 0.00% 1,248 4.91% OH 174,060 1.2% 0.7% 274 0.16% 2,897 1.66% NC 70.1% 6.9% Total Energy 85,038 0.6% 0.4% 0 0.00% 1,977 2.32% MD 31,543 0.2% 0.1% 0 0.00% 341 1.08% MD ACL - 9/30/20: 2,632 2.83% NC 43,019 0.3% 0.2% 0 0.00% 638 1.48% 5.1% PA SC 0 0.0% 0.0% 0 0.00% 0 0.00% 50.9% OH VA, DC 36,808 0.3% 0.2% 0 0.00% 641 1.74% 28.0% Other 19,417 0.1% 0.1% 0 0.00% 462 2.38% 620,701 4.3% 2.7% 293 0.05% 10,370 1.67% ACL - 9/30/20: 7,499 1.26% Total Deferrals: 12/31/2020 89 0.1% Total Deferrals: 12/31/2020 629 0.1% 9/30/2020 109 0.1% 9/30/2020 706 0.1% Balances presented are based on amortized cost. Unfunded commitments are excluded. As of 12/31/2020. 32COVID-19 Sensitive Industries – As of 12/31/2020 Hotels, Lodging Restaurants Restaurants Hotels, Lodging $000's Balance % CML % Corp DQ $ % DQ ACL % ACL $000's Balance % CML % Corp DQ $ % DQ ACL % ACL Other VA, DC Other Food PA 152,074 1.1% 0.7% 6,386 4.20% 5,525 3.63% 3.7% Full Svc 135,012 0.9% 0.6% 5,926 4.39% 7,416 5.49% 3.5% 15.2% SC Full Svc OH 8,261 0.1% 0.0% 0 0.00% 301 3.64% Limited Svc 160,821 1.1% 0.7% 1,449 0.90% 3,769 2.34% 8.7% 38.7% PA MD 8,473 0.1% 0.0% 0 0.00% 184 2.17% Other Food 52,917 0.4% 0.2% 4,556 8.61% 2,828 5.34% 51.1% NC 81,362 0.6% 0.3% 0 0.00% 1,691 2.08% 348,750 2.4% 1.5% 11,931 3.42% 14,013 4.02% SC 25,879 0.2% 0.1% 0 0.00% 3,230 12.48% ACL - 9/30/20: 14,111 3.89% NC VA, DC 10,513 0.1% 0.0% 0 0.00% 23 0.21% 27.3% Limited Svc Other 11,051 0.1% 0.0% 0 0.00% 370 3.35% 46.1% MD OH 297,613 2.1% 1.3% 6,386 2.15% 11,323 3.80% 2.8% 2.8% ACL - 9/30/20: 17,105 4.72% Total Deferrals: 12/31/2020 29,043 9.8% Total Deferrals: 12/31/2020 23,005 6.6% 9/30/2020 191,698 52.9% 9/30/2020 44,403 12.2% Energy Related Senior Living (IL/AL/SN/CC) O&G, Energy $000's Balance % CML % Corp DQ $ % DQ ACL % ACL $000's Balance % CML % Corp DQ $ % DQ ACL % ACL Senior Living Direct Direct O&G 59,630 0.4% 0.3% 0 0.00% 729 1.22% Mining PA 315,854 2.2% 1.4% 19 0.01% 5,391 1.71% VA, DC Other O&G 29.9% 5.9% 3.1% Mining 25,408 0.2% 0.1% 0 0.00% 1,248 4.91% OH 174,060 1.2% 0.7% 274 0.16% 2,897 1.66% NC 70.1% 6.9% Total Energy 85,038 0.6% 0.4% 0 0.00% 1,977 2.32% MD 31,543 0.2% 0.1% 0 0.00% 341 1.08% MD ACL - 9/30/20: 2,632 2.83% NC 43,019 0.3% 0.2% 0 0.00% 638 1.48% 5.1% PA SC 0 0.0% 0.0% 0 0.00% 0 0.00% 50.9% OH VA, DC 36,808 0.3% 0.2% 0 0.00% 641 1.74% 28.0% Other 19,417 0.1% 0.1% 0 0.00% 462 2.38% 620,701 4.3% 2.7% 293 0.05% 10,370 1.67% ACL - 9/30/20: 7,499 1.26% Total Deferrals: 12/31/2020 89 0.1% Total Deferrals: 12/31/2020 629 0.1% 9/30/2020 109 0.1% 9/30/2020 706 0.1% Balances presented are based on amortized cost. Unfunded commitments are excluded. As of 12/31/2020. 32

COVID-19 Sensitive Industries: Retail Portfolio – As of 12/31/2020 Retail: C&I-Related (incl. OO) Retail - C&I $000's Balance % CML % Corp DQ $ % DQ ACL % ACL Other Grocery 56,781 0.4% 0.2% 834 1.47% 1,172 2.06% Nonstore 5.5% 5.1% Gas Station 123,232 0.9% 0.5% 90 0.07% 1,495 1.21% Specialty Automotive 145,330 1.0% 0.6% 1,059 0.73% 2,951 2.03% Grocery 2.7% 11.2% Home, Furniture 29,068 0.2% 0.1% 102 0.35% 751 2.58% Clothing Building, Garden 35,079 0.2% 0.2% 233 0.66% 634 1.81% 10.1% Clothing 51,540 0.4% 0.2% 457 0.89% 648 1.26% Gas Station n 24.2% Building, Garden Specialty Goods 13,621 0.1% 0.1% 749 5.50% 550 4.04% 6.9% Nonstore Retailers 26,127 0.2% 0.1% 0 0.00% 384 1.47% Automotive Other 27,978 0.2% 0.1% 492 1.76% 644 2.30% Home, Furniture 28.6% 5.7% 508,757 3.6% 2.2% 4,015 0.79% 9,229 1.81% ACL - 9/30/20: 9,256 1.85% Total Deferrals: 12/31/2020 11,371 2.2% 9/30/2020 12,814 2.6% Retail: IRE Retail - IRE $000's Balance % CML % Corp DQ $ % DQ ACL % ACL Other VA, DC PA 548,555 3.8% 2.4% 1,035 0.19% 6,440 1.17% 5.2% 2.7% OH 201,207 1.4% 0.9% 2,929 1.46% 3,049 1.52% SC 1.2% MD 335,574 2.3% 1.4% 15,371 4.58% 2,344 0.70% NC 278,153 1.9% 1.2% 102 0.04% 2,590 0.93% PA NC 36.6% SC 18,526 0.1% 0.1% 0 0.00% 102 0.55% 18.5% VA, DC 40,522 0.3% 0.2% 0 0.00% 249 0.61% Other 77,900 0.5% 0.3% 0 0.00% 1,015 1.30% MD OH 1,500,437 10.5% 6.4% 19,437 1.30% 15,787 1.05% 22.4% 13.4% ACL - 9/30/20: 20,787 1.39% Total Deferrals: 12/31/2020 50,448 3.4% 9/30/2020 83,500 5.6% Balances presented are based on amortized cost. Unfunded commitments are excluded. As of 12/31/2020. 33COVID-19 Sensitive Industries: Retail Portfolio – As of 12/31/2020 Retail: C&I-Related (incl. OO) Retail - C&I $000's Balance % CML % Corp DQ $ % DQ ACL % ACL Other Grocery 56,781 0.4% 0.2% 834 1.47% 1,172 2.06% Nonstore 5.5% 5.1% Gas Station 123,232 0.9% 0.5% 90 0.07% 1,495 1.21% Specialty Automotive 145,330 1.0% 0.6% 1,059 0.73% 2,951 2.03% Grocery 2.7% 11.2% Home, Furniture 29,068 0.2% 0.1% 102 0.35% 751 2.58% Clothing Building, Garden 35,079 0.2% 0.2% 233 0.66% 634 1.81% 10.1% Clothing 51,540 0.4% 0.2% 457 0.89% 648 1.26% Gas Station n 24.2% Building, Garden Specialty Goods 13,621 0.1% 0.1% 749 5.50% 550 4.04% 6.9% Nonstore Retailers 26,127 0.2% 0.1% 0 0.00% 384 1.47% Automotive Other 27,978 0.2% 0.1% 492 1.76% 644 2.30% Home, Furniture 28.6% 5.7% 508,757 3.6% 2.2% 4,015 0.79% 9,229 1.81% ACL - 9/30/20: 9,256 1.85% Total Deferrals: 12/31/2020 11,371 2.2% 9/30/2020 12,814 2.6% Retail: IRE Retail - IRE $000's Balance % CML % Corp DQ $ % DQ ACL % ACL Other VA, DC PA 548,555 3.8% 2.4% 1,035 0.19% 6,440 1.17% 5.2% 2.7% OH 201,207 1.4% 0.9% 2,929 1.46% 3,049 1.52% SC 1.2% MD 335,574 2.3% 1.4% 15,371 4.58% 2,344 0.70% NC 278,153 1.9% 1.2% 102 0.04% 2,590 0.93% PA NC 36.6% SC 18,526 0.1% 0.1% 0 0.00% 102 0.55% 18.5% VA, DC 40,522 0.3% 0.2% 0 0.00% 249 0.61% Other 77,900 0.5% 0.3% 0 0.00% 1,015 1.30% MD OH 1,500,437 10.5% 6.4% 19,437 1.30% 15,787 1.05% 22.4% 13.4% ACL - 9/30/20: 20,787 1.39% Total Deferrals: 12/31/2020 50,448 3.4% 9/30/2020 83,500 5.6% Balances presented are based on amortized cost. Unfunded commitments are excluded. As of 12/31/2020. 33

Loan Risk Profile – Fourth Quarter 2020 Non- YTD Net Charge- Accruals Off's (annual T ot al Delinquency Total 12/31/2020 ($ in millions) % of Loans (% Loans) % Avg Loans) (% Loans) Deferrals Commercial and Industrial 4,543 19.5% 0.85% 0.48% 0.99% 1.58% CRE: Non-Owner Occupied 6,981 30.0% 0.53% 0.23% 0.61% 1.68% CRE: Owner Occupied 2,754 11.8% 1.76% 0.30% 2.01% 3.99% Home Equity 1,940 8.3% 0.57% 0.02% 1.03% 0.89% HELOC 1,240 5.3% 0.53% 0.08% 1.44% 0.90% Other Consumer 159 0.7% 0.07% 0.44% 0.39% 0.48% Residential Mortgage 3,514 15.1% 0.47% 0.02% 1.40% 1.21% Indirect Consumer 1,217 5.2% 0.18% 0.36% 1.01% 1.45% Equipment Finance Loans and Leases 902 3.9% 0.87% 0.46% 1.24% 0.95% Other 50 0.2% N/M N/M N/M 0.00% Loans and Leases ex PPP (non-GAAP) $23,300 100.0% 0.73% 0.24% 1.11% 1.70% PPP $2,158 Reported Loans and Leases $25,459 0.24% 34Loan Risk Profile – Fourth Quarter 2020 Non- YTD Net Charge- Accruals Off's (annual T ot al Delinquency Total 12/31/2020 ($ in millions) % of Loans (% Loans) % Avg Loans) (% Loans) Deferrals Commercial and Industrial 4,543 19.5% 0.85% 0.48% 0.99% 1.58% CRE: Non-Owner Occupied 6,981 30.0% 0.53% 0.23% 0.61% 1.68% CRE: Owner Occupied 2,754 11.8% 1.76% 0.30% 2.01% 3.99% Home Equity 1,940 8.3% 0.57% 0.02% 1.03% 0.89% HELOC 1,240 5.3% 0.53% 0.08% 1.44% 0.90% Other Consumer 159 0.7% 0.07% 0.44% 0.39% 0.48% Residential Mortgage 3,514 15.1% 0.47% 0.02% 1.40% 1.21% Indirect Consumer 1,217 5.2% 0.18% 0.36% 1.01% 1.45% Equipment Finance Loans and Leases 902 3.9% 0.87% 0.46% 1.24% 0.95% Other 50 0.2% N/M N/M N/M 0.00% Loans and Leases ex PPP (non-GAAP) $23,300 100.0% 0.73% 0.24% 1.11% 1.70% PPP $2,158 Reported Loans and Leases $25,459 0.24% 34

Additional Financial Data 35Additional Financial Data 35

Annual Operating Trends 2020 2019 2018 2017 2016 Net income available to common 1 Operating Earnings stockholders $314.0 $386.1 $366.7 $281.2 $187.7 (Non-GAAP) Net income per diluted common share $0.96 $1.18 $1.13 $0.93 $0.90 Return on average assets 0.88% 1.16% 1.17% 0.99% 0.95% Profitability Return on average tangible common 1 Performance equity 13.1% 17.1% 18.5% 15.7% 14.8% (Non-GAAP) Efficiency ratio 56.1% 54.5% 54.8% 54.3% 55.4% Total loan growth 10.7% 5.5% 5.4% 6.3% 8.0% Commercial loan growth 17.4% 6.0% 4.4% 3.6% 7.4% Balance Sheet Organic 3 2 Consumer loan growth (0.7%) 4.7% 7.1% 10.4% 8.6% Growth Trends Transaction deposit and customer repo 4 growth 18.5% 5.5% 2.4% 3.5% 8.0% Net charge-offs/Total average loans and leases (GAAP) 0.24% 0.12% 0.26% 0.22% 0.28% Asset Quality Allowance for credit losses/Total loans and leases (GAAP) 1.43% 0.84% 0.81% 0.83% 1.06% 5 CET1 9.9% 9.4% 9.2% 8.9% 9.2% Capital Tangible book value per share $7.88 $7.53 $6.68 $6.06 $6.53 (1) Includes adjustments to reflect the impact of certain merger-related items, refer to Appendix for GAAP to non-GAAP Reconciliation details. (2) Full-year average organic growth results. Organic growth results exclude initial balances acquired in the following acquisitions; YDKN 1Q17, FITB 2Q16, METR 1Q16, BofA 3Q15, OBAF 3Q14, BCSB 1Q14, PVFC 4Q13, ANNB 2Q13, PVSA 1Q12, CB&T 1Q11. (3) Consumer includes Residential, Direct Installment, Indirect Installment and Consumer LOC 36 portfolios. (4) Total deposits excluding time deposits. (5) Estimated for FY 2020.Annual Operating Trends 2020 2019 2018 2017 2016 Net income available to common 1 Operating Earnings stockholders $314.0 $386.1 $366.7 $281.2 $187.7 (Non-GAAP) Net income per diluted common share $0.96 $1.18 $1.13 $0.93 $0.90 Return on average assets 0.88% 1.16% 1.17% 0.99% 0.95% Profitability Return on average tangible common 1 Performance equity 13.1% 17.1% 18.5% 15.7% 14.8% (Non-GAAP) Efficiency ratio 56.1% 54.5% 54.8% 54.3% 55.4% Total loan growth 10.7% 5.5% 5.4% 6.3% 8.0% Commercial loan growth 17.4% 6.0% 4.4% 3.6% 7.4% Balance Sheet Organic 3 2 Consumer loan growth (0.7%) 4.7% 7.1% 10.4% 8.6% Growth Trends Transaction deposit and customer repo 4 growth 18.5% 5.5% 2.4% 3.5% 8.0% Net charge-offs/Total average loans and leases (GAAP) 0.24% 0.12% 0.26% 0.22% 0.28% Asset Quality Allowance for credit losses/Total loans and leases (GAAP) 1.43% 0.84% 0.81% 0.83% 1.06% 5 CET1 9.9% 9.4% 9.2% 8.9% 9.2% Capital Tangible book value per share $7.88 $7.53 $6.68 $6.06 $6.53 (1) Includes adjustments to reflect the impact of certain merger-related items, refer to Appendix for GAAP to non-GAAP Reconciliation details. (2) Full-year average organic growth results. Organic growth results exclude initial balances acquired in the following acquisitions; YDKN 1Q17, FITB 2Q16, METR 1Q16, BofA 3Q15, OBAF 3Q14, BCSB 1Q14, PVFC 4Q13, ANNB 2Q13, PVSA 1Q12, CB&T 1Q11. (3) Consumer includes Residential, Direct Installment, Indirect Installment and Consumer LOC 36 portfolios. (4) Total deposits excluding time deposits. (5) Estimated for FY 2020.

Deposits and Customer Repurchase Agreements $29.6 Billion Deposits and Mix % 12/31/2020 Customer Repo Agreements ($ in millions) December 31, 2020 Balance 12/31/20 Time Deposits, Savings, NOW, MMDA $16,418 56% 12% Customer Non-Interest Bearing 9,042 31% Non-Interest Repos, 1% Bearing, 31% Transaction Deposits $25,460 Time Deposits 3,662 12% Total Deposits $29,122 Customer Repos 434 1% Total Deposits and Customer Repo Agreements $29,556 100% Transaction Deposits and Customer Repo Agreements $25,894 88% Savings, NOW, MMDA 56% Loans to Deposits Ratio (excluding loans HFS) = 87% (12/31/2020) New client acquisition and relationship-based focus reflected in favorable deposit mix • 88% of total deposits and customer repo agreements are transaction-based deposits Note: Balance and % of Portfolio based on period-end balances. 37Deposits and Customer Repurchase Agreements $29.6 Billion Deposits and Mix % 12/31/2020 Customer Repo Agreements ($ in millions) December 31, 2020 Balance 12/31/20 Time Deposits, Savings, NOW, MMDA $16,418 56% 12% Customer Non-Interest Bearing 9,042 31% Non-Interest Repos, 1% Bearing, 31% Transaction Deposits $25,460 Time Deposits 3,662 12% Total Deposits $29,122 Customer Repos 434 1% Total Deposits and Customer Repo Agreements $29,556 100% Transaction Deposits and Customer Repo Agreements $25,894 88% Savings, NOW, MMDA 56% Loans to Deposits Ratio (excluding loans HFS) = 87% (12/31/2020) New client acquisition and relationship-based focus reflected in favorable deposit mix • 88% of total deposits and customer repo agreements are transaction-based deposits Note: Balance and % of Portfolio based on period-end balances. 37

Deposit Composition Strong deposit growth with improving NIB demand over time Total Deposits $35 2009 - 2020 $30 2009 2020Δ NIB Deposits 16% 31% 15% $25 31% Time Deposits 35% 12% (23%) 26% 26% $20 26% $15 26% 56% 55% 52% 24% 54% $10 23% 22% 19% 58% 18% 16% 56% 16% 54% 53% $5 53% 52% 50% 52% 22% 21% 19% 12% 13% 28% 26% 23% 20% 16% 35% 32% 30% $0 2009 2010 2011 2012 2013 2014 2015 2016 2017 2018 2019 2020 Time Deposits Interest-Bearing Deposits & Savings Non-Interest Bearing Deposits 38Deposit Composition Strong deposit growth with improving NIB demand over time Total Deposits $35 2009 - 2020 $30 2009 2020Δ NIB Deposits 16% 31% 15% $25 31% Time Deposits 35% 12% (23%) 26% 26% $20 26% $15 26% 56% 55% 52% 24% 54% $10 23% 22% 19% 58% 18% 16% 56% 16% 54% 53% $5 53% 52% 50% 52% 22% 21% 19% 12% 13% 28% 26% 23% 20% 16% 35% 32% 30% $0 2009 2010 2011 2012 2013 2014 2015 2016 2017 2018 2019 2020 Time Deposits Interest-Bearing Deposits & Savings Non-Interest Bearing Deposits 38

Investment Portfolio % Ratings Highly Rated $6.3 Billion Investment Portfolio 1 ($ in millions ) 12/31/20 Portfolio Investment % December 31, 2020 BBB,BB,B Agency MBS $1,763 28% AAA 100% > 1% A Agency CMO 1,686 27% AAA 100% 3% Agency Debentures 454 7% AAA 100% AA AAA 12% 13% AA 74% Municipals 1,140 18% A 14% 2 Commercial MBS 685 10% AAA 100% US Treasury 601 9% AAA 100% Various Other 2 <1% /NR AAA 84% Total Investment Portfolio $6,331 100% o 97% of total portfolio rated AA or better, 99% rated A or better Held to Maturity o Relatively low duration of 3.3 Available 44% o Municipal bond portfolio for Sale • Highly rated with an average rating of AA and 99% of the portfolio 56% rated A or better • General obligation bonds = 100% of municipal portfolio • Minimal CECL impact < $100K (1) Amounts reflect GAAP. (2) Comprised of Ginnie Mae Project Loans and FNMA DUS bond holdings. 39Investment Portfolio % Ratings Highly Rated $6.3 Billion Investment Portfolio 1 ($ in millions ) 12/31/20 Portfolio Investment % December 31, 2020 BBB,BB,B Agency MBS $1,763 28% AAA 100% > 1% A Agency CMO 1,686 27% AAA 100% 3% Agency Debentures 454 7% AAA 100% AA AAA 12% 13% AA 74% Municipals 1,140 18% A 14% 2 Commercial MBS 685 10% AAA 100% US Treasury 601 9% AAA 100% Various Other 2 <1% /NR AAA 84% Total Investment Portfolio $6,331 100% o 97% of total portfolio rated AA or better, 99% rated A or better Held to Maturity o Relatively low duration of 3.3 Available 44% o Municipal bond portfolio for Sale • Highly rated with an average rating of AA and 99% of the portfolio 56% rated A or better • General obligation bonds = 100% of municipal portfolio • Minimal CECL impact < $100K (1) Amounts reflect GAAP. (2) Comprised of Ginnie Mae Project Loans and FNMA DUS bond holdings. 39

FNB’s Value Proposition Continuous Growth in Revenue and Net Income Total Revenue & Operating Net Income Available to Common Shareholders (Millions) $1,217 $1,211 $1,208 CAGR Since 2009 $1,098 Revenue 11% Net Income 23% $813 $660 $624 $532 $504 $436 $401 $386 $372 $367 $314 $281 $188 $154 $123 $144 $115 $90 $68 $33 2009 2010 2011 2012 2013 2014 2015 2016 2017 2018 2019 2020 Total Revenue Operating Net Income Available to Common Shareholders (non-GAAP)(1) (1) Includes adjustments to reflect the impact of certain significant items, refer to Appendix for GAAP to non-GAAP Reconciliation details. 40FNB’s Value Proposition Continuous Growth in Revenue and Net Income Total Revenue & Operating Net Income Available to Common Shareholders (Millions) $1,217 $1,211 $1,208 CAGR Since 2009 $1,098 Revenue 11% Net Income 23% $813 $660 $624 $532 $504 $436 $401 $386 $372 $367 $314 $281 $188 $154 $123 $144 $115 $90 $68 $33 2009 2010 2011 2012 2013 2014 2015 2016 2017 2018 2019 2020 Total Revenue Operating Net Income Available to Common Shareholders (non-GAAP)(1) (1) Includes adjustments to reflect the impact of certain significant items, refer to Appendix for GAAP to non-GAAP Reconciliation details. 40
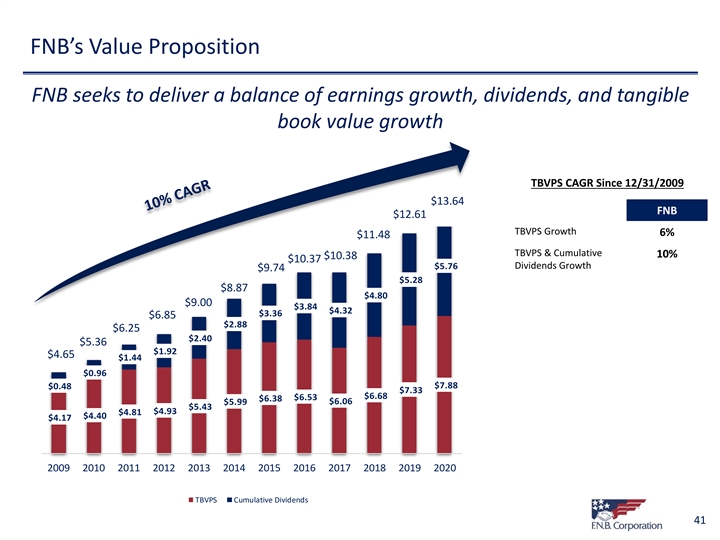
FNB’s Value Proposition FNB seeks to deliver a balance of earnings growth, dividends, and tangible book value growth TBVPS CAGR Since 12/31/2009 $13.64 FNB $12.61 TBVPS Growth 6% $11.48 TBVPS & Cumulative 10% $10.38 $10.37 $5.76 Dividends Growth $9.74 $5.28 $8.87 $4.80 $9.00 $3.84 $4.32 $3.36 $6.85 $2.88 $6.25 $2.40 $5.36 $1.92 $4.65 $1.44 $0.96 $7.88 $0.48 $7.33 $6.68 $6.53 $6.38 $6.06 $5.99 $5.43 $4.93 $4.81 $4.40 $4.17 2009 2010 2011 2012 2013 2014 2015 2016 2017 2018 2019 2020 TBVPS Cumulative Dividends 41FNB’s Value Proposition FNB seeks to deliver a balance of earnings growth, dividends, and tangible book value growth TBVPS CAGR Since 12/31/2009 $13.64 FNB $12.61 TBVPS Growth 6% $11.48 TBVPS & Cumulative 10% $10.38 $10.37 $5.76 Dividends Growth $9.74 $5.28 $8.87 $4.80 $9.00 $3.84 $4.32 $3.36 $6.85 $2.88 $6.25 $2.40 $5.36 $1.92 $4.65 $1.44 $0.96 $7.88 $0.48 $7.33 $6.68 $6.53 $6.38 $6.06 $5.99 $5.43 $4.93 $4.81 $4.40 $4.17 2009 2010 2011 2012 2013 2014 2015 2016 2017 2018 2019 2020 TBVPS Cumulative Dividends 41

FNB’s Value Proposition Grow and diversify non-interest income 161,076 o Over half of the growth in 130,349 non-interest income FY 2020 / FY 2015 is attributable to Capital Markets, Wealth, 104,981 Mortgage, and Insurance which is primarily organic. 94,050 o Mortgage banking income 80,546 had record production of more than $3 billion in 2020, 69,711 increasing 57% to $50 million compared to 2019. o Capital Markets provides high-value services including Interest Rate Swaps, International Banking, and Syndications. 2015 2016 2017 2018 2019 2020 Trust Insurance Commissions and Fees Securities Commissions and Fees Mortgage Banking Income Capital Markets Income 42FNB’s Value Proposition Grow and diversify non-interest income 161,076 o Over half of the growth in 130,349 non-interest income FY 2020 / FY 2015 is attributable to Capital Markets, Wealth, 104,981 Mortgage, and Insurance which is primarily organic. 94,050 o Mortgage banking income 80,546 had record production of more than $3 billion in 2020, 69,711 increasing 57% to $50 million compared to 2019. o Capital Markets provides high-value services including Interest Rate Swaps, International Banking, and Syndications. 2015 2016 2017 2018 2019 2020 Trust Insurance Commissions and Fees Securities Commissions and Fees Mortgage Banking Income Capital Markets Income 42

2020 Peer Group Listing Ticker Institution Ticker Institution ASB Associated Banc-Corp NYCB New York Community Bancorp 1 CHFC Chemical Financial Corp. PBCT People’s United Financial, Inc. CBSH Commerce Bancshares, Inc. PNFP Pinnacle Financial Partners CFR Cullen/Frost Bankers, Inc. SNV Synovus Financial Corp. 2 FHN First Horizon National Corp. UMPQ Umpqua Holdings Corp. FULT Fulton Financial Corp. UBSI United Bankshares, Inc. HWC Hancock Whitney Corp. VLY Valley National Bancorp HBAN Huntington Bancshares, Inc. WBS Webster Financial Corp. 2 IBKC IBERIABANK Corp. WTFC Wintrust Financial Corp. KEY KeyCorp ZION Zions Bancorp (1) CHFC merged with TCF Financial 3Q19; used for historical comparison. (2) IBKC merged with FHN during 2Q20; used for historical comparison 432020 Peer Group Listing Ticker Institution Ticker Institution ASB Associated Banc-Corp NYCB New York Community Bancorp 1 CHFC Chemical Financial Corp. PBCT People’s United Financial, Inc. CBSH Commerce Bancshares, Inc. PNFP Pinnacle Financial Partners CFR Cullen/Frost Bankers, Inc. SNV Synovus Financial Corp. 2 FHN First Horizon National Corp. UMPQ Umpqua Holdings Corp. FULT Fulton Financial Corp. UBSI United Bankshares, Inc. HWC Hancock Whitney Corp. VLY Valley National Bancorp HBAN Huntington Bancshares, Inc. WBS Webster Financial Corp. 2 IBKC IBERIABANK Corp. WTFC Wintrust Financial Corp. KEY KeyCorp ZION Zions Bancorp (1) CHFC merged with TCF Financial 3Q19; used for historical comparison. (2) IBKC merged with FHN during 2Q20; used for historical comparison 43

Non-GAAP to GAAP Reconciliation 44Non-GAAP to GAAP Reconciliation 44

Non-GAAP to GAAP Reconciliation 45Non-GAAP to GAAP Reconciliation 45

Non-GAAP to GAAP Reconciliation 46Non-GAAP to GAAP Reconciliation 46

Non-GAAP to GAAP Reconciliation 47Non-GAAP to GAAP Reconciliation 47
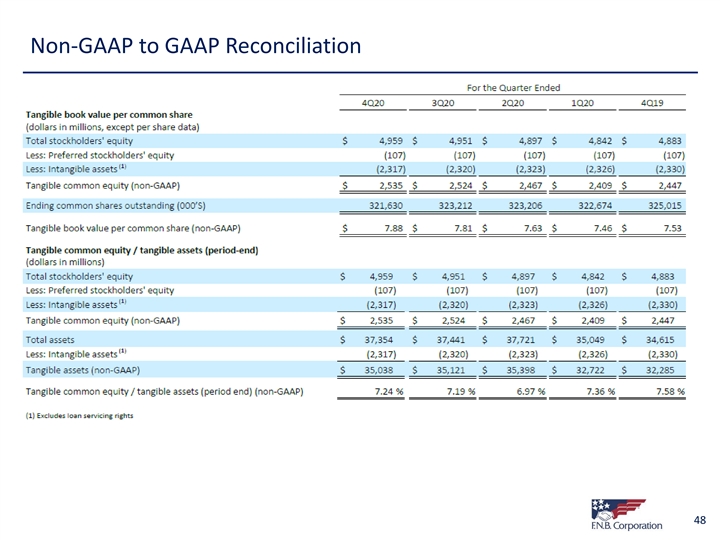
Non-GAAP to GAAP Reconciliation 48Non-GAAP to GAAP Reconciliation 48

Non-GAAP to GAAP Reconciliation 49Non-GAAP to GAAP Reconciliation 49
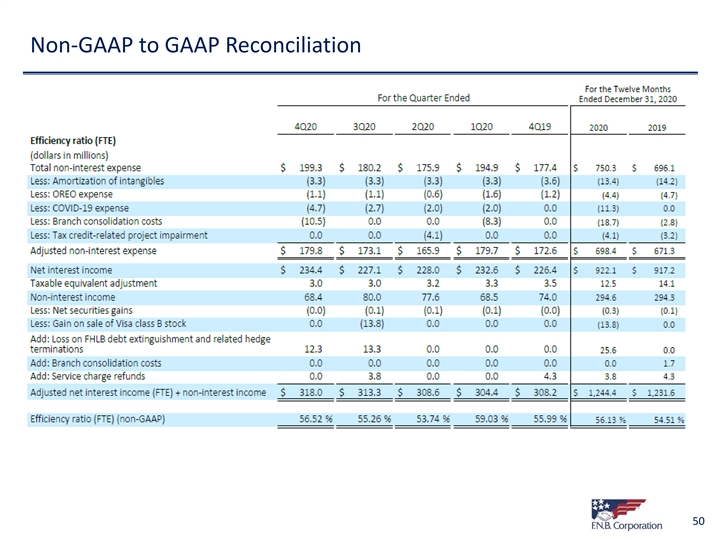
Non-GAAP to GAAP Reconciliation 50Non-GAAP to GAAP Reconciliation 50

Non-GAAP to GAAP Reconciliation 51Non-GAAP to GAAP Reconciliation 51

Non-GAAP to GAAP Reconciliation 52Non-GAAP to GAAP Reconciliation 52