
Form 8-K GOLDMAN SACHS GROUP INC For: Jan 19
Exhibit 99.1

|
Full Year and
Fourth Quarter 2020
Earnings Results
Media Relations: Jake Siewert 212-902-5400 Investor Relations: Heather Kennedy Miner 212-902-0300
|
||
|
The Goldman Sachs Group, Inc. 200 West Street | New York, NY 10282
|
Full Year and Fourth Quarter 2020 Earnings Results
Goldman Sachs Reports Earnings Per Common Share of $24.74 for 2020
Fourth Quarter Earnings Per Common Share was $12.08
|
“It was a challenging year on many fronts, and I am deeply proud of how our people helped clients respond to the economic disruption brought on by the pandemic and the extreme market volatility experienced over the past months. Our people responded admirably to a series of professional and personal challenges, while working from home or in offices that were reshaped dramatically. Thanks to their perseverance, we were able to help clients navigate a difficult environment, and, as a result, achieved strong results across the franchise, while advancing our strategic priorities. We hope this year brings much needed stability and a respite from the pandemic, but we remain ready to handle a wide range of outcomes and are poised to meet the needs of our clients.” |
|
- David M. Solomon, Chairman and Chief Executive Officer
|
Financial Summary
|
|
|
|||||||
|
Net Revenues
|
Net Earnings
|
EPS
| ||||||
|
2020 $44.56 billion
4Q20 $11.74 billion
|
2020 $9.46 billion
4Q20 $4.51 billion
|
2020 $24.74
4Q20 $12.08
| ||||||
|
ROE1
|
ROTE1
|
Book Value Per Share
| ||||||
|
2020 11.1%
4Q20 21.1%
|
2020 11.8%
4Q20 22.5%
|
2020 $236.15
2020 Growth 8.1%
| ||||||
NEW YORK, January 19, 2021 – The Goldman Sachs Group, Inc. (NYSE: GS) today reported net revenues of $44.56 billion and net earnings of $9.46 billion for the year ended December 31, 2020. Net revenues were $11.74 billion and net earnings were $4.51 billion for the fourth quarter of 2020.
Diluted earnings per common share (EPS) was $24.74 for the year ended December 31, 2020 compared with $21.03 for the year ended December 31, 2019, and was $12.08 for the fourth quarter of 2020 compared with $4.69 for the fourth quarter of 2019 and $8.98 for the third quarter of 2020.
Return on average common shareholders’ equity (ROE)1 was 11.1% for 2020 and annualized ROE was 21.1% for the fourth quarter of 2020. Return on average tangible common shareholders’ equity (ROTE)1 was 11.8% for 2020 and annualized ROTE was 22.5% for the fourth quarter of 2020.
During 2020, the firm recorded net provisions for litigation and regulatory proceedings of $3.42 billion, which reduced diluted EPS by $9.51 and reduced ROE by 3.9 percentage points.
1
Goldman Sachs Reports
Full Year and Fourth Quarter 2020 Earnings Results
Annual Highlights
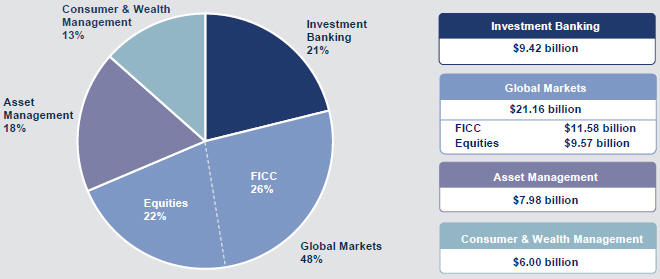
| ◾ | During the year, the firm navigated an uncertain macroeconomic environment due to the impact of the COVID-19 pandemic, but remained focused on serving clients and executing on strategic priorities, which contributed to net revenues of $44.56 billion, 22% higher than 2019, and the highest annual net revenues in 11 years. In addition, diluted EPS was $24.74, the second highest annual EPS reported by the firm. |
| ◾ | Investment Banking generated record net revenues of $9.42 billion, driven by record Equity underwriting net revenues and the second highest annual net revenues in Debt underwriting. The firm ranked #1 in worldwide announced and completed mergers and acquisitions, worldwide equity and equity-related offerings and common stock offerings for the year2. |
| ◾ | Global Markets generated net revenues of $21.16 billion, 43% higher than 2019, and its highest annual net revenues in ten years, reflecting strong results in both Fixed Income, Currency and Commodities (FICC), which included the third highest annual net revenues in intermediation and record net revenues in financing, and Equities, which included record net revenues in derivatives. |
| ◾ | Asset Management generated net revenues of $7.98 billion, including record Management and other fees. |
| ◾ | Consumer & Wealth Management generated record net revenues of $6.00 billion, including record Wealth management net revenues and significantly higher Consumer banking net revenues. |
| ◾ | Firmwide assets under supervision3,4 increased $286 billion during the year to a record $2.15 trillion. |
| ◾ | The firm continued to scale its digital consumer deposit platforms, as consumer deposits increased by $37 billion during the year to $97 billion4. In addition, the firm formally launched its transaction banking business in the U.S. and increased deposits to $29 billion4. |
| ◾ | The Standardized Common Equity Tier 1 capital ratio3 increased 140 basis points during the year to 14.7%4. |
Full Year Net Revenue Mix by Segment
|
2
Goldman Sachs Reports
Full Year and Fourth Quarter 2020 Earnings Results
Net Revenues
|
Full Year |
||||
| Net revenues were $44.56 billion for 2020, 22% higher than 2019, reflecting significantly higher net revenues in Global Markets and Investment Banking and higher net revenues in Consumer & Wealth Management, partially offset by lower net revenues in Asset Management. |
|
2020 Net Revenues
| ||
|
$44.56 billion
| ||||
|
Fourth Quarter |
||||
| Net revenues were $11.74 billion for the fourth quarter of 2020, 18% higher than the fourth quarter of 2019 and 9% higher than the third quarter of 2020. The increase compared with the fourth quarter of 2019 reflected higher net revenues across all segments, including significant increases in Global Markets and Investment Banking. |
4Q20 Net Revenues
| |||
|
$11.74 billion
| ||||
|
|
|
Investment Banking |
|
|
| Full Year |
||||||
| Net revenues in Investment Banking were $9.42 billion for 2020, 24% higher than 2019, reflecting significantly higher net revenues in Underwriting. This increase was partially offset by significantly lower net revenues in Corporate lending and slightly lower net revenues in Financial advisory.
The increase in Underwriting net revenues was due to significantly higher net revenues in both Equity and Debt underwriting, reflecting an increase in industry-wide volumes. The decrease in Corporate lending net revenues primarily reflected net mark-downs on corporate loans in 2020 compared to net gains in 2019. The decrease in Financial advisory net revenues reflected a decrease in industry-wide completed mergers and acquisitions transactions, primarily in the middle of the year. |
2020 Investment Banking
| |||||
|
$9.42 billion
| ||||||
|
|
Financial Advisory |
$3.07 billion | ||||
| Underwriting |
$6.08 billion | |||||
|
Corporate Lending
|
$282 million
| |||||
|
The firm’s investment banking transaction backlog3 increased significantly compared with the end of 2019. |
||||||
|
Fourth Quarter |
||||||
| Net revenues in Investment Banking were $2.61 billion for the fourth quarter of 2020, 27% higher than the fourth quarter of 2019 and 33% higher than the third quarter of 2020. The increase compared with the fourth quarter of 2019 reflected significantly higher net revenues in Underwriting and Financial advisory, partially offset by a net loss in Corporate lending.
The increase in Underwriting net revenues was due to significantly higher net revenues in Equity underwriting, reflecting higher industry-wide activity, partially offset by lower net revenues in Debt underwriting, particularly in asset-backed underwriting. The increase in Financial advisory net revenues reflected an increase in completed mergers and acquisitions transactions. The net loss in Corporate lending primarily reflected lower results for relationship lending activities, including the impact of changes in credit spreads on hedges.
The firm’s investment banking transaction backlog3 increased significantly compared with the end of the third quarter of 2020. |
4Q20 Investment Banking
| |||||
|
$2.61 billion
| ||||||
| Financial Advisory |
$1.09 billion | |||||
| Underwriting |
$1.64 billion | |||||
|
Corporate Lending
|
$(119) million
| |||||
3
Goldman Sachs Reports
Full Year and Fourth Quarter 2020 Earnings Results
|
|
Global Markets |
|
| Full Year |
||||||
| Net revenues in Global Markets were $21.16 billion for 2020, 43% higher than 2019.
Net revenues in FICC were $11.58 billion, 57% higher than 2019, primarily due to significantly higher net revenues in FICC intermediation, reflecting significantly higher net revenues across all major businesses. In addition, net revenues in FICC financing were higher, driven by repurchase agreements.
Net revenues in Equities were $9.57 billion, 30% higher than 2019, due to significantly higher net revenues in Equities intermediation, reflecting significantly higher net revenues in both derivatives and cash products. Net revenues in Equities financing were lower, primarily reflecting higher net funding costs, including the impact of lower yields on the firm’s global core liquid assets. |
2020 Global Markets
| |||||
|
$21.16 billion
| ||||||
|
FICC Intermediation |
$ 9.99 billion | |||||
| FICC Financing |
$ 1.59 billion | |||||
| FICC |
$11.58 billion | |||||
| Equities Intermediation |
$6.99 billion | |||||
| Equities Financing |
$2.58 billion | |||||
|
Equities |
$9.57 billion
| |||||
| Fourth Quarter |
||||||
| Net revenues in Global Markets were $4.27 billion for the fourth quarter of 2020, 23% higher than the fourth quarter of 2019 and 6% lower than the third quarter of 2020.
Net revenues in FICC were $1.88 billion, 6% higher than the fourth quarter of 2019, due to higher net revenues in FICC intermediation, reflecting significantly higher net revenues in credit products and commodities and higher net revenues in currencies, partially offset by significantly lower net revenues in interest rate products and lower net revenues in mortgages. Net revenues in FICC financing were essentially unchanged.
Net revenues in Equities were $2.39 billion, 40% higher than the fourth quarter of 2019, due to significantly higher net revenues in Equities intermediation, reflecting significantly higher net revenues in both derivatives and cash products. Net revenues in Equities financing were lower, reflecting higher net funding costs, including the impact of lower yields on the firm’s global core liquid assets. |
4Q20 Global Markets
| |||||
|
$4.27 billion
| ||||||
|
FICC Intermediation |
$1.50 billion | |||||
| FICC Financing |
$380 million | |||||
| FICC |
$1.88 billion | |||||
| Equities Intermediation |
$1.80 billion | |||||
| Equities Financing |
$591 million | |||||
|
Equities |
$2.39 billion
| |||||
|
|
Asset Management |
|
| Full Year |
||||||
| Net revenues in Asset Management were $7.98 billion for 2020, 11% lower than 2019, reflecting significantly lower net revenues in Equity investments and Lending and debt investments. Incentive fees were significantly higher, and Management and other fees (from the firm’s institutional and third-party distribution asset management clients) were higher.
The decrease in Equity investments net revenues reflected significantly lower net gains from investments in private equities, partially offset by significantly higher net gains from investments in public equities. The decrease in Lending and debt investments primarily reflected net losses from debt investments in 2020 compared with net gains in 2019. The increase in Incentive fees was primarily driven by performance, and the increase in Management and other fees reflected the impact of higher average assets under supervision, partially offset by a lower average effective management fee due to shifts in the mix of client assets and strategies. |
2020 Asset Management
| |||||
|
$7.98 billion
| ||||||
|
Management and Other Fees |
$ 2.79 billion | |||||
| Incentive Fees |
$287 million | |||||
| Equity Investments |
$4.10 billion | |||||
| Lending and Debt Investments
|
$817 million | |||||
4
Goldman Sachs Reports
Full Year and Fourth Quarter 2020 Earnings Results
|
|
Asset Management |
|
| Fourth Quarter |
|
|||||
| Net revenues in Asset Management were $3.21 billion for the fourth quarter of 2020, 7% higher than the fourth quarter of 2019 and 16% higher than the third quarter of 2020. The increase compared with the fourth quarter of 2019 primarily reflected significantly higher net revenues in Lending and debt investments, partially offset by slightly lower net revenues in Equity investments. In addition, Management and other fees (from the firm’s institutional and third-party distribution asset management clients) and Incentive fees were both higher.
The increase in Lending and debt investments net revenues was due to significantly higher net gains, reflecting tighter corporate credit spreads during the quarter. The decrease in Equity investments net revenues reflected significantly lower net gains from investments in private equities, partially offset by significantly higher net gains from investments in public equities. The increase in Management and other fees reflected the impact of higher average assets under supervision, partially offset by a lower average effective management fee due to shifts in the mix of client assets and strategies. |
4Q20 Asset Management
| |||||
|
$3.21 billion
| ||||||
| Management and Other Fees |
$ 733 million | |||||
| Incentive Fees |
$ 71 million | |||||
| Equity Investments |
$1.77 billion | |||||
|
Lending and Debt Investments
|
$637 million | |||||
|
|
Consumer & Wealth Management |
|
| Full Year |
|
|||||
| Net revenues in Consumer & Wealth Management were $6.00 billion for 2020, 15% higher than 2019.
Net revenues in Wealth management were $4.78 billion, 10% higher than 2019, primarily reflecting higher Management and other fees, primarily reflecting the impact of higher average assets under supervision, higher transaction volumes and the impact of the full-year consolidation of GS Personal Financial Management5, partially offset by a lower average effective management fee due to shifts in the mix of client assets and strategies.
Net revenues in Consumer banking were $1.21 billion, 40% higher than 2019, reflecting higher credit card loan and deposit balances. |
2020 Consumer & Wealth Management
| |||||
|
$6.00 billion
| ||||||
|
Wealth Management |
$ 4.78 billion | |||||
| Consumer Banking
|
$1.21 billion
| |||||
|
Fourth Quarter |
||||||
| Net revenues in Consumer & Wealth Management were $1.65 billion for the fourth quarter of 2020, 17% higher than the fourth quarter of 2019 and 11% higher than the third quarter of 2020.
Net revenues in Wealth management were $1.31 billion, 11% higher than the fourth quarter of 2019, primarily reflecting higher Management and other fees, primarily reflecting the impact of higher average assets under supervision and higher transaction volumes, partially offset by a lower average effective management fee due to shifts in the mix of client assets and strategies. Net revenues in Private banking and lending were higher, primarily reflecting higher net interest income on mortgages.
Net revenues in Consumer banking were $347 million, 52% higher than the fourth quarter of 2019, reflecting higher deposit and credit card loan balances. |
4Q20 Consumer & Wealth Management
| |||||
|
$1.65 billion
| ||||||
|
Wealth Management |
$ 1.31 billion | |||||
| Consumer Banking
|
$347 million
| |||||
5
Goldman Sachs Reports
Full Year and Fourth Quarter 2020 Earnings Results
Provision for Credit Losses
| Full Year |
||||
| Provision for credit losses was $3.10 billion for 2020, compared with $1.07 billion for 2019. The increase was primarily due to significantly higher provisions related to wholesale loans as a result of individual impairments and ratings downgrades during the year, as well as deterioration and uncertainty in the broader economic environment (incorporating the accounting for credit losses under the Current Expected Credit Losses standard6) reflecting the impact of the COVID-19 pandemic. The increase also included higher provisions related to credit card loans, due to growth in the portfolio. |
|
2020 Provision for Credit Losses
| ||
|
$3.10 billion
| ||||
|
Fourth Quarter |
||||
|
Provision for credit losses was $293 million for the fourth quarter of 2020, 13% lower than the fourth quarter of 2019 and 5% higher than the third quarter of 2020. The fourth quarter of 2020 included reserve reductions on wholesale loans reflecting stabilization in the broader economic environment following the impact of the COVID-19 pandemic earlier in the year, partially offset by higher provisions from growth in credit card loans compared with the fourth quarter of 2019. |
4Q20 Provision for Credit Losses
| |||
|
$293 million
| ||||
Operating Expenses
| Full Year |
||||
| Operating expenses were $28.98 billion for 2020, 16% higher than 2019. The firm’s efficiency ratio3 for 2020 was 65.0%, compared with 68.1% for 2019.
The increase in operating expenses compared with 2019 primarily reflected significantly higher net provisions for litigation and regulatory proceedings and higher compensation and benefits expenses (reflecting improved financial performance). In addition, transaction based expenses were higher (reflecting an increase in activity levels), technology expenses were higher and expenses related to consolidated investments, including impairments, were also higher (increase was primarily in depreciation and amortization and occupancy expenses). The increase also reflected higher charitable contributions (included in other expenses), which included approximately $300 million to Goldman Sachs Gives and approximately $125 million to The Goldman Sachs Foundation during 2020. These increases were partially offset by significantly lower travel and entertainment expenses (included in market development expenses) and lower occupancy-related expenses.
Net provisions for litigation and regulatory proceedings for 2020 were $3.42 billion compared with $1.24 billion for 2019.
Headcount increased 6% during 2020, reflecting investments in new business initiatives and an increase in technology professionals. |
2020 Operating Expenses
| |||
|
$28.98 billion
| ||||
|
2020 Efficiency Ratio
| ||||
|
65.0%
| ||||
6
Goldman Sachs Reports
Full Year and Fourth Quarter 2020 Earnings Results
Operating Expenses
|
Fourth Quarter |
||||
| Operating expenses were $5.91 billion for the fourth quarter of 2020, 19% lower than the fourth quarter of 2019 and 5% lower than the third quarter of 2020.
The decrease in operating expenses compared with the fourth quarter of 2019 was primarily due to significantly lower net provisions for litigation and regulatory proceedings and lower compensation and benefits expenses. In addition, travel and entertainment expenses (included in market development expenses) and occupancy-related expenses were lower. These decreases were partially offset by significantly higher charitable contributions (included in other expenses), significantly higher transaction based expenses (reflecting an increase in activity levels) and higher technology expenses.
Net provisions for litigation and regulatory proceedings for the fourth quarter of 2020 were $24 million compared with $1.09 billion for the fourth quarter of 2019. |
4Q20 Operating Expenses
| |||
|
$5.91 billion
| ||||
Provision for Taxes
| The effective income tax rate for 2020 was 24.2%, down from 28.6% for the first nine months of 2020, primarily due to a decrease in the impact of non-deductible litigation for the full year compared with the first nine months of 2020. The 2020 effective income tax rate increased from 20.0% for 2019, primarily due to an increase in provisions for non-deductible litigation in 2020 compared to 2019. |
2020 Effective Tax Rate
| |||
|
24.2%
| ||||
Other Matters
| ◾ On January 15, 2021, the Board of Directors of The Goldman Sachs Group, Inc. declared a dividend of $1.25 per common share to be paid on March 30, 2021 to common shareholders of record on March 2, 2021.
◾ During the year, the firm returned $3.72 billion of capital to common shareholders, including $1.93 billion of share repurchases (8.2 million shares at an average cost of $236.35), all in the first quarter of 2020, and $1.80 billion of common stock dividends. The fourth quarter of 2020 included $448 million of common stock dividends.3
◾ Global core liquid assets3 averaged $283 billion4 for 2020, compared with an average of $234 billion for 2019. Global core liquid assets averaged $298 billion4 for the fourth quarter of 2020, compared with an average of $302 billion for the third quarter of 2020. |
Declared Quarterly Dividend Per Common Share
| |||
|
$1.25
| ||||
|
Capital Returned
| ||||
|
$3.72 billion in 2020
| ||||
|
Average GCLA
| ||||
|
$283 billion for 2020
| ||||
7
Goldman Sachs Reports
Full Year and Fourth Quarter 2020 Earnings Results
The Goldman Sachs Group, Inc. is a leading global investment banking, securities and investment management firm that provides a wide range of financial services to a substantial and diversified client base that includes corporations, financial institutions, governments and individuals. Founded in 1869, the firm is headquartered in New York and maintains offices in all major financial centers around the world.
|
|
Cautionary Note Regarding Forward-Looking Statements |
|
This press release contains “forward-looking statements” within the meaning of the safe harbor provisions of the U.S. Private Securities Litigation Reform Act of 1995. Forward-looking statements are not historical facts or statements of current conditions, but instead represent only the firm’s beliefs regarding future events, many of which, by their nature, are inherently uncertain and outside of the firm’s control. It is possible that the firm’s actual results, financial condition and liquidity may differ, possibly materially, from the anticipated results, financial condition and liquidity in these forward-looking statements. For information about some of the risks and important factors that could affect the firm’s future results, financial condition and liquidity, see “Risk Factors” in Part II, Item 1A of the firm’s Quarterly Report on Form 10-Q for the period ended September 30, 2020 and in Part I, Item 1A of the firm’s Annual Report on Form 10-K for the year ended December 31, 2019.
Information regarding the firm’s assets under supervision, capital ratios, risk-weighted assets, supplementary leverage ratio, balance sheet data, global core liquid assets and VaR consists of preliminary estimates. These estimates are forward-looking statements and are subject to change, possibly materially, as the firm completes its financial statements.
Statements about the firm’s investment banking transaction backlog also may constitute forward-looking statements. Such statements are subject to the risk that transactions may be modified or may not be completed at all and related net revenues may not be realized or may be materially less than expected. Important factors that could have such a result include, for underwriting transactions, a decline or weakness in general economic conditions, an outbreak of hostilities, volatility in the securities markets or an adverse development with respect to the issuer of the securities and, for financial advisory transactions, a decline in the securities markets, an inability to obtain adequate financing, an adverse development with respect to a party to the transaction or a failure to obtain a required regulatory approval. For information about other important factors that could adversely affect the firm’s investment banking transactions, see “Risk Factors” in Part II, Item 1A of the firm’s Quarterly Report on Form 10-Q for the period ended September 30, 2020 and in Part I, Item 1A of the firm’s Annual Report on Form 10-K for the year ended December 31, 2019.
|
|
Conference Call |
|
A conference call to discuss the firm’s financial results, outlook and related matters will be held at 9:30 am (ET). The call will be open to the public. Members of the public who would like to listen to the conference call should dial 1-888-281-7154 (in the U.S.) or 1-706-679-5627 (outside the U.S.). The number should be dialed at least 10 minutes prior to the start of the conference call. The conference call will also be accessible as an audio webcast through the Investor Relations section of the firm’s website, www.goldmansachs.com/investor-relations. There is no charge to access the call. For those unable to listen to the live broadcast, a replay will be available on the firm’s website or by dialing 1-855-859-2056 (in the U.S.) or 1-404-537-3406 (outside the U.S.) passcode number 64774224 beginning approximately three hours after the event. Please direct any questions regarding obtaining access to the conference call to Goldman Sachs Investor Relations, via e-mail, at gs-investor-[email protected].
8
Goldman Sachs Reports
Full Year and Fourth Quarter 2020 Earnings Results
The Goldman Sachs Group, Inc. and Subsidiaries
Segment Net Revenues (unaudited)
$ in millions
| YEAR ENDED | % CHANGE FROM | |||||||||||||||
| DECEMBER 31, 2020 |
DECEMBER 31, 2019 |
DECEMBER 31, 2019 |
||||||||||||||
|
INVESTMENT BANKING
|
||||||||||||||||
|
Financial advisory |
$ 3,065 | $ 3,197 | (4) % | |||||||||||||
| Equity underwriting |
3,406 | 1,482 | 130 | |||||||||||||
|
Debt underwriting
|
|
2,670
|
|
|
2,119
|
|
|
26
|
|
|||||||
|
Underwriting |
6,076 | 3,601 | 69 | |||||||||||||
| Corporate lending |
|
282
|
|
|
801
|
|
|
(65)
|
|
|||||||
|
Net revenues
|
|
9,423
|
|
|
7,599
|
|
|
24
|
|
|||||||
|
GLOBAL MARKETS
|
||||||||||||||||
| FICC intermediation |
9,991 | 6,009 | 66 | |||||||||||||
| FICC financing |
|
1,593
|
|
|
1,379
|
|
|
16
|
|
|||||||
|
FICC
|
11,584 | 7,388 | 57 | |||||||||||||
| Equities intermediation |
6,989 | 4,374 | 60 | |||||||||||||
|
Equities financing
|
|
2,584
|
|
|
3,017
|
|
|
(14)
|
|
|||||||
| Equities |
9,573 | 7,391 | 30 | |||||||||||||
|
Net revenues
|
|
21,157
|
|
|
14,779
|
|
|
43
|
|
|||||||
|
ASSET MANAGEMENT
|
||||||||||||||||
|
Management and other fees |
2,785 | 2,600 | 7 | |||||||||||||
|
Incentive fees |
287 | 130 | 121 | |||||||||||||
|
Equity investments |
4,095 | 4,765 | (14) | |||||||||||||
|
Lending and debt investments
|
|
817
|
|
|
1,470
|
|
|
(44)
|
|
|||||||
|
Net revenues
|
|
7,984
|
|
|
8,965
|
|
|
(11)
|
|
|||||||
|
CONSUMER & WEALTH MANAGEMENT
|
||||||||||||||||
|
Management and other fees |
3,889 | 3,475 | 12 | |||||||||||||
|
Incentive fees |
114 | 81 | 41 | |||||||||||||
|
Private banking and lending
|
|
780
|
|
|
783
|
|
|
–
|
|
|||||||
|
Wealth management |
4,783 | 4,339 | 10 | |||||||||||||
| Consumer banking |
|
1,213
|
|
|
864
|
|
|
40
|
|
|||||||
|
Net revenues
|
|
5,996
|
|
|
5,203
|
|
|
15
|
|
|||||||
|
Total net revenues
|
|
$ 44,560
|
|
|
$ 36,546
|
|
|
22
|
|
|||||||
|
Geographic Net Revenues (unaudited)3 $ in millions
|
|
|||||||||||||||
| YEAR ENDED | ||||||||||||||||
| DECEMBER 31, 2020 |
DECEMBER 31, 2019 |
|||||||||||||||
| Americas |
$ 27,508 | $ 22,148 | ||||||||||||||
|
EMEA |
10,868 | 9,745 | ||||||||||||||
|
Asia
|
|
6,184
|
|
|
4,653
|
|
||||||||||
|
Total net revenues
|
|
$ 44,560
|
|
|
$ 36,546
|
|
||||||||||
| Americas |
62% | 60% | ||||||||||||||
|
EMEA |
24% | 27% | ||||||||||||||
|
Asia
|
|
14%
|
|
|
13%
|
|
||||||||||
|
Total
|
|
100%
|
|
|
100%
|
|
||||||||||
9
Goldman Sachs Reports
Full Year and Fourth Quarter 2020 Earnings Results
The Goldman Sachs Group, Inc. and Subsidiaries
Segment Net Revenues (unaudited)
$ in millions
| THREE MONTHS ENDED | % CHANGE FROM | |||||||||||||||||||||||
| DECEMBER 31, 2020 |
SEPTEMBER 30, 2020 |
DECEMBER 31, 2019 |
SEPTEMBER 30, 2020 |
DECEMBER 31, 2019 |
||||||||||||||||||||
|
INVESTMENT BANKING
|
||||||||||||||||||||||||
|
Financial advisory |
$ 1,091 | $ 507 | $ 855 | 115 % | 28 % | |||||||||||||||||||
| Equity underwriting |
1,115 | 856 | 378 | 30 | 195 | |||||||||||||||||||
|
Debt underwriting
|
|
526
|
|
|
571
|
|
|
599
|
|
|
(8)
|
|
|
(12)
|
| |||||||||
|
Underwriting |
1,641 | 1,427 | 977 | 15 | 68 | |||||||||||||||||||
| Corporate lending
|
|
(119)
|
|
|
35
|
|
|
232
|
|
|
N.M.
|
|
|
N.M.
|
| |||||||||
|
Net revenues
|
|
2,613
|
|
|
1,969
|
|
|
2,064
|
|
|
33
|
|
|
27
|
| |||||||||
|
GLOBAL MARKETS
|
||||||||||||||||||||||||
|
FICC intermediation |
1,498 | 2,170 | 1,382 | (31) | 8 | |||||||||||||||||||
| FICC financing
|
|
380
|
|
|
332
|
|
|
387
|
|
|
14
|
|
|
(2)
|
| |||||||||
|
FICC |
1,878 | 2,502 | 1,769 | (25) | 6 | |||||||||||||||||||
| Equities intermediation |
1,796 | 1,466 | 979 | 23 | 83 | |||||||||||||||||||
|
Equities financing
|
|
591
|
|
|
585
|
|
|
732
|
|
|
1
|
|
|
(19)
|
| |||||||||
|
Equities
|
|
2,387
|
|
|
2,051
|
|
|
1,711
|
|
|
16
|
|
|
40
|
| |||||||||
|
Net revenues
|
|
4,265
|
|
|
4,553
|
|
|
3,480
|
|
|
(6)
|
|
|
23
|
| |||||||||
|
ASSET MANAGEMENT
|
||||||||||||||||||||||||
|
Management and other fees |
733 | 728 | 666 | 1 | 10 | |||||||||||||||||||
|
Incentive fees |
71 | 28 | 45 | 154 | 58 | |||||||||||||||||||
|
Equity investments |
1,770 | 1,423 | 1,865 | 24 | (5) | |||||||||||||||||||
|
Lending and debt investments
|
|
637
|
|
|
589
|
|
|
427
|
|
|
8
|
|
|
49
|
| |||||||||
|
Net revenues
|
|
3,211
|
|
|
2,768
|
|
|
3,003
|
|
|
16
|
|
|
7
|
| |||||||||
|
CONSUMER & WEALTH MANAGEMENT
|
||||||||||||||||||||||||
|
Management and other fees |
1,035 | 957 | 967 | 8 | 7 | |||||||||||||||||||
|
Incentive fees |
28 | 7 | 19 | N.M. | 47 | |||||||||||||||||||
|
Private banking and lending
|
|
242
|
|
|
201
|
|
|
194
|
|
|
20
|
|
|
25
|
| |||||||||
|
Wealth management |
1,305 | 1,165 | 1,180 | 12 | 11 | |||||||||||||||||||
| Consumer banking
|
|
347
|
|
|
326
|
|
|
228
|
|
|
6
|
|
|
52
|
| |||||||||
|
Net revenues
|
|
1,652
|
|
|
1,491
|
|
|
1,408
|
|
|
11
|
|
|
17
|
| |||||||||
|
Total net revenues
|
|
$ 11,741
|
|
|
$ 10,781
|
|
|
$ 9,955
|
|
|
9
|
|
|
18
|
| |||||||||
|
Geographic Net Revenues (unaudited) 3 |
|
|||||||||||||||||||||||
| $ in millions
|
||||||||||||||||||||||||
| THREE MONTHS ENDED | ||||||||||||||||||||||||
| DECEMBER 31, 2020 |
SEPTEMBER 30, 2020 |
DECEMBER 31, 2019 |
||||||||||||||||||||||
|
Americas |
$ 7,175 | $ 6,873 | $ 6,310 | |||||||||||||||||||||
|
EMEA |
2,837 | 2,470 | 2,268 | |||||||||||||||||||||
|
Asia
|
|
1,729
|
|
|
1,438
|
|
|
1,377
|
|
|||||||||||||||
|
Total net revenues
|
|
$ 11,741
|
|
|
$ 10,781
|
|
|
$ 9,955
|
|
|||||||||||||||
| Americas |
61% | 64% | 63% | |||||||||||||||||||||
|
EMEA |
24% | 23% | 23% | |||||||||||||||||||||
|
Asia
|
|
15%
|
|
|
13%
|
|
|
14%
|
|
|||||||||||||||
|
Total
|
|
100%
|
|
|
100%
|
|
|
100%
|
|
|||||||||||||||
10
Goldman Sachs Reports
Full Year and Fourth Quarter 2020 Earnings Results
The Goldman Sachs Group, Inc. and Subsidiaries
Consolidated Statements of Earnings (unaudited)
In millions, except per share amounts
| YEAR ENDED | % CHANGE FROM | |||||||||||||||||
| DECEMBER 31, 2020 |
DECEMBER 31, 2019 |
DECEMBER 31, 2019 |
||||||||||||||||
|
REVENUES
|
||||||||||||||||||
|
Investment banking |
$ 9,141 | $ 6,798 | 34 % | |||||||||||||||
|
Investment management |
6,923 | 6,189 | 12 | |||||||||||||||
|
Commissions and fees |
3,548 | 2,988 | 19 | |||||||||||||||
|
Market making |
15,546 | 10,157 | 53 | |||||||||||||||
|
Other principal transactions
|
|
4,651
|
|
|
6,052
|
|
|
(23)
|
|
|||||||||
|
Total non-interest revenues
|
|
39,809
|
|
|
32,184
|
|
|
24
|
|
|||||||||
| Interest income |
13,689 | 21,738 | (37) | |||||||||||||||
|
Interest expense
|
|
8,938
|
|
|
17,376
|
|
|
(49)
|
|
|||||||||
|
Net interest income
|
|
4,751
|
|
|
4,362
|
|
|
9
|
|
|||||||||
|
Total net revenues
|
|
44,560
|
|
|
36,546
|
|
|
22
|
|
|||||||||
|
Provision for credit losses
|
|
3,098
|
|
|
1,065
|
|
|
191
|
|
|||||||||
|
OPERATING EXPENSES
|
||||||||||||||||||
|
Compensation and benefits |
13,309 | 12,353 | 8 | |||||||||||||||
|
Transaction based7 |
4,141 | 3,513 | 18 | |||||||||||||||
|
Market development |
401 | 739 | (46) | |||||||||||||||
|
Communications and technology |
1,347 | 1,167 | 15 | |||||||||||||||
|
Depreciation and amortization |
1,902 | 1,704 | 12 | |||||||||||||||
|
Occupancy |
960 | 1,029 | (7) | |||||||||||||||
|
Professional fees |
1,306 | 1,316 | (1) | |||||||||||||||
|
Other expenses7
|
|
5,617
|
|
|
3,077
|
|
|
83
|
|
|||||||||
|
Total operating expenses
|
|
28,983
|
|
|
24,898
|
|
|
16
|
|
|||||||||
| Pre-tax earnings |
12,479 | 10,583 | 18 | |||||||||||||||
|
Provision for taxes
|
|
3,020
|
|
|
2,117
|
|
|
43
|
|
|||||||||
|
Net earnings
|
|
9,459
|
|
|
8,466
|
|
|
12
|
|
|||||||||
|
Preferred stock dividends
|
|
544
|
|
|
569
|
|
|
(4)
|
|
|||||||||
|
Net earnings applicable to common shareholders
|
|
$ 8,915
|
|
|
$ 7,897
|
|
|
13
|
|
|||||||||
|
EARNINGS PER COMMON SHARE
|
||||||||||||||||||
|
Basic3 |
$ 24.94 | $ 21.18 | 18 % | |||||||||||||||
|
Diluted |
$ 24.74 | $ 21.03 | 18 | |||||||||||||||
|
AVERAGE COMMON SHARES
|
||||||||||||||||||
|
Basic |
356.4 | 371.6 | (4) | |||||||||||||||
|
Diluted
|
|
360.3
|
|
|
375.5
|
|
|
(4)
|
|
|||||||||
11
Goldman Sachs Reports
Full Year and Fourth Quarter 2020 Earnings Results
The Goldman Sachs Group, Inc. and Subsidiaries
Consolidated Statements of Earnings (unaudited)
In millions, except per share amounts and headcount
| THREE MONTHS ENDED | % CHANGE FROM | |||||||||||||||||||||
| DECEMBER 31, 2020 |
SEPTEMBER 30, 2020 |
DECEMBER 31, 2019 |
SEPTEMBER 30, 2020 |
DECEMBER 31, 2019 |
||||||||||||||||||
|
REVENUES
|
||||||||||||||||||||||
|
Investment banking |
$ 2,732 | $ 1,934 | $ 1,832 | 41 % | 49 % | |||||||||||||||||
|
Investment management |
1,831 | 1,689 | 1,671 | 8 | 10 | |||||||||||||||||
|
Commissions and fees |
849 | 804 | 687 | 6 | 24 | |||||||||||||||||
|
Market making |
2,750 | 3,327 | 2,479 | (17) | 11 | |||||||||||||||||
|
Other principal transactions
|
|
2,169
|
|
|
1,943
|
|
|
2,221
|
|
|
12
|
|
|
(2)
|
| |||||||
|
Total non-interest revenues
|
|
10,331
|
|
|
9,697
|
|
|
8,890
|
|
|
7
|
|
|
16
|
| |||||||
| Interest income |
2,973 | 2,932 | 4,922 | 1 | (40) | |||||||||||||||||
|
Interest expense
|
|
1,563
|
|
|
1,848
|
|
|
3,857
|
|
|
(15)
|
|
(59) | |||||||||
|
Net interest income
|
|
1,410
|
|
|
1,084
|
|
|
1,065
|
|
|
30
|
|
|
32
|
| |||||||
|
Total net revenues
|
|
11,741
|
|
|
10,781
|
|
|
9,955
|
|
|
9
|
|
|
18
|
| |||||||
|
Provision for credit losses
|
|
293
|
|
|
278
|
|
|
336
|
|
|
5
|
|
|
(13)
|
| |||||||
|
OPERATING EXPENSES
|
||||||||||||||||||||||
|
Compensation and benefits |
2,479 | 3,117 | 3,046 | (20) | (19) | |||||||||||||||||
|
Transaction based7 |
1,086 | 1,011 | 899 | 7 | 21 | |||||||||||||||||
|
Market development |
89 | 70 | 200 | 27 | (56) | |||||||||||||||||
|
Communications and technology |
341 | 340 | 308 | – | 11 | |||||||||||||||||
|
Depreciation and amortization |
498 | 468 | 464 | 6 | 7 | |||||||||||||||||
|
Occupancy |
254 | 235 | 318 | 8 | (20) | |||||||||||||||||
|
Professional fees |
350 | 298 | 366 | 17 | (4) | |||||||||||||||||
|
Other expenses7
|
|
810
|
|
|
665
|
|
|
1,697
|
|
|
22
|
|
|
(52)
|
| |||||||
|
Total operating expenses
|
|
5,907
|
|
|
6,204
|
|
|
7,298
|
|
|
(5)
|
|
|
(19)
|
| |||||||
| Pre-tax earnings |
5,541 | 4,299 | 2,321 | 29 | 139 | |||||||||||||||||
|
Provision for taxes
|
|
1,035
|
|
|
932
|
|
|
404
|
|
|
11
|
|
|
156
|
| |||||||
|
Net earnings
|
|
4,506
|
|
|
3,367
|
|
|
1,917
|
|
|
34
|
|
|
135
|
| |||||||
|
Preferred stock dividends
|
|
144
|
|
|
134
|
|
|
193
|
|
|
7
|
|
|
(25)
|
| |||||||
|
Net earnings applicable to common shareholders
|
|
$ 4,362
|
|
|
$ 3,233
|
|
|
$ 1,724
|
|
|
35
|
|
|
153
|
| |||||||
|
EARNINGS PER COMMON SHARE
|
||||||||||||||||||||||
|
Basic3 |
$ 12.23 | $ 9.07 | $ 4.74 | 35 % | 158 % | |||||||||||||||||
|
Diluted |
$ 12.08 | $ 8.98 | $ 4.69 | 35 | 158 | |||||||||||||||||
|
AVERAGE COMMON SHARES
|
||||||||||||||||||||||
|
Basic |
356.0 | 355.9 | 362.4 | – | (2) | |||||||||||||||||
|
Diluted |
361.0 | 359.9 | 367.3 | – | (2) | |||||||||||||||||
|
SELECTED DATA AT PERIOD-END
|
||||||||||||||||||||||
|
Common shareholders’ equity |
$ 84,729 | $ 81,447 | $ 79,062 | 4 | 7 | |||||||||||||||||
|
Basic shares3 |
358.8 | 356.0 | 361.8 | 1 | (1) | |||||||||||||||||
|
Book value per common share |
$ 236.15 | $ 228.78 | $ 218.52 | 3 | 8 | |||||||||||||||||
| Headcount
|
|
40,500
|
|
|
40,900
|
|
|
38,300
|
|
|
(1)
|
|
|
6
|
| |||||||
12
Goldman Sachs Reports
Full Year and Fourth Quarter 2020 Earnings Results
The Goldman Sachs Group, Inc. and Subsidiaries
Condensed Consolidated Balance Sheets (unaudited)4
$ in billions
| AS OF | ||||||||||||||||||||||
| DECEMBER 31, 2020 |
SEPTEMBER 30, 2020 |
DECEMBER 31, 2019 |
||||||||||||||||||||
|
ASSETS
|
||||||||||||||||||||||
|
Cash and cash equivalents
|
$ 156 | $ 153 | $ 133 | |||||||||||||||||||
| Collateralized agreements
|
250 | 229 | 222 | |||||||||||||||||||
| Customer and other receivables
|
121 | 111 | 75 | |||||||||||||||||||
| Trading assets
|
394 | 408 | 355 | |||||||||||||||||||
| Investments
|
89 | 81 | 64 | |||||||||||||||||||
| Loans
|
116 | 112 | 109 | |||||||||||||||||||
| Other assets |
|
37
|
|
|
38
|
|
|
35
|
|
|||||||||||||
|
Total assets
|
|
$ 1,163
|
|
|
$
1,132
|
|
|
$ 993
|
|
|||||||||||||
|
LIABILITIES AND SHAREHOLDERS’ EQUITY
|
||||||||||||||||||||||
|
Deposits
|
$ 260 | $ 261 | $ 190 | |||||||||||||||||||
| Collateralized financings
|
174 | 144 | 152 | |||||||||||||||||||
| Customer and other payables
|
191 | 187 | 175 | |||||||||||||||||||
| Trading liabilities
|
154 | 162 | 109 | |||||||||||||||||||
| Unsecured short-term borrowings
|
53 | 48 | 48 | |||||||||||||||||||
| Unsecured long-term borrowings
|
213 | 214 | 207 | |||||||||||||||||||
| Other liabilities |
|
22
|
|
|
23
|
|
|
22
|
|
|||||||||||||
|
Total liabilities
|
|
1,067
|
|
|
1,039
|
|
|
903
|
|
|||||||||||||
|
Shareholders’ equity |
|
96
|
|
|
93
|
|
|
90
|
|
|||||||||||||
|
Total liabilities and shareholders’ equity
|
|
$ 1,163
|
|
|
$
1,132
|
|
|
$ 993
|
|
|||||||||||||
|
Capital Ratios and Supplementary Leverage Ratio (unaudited)3,4 $ in billions
|
|
|||||||||||||||||||||
| AS OF | ||||||||||||||||||||||
| DECEMBER 31, 2020 |
SEPTEMBER 30, 2020 |
DECEMBER 31, 2019 |
||||||||||||||||||||
| Common equity tier 1 capital |
$ 81.6 | $ 77.5 | $ 74.9 | |||||||||||||||||||
|
STANDARDIZED CAPITAL RULES |
||||||||||||||||||||||
| Risk-weighted assets
|
|
$ 554
|
|
|
$ 535
|
|
|
$ 564
|
|
|||||||||||||
| Common equity tier 1 capital ratio |
|
14.7%
|
|
|
14.5%
|
|
|
13.3%
|
|
|||||||||||||
|
ADVANCED CAPITAL RULES |
||||||||||||||||||||||
| Risk-weighted assets
|
|
$ 610
|
|
|
$ 600
|
|
|
$ 545
|
|
|||||||||||||
| Common equity tier 1 capital ratio |
|
13.4%
|
|
|
12.9%
|
|
|
13.7%
|
|
|||||||||||||
|
SUPPLEMENTARY LEVERAGE RATIO |
||||||||||||||||||||||
|
Supplementary leverage ratio
|
|
7.0%
|
|
|
6.8%
|
|
|
6.2%
|
|
|||||||||||||
|
Average Daily VaR (unaudited)3,4 |
|
|||||||||||||||||||||
| $ in millions
|
||||||||||||||||||||||
| THREE MONTHS ENDED | YEAR ENDED | |||||||||||||||||||||
| DECEMBER 31, 2020 |
SEPTEMBER 30, 2020 |
DECEMBER 31, 2019 |
DECEMBER 31, 2020 |
DECEMBER 31, 2019 |
||||||||||||||||||
|
RISK CATEGORIES
|
||||||||||||||||||||||
| Interest rates |
$ 57 | $ 72 | $ 49 | $ 71 | $ 46 | |||||||||||||||||
|
Equity prices
|
50 | 55 | 24 | 55 | 27 | |||||||||||||||||
| Currency rates |
14 | 22 | 11 | 23 | 11 | |||||||||||||||||
|
Commodity prices |
20 | 26 | 12 | 20 | 12 | |||||||||||||||||
|
Diversification effect |
|
(57)
|
|
|
(84)
|
|
|
(38)
|
|
|
(75)
|
|
|
(40)
|
| |||||||
|
Total
|
|
$ 84
|
|
|
$ 91
|
|
|
$ 58
|
|
|
$ 94
|
|
$ 56 | |||||||||
13
Goldman Sachs Reports
Full Year and Fourth Quarter 2020 Earnings Results
The Goldman Sachs Group, Inc. and Subsidiaries
Assets Under Supervision (unaudited)3,4
$ in billions
| AS OF | ||||||||||||||||||||||
| DECEMBER 31, 2020 |
SEPTEMBER 30, 2020 |
DECEMBER 31, 2019 |
||||||||||||||||||||
|
SEGMENT
|
||||||||||||||||||||||
|
Asset Management |
$ 1,530 | $ 1,461 | $ 1,298 | |||||||||||||||||||
|
Consumer & Wealth Management
|
|
615
|
|
|
575
|
|
|
561
|
|
|||||||||||||
|
Total AUS
|
|
$ 2,145
|
|
|
$ 2,036
|
|
|
$ 1,859
|
|
|||||||||||||
|
ASSET CLASS
|
||||||||||||||||||||||
| Alternative investments |
$ 191 | $ 182 | $ 185 | |||||||||||||||||||
|
Equity |
475 | 421 | 423 | |||||||||||||||||||
|
Fixed income
|
|
896
|
|
|
856
|
|
|
789
|
|
|||||||||||||
|
Total long-term AUS
|
|
1,562
|
|
|
1,459
|
|
|
1,397
|
|
|||||||||||||
|
Liquidity products
|
|
583
|
|
|
577
|
|
|
462
|
|
|||||||||||||
|
Total AUS
|
|
$ 2,145
|
|
|
$ 2,036
|
|
|
$ 1,859
|
|
|||||||||||||
| THREE MONTHS ENDED | YEAR ENDED | |||||||||||||||||||||
| DECEMBER 31, 2020 |
SEPTEMBER 30, 2020 |
DECEMBER 31, 2019 |
DECEMBER 31, 2020 |
DECEMBER 31, 2019 |
||||||||||||||||||
|
ASSET MANAGEMENT |
||||||||||||||||||||||
|
Beginning balance |
$ 1,461 | $ 1,499 | $ 1,232 | $ 1,298 | $ 1,087 | |||||||||||||||||
|
Net inflows / (outflows): |
||||||||||||||||||||||
|
Alternative investments |
2 | (3) | (1) | (4) | 2 | |||||||||||||||||
|
Equity |
(12) | (5) | 1 | (12) | 34 | |||||||||||||||||
|
Fixed income |
|
20
|
|
|
22
|
|
|
(4)
|
|
|
55
|
|
|
35
|
| |||||||
|
Total long-term AUS net inflows / (outflows) |
|
10
|
|
|
14
|
|
|
(4)
|
|
|
39
|
|
|
71
|
| |||||||
|
Liquidity products
|
|
6
|
|
|
(86)
|
|
|
50
|
|
|
107
|
|
|
52
|
| |||||||
|
Total AUS net inflows / (outflows)
|
|
16
|
|
|
(72)
|
|
|
46
|
|
|
146
|
|
|
123
|
5
| |||||||
|
Net market appreciation / (depreciation) |
|
53
|
|
|
34
|
|
|
20
|
|
|
86
|
|
|
88
|
| |||||||
|
Ending balance
|
|
$ 1,530
|
|
|
$ 1,461
|
|
|
$ 1,298
|
|
|
$ 1,530
|
|
|
$ 1,298
|
| |||||||
|
CONSUMER & WEALTH MANAGEMENT |
||||||||||||||||||||||
|
Beginning balance |
$ 575 | $ 558 | $ 530 | $ 561 | $ 455 | |||||||||||||||||
|
Net inflows / (outflows): |
||||||||||||||||||||||
|
Alternative investments |
1 | 2 | 2 | 3 | 9 | |||||||||||||||||
|
Equity |
8 | – | – | 8 | 11 | |||||||||||||||||
|
Fixed income |
|
(2)
|
|
|
2
|
|
|
4
|
|
|
(8)
|
|
|
17
|
| |||||||
|
Total long-term AUS net inflows / (outflows)
|
|
7
|
|
|
4
|
|
|
6
|
|
|
3
|
|
|
37
|
| |||||||
|
Liquidity products |
|
–
|
|
|
(4)
|
|
|
8
|
|
|
14
|
|
|
13
|
| |||||||
|
Total AUS net inflows / (outflows)
|
|
7
|
|
|
–
|
|
|
14
|
|
|
17
|
|
|
50
|
5
| |||||||
|
Net market appreciation / (depreciation) |
|
33
|
|
|
17
|
|
|
17
|
|
|
37
|
|
|
56
|
| |||||||
|
Ending balance
|
|
$
615
|
|
|
$
575
|
|
|
$
561
|
|
|
$
615
|
|
|
$
561
|
| |||||||
|
FIRMWIDE |
||||||||||||||||||||||
|
Beginning balance |
$ 2,036 | $ 2,057 | $ 1,762 | $ 1,859 | $ 1,542 | |||||||||||||||||
|
Net inflows / (outflows): |
||||||||||||||||||||||
|
Alternative investments |
3 | (1) | 1 | (1) | 11 | |||||||||||||||||
|
Equity |
(4) | (5) | 1 | (4) | 45 | |||||||||||||||||
|
Fixed income |
|
18
|
|
|
24
|
|
|
–
|
|
|
47
|
|
|
52
|
| |||||||
|
Total long-term AUS net inflows / (outflows)
|
|
17
|
|
|
18
|
|
|
2
|
|
|
42
|
|
|
108
|
| |||||||
|
Liquidity products |
|
6
|
|
|
(90)
|
|
|
58
|
|
|
121
|
|
|
65
|
| |||||||
|
Total AUS net inflows / (outflows)
|
|
23
|
|
|
(72)
|
|
|
60
|
|
|
163
|
|
|
173
|
5
| |||||||
|
Net market appreciation / (depreciation)
|
|
86
|
|
|
51
|
|
|
37
|
|
|
123
|
|
|
144
|
| |||||||
|
Ending balance
|
|
$ 2,145
|
|
|
$ 2,036
|
|
|
$ 1,859
|
|
|
$ 2,145
|
|
|
$ 1,859
|
| |||||||
14
Goldman Sachs Reports
Full Year and Fourth Quarter 2020 Earnings Results
|
Footnotes |
|
|
| 1. | ROE is calculated by dividing net earnings (or annualized net earnings for annualized ROE) applicable to common shareholders by average monthly common shareholders’ equity. ROTE is calculated by dividing net earnings (or annualized net earnings for annualized ROTE) applicable to common shareholders by average monthly tangible common shareholders’ equity (tangible common shareholders’ equity is calculated as total shareholders’ equity less preferred stock, goodwill and identifiable intangible assets). Management believes that ROTE is meaningful because it measures the performance of businesses consistently, whether they were acquired or developed internally, and that tangible common shareholders’ equity is meaningful because it is a measure that the firm and investors use to assess capital adequacy. ROTE and tangible common shareholders’ equity are non-GAAP measures and may not be comparable to similar non-GAAP measures used by other companies. |
The table below presents a reconciliation of average common shareholders’ equity to average tangible common shareholders’ equity:
| AVERAGE FOR THE | ||||||||||||
| Unaudited, $ in millions | THREE MONTHS ENDED DECEMBER 31, 2020 |
YEAR ENDED DECEMBER 31, 2020 |
||||||||||
|
Total shareholders’ equity
|
|
$ 93,835
|
|
|
$ 91,779
|
|
||||||
| Preferred stock
|
|
(11,203)
|
|
|
(11,203)
|
|
||||||
|
Common shareholders’ equity
|
|
82,632
|
|
|
80,576
|
|
||||||
|
Goodwill Identifiable intangible assets
|
|
(4,332) (626)
|
|
|
(4,238) (617)
|
|
||||||
|
Tangible common shareholders’ equity
|
|
$
77,674
|
|
|
$
75,721
|
|
||||||
| 2. | Dealogic – January 1, 2020 through December 31, 2020. |
| 3. | For information about the following items, see the referenced sections in Part I, Item 2 “Management’s Discussion and Analysis of Financial Condition and Results of Operations” in the firm’s Quarterly Report on Form 10-Q for the period ended September 30, 2020: (i) investment banking transaction backlog – see “Results of Operations – Investment Banking” (ii) assets under supervision – see “Results of Operations – Assets Under Supervision” (iii) efficiency ratio – see “Results of Operations – Operating Expenses” (iv) share repurchase program – see “Equity Capital Management and Regulatory Capital – Equity Capital Management” (v) global core liquid assets – see “Risk Management – Liquidity Risk Management” (vi) basic shares – see “Balance Sheet and Funding Sources – Balance Sheet Analysis and Metrics” and (vii) VaR – see “Risk Management – Market Risk Management.” |
For information about the following items, see the referenced sections in Part I, Item 1 “Financial Statements (Unaudited)” in the firm’s Quarterly Report on Form 10-Q for the period ended September 30, 2020: (i) risk-based capital ratios and the supplementary leverage ratio – see Note 20 “Regulation and Capital Adequacy” (ii) geographic net revenues – see Note 25 “Business Segments” and (iii) unvested share-based awards that have non-forfeitable rights to dividends or dividend equivalents in calculating basic EPS – see Note 21 “Earnings Per Common Share.”
| 4. | Represents a preliminary estimate for the fourth quarter of 2020 and may be revised in the firm’s Annual Report on Form 10-K for the year ended December 31, 2020. |
| 5. | Net inflows in assets under supervision for 2019 included $71 billion of total inflows (substantially all in equity and fixed income assets) in connection with the acquisitions of both Standard & Poor’s Investment Advisory Services (SPIAS) and GS Personal Financial Management in the third quarter of 2019 ($58 billion), and Rocaton Investment Advisors (Rocaton) in the second quarter of 2019 ($13 billion). SPIAS and Rocaton were included in the Asset Management segment and GS Personal Financial Management was included in the Consumer & Wealth Management segment. |
| 6. | In the first quarter of 2020, the firm adopted ASU No. 2016-13, “Financial Instruments – Credit Losses (Topic 326) – Measurement of Credit Losses on Financial Instruments.” For further information about ASU No. 2016-13, see Note 3 “Significant Accounting Policies” in Part I, Item 1 “Financial Statements (Unaudited)” in the firm’s Quarterly Report on Form 10-Q for the period ended September 30, 2020. |
| 7. | Brokerage, clearing, exchange and distribution fees has been renamed transaction based expenses and additionally includes expenses resulting from completed transactions, which are directly related to client revenues. Such expenses were previously reported in other expenses. Previously reported amounts have been conformed to the current presentation. |
15

Exhibit 99.2 Full Year and Fourth Quarter 2020 Earnings Results Presentation January 19, 2021Exhibit 99.2 Full Year and Fourth Quarter 2020 Earnings Results Presentation January 19, 2021

Financial Overview Financial Results Financial Overview Highlights n 4Q20 results included EPS of $12.08 and ROE of 21.1% $ in millions, vs. vs. vs. except per share amounts 4Q20 3Q20 4Q19 2020 2019 — 4Q20 net revenues were higher YoY, reflecting higher net revenues across all segments, with particular strength in Global Markets and Investment Banking Investment Banking $ 2,613 33% 27% $ 9,423 24% — 4Q20 provision for credit losses included reserve reductions on wholesale loans reflecting stabilization in the broader economic environment following the impact of the COVID-19 Global Markets 4,265 -6% 23% 21,157 43% pandemic earlier in the year, partially offset by higher provisions from growth in credit card loans, as compared with 4Q19 Asset Management 3,211 16% 7% 7,984 -11% — 4Q20 operating expenses were lower YoY, primarily due to significantly lower net provisions for litigation and regulatory proceedings and lower compensation and benefits expenses Consumer & Wealth Management 1,652 11% 17% 5,996 15% n 2020 results included EPS of $24.74 and ROE of 11.1% Net revenues $ 11,741 9% 18% $ 44,560 22% — 2020 net revenues were significantly higher YoY, primarily reflecting strength in Global Markets and Investment Banking Provision for credit losses 293 5% -13% 3,098 191% — 2020 provision for credit losses reflected significantly higher provisions related to wholesale loans (reflecting the impact of the COVID-19 pandemic on the portfolio) and higher provisions Operating expenses 5,907 -5% -19% 28,983 16% related to credit card loans, as compared with 2019 — 2020 operating expenses were higher YoY, primarily reflecting significantly higher net Pre-tax earnings 5,541 29% 139% 12,479 18% provisions for litigation and regulatory proceedings, as well as higher compensation and benefits expenses (reflecting improved financial performance) Net earnings 4,506 34% 135% 9,459 12% — 2020 litigation expenses increased the efficiency ratio and decreased EPS, ROE and ROTE Net earnings to common $ 4,362 35% 153% $ 8,915 13% Litigation Impact 2020 2019 Diluted EPS $ 12.08 35% 158% $ 24.74 18% Diluted EPS $ -9.51 $ -3.16 1 ROE 21.1% 4.9pp 12.4pp 11.1% 1.1pp ROE -3.9pp -1.5pp 1 ROTE 22.5% 5.2pp 13.3pp 11.8% 1.2pp ROTE -4.1pp -1.6pp 2 Efficiency Ratio 50.3% -7.2pp -23.0pp 65.0% -3.1pp Efficiency Ratio +7.6pp +3.4pp 1Financial Overview Financial Results Financial Overview Highlights n 4Q20 results included EPS of $12.08 and ROE of 21.1% $ in millions, vs. vs. vs. except per share amounts 4Q20 3Q20 4Q19 2020 2019 — 4Q20 net revenues were higher YoY, reflecting higher net revenues across all segments, with particular strength in Global Markets and Investment Banking Investment Banking $ 2,613 33% 27% $ 9,423 24% — 4Q20 provision for credit losses included reserve reductions on wholesale loans reflecting stabilization in the broader economic environment following the impact of the COVID-19 Global Markets 4,265 -6% 23% 21,157 43% pandemic earlier in the year, partially offset by higher provisions from growth in credit card loans, as compared with 4Q19 Asset Management 3,211 16% 7% 7,984 -11% — 4Q20 operating expenses were lower YoY, primarily due to significantly lower net provisions for litigation and regulatory proceedings and lower compensation and benefits expenses Consumer & Wealth Management 1,652 11% 17% 5,996 15% n 2020 results included EPS of $24.74 and ROE of 11.1% Net revenues $ 11,741 9% 18% $ 44,560 22% — 2020 net revenues were significantly higher YoY, primarily reflecting strength in Global Markets and Investment Banking Provision for credit losses 293 5% -13% 3,098 191% — 2020 provision for credit losses reflected significantly higher provisions related to wholesale loans (reflecting the impact of the COVID-19 pandemic on the portfolio) and higher provisions Operating expenses 5,907 -5% -19% 28,983 16% related to credit card loans, as compared with 2019 — 2020 operating expenses were higher YoY, primarily reflecting significantly higher net Pre-tax earnings 5,541 29% 139% 12,479 18% provisions for litigation and regulatory proceedings, as well as higher compensation and benefits expenses (reflecting improved financial performance) Net earnings 4,506 34% 135% 9,459 12% — 2020 litigation expenses increased the efficiency ratio and decreased EPS, ROE and ROTE Net earnings to common $ 4,362 35% 153% $ 8,915 13% Litigation Impact 2020 2019 Diluted EPS $ 12.08 35% 158% $ 24.74 18% Diluted EPS $ -9.51 $ -3.16 1 ROE 21.1% 4.9pp 12.4pp 11.1% 1.1pp ROE -3.9pp -1.5pp 1 ROTE 22.5% 5.2pp 13.3pp 11.8% 1.2pp ROTE -4.1pp -1.6pp 2 Efficiency Ratio 50.3% -7.2pp -23.0pp 65.0% -3.1pp Efficiency Ratio +7.6pp +3.4pp 1

Investment Banking Financial Results Investment Banking Highlights vs. vs. vs.n 4Q20 net revenues were significantly higher YoY $ in millions 4Q20 3Q20 4Q19 2020 2019 — Financial advisory net revenues reflected an increase in completed mergers and acquisitions transactions Financial advisory $ 1,091 115% 28% $ 3,065 -4% — Underwriting net revenues reflected significantly higher net revenues in Equity underwriting (reflecting higher industry-wide activity), partially offset by lower net revenues in Debt Equity underwriting 1,115 30% 195% 3,406 130% underwriting (particularly in asset-backed underwriting) Debt underwriting 526 -8% -12% 2,670 26% — Corporate lending results primarily reflected lower results for relationship lending activities, including the impact of changes in credit spreads on hedges Underwriting 1,641 15% 68% 6,076 69%n 2020 net revenues were significantly higher YoY — Financial advisory net revenues reflected a decrease in industry-wide completed mergers Corporate lending (119) N.M. N.M. 282 -65% and acquisitions transactions, primarily in the middle of the year — Underwriting net revenues reflected significantly higher net revenues in both Equity and 2,613 33% 27% 9,423 24% Net revenues Debt underwriting (reflecting an increase in industry-wide volumes) — Corporate lending net revenues primarily reflected net mark-downs on corporate loans in 12 -93% -84% 1,624 N.M. Provision for credit losses 2020 compared to net gains in 2019 n 2020 provision for credit losses reflected higher impairments related to relationship lending and 1,194 12% -28% 6,134 31% Operating expenses middle-market lending and reserve increases as a result of the impact of the COVID-19 pandemic on the broader economic environment, as compared with 2019 Pre-tax earnings $ 1,407 92% N.M. $ 1,665 -35% n 2020 operating expenses primarily reflected significantly higher net provisions for litigation and regulatory proceedings, as compared with 2019 Net earnings $ 1,078 130% N.M. $ 1,262 -39% — Litigation expense reduced 2020 ROE by 11.5pp 2 n Overall backlog increased significantly both YoY and QoQ, primarily driven by increases in Net earnings to common $ 1,060 135% N.M. $ 1,193 -40% advisory and equity underwriting Average common equity $ 11,472 2% 2% $ 11,313 1% Return on average common equity 37.0% 21.0pp 27.8pp 10.5% -7.4pp 2Investment Banking Financial Results Investment Banking Highlights vs. vs. vs.n 4Q20 net revenues were significantly higher YoY $ in millions 4Q20 3Q20 4Q19 2020 2019 — Financial advisory net revenues reflected an increase in completed mergers and acquisitions transactions Financial advisory $ 1,091 115% 28% $ 3,065 -4% — Underwriting net revenues reflected significantly higher net revenues in Equity underwriting (reflecting higher industry-wide activity), partially offset by lower net revenues in Debt Equity underwriting 1,115 30% 195% 3,406 130% underwriting (particularly in asset-backed underwriting) Debt underwriting 526 -8% -12% 2,670 26% — Corporate lending results primarily reflected lower results for relationship lending activities, including the impact of changes in credit spreads on hedges Underwriting 1,641 15% 68% 6,076 69%n 2020 net revenues were significantly higher YoY — Financial advisory net revenues reflected a decrease in industry-wide completed mergers Corporate lending (119) N.M. N.M. 282 -65% and acquisitions transactions, primarily in the middle of the year — Underwriting net revenues reflected significantly higher net revenues in both Equity and 2,613 33% 27% 9,423 24% Net revenues Debt underwriting (reflecting an increase in industry-wide volumes) — Corporate lending net revenues primarily reflected net mark-downs on corporate loans in 12 -93% -84% 1,624 N.M. Provision for credit losses 2020 compared to net gains in 2019 n 2020 provision for credit losses reflected higher impairments related to relationship lending and 1,194 12% -28% 6,134 31% Operating expenses middle-market lending and reserve increases as a result of the impact of the COVID-19 pandemic on the broader economic environment, as compared with 2019 Pre-tax earnings $ 1,407 92% N.M. $ 1,665 -35% n 2020 operating expenses primarily reflected significantly higher net provisions for litigation and regulatory proceedings, as compared with 2019 Net earnings $ 1,078 130% N.M. $ 1,262 -39% — Litigation expense reduced 2020 ROE by 11.5pp 2 n Overall backlog increased significantly both YoY and QoQ, primarily driven by increases in Net earnings to common $ 1,060 135% N.M. $ 1,193 -40% advisory and equity underwriting Average common equity $ 11,472 2% 2% $ 11,313 1% Return on average common equity 37.0% 21.0pp 27.8pp 10.5% -7.4pp 2

Global Markets Financial Results Global Markets Highlights vs. vs. vs. n 4Q20 net revenues were significantly higher YoY $ in millions 4Q20 3Q20 4Q19 2020 2019 — FICC net revenues reflected higher intermediation net revenues, while financing net revenues were essentially unchanged FICC $ 1,878 -25% 6% $ 11,584 57% — Equities net revenues reflected significantly higher intermediation net revenues, partially 2,387 16% 40% 9,573 30% Equities offset by lower financing net revenues n 2020 net revenues were significantly higher YoY Net revenues 4,265 -6% 23% 21,157 43% — FICC net revenues reflected significantly higher intermediation net revenues and higher financing net revenues Provision for credit losses 38 N.M. 90% 274 N.M. — Equities net revenues reflected significantly higher intermediation net revenues, partially offset by lower financing net revenues 2,238 -12% -26% 12,806 18% Operating expenses n 2020 provision for credit losses reflected loan growth and reserve increases as a result of the Pre-tax earnings $ 1,989 -2% N.M. $ 8,077 107% impact of the COVID-19 pandemic on the broader economic environment, as compared with 2019 Net earnings $ 1,776 -7% N.M. $ 6,122 97% n 2020 operating expenses primarily reflected significantly higher net provisions for litigation and regulatory proceedings, higher compensation and benefits expenses, and higher transaction 3 based expenses , as compared with 2019 $ 1,681 -7% N.M. $ 5,766 111% Net earnings to common — Litigation expense reduced 2020 ROE by 4.0pp Average common equity $ 41,287 3% 8% $ 40,760 2% Return on average common equity 16.3% -1.9pp 13.9pp 14.1% 7.3pp 3Global Markets Financial Results Global Markets Highlights vs. vs. vs. n 4Q20 net revenues were significantly higher YoY $ in millions 4Q20 3Q20 4Q19 2020 2019 — FICC net revenues reflected higher intermediation net revenues, while financing net revenues were essentially unchanged FICC $ 1,878 -25% 6% $ 11,584 57% — Equities net revenues reflected significantly higher intermediation net revenues, partially 2,387 16% 40% 9,573 30% Equities offset by lower financing net revenues n 2020 net revenues were significantly higher YoY Net revenues 4,265 -6% 23% 21,157 43% — FICC net revenues reflected significantly higher intermediation net revenues and higher financing net revenues Provision for credit losses 38 N.M. 90% 274 N.M. — Equities net revenues reflected significantly higher intermediation net revenues, partially offset by lower financing net revenues 2,238 -12% -26% 12,806 18% Operating expenses n 2020 provision for credit losses reflected loan growth and reserve increases as a result of the Pre-tax earnings $ 1,989 -2% N.M. $ 8,077 107% impact of the COVID-19 pandemic on the broader economic environment, as compared with 2019 Net earnings $ 1,776 -7% N.M. $ 6,122 97% n 2020 operating expenses primarily reflected significantly higher net provisions for litigation and regulatory proceedings, higher compensation and benefits expenses, and higher transaction 3 based expenses , as compared with 2019 $ 1,681 -7% N.M. $ 5,766 111% Net earnings to common — Litigation expense reduced 2020 ROE by 4.0pp Average common equity $ 41,287 3% 8% $ 40,760 2% Return on average common equity 16.3% -1.9pp 13.9pp 14.1% 7.3pp 3

Global Markets – FICC & Equities FICC Net Revenues Equities Net Revenues vs. vs. vs. vs. vs. vs. $ in millions $ in millions 4Q20 3Q20 4Q19 2020 2019 4Q20 3Q20 4Q19 2020 2019 $ 1,796 23% 83% $ 6,989 60% FICC intermediation $ 1,498 -31% 8% $ 9,991 66% Equities intermediation Equities financing 591 1% -19% 2,584 -14% FICC financing 380 14% -2% 1,593 16% $ 1,878 -25% 6% $ 11,584 57% Equities $ 2,387 16% 40% $ 9,573 30% FICC FICC Highlights Equities Highlights n 4Q20 net revenues were higher YoY n 4Q20 net revenues were significantly higher YoY — FICC intermediation net revenues reflected significantly higher net revenues in credit — Equities intermediation net revenues reflected significantly higher net revenues in both products and commodities and higher net revenues in currencies, partially offset by derivatives and cash products significantly lower net revenues in interest rate products and lower net revenues in — Equities financing net revenues reflected the negative impact of higher net funding costs mortgages (including the impact of lower yields on the firm’s global core liquid assets) — FICC financing net revenues were essentially unchanged n 4Q20 operating environment was characterized by continued strong client activity and n 4Q20 operating environment was characterized by less favorable market-making conditions favorable market-making conditions, as volatility remained elevated and global equity prices compared to 3Q20, while interest rates remained low and credit spreads tightened during the were generally higher compared to 3Q20 quarter n 2020 net revenues were significantly higher YoY n 2020 net revenues were significantly higher YoY — Equities intermediation net revenues reflected significantly higher net revenues in both — FICC intermediation net revenues reflected significantly higher net revenues across all derivatives and cash products major businesses — Equities financing net revenues primarily reflected the negative impact of higher net funding — FICC financing net revenues reflected higher net revenues from repurchase agreements costs (including the impact of lower yields on the firm’s global core liquid assets) n 2020 operating environment was characterized by significantly higher client activity, increasedn 2020 operating environment was characterized by significantly higher client activity, as volatility volatility and lower interest rates compared to 2019 increased and global equity prices were generally higher compared to 2019 4Global Markets – FICC & Equities FICC Net Revenues Equities Net Revenues vs. vs. vs. vs. vs. vs. $ in millions $ in millions 4Q20 3Q20 4Q19 2020 2019 4Q20 3Q20 4Q19 2020 2019 $ 1,796 23% 83% $ 6,989 60% FICC intermediation $ 1,498 -31% 8% $ 9,991 66% Equities intermediation Equities financing 591 1% -19% 2,584 -14% FICC financing 380 14% -2% 1,593 16% $ 1,878 -25% 6% $ 11,584 57% Equities $ 2,387 16% 40% $ 9,573 30% FICC FICC Highlights Equities Highlights n 4Q20 net revenues were higher YoY n 4Q20 net revenues were significantly higher YoY — FICC intermediation net revenues reflected significantly higher net revenues in credit — Equities intermediation net revenues reflected significantly higher net revenues in both products and commodities and higher net revenues in currencies, partially offset by derivatives and cash products significantly lower net revenues in interest rate products and lower net revenues in — Equities financing net revenues reflected the negative impact of higher net funding costs mortgages (including the impact of lower yields on the firm’s global core liquid assets) — FICC financing net revenues were essentially unchanged n 4Q20 operating environment was characterized by continued strong client activity and n 4Q20 operating environment was characterized by less favorable market-making conditions favorable market-making conditions, as volatility remained elevated and global equity prices compared to 3Q20, while interest rates remained low and credit spreads tightened during the were generally higher compared to 3Q20 quarter n 2020 net revenues were significantly higher YoY n 2020 net revenues were significantly higher YoY — Equities intermediation net revenues reflected significantly higher net revenues in both — FICC intermediation net revenues reflected significantly higher net revenues across all derivatives and cash products major businesses — Equities financing net revenues primarily reflected the negative impact of higher net funding — FICC financing net revenues reflected higher net revenues from repurchase agreements costs (including the impact of lower yields on the firm’s global core liquid assets) n 2020 operating environment was characterized by significantly higher client activity, increasedn 2020 operating environment was characterized by significantly higher client activity, as volatility volatility and lower interest rates compared to 2019 increased and global equity prices were generally higher compared to 2019 4

Asset Management Financial Results Asset Management Highlights vs. vs. vs.n 4Q20 net revenues were higher YoY $ in millions 4Q20 3Q20 4Q19 2020 2019 — Management and other fees (from institutional and third-party distribution asset management clients) reflected the impact of higher average AUS, partially offset by a lower Management and other fees $ 733 1% 10% $ 2,785 7% average effective management fee due to shifts in the mix of client assets and strategies — Equity investments net revenues included: Incentive fees 71 154% 58% 287 121% o Private: 4Q20 ~$1,025 million, significantly lower than 4Q19 ~$1,615 million o Public: 4Q20 ~$745 million, significantly higher than 4Q19 ~$250 million Equity investments 1,770 24% -5% 4,095 -14% — Lending and debt investments net revenues reflected significantly higher net gains (reflecting tighter corporate credit spreads during the quarter) Lending and debt investments 637 8% 49% 817 -44% n 2020 net revenues were lower YoY — Management and other fees (from institutional and third-party distribution asset Net revenues 3,211 16% 7% 7,984 -11% management clients) reflected the impact of higher average AUS, partially offset by a lower average effective management fee due to shifts in the mix of client assets and strategies — Incentive fees were higher, primarily driven by performance Provision for credit losses 22 -69% -82% 442 61% — Equity investments net revenues included: o Private: 2020 ~$2,415 million, significantly lower than 2019 ~$4,290 million Operating expenses 1,254 -8% -3% 5,142 7% o Public: 2020 ~$1,680 million, significantly higher than 2019 ~$475 million — Lending and debt investments net revenues primarily reflected net losses from debt $ 1,935 44% 22% $ 2,400 -38% Pre-tax earnings investments in 2020 compared with net gains in 2019 $ 1,487 73% 15% $ 1,819 -41% Net earnings $ 1,467 75% 16% $ 1,740 -42% Net earnings to common $ 20,944 5% -9% $ 20,491 -5% Average common equity 28.0% 11.2pp 6.0pp 8.5% -5.5pp Return on average common equity 5Asset Management Financial Results Asset Management Highlights vs. vs. vs.n 4Q20 net revenues were higher YoY $ in millions 4Q20 3Q20 4Q19 2020 2019 — Management and other fees (from institutional and third-party distribution asset management clients) reflected the impact of higher average AUS, partially offset by a lower Management and other fees $ 733 1% 10% $ 2,785 7% average effective management fee due to shifts in the mix of client assets and strategies — Equity investments net revenues included: Incentive fees 71 154% 58% 287 121% o Private: 4Q20 ~$1,025 million, significantly lower than 4Q19 ~$1,615 million o Public: 4Q20 ~$745 million, significantly higher than 4Q19 ~$250 million Equity investments 1,770 24% -5% 4,095 -14% — Lending and debt investments net revenues reflected significantly higher net gains (reflecting tighter corporate credit spreads during the quarter) Lending and debt investments 637 8% 49% 817 -44% n 2020 net revenues were lower YoY — Management and other fees (from institutional and third-party distribution asset Net revenues 3,211 16% 7% 7,984 -11% management clients) reflected the impact of higher average AUS, partially offset by a lower average effective management fee due to shifts in the mix of client assets and strategies — Incentive fees were higher, primarily driven by performance Provision for credit losses 22 -69% -82% 442 61% — Equity investments net revenues included: o Private: 2020 ~$2,415 million, significantly lower than 2019 ~$4,290 million Operating expenses 1,254 -8% -3% 5,142 7% o Public: 2020 ~$1,680 million, significantly higher than 2019 ~$475 million — Lending and debt investments net revenues primarily reflected net losses from debt $ 1,935 44% 22% $ 2,400 -38% Pre-tax earnings investments in 2020 compared with net gains in 2019 $ 1,487 73% 15% $ 1,819 -41% Net earnings $ 1,467 75% 16% $ 1,740 -42% Net earnings to common $ 20,944 5% -9% $ 20,491 -5% Average common equity 28.0% 11.2pp 6.0pp 8.5% -5.5pp Return on average common equity 5

Asset Management – Asset Mix 4 4 Equity Investments of $20 billion Lending and Debt Investments of $31 billion $17 Billion Private, $3 Billion Public 5% 12% 7% By Vintage By Region 7% 31% 33% 51% 8% 2017-present Americas By Industry Loan Portfolio $17 billion 34% 31% Loans 2014-2016 Asia 17% 33% 18% $14 billion 2013 or earlier EMEA Debt Investments 25% 88% Real Estate: Mixed Use 5%, Office 3%, Multifamily 3%, Other 6% 5 4 Consolidated Investment Entities of $19 billion 5 Funded with liabilities of ~$11 billion 4% 4% 4% 6% By Vintage By Region By Accounting By Region 7% 7% 27% Classification 35% 82% 63% 12% 46% 9% 2017-present Americas 10% Loans at FV Americas By Industry By Asset Class 17% 15% 41% 21% 2014-2016 Asia Loans at amortized cost Asia 13% 10% 47% 33% 1% 22% 2013 or earlier EMEA Debt investments at FV EMEA 23% 15% 13% 13% 6Asset Management – Asset Mix 4 4 Equity Investments of $20 billion Lending and Debt Investments of $31 billion $17 Billion Private, $3 Billion Public 5% 12% 7% By Vintage By Region 7% 31% 33% 51% 8% 2017-present Americas By Industry Loan Portfolio $17 billion 34% 31% Loans 2014-2016 Asia 17% 33% 18% $14 billion 2013 or earlier EMEA Debt Investments 25% 88% Real Estate: Mixed Use 5%, Office 3%, Multifamily 3%, Other 6% 5 4 Consolidated Investment Entities of $19 billion 5 Funded with liabilities of ~$11 billion 4% 4% 4% 6% By Vintage By Region By Accounting By Region 7% 7% 27% Classification 35% 82% 63% 12% 46% 9% 2017-present Americas 10% Loans at FV Americas By Industry By Asset Class 17% 15% 41% 21% 2014-2016 Asia Loans at amortized cost Asia 13% 10% 47% 33% 1% 22% 2013 or earlier EMEA Debt investments at FV EMEA 23% 15% 13% 13% 6

Consumer & Wealth Management Financial Results Consumer & Wealth Management Highlights vs. vs. vs.n 4Q20 net revenues were higher YoY $ in millions 4Q20 3Q20 4Q19 2020 2019 — Wealth management net revenues were higher Management and other fees $ 1,035 8% 7% $ 3,889 12% o Management and other fees primarily reflected the impact of higher average AUS and higher transaction volumes, partially offset by a lower average effective management fee due to shifts in the mix of client assets and strategies Incentive fees 28 N.M. 47% 114 41% o Private banking and lending net revenues primarily reflected higher net interest income on mortgages Private banking and lending 242 20% 25% 780 -% — Consumer banking net revenues were significantly higher, reflecting higher deposit and credit card loan balances 1,305 12% 11% 4,783 10% Wealth management n 2020 net revenues were higher YoY Consumer banking 347 6% 52% 1,213 40% — Wealth management net revenues were higher o Management and other fees primarily reflected the impact of higher average AUS, Net revenues 1,652 11% 17% 5,996 15% higher transaction volumes and the impact of the full-year consolidation of GS 6 Personal Financial Management , partially offset by a lower average effective Provision for credit losses 221 N.M. 83% 758 79% management fee due to shifts in the mix of client assets and strategies — Consumer banking net revenues were significantly higher, reflecting higher credit card loan 1,221 -1% -7% 4,901 8% Operating expenses and deposit balances n 2020 provision for credit losses reflected growth in credit card loans and the impact of the Pre-tax earnings $ 210 4% N.M. $ 337 43% COVID-19 pandemic on the broader economic environment, as compared with 2019 7 4 n Total client assets exceeded $1 trillion at the end of 2020 Net earnings $ 165 21% N.M. $ 256 36% Net earnings to common $ 154 22% N.M. $ 216 36% $ 8,929 5% 24% $ 8,012 27% Average common equity Return on average common equity 6.9% 1.0pp 8.2pp 2.7% 0.2pp 7Consumer & Wealth Management Financial Results Consumer & Wealth Management Highlights vs. vs. vs.n 4Q20 net revenues were higher YoY $ in millions 4Q20 3Q20 4Q19 2020 2019 — Wealth management net revenues were higher Management and other fees $ 1,035 8% 7% $ 3,889 12% o Management and other fees primarily reflected the impact of higher average AUS and higher transaction volumes, partially offset by a lower average effective management fee due to shifts in the mix of client assets and strategies Incentive fees 28 N.M. 47% 114 41% o Private banking and lending net revenues primarily reflected higher net interest income on mortgages Private banking and lending 242 20% 25% 780 -% — Consumer banking net revenues were significantly higher, reflecting higher deposit and credit card loan balances 1,305 12% 11% 4,783 10% Wealth management n 2020 net revenues were higher YoY Consumer banking 347 6% 52% 1,213 40% — Wealth management net revenues were higher o Management and other fees primarily reflected the impact of higher average AUS, Net revenues 1,652 11% 17% 5,996 15% higher transaction volumes and the impact of the full-year consolidation of GS 6 Personal Financial Management , partially offset by a lower average effective Provision for credit losses 221 N.M. 83% 758 79% management fee due to shifts in the mix of client assets and strategies — Consumer banking net revenues were significantly higher, reflecting higher credit card loan 1,221 -1% -7% 4,901 8% Operating expenses and deposit balances n 2020 provision for credit losses reflected growth in credit card loans and the impact of the Pre-tax earnings $ 210 4% N.M. $ 337 43% COVID-19 pandemic on the broader economic environment, as compared with 2019 7 4 n Total client assets exceeded $1 trillion at the end of 2020 Net earnings $ 165 21% N.M. $ 256 36% Net earnings to common $ 154 22% N.M. $ 216 36% $ 8,929 5% 24% $ 8,012 27% Average common equity Return on average common equity 6.9% 1.0pp 8.2pp 2.7% 0.2pp 7

Firmwide Assets Under Supervision 2,4 2,4 Firmwide Assets Under Supervision Assets Under Supervision Highlights By Segment vs. vs. n Firmwide AUS increased $286 billion in 2020 to a record $2.15 trillion, including Asset $ in billions 4Q20 3Q20 4Q19 3Q20 4Q19 Management AUS increasing $232 billion and Consumer & Wealth Management AUS increasing $54 billion $ 1,530 $ 1,461 $ 1,298 5% 18% Asset Management — Long-term net inflows of $42 billion, driven by fixed income assets Consumer & Wealth Management 615 575 561 7% 10% — Liquidity products net inflows of $121 billion Firmwide AUS $ 2,145 $ 2,036 $ 1,859 5% 15% — Net market appreciation of $123 billion, primarily in fixed income and equity assets By Asset Class vs. vs. $ in billions 4Q20 3Q20 4Q19 3Q20 4Q19 2,4 4Q20 AUS Mix $ 191 $ 182 $ 185 5% 3% Alternative investments Equity 475 421 423 13% 12% 9% 29% Fixed income 896 856 789 5% 14% 36% 22% 42% Long-term AUS 1,562 1,459 1,397 7% 12% Asset Distribution Channel Class 583 577 462 1% 26% Liquidity products Firmwide AUS $ 2,145 $ 2,036 $ 1,859 5% 15% 35% 27% 2,4 Organic Long-Term Net Flows ($ in billions) (Excludes Acquisitions) 8% 12% $42 $42 15% $37 $36 Region $27 Vehicle 33% 55% 77% 8 2016 2017 2018 2019 2020Firmwide Assets Under Supervision 2,4 2,4 Firmwide Assets Under Supervision Assets Under Supervision Highlights By Segment vs. vs. n Firmwide AUS increased $286 billion in 2020 to a record $2.15 trillion, including Asset $ in billions 4Q20 3Q20 4Q19 3Q20 4Q19 Management AUS increasing $232 billion and Consumer & Wealth Management AUS increasing $54 billion $ 1,530 $ 1,461 $ 1,298 5% 18% Asset Management — Long-term net inflows of $42 billion, driven by fixed income assets Consumer & Wealth Management 615 575 561 7% 10% — Liquidity products net inflows of $121 billion Firmwide AUS $ 2,145 $ 2,036 $ 1,859 5% 15% — Net market appreciation of $123 billion, primarily in fixed income and equity assets By Asset Class vs. vs. $ in billions 4Q20 3Q20 4Q19 3Q20 4Q19 2,4 4Q20 AUS Mix $ 191 $ 182 $ 185 5% 3% Alternative investments Equity 475 421 423 13% 12% 9% 29% Fixed income 896 856 789 5% 14% 36% 22% 42% Long-term AUS 1,562 1,459 1,397 7% 12% Asset Distribution Channel Class 583 577 462 1% 26% Liquidity products Firmwide AUS $ 2,145 $ 2,036 $ 1,859 5% 15% 35% 27% 2,4 Organic Long-Term Net Flows ($ in billions) (Excludes Acquisitions) 8% 12% $42 $42 15% $37 $36 Region $27 Vehicle 33% 55% 77% 8 2016 2017 2018 2019 2020

Net Interest Income and Loans 4 Loans Net Interest Income by Segment ($ in millions) Metrics $4,751 $ in billions $4,362 4Q20 3Q20 4Q19 Corporate $ 49 $ 52 $ 46 3.7% $2,016 33 30 28 ALLL to Total Wealth management $1,661 Gross Loans, at $1,410 $1,084 $1,065 Amortized Cost Commercial real estate 20 18 17 $241 $511 6 5 7 Residential real estate 2.7% $444 $508 $618 ALLL to Gross Installment 4 4 5 Wholesale Loans, at Amortized Cost $51 $94 $165 $2,229 $1,670 4 3 2 Credit cards 15.9% $314 $460 $629 Other 4 4 5 ALLL to Gross Consumer Loans, at $520 $142 $265 $65 $69 (4) (4) (1) Allowance for loan losses Amortized Cost 2019 2020 4Q19 3Q20 4Q20 Total Loans $ 116 $ 112 $ 109 Investment Banking Global Markets Asset Management Consumer & Wealth Management Lending Highlights Net Interest Income Highlights n Total loans increased $7 billion, up 6% during 2020, primarily reflecting growth in wealth n 2020 net interest income increased $389 million YoY management, corporate and commercial real estate (primarily in warehouse lending) loans n 4Q20 net interest income increased $345 million YoY n Total allowance was $4.43 billion (including $3.87 billion for funded loans), up $2.63 billion YoY n Both YoY increases in net interest income were driven by an increase in interest-earning — $3.14 billion for wholesale loans, $1.29 billion for consumer loans assets n Provision for credit losses of $3.10 billion in 2020, up from $1.07 billion in 2019 n 2020 net charge-offs of $907 million for a net charge-off rate of 0.9%, up 30bps YoY — Wholesale net charge-off rate of 0.6%, up 40bps YoY — Consumer net charge-off rate of 4.2%, down 200bps YoY 9Net Interest Income and Loans 4 Loans Net Interest Income by Segment ($ in millions) Metrics $4,751 $ in billions $4,362 4Q20 3Q20 4Q19 Corporate $ 49 $ 52 $ 46 3.7% $2,016 33 30 28 ALLL to Total Wealth management $1,661 Gross Loans, at $1,410 $1,084 $1,065 Amortized Cost Commercial real estate 20 18 17 $241 $511 6 5 7 Residential real estate 2.7% $444 $508 $618 ALLL to Gross Installment 4 4 5 Wholesale Loans, at Amortized Cost $51 $94 $165 $2,229 $1,670 4 3 2 Credit cards 15.9% $314 $460 $629 Other 4 4 5 ALLL to Gross Consumer Loans, at $520 $142 $265 $65 $69 (4) (4) (1) Allowance for loan losses Amortized Cost 2019 2020 4Q19 3Q20 4Q20 Total Loans $ 116 $ 112 $ 109 Investment Banking Global Markets Asset Management Consumer & Wealth Management Lending Highlights Net Interest Income Highlights n Total loans increased $7 billion, up 6% during 2020, primarily reflecting growth in wealth n 2020 net interest income increased $389 million YoY management, corporate and commercial real estate (primarily in warehouse lending) loans n 4Q20 net interest income increased $345 million YoY n Total allowance was $4.43 billion (including $3.87 billion for funded loans), up $2.63 billion YoY n Both YoY increases in net interest income were driven by an increase in interest-earning — $3.14 billion for wholesale loans, $1.29 billion for consumer loans assets n Provision for credit losses of $3.10 billion in 2020, up from $1.07 billion in 2019 n 2020 net charge-offs of $907 million for a net charge-off rate of 0.9%, up 30bps YoY — Wholesale net charge-off rate of 0.6%, up 40bps YoY — Consumer net charge-off rate of 4.2%, down 200bps YoY 9

Expenses Expense Highlights Financial Results n 2020 total operating expenses increased YoY vs. vs. vs. 4Q20 3Q20 4Q19 2020 2019 $ in millions — Significantly higher net provisions for litigation and regulatory proceedings — Higher compensation and benefits expenses (reflecting improved financial performance) Compensation and benefits $ 2,479 -20% -19% $ 13,309 8% — Higher transaction based expenses (reflecting an increase in activity levels) 3 Transaction based 1,086 7% 21% 4,141 18% — Higher technology expenses — Higher expenses related to consolidated investments, including impairments (increase was 89 27% -56% 401 -46% Market development primarily in depreciation and amortization and occupancy expenses). — Higher charitable contributions (included in other expenses) 341 -% 11% 1,347 15% Communications and technology — Partially offset by significantly lower travel and entertainment expenses (included in market development expenses) and lower occupancy-related expenses Depreciation and amortization 498 6% 7% 1,902 12% n 2020 effective income tax rate was 24.2%, up from 20.0% for 2019, primarily due to an increase in provisions for non-deductible litigation in 2020 compared to 2019 Occupancy 254 8% -20% 960 -7% 2 Efficiency Ratio Professional fees 350 17% -4% 1,306 -1% 68.1% 65.0% +3.4pp 3 Other expenses 810 22% -52% 5,617 83% +7.6pp Total operating expenses $ 5,907 -5% -19% $ 28,983 16% Provision for taxes $ 1,035 11% 156% $ 3,020 43% Effective Tax Rate 24.2% 4.2pp 2019 2020 Excl. Litigation Impact of Litigation 10Expenses Expense Highlights Financial Results n 2020 total operating expenses increased YoY vs. vs. vs. 4Q20 3Q20 4Q19 2020 2019 $ in millions — Significantly higher net provisions for litigation and regulatory proceedings — Higher compensation and benefits expenses (reflecting improved financial performance) Compensation and benefits $ 2,479 -20% -19% $ 13,309 8% — Higher transaction based expenses (reflecting an increase in activity levels) 3 Transaction based 1,086 7% 21% 4,141 18% — Higher technology expenses — Higher expenses related to consolidated investments, including impairments (increase was 89 27% -56% 401 -46% Market development primarily in depreciation and amortization and occupancy expenses). — Higher charitable contributions (included in other expenses) 341 -% 11% 1,347 15% Communications and technology — Partially offset by significantly lower travel and entertainment expenses (included in market development expenses) and lower occupancy-related expenses Depreciation and amortization 498 6% 7% 1,902 12% n 2020 effective income tax rate was 24.2%, up from 20.0% for 2019, primarily due to an increase in provisions for non-deductible litigation in 2020 compared to 2019 Occupancy 254 8% -20% 960 -7% 2 Efficiency Ratio Professional fees 350 17% -4% 1,306 -1% 68.1% 65.0% +3.4pp 3 Other expenses 810 22% -52% 5,617 83% +7.6pp Total operating expenses $ 5,907 -5% -19% $ 28,983 16% Provision for taxes $ 1,035 11% 156% $ 3,020 43% Effective Tax Rate 24.2% 4.2pp 2019 2020 Excl. Litigation Impact of Litigation 10

Capital and Balance Sheet 2,4 Capital Capital and Balance Sheet Highlights n Standardized CET1 capital ratio increased YoY 4Q20 3Q20 4Q19 $ in billions — Increase in CET1 capital reflected net earnings in excess of dividends Common Equity Tier 1 (CET1) capital $ 81.6 $ 77.5 $ 74.9 — Decrease in Standardized RWAs reflected lower credit RWAs Standardized RWAs $ 554 $ 535 $ 564 n Advanced CET1 capital ratio decreased YoY — Increase in Advanced RWAs reflected higher market volatility and operational RWAs Standardized CET1 capital ratio 14.7% 14.5% 13.3% n Returned $3.72 billion of capital to common shareholders during the year Advanced RWAs $ 610 $ 600 $ 545 — Paid $1.80 billion of capital in common stock dividends 2 — Repurchased 8.2 million shares for a total cost of $1.93 billion in 1Q20 Advanced CET1 capital ratio 13.4% 12.9% 13.7% 2 — The firm did not repurchase any shares during 2Q20-4Q20 , but plans to resume share repurchases in 1Q21 Supplementary leverage ratio 7.0% 6.8% 6.2% n Maintained highly liquid balance sheet and robust liquidity metrics — Deposits increased $70 billion YoY, reflecting strong growth in consumer and transaction banking deposits 4 Selected Balance Sheet Data n BVPS increased 3.2% QoQ and 8.1% YoY, driven by net earnings $ in billions 4Q20 3Q20 4Q19 $ 1,163 $ 1,132 $ 993 Total assets Book Value $ 260 $ 261 $ 190 Deposits In millions, except per share amounts 4Q20 3Q20 4Q19 $ 213 $ 214 $ 207 2 Unsecured long-term borrowings 361.8 Basic shares 358.8 356.0 Shareholders’ equity $ 96 $ 93 $ 90 $ 218.52 Book value per common share $ 236.15 $ 228.78 2 1 Average GCLA $ 298 $ 302 $ 237 Tangible book value per common share $ 222.32 $ 214.84 $ 205.15 11Capital and Balance Sheet 2,4 Capital Capital and Balance Sheet Highlights n Standardized CET1 capital ratio increased YoY 4Q20 3Q20 4Q19 $ in billions — Increase in CET1 capital reflected net earnings in excess of dividends Common Equity Tier 1 (CET1) capital $ 81.6 $ 77.5 $ 74.9 — Decrease in Standardized RWAs reflected lower credit RWAs Standardized RWAs $ 554 $ 535 $ 564 n Advanced CET1 capital ratio decreased YoY — Increase in Advanced RWAs reflected higher market volatility and operational RWAs Standardized CET1 capital ratio 14.7% 14.5% 13.3% n Returned $3.72 billion of capital to common shareholders during the year Advanced RWAs $ 610 $ 600 $ 545 — Paid $1.80 billion of capital in common stock dividends 2 — Repurchased 8.2 million shares for a total cost of $1.93 billion in 1Q20 Advanced CET1 capital ratio 13.4% 12.9% 13.7% 2 — The firm did not repurchase any shares during 2Q20-4Q20 , but plans to resume share repurchases in 1Q21 Supplementary leverage ratio 7.0% 6.8% 6.2% n Maintained highly liquid balance sheet and robust liquidity metrics — Deposits increased $70 billion YoY, reflecting strong growth in consumer and transaction banking deposits 4 Selected Balance Sheet Data n BVPS increased 3.2% QoQ and 8.1% YoY, driven by net earnings $ in billions 4Q20 3Q20 4Q19 $ 1,163 $ 1,132 $ 993 Total assets Book Value $ 260 $ 261 $ 190 Deposits In millions, except per share amounts 4Q20 3Q20 4Q19 $ 213 $ 214 $ 207 2 Unsecured long-term borrowings 361.8 Basic shares 358.8 356.0 Shareholders’ equity $ 96 $ 93 $ 90 $ 218.52 Book value per common share $ 236.15 $ 228.78 2 1 Average GCLA $ 298 $ 302 $ 237 Tangible book value per common share $ 222.32 $ 214.84 $ 205.15 11

Cautionary Note Regarding Forward-Looking Statements This presentation contains “forward-looking statements” within the meaning of the safe harbor provisions of the U.S. Private Securities Litigation Reform Act of 1995. Forward-looking statements are not historical facts or statements of current conditions, but instead represent only the firm’s beliefs regarding future events, many of which, by their nature, are inherently uncertain and outside of the firm’s control. It is possible that the firm’s actual results, financial condition and liquidity may differ, possibly materially, from the anticipated results, financial condition and liquidity in these forward-looking statements. For information about some of the risks and important factors that could affect the firm’s future results, financial condition and liquidity and the forward-looking statements below, see “Risk Factors” in Part II, Item 1A of the firm’s Quarterly Report on Form 10-Q for the period ended September 30, 2020 and in Part I, Item 1A of the firm’s Annual Report on Form 10-K for the year ended December 31, 2019, as well as the cautionary notes on forward-looking statements in the firm’s Quarterly Report on Form 10-Q for the period ended September 30, 2020 and the Strategic Update, dated January 19, 2021. Information regarding the firm’s assets under supervision, capital ratios, risk-weighted assets, supplementary leverage ratio, balance sheet data and global core liquid assets (GCLA) consists of preliminary estimates. These estimates are forward-looking statements and are subject to change, possibly materially, as the firm completes its financial statements. Statements regarding (i) estimated GDP growth, (ii) the impact of the COVID-19 pandemic on the firm’s business, results, financial position and liquidity, (iii) the timing, profitability, benefits and other prospective aspects of business initiatives and the achievability of medium- and long-term targets and goals, (iv) the future state of the firm’s liquidity and regulatory capital ratios, (v) the firm’s prospective capital distributions (including dividends and repurchases), (vi) the firm’s future effective income tax rate, and (vii) the firm’s investment banking transaction backlog are forward-looking statements. Statements regarding estimated GDP growth are subject to the risk that actual GDP growth may differ, possibly materially, due to, among other things, changes in general economic conditions. Statements about the effects of the COVID-19 pandemic on the firm’s business, results, financial position and liquidity are subject to the risk that the actual impact may differ, possibly materially, from what is currently expected. Statements about the timing, profitability, benefits and other prospective aspects of business initiatives and the achievability of medium and long-term targets and goals are based on the firm’s current expectations regarding the firm’s ability to implement these initiatives and achieve these targets and goals and may change, possibly materially, from what is currently expected. Statements about the future state of the firm’s liquidity and regulatory capital ratios, as well as its prospective capital distributions, are subject to the risk that the firm’s actual liquidity, regulatory capital ratios and capital distributions may differ, possibly materially, from what is currently expected. Statements about the firm’s future effective income tax rate are subject to the risk that the firm’s future effective income tax rate may differ from the anticipated rate indicated, possibly materially, due to, among other things, changes in the firm’s earnings mix or profitability, the entities in which the firm generates profits and the assumptions made in forecasting the firm’s expected tax rate, and potential future guidance from the U.S. IRS. Statements about the firm’s investment banking transaction backlog are subject to the risk that transactions may be modified or may not be completed at all and related net revenues may not be realized or may be materially less than expected. Important factors that could have such a result include, for underwriting transactions, a decline or weakness in general economic conditions, an outbreak of hostilities, volatility in the securities markets or an adverse development with respect to the issuer of the securities and, for financial advisory transactions, a decline in the securities markets, an inability to obtain adequate financing, an adverse development with respect to a party to the transaction or a failure to obtain a required regulatory approval. 12Cautionary Note Regarding Forward-Looking Statements This presentation contains “forward-looking statements” within the meaning of the safe harbor provisions of the U.S. Private Securities Litigation Reform Act of 1995. Forward-looking statements are not historical facts or statements of current conditions, but instead represent only the firm’s beliefs regarding future events, many of which, by their nature, are inherently uncertain and outside of the firm’s control. It is possible that the firm’s actual results, financial condition and liquidity may differ, possibly materially, from the anticipated results, financial condition and liquidity in these forward-looking statements. For information about some of the risks and important factors that could affect the firm’s future results, financial condition and liquidity and the forward-looking statements below, see “Risk Factors” in Part II, Item 1A of the firm’s Quarterly Report on Form 10-Q for the period ended September 30, 2020 and in Part I, Item 1A of the firm’s Annual Report on Form 10-K for the year ended December 31, 2019, as well as the cautionary notes on forward-looking statements in the firm’s Quarterly Report on Form 10-Q for the period ended September 30, 2020 and the Strategic Update, dated January 19, 2021. Information regarding the firm’s assets under supervision, capital ratios, risk-weighted assets, supplementary leverage ratio, balance sheet data and global core liquid assets (GCLA) consists of preliminary estimates. These estimates are forward-looking statements and are subject to change, possibly materially, as the firm completes its financial statements. Statements regarding (i) estimated GDP growth, (ii) the impact of the COVID-19 pandemic on the firm’s business, results, financial position and liquidity, (iii) the timing, profitability, benefits and other prospective aspects of business initiatives and the achievability of medium- and long-term targets and goals, (iv) the future state of the firm’s liquidity and regulatory capital ratios, (v) the firm’s prospective capital distributions (including dividends and repurchases), (vi) the firm’s future effective income tax rate, and (vii) the firm’s investment banking transaction backlog are forward-looking statements. Statements regarding estimated GDP growth are subject to the risk that actual GDP growth may differ, possibly materially, due to, among other things, changes in general economic conditions. Statements about the effects of the COVID-19 pandemic on the firm’s business, results, financial position and liquidity are subject to the risk that the actual impact may differ, possibly materially, from what is currently expected. Statements about the timing, profitability, benefits and other prospective aspects of business initiatives and the achievability of medium and long-term targets and goals are based on the firm’s current expectations regarding the firm’s ability to implement these initiatives and achieve these targets and goals and may change, possibly materially, from what is currently expected. Statements about the future state of the firm’s liquidity and regulatory capital ratios, as well as its prospective capital distributions, are subject to the risk that the firm’s actual liquidity, regulatory capital ratios and capital distributions may differ, possibly materially, from what is currently expected. Statements about the firm’s future effective income tax rate are subject to the risk that the firm’s future effective income tax rate may differ from the anticipated rate indicated, possibly materially, due to, among other things, changes in the firm’s earnings mix or profitability, the entities in which the firm generates profits and the assumptions made in forecasting the firm’s expected tax rate, and potential future guidance from the U.S. IRS. Statements about the firm’s investment banking transaction backlog are subject to the risk that transactions may be modified or may not be completed at all and related net revenues may not be realized or may be materially less than expected. Important factors that could have such a result include, for underwriting transactions, a decline or weakness in general economic conditions, an outbreak of hostilities, volatility in the securities markets or an adverse development with respect to the issuer of the securities and, for financial advisory transactions, a decline in the securities markets, an inability to obtain adequate financing, an adverse development with respect to a party to the transaction or a failure to obtain a required regulatory approval. 12
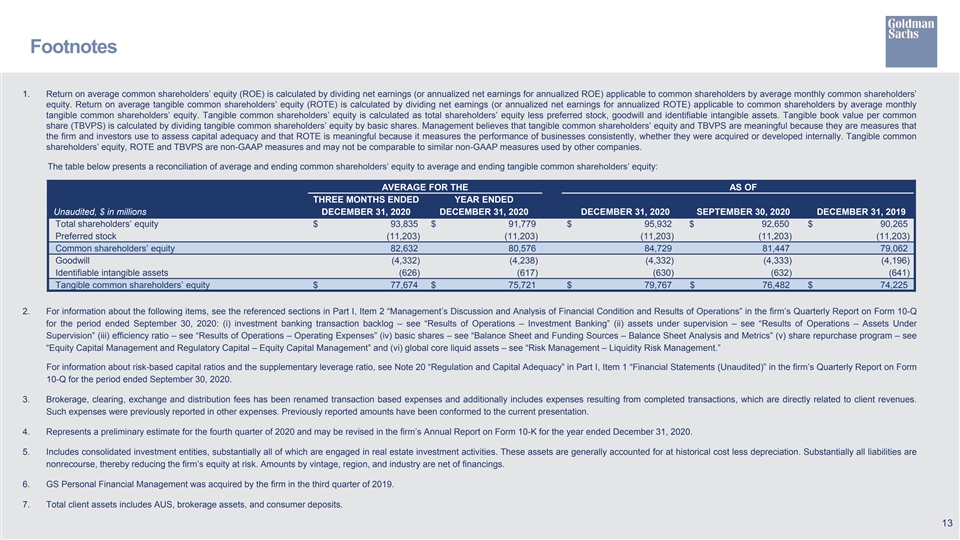
Footnotes 1. Return on average common shareholders’ equity (ROE) is calculated by dividing net earnings (or annualized net earnings for annualized ROE) applicable to common shareholders by average monthly common shareholders’ equity. Return on average tangible common shareholders’ equity (ROTE) is calculated by dividing net earnings (or annualized net earnings for annualized ROTE) applicable to common shareholders by average monthly tangible common shareholders’ equity. Tangible common shareholders’ equity is calculated as total shareholders’ equity less preferred stock, goodwill and identifiable intangible assets. Tangible book value per common share (TBVPS) is calculated by dividing tangible common shareholders’ equity by basic shares. Management believes that tangible common shareholders’ equity and TBVPS are meaningful because they are measures that the firm and investors use to assess capital adequacy and that ROTE is meaningful because it measures the performance of businesses consistently, whether they were acquired or developed internally. Tangible common shareholders’ equity, ROTE and TBVPS are non-GAAP measures and may not be comparable to similar non-GAAP measures used by other companies. The table below presents a reconciliation of average and ending common shareholders’ equity to average and ending tangible common shareholders’ equity: AVERAGE FOR THE AS OF THREE MONTHS ENDED YEAR ENDED Unaudited, $ in millions DECEMBER 31, 2020 DECEMBER 31, 2020 DECEMBER 31, 2020 SEPTEMBER 30, 2020 DECEMBER 31, 2019 Total shareholders’ equity $ 93,835 $ 91,779 $ 95,932 $ 92,650 $ 90,265 Preferred stock (11,203) (11,203) (11,203) (11,203) (11,203) Common shareholders’ equity 82,632 80,576 84,729 81,447 79,062 Goodwill (4,332) (4,238) (4,332) (4,333) (4,196) Identifiable intangible assets (626) (617) (630) (632) (641) Tangible common shareholders’ equity $ 77,674 $ 75,721 $ 79,767 $ 76,482 $ 74,225 2. For information about the following items, see the referenced sections in Part I, Item 2 “Management’s Discussion and Analysis of Financial Condition and Results of Operations” in the firm’s Quarterly Report on Form 10-Q for the period ended September 30, 2020: (i) investment banking transaction backlog – see “Results of Operations – Investment Banking” (ii) assets under supervision – see “Results of Operations – Assets Under Supervision” (iii) efficiency ratio – see “Results of Operations – Operating Expenses” (iv) basic shares – see “Balance Sheet and Funding Sources – Balance Sheet Analysis and Metrics” (v) share repurchase program – see “Equity Capital Management and Regulatory Capital – Equity Capital Management” and (vi) global core liquid assets – see “Risk Management – Liquidity Risk Management.” For information about risk-based capital ratios and the supplementary leverage ratio, see Note 20 “Regulation and Capital Adequacy” in Part I, Item 1 “Financial Statements (Unaudited)” in the firm’s Quarterly Report on Form 10-Q for the period ended September 30, 2020. 3. Brokerage, clearing, exchange and distribution fees has been renamed transaction based expenses and additionally includes expenses resulting from completed transactions, which are directly related to client revenues. Such expenses were previously reported in other expenses. Previously reported amounts have been conformed to the current presentation. 4. Represents a preliminary estimate for the fourth quarter of 2020 and may be revised in the firm’s Annual Report on Form 10-K for the year ended December 31, 2020. 5. Includes consolidated investment entities, substantially all of which are engaged in real estate investment activities. These assets are generally accounted for at historical cost less depreciation. Substantially all liabilities are nonrecourse, thereby reducing the firm’s equity at risk. Amounts by vintage, region, and industry are net of financings. 6. GS Personal Financial Management was acquired by the firm in the third quarter of 2019. 7. Total client assets includes AUS, brokerage assets, and consumer deposits. 13Footnotes 1. Return on average common shareholders’ equity (ROE) is calculated by dividing net earnings (or annualized net earnings for annualized ROE) applicable to common shareholders by average monthly common shareholders’ equity. Return on average tangible common shareholders’ equity (ROTE) is calculated by dividing net earnings (or annualized net earnings for annualized ROTE) applicable to common shareholders by average monthly tangible common shareholders’ equity. Tangible common shareholders’ equity is calculated as total shareholders’ equity less preferred stock, goodwill and identifiable intangible assets. Tangible book value per common share (TBVPS) is calculated by dividing tangible common shareholders’ equity by basic shares. Management believes that tangible common shareholders’ equity and TBVPS are meaningful because they are measures that the firm and investors use to assess capital adequacy and that ROTE is meaningful because it measures the performance of businesses consistently, whether they were acquired or developed internally. Tangible common shareholders’ equity, ROTE and TBVPS are non-GAAP measures and may not be comparable to similar non-GAAP measures used by other companies. The table below presents a reconciliation of average and ending common shareholders’ equity to average and ending tangible common shareholders’ equity: AVERAGE FOR THE AS OF THREE MONTHS ENDED YEAR ENDED Unaudited, $ in millions DECEMBER 31, 2020 DECEMBER 31, 2020 DECEMBER 31, 2020 SEPTEMBER 30, 2020 DECEMBER 31, 2019 Total shareholders’ equity $ 93,835 $ 91,779 $ 95,932 $ 92,650 $ 90,265 Preferred stock (11,203) (11,203) (11,203) (11,203) (11,203) Common shareholders’ equity 82,632 80,576 84,729 81,447 79,062 Goodwill (4,332) (4,238) (4,332) (4,333) (4,196) Identifiable intangible assets (626) (617) (630) (632) (641) Tangible common shareholders’ equity $ 77,674 $ 75,721 $ 79,767 $ 76,482 $ 74,225 2. For information about the following items, see the referenced sections in Part I, Item 2 “Management’s Discussion and Analysis of Financial Condition and Results of Operations” in the firm’s Quarterly Report on Form 10-Q for the period ended September 30, 2020: (i) investment banking transaction backlog – see “Results of Operations – Investment Banking” (ii) assets under supervision – see “Results of Operations – Assets Under Supervision” (iii) efficiency ratio – see “Results of Operations – Operating Expenses” (iv) basic shares – see “Balance Sheet and Funding Sources – Balance Sheet Analysis and Metrics” (v) share repurchase program – see “Equity Capital Management and Regulatory Capital – Equity Capital Management” and (vi) global core liquid assets – see “Risk Management – Liquidity Risk Management.” For information about risk-based capital ratios and the supplementary leverage ratio, see Note 20 “Regulation and Capital Adequacy” in Part I, Item 1 “Financial Statements (Unaudited)” in the firm’s Quarterly Report on Form 10-Q for the period ended September 30, 2020. 3. Brokerage, clearing, exchange and distribution fees has been renamed transaction based expenses and additionally includes expenses resulting from completed transactions, which are directly related to client revenues. Such expenses were previously reported in other expenses. Previously reported amounts have been conformed to the current presentation. 4. Represents a preliminary estimate for the fourth quarter of 2020 and may be revised in the firm’s Annual Report on Form 10-K for the year ended December 31, 2020. 5. Includes consolidated investment entities, substantially all of which are engaged in real estate investment activities. These assets are generally accounted for at historical cost less depreciation. Substantially all liabilities are nonrecourse, thereby reducing the firm’s equity at risk. Amounts by vintage, region, and industry are net of financings. 6. GS Personal Financial Management was acquired by the firm in the third quarter of 2019. 7. Total client assets includes AUS, brokerage assets, and consumer deposits. 13

Exhibit 99.3 Strategic Update January 19, 2021 0 0Exhibit 99.3 Strategic Update January 19, 2021 0 0

2020 Financial Highlights 1 1 Net Revenues EPS ROE ROTE 2020 $44.6bn 2020 $24.74 2020 11.1% 2020 11.8% 4Q $11.7bn 4Q $12.08 4Q 21.1% 4Q 22.5% Highlights Highest FY net revenues since 2009 Record Assets Under Supervision 2 #1 in Announced and Completed M&A Highest Global Markets net revenues since 2010 2 #1 in Equity and equity-related offerings Record 4Q net revenues and strong momentum going into 2021 1 12020 Financial Highlights 1 1 Net Revenues EPS ROE ROTE 2020 $44.6bn 2020 $24.74 2020 11.1% 2020 11.8% 4Q $11.7bn 4Q $12.08 4Q 21.1% 4Q 22.5% Highlights Highest FY net revenues since 2009 Record Assets Under Supervision 2 #1 in Announced and Completed M&A Highest Global Markets net revenues since 2010 2 #1 in Equity and equity-related offerings Record 4Q net revenues and strong momentum going into 2021 1 1

Steady Progress Towards Our Medium-Term Goals 1 Medium-Term Targets 2020 Progress ■ 11.1% ROE (+390bps ex-litigation) >13% ROE Profitability 2 >14% ROTE ■ 11.8% ROTE (+410bps ex-litigation) ■ $70bn raised across channels $100bn in deposit growth Funding Optimization $1.0bn in revenues ■ Limited progress due to rate environment ■ 65.0% efficiency ratio (-760bps ex-litigation) ~60% efficiency ratio Efficiency & Expenses $1.3bn expense plan ■ Achieved approximately half of $1.3bn expense plan ■ Well positioned with CET1 ratio of 14.7% Capital 13-13.5% CET1 ratio ■ Sold or announced $4bn of private equity sales to reduce capital intensity We remain committed to our medium- and long-term targets 2 2Steady Progress Towards Our Medium-Term Goals 1 Medium-Term Targets 2020 Progress ■ 11.1% ROE (+390bps ex-litigation) >13% ROE Profitability 2 >14% ROTE ■ 11.8% ROTE (+410bps ex-litigation) ■ $70bn raised across channels $100bn in deposit growth Funding Optimization $1.0bn in revenues ■ Limited progress due to rate environment ■ 65.0% efficiency ratio (-760bps ex-litigation) ~60% efficiency ratio Efficiency & Expenses $1.3bn expense plan ■ Achieved approximately half of $1.3bn expense plan ■ Well positioned with CET1 ratio of 14.7% Capital 13-13.5% CET1 ratio ■ Sold or announced $4bn of private equity sales to reduce capital intensity We remain committed to our medium- and long-term targets 2 2

Reaffirmed Strategic Direction Grow and Strengthen Diversify our Products Operate More Existing and Services Efficiently Businesses Higher Wallet Share More Higher across Broader Client Set Durable Earnings Margins and Returns 3 3Reaffirmed Strategic Direction Grow and Strengthen Diversify our Products Operate More Existing and Services Efficiently Businesses Higher Wallet Share More Higher across Broader Client Set Durable Earnings Margins and Returns 3 3

Delivering One Goldman Sachs to Our Clients Clients Turn to Goldman Sachs at Times of Disruption Asset Management Quality of People and Advice Thought Leadership Global Investment Markets Banking Digital Client Engagement Consumer & Wealth Management Best in Class Client Experience Reinforcing our purpose to advance sustainable economic growth and financial opportunity 4 4Delivering One Goldman Sachs to Our Clients Clients Turn to Goldman Sachs at Times of Disruption Asset Management Quality of People and Advice Thought Leadership Global Investment Markets Banking Digital Client Engagement Consumer & Wealth Management Best in Class Client Experience Reinforcing our purpose to advance sustainable economic growth and financial opportunity 4 4
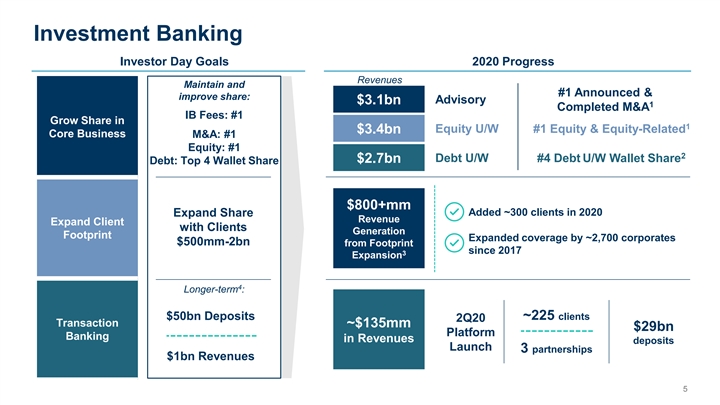
Investment Banking Investor Day Goals 2020 Progress Revenues Maintain and #1 Announced & improve share: $3.1bn Advisory 1 Completed M&A IB Fees: #1 Grow Share in 1 Equity U/W #1 Equity & Equity-Related $3.4bn Core Business M&A: #1 Equity: #1 2 Debt U/W #4 Debt U/W Wallet Share $2.7bn Debt: Top 4 Wallet Share $800+mm Added ~300 clients in 2020 Expand Share Revenue Expand Client with Clients Generation Footprint Expanded coverage by ~2,700 corporates $500mm-2bn from Footprint since 2017 3 Expansion 4 Longer-term : $50bn Deposits ~225 clients 2Q20 Transaction ~$135mm $29bn Platform Banking in Revenues deposits Launch 3 partnerships $1bn Revenues 5 5Investment Banking Investor Day Goals 2020 Progress Revenues Maintain and #1 Announced & improve share: $3.1bn Advisory 1 Completed M&A IB Fees: #1 Grow Share in 1 Equity U/W #1 Equity & Equity-Related $3.4bn Core Business M&A: #1 Equity: #1 2 Debt U/W #4 Debt U/W Wallet Share $2.7bn Debt: Top 4 Wallet Share $800+mm Added ~300 clients in 2020 Expand Share Revenue Expand Client with Clients Generation Footprint Expanded coverage by ~2,700 corporates $500mm-2bn from Footprint since 2017 3 Expansion 4 Longer-term : $50bn Deposits ~225 clients 2Q20 Transaction ~$135mm $29bn Platform Banking in Revenues deposits Launch 3 partnerships $1bn Revenues 5 5

Global Markets Investor Day Goals 2020 Progress 1 Ranked #2 in both FICC and Equities globally Deepen and Take Top 2 Top 3 position with 64 of the top 100 clients Broaden Client 3 Position with Base Top 100 Clients 1 120bps of wallet share gain vs 2019 Increase Client Record Financing Financing Leverage Risk Revenues in FICC Expertise, Deploy Technology Financing and +36% Platforms Technology to Record Prime YE Total Monthly Serve Clients Superior Risk 3 Active Users Balances in Equities Intermediation Medium-term: 14.1% ~$400mm $700mm Expense Optimize Expense efficiencies achieved Opportunity 6.8% Medium-term Resource target of 10% Consumption ~$1.25bn $2bn Capital Capital reallocated to Optimization 2019 ROE 2020 ROE accretive opportunities 6 6Global Markets Investor Day Goals 2020 Progress 1 Ranked #2 in both FICC and Equities globally Deepen and Take Top 2 Top 3 position with 64 of the top 100 clients Broaden Client 3 Position with Base Top 100 Clients 1 120bps of wallet share gain vs 2019 Increase Client Record Financing Financing Leverage Risk Revenues in FICC Expertise, Deploy Technology Financing and +36% Platforms Technology to Record Prime YE Total Monthly Serve Clients Superior Risk 3 Active Users Balances in Equities Intermediation Medium-term: 14.1% ~$400mm $700mm Expense Optimize Expense efficiencies achieved Opportunity 6.8% Medium-term Resource target of 10% Consumption ~$1.25bn $2bn Capital Capital reallocated to Optimization 2019 ROE 2020 ROE accretive opportunities 6 6

Asset Management Investor Day Goals 2020 Progress Longer-term: $2.1tn Firmwide AUS Continued $250bn Net Growth with $286bn Firmwide AUS Growth Traditional Inflows Asset (Fixed Income and Equity) Allocators Long-term fee based inflows of $42bn Additional ~$40bn $100bn Net 2021 Priorities: rd Gross commitments across: Grow 3 Party Alternative Inflows Growth Equity Alternatives ($150bn Gross Fundraising) Corporate Equity Private Credit Infrastructure Real Estate Multi-Asset ESG Longer-term: $4bn Expect $2bn of $4bn Capital Optimize Capital Sold or announced sales of related capital reduction Reduction on-balance sheet positions 7 7Asset Management Investor Day Goals 2020 Progress Longer-term: $2.1tn Firmwide AUS Continued $250bn Net Growth with $286bn Firmwide AUS Growth Traditional Inflows Asset (Fixed Income and Equity) Allocators Long-term fee based inflows of $42bn Additional ~$40bn $100bn Net 2021 Priorities: rd Gross commitments across: Grow 3 Party Alternative Inflows Growth Equity Alternatives ($150bn Gross Fundraising) Corporate Equity Private Credit Infrastructure Real Estate Multi-Asset ESG Longer-term: $4bn Expect $2bn of $4bn Capital Optimize Capital Sold or announced sales of related capital reduction Reduction on-balance sheet positions 7 7

Consumer & Wealth Management Investor Day Goals 2020 Progress 1 Hired >100 client-facing professionals in 2020; solid expansion Increase client-facing despite slowed plans due to COVID professionals Grow Premier 2 Hosted 250+ events , driving engagement with >190K UHNW Business clients and other participants Earn additional Globally wallet share 3 $17bn of AUS inflows with total client assets exceeding $1tn from clients 4 >4K Client referrals ($7bn+ AUS opportunity) Leverage corporate Expand our relationships and +33 Corporates added HNW Platform expand HNW franchise reach Serve ~55% of Fortune 100 Deposits ($bn) Loan/Cards ($bn) $125+ Scale existing $20+ products, launch new Build Leading $97 Digital products, embed $8 $60 $7 $5 $36 Consumer Bank capabilities in partner ecosystems 2018 2019 2020 2024 2018 2019 2020 2024 Target Target 8 8Consumer & Wealth Management Investor Day Goals 2020 Progress 1 Hired >100 client-facing professionals in 2020; solid expansion Increase client-facing despite slowed plans due to COVID professionals Grow Premier 2 Hosted 250+ events , driving engagement with >190K UHNW Business clients and other participants Earn additional Globally wallet share 3 $17bn of AUS inflows with total client assets exceeding $1tn from clients 4 >4K Client referrals ($7bn+ AUS opportunity) Leverage corporate Expand our relationships and +33 Corporates added HNW Platform expand HNW franchise reach Serve ~55% of Fortune 100 Deposits ($bn) Loan/Cards ($bn) $125+ Scale existing $20+ products, launch new Build Leading $97 Digital products, embed $8 $60 $7 $5 $36 Consumer Bank capabilities in partner ecosystems 2018 2019 2020 2024 2018 2019 2020 2024 Target Target 8 8

Consumer | Build Leading Digital Consumer Bank Integrated & Self-Reinforcing Strategy New Products & Partnerships 1 1 Invest Spend Go-to-market strategies Marcus Large Direct Partnerships State-of-the-art Product / Platform Spend Borrow Save / Invest Borrow Checking Credit Invest Loans Savings (2021) Cards (2021) 9 9Consumer | Build Leading Digital Consumer Bank Integrated & Self-Reinforcing Strategy New Products & Partnerships 1 1 Invest Spend Go-to-market strategies Marcus Large Direct Partnerships State-of-the-art Product / Platform Spend Borrow Save / Invest Borrow Checking Credit Invest Loans Savings (2021) Cards (2021) 9 9

Funding Optimization Further diversify funding mix via deposits 1 $1.0+ billion Enhance asset-liability management 2 in revenue uplift over medium term Optimize liquidity pool 3 1 Deposits Remain on target for 30bps funding improvement ~50% $70bn deposit growth Wholesale across channels Unsecured Liability Liability in 2020 ~50% Acceleration of MixMix Liability liability mix-shift Mix Liability Material shift 2 % of Firm Assets in Bank Entities in rate Liabil Pric ityin g environment Pricing Liability Pricing ~15% ~25% Investor Day Current as of 4Q17 as of 4Q20 Projection Projection 10 10Funding Optimization Further diversify funding mix via deposits 1 $1.0+ billion Enhance asset-liability management 2 in revenue uplift over medium term Optimize liquidity pool 3 1 Deposits Remain on target for 30bps funding improvement ~50% $70bn deposit growth Wholesale across channels Unsecured Liability Liability in 2020 ~50% Acceleration of MixMix Liability liability mix-shift Mix Liability Material shift 2 % of Firm Assets in Bank Entities in rate Liabil Pric ityin g environment Pricing Liability Pricing ~15% ~25% Investor Day Current as of 4Q17 as of 4Q20 Projection Projection 10 10

Focused On Expense Efficiencies On track to generate $1.3bn in run-rate expense savings over the medium term Investment in Centralized Expense Streamlined Automation and Real Estate Strategy Organization Management Infrastructure n Disciplined approach to n Extracting benefit from n Footprint consolidation in n Uplifting integrated organizational design front-to-back London and Bengaluru planning capabilities reengineering programs n Enhanced focus on spans n Expanded presence in n Extracting benefit from and layersn Increased straight- strategic locations procure-to-pay solution through-processing n Reduced cost per trade Achieved approximately half of our medium-term plan in 2020 11 11Focused On Expense Efficiencies On track to generate $1.3bn in run-rate expense savings over the medium term Investment in Centralized Expense Streamlined Automation and Real Estate Strategy Organization Management Infrastructure n Disciplined approach to n Extracting benefit from n Footprint consolidation in n Uplifting integrated organizational design front-to-back London and Bengaluru planning capabilities reengineering programs n Enhanced focus on spans n Expanded presence in n Extracting benefit from and layersn Increased straight- strategic locations procure-to-pay solution through-processing n Reduced cost per trade Achieved approximately half of our medium-term plan in 2020 11 11

Dynamic Capital Management CET1 Ratio Target Capital Management Philosophy Key Forward Drivers 1 13.0-13.5% § Stress Capital Buffer Achievement of capital efficiencies from Prudent capital management in Stress planned sales of on-balance sheet context of evolving regulatory Capital Buffer investments; ongoing engagement with FRB landscape on stress loss modeling 5.0-5.5% Prioritize deploying capital to support § G-SIB G-SIB client activity and grow our Expected surcharge of 3.0% effective Jan 1 businesses 3.0% 2023 as we continue to deploy balance sheet to support client financing activity Return excess capital in the Minimum § Management Buffer form of dividends and buybacks 4.5% Estimated buffer of 50-100bps to anticipate client opportunities and potential volatility 12 12Dynamic Capital Management CET1 Ratio Target Capital Management Philosophy Key Forward Drivers 1 13.0-13.5% § Stress Capital Buffer Achievement of capital efficiencies from Prudent capital management in Stress planned sales of on-balance sheet context of evolving regulatory Capital Buffer investments; ongoing engagement with FRB landscape on stress loss modeling 5.0-5.5% Prioritize deploying capital to support § G-SIB G-SIB client activity and grow our Expected surcharge of 3.0% effective Jan 1 businesses 3.0% 2023 as we continue to deploy balance sheet to support client financing activity Return excess capital in the Minimum § Management Buffer form of dividends and buybacks 4.5% Estimated buffer of 50-100bps to anticipate client opportunities and potential volatility 12 12

Clear Strategic Direction Diversify our Products Operate More Grow and Strengthen Existing Businesses and Services Efficiently Expand our global footprint: Increase organizational and Investment Banking, Global Markets, Build Transaction Banking process efficiency Ultra High Net Worth Remix to lower cost Increase financing activities Grow third party Alternatives deposit funding Scale digital Consumer Banking, Grow asset management Optimize capital footprint High Net Worth and Mass Affluent Higher Wallet Share More Durable Higher Margins across Broader Client Set Earnings and Returns 13 13Clear Strategic Direction Diversify our Products Operate More Grow and Strengthen Existing Businesses and Services Efficiently Expand our global footprint: Increase organizational and Investment Banking, Global Markets, Build Transaction Banking process efficiency Ultra High Net Worth Remix to lower cost Increase financing activities Grow third party Alternatives deposit funding Scale digital Consumer Banking, Grow asset management Optimize capital footprint High Net Worth and Mass Affluent Higher Wallet Share More Durable Higher Margins across Broader Client Set Earnings and Returns 13 13

Strategic Update January 19, 2021 14 14Strategic Update January 19, 2021 14 14

End Notes These notes refer to the financial metrics and/or defined term presented on: Slide 1: 1. Return on average common shareholders’ equity (ROE) is calculated by dividing net earnings applicable to common shareholders by average monthly common shareholders’ equity. Return on average tangible common shareholders’ equity (ROTE) is calculated by dividing net earnings applicable to common shareholders by average monthly tangible common shareholders’ equity. Tangible common shareholders’ equity is calculated as total shareholders’ equity less preferred stock, goodwill and identifiable intangible assets. Management believes that ROTE is meaningful because it measures the performance of businesses consistently, whether they were acquired or developed internally and that tangible common shareholders’ equity is meaningful because it is a measure that the firm and investors use to assess capital adequacy. ROTE and tangible common shareholders’ equity are non-GAAP measures and may not be comparable to similar non-GAAP measures used by other companies. The table below presents a reconciliation of average common shareholders’ equity to average tangible common shareholders’ equity: AVERAGE FOR THE YEAR ENDED Unaudited, $ in millions DECEMBER 31, 2020 Total shareholders’ equity $ 91,779 Preferred stock (11,203) Common shareholders’ equity 80,576 Goodwill and identifiable intangible assets (4,855) Tangible common shareholders’ equity $ 75,721 2. Source: Dealogic – January 1, 2020 through December 31, 2020 Slide 2: 1. Medium-term refers to 3 year time horizon from December 31, 2019 2. ROTE is a non-GAAP measure and may not be comparable to similar non-GAAP measures used by other companies. See end note 1 for slide 1 for further information about ROTE, including the reconciliation of average common shareholders’ equity to average tangible common shareholders’ equity. 15 15End Notes These notes refer to the financial metrics and/or defined term presented on: Slide 1: 1. Return on average common shareholders’ equity (ROE) is calculated by dividing net earnings applicable to common shareholders by average monthly common shareholders’ equity. Return on average tangible common shareholders’ equity (ROTE) is calculated by dividing net earnings applicable to common shareholders by average monthly tangible common shareholders’ equity. Tangible common shareholders’ equity is calculated as total shareholders’ equity less preferred stock, goodwill and identifiable intangible assets. Management believes that ROTE is meaningful because it measures the performance of businesses consistently, whether they were acquired or developed internally and that tangible common shareholders’ equity is meaningful because it is a measure that the firm and investors use to assess capital adequacy. ROTE and tangible common shareholders’ equity are non-GAAP measures and may not be comparable to similar non-GAAP measures used by other companies. The table below presents a reconciliation of average common shareholders’ equity to average tangible common shareholders’ equity: AVERAGE FOR THE YEAR ENDED Unaudited, $ in millions DECEMBER 31, 2020 Total shareholders’ equity $ 91,779 Preferred stock (11,203) Common shareholders’ equity 80,576 Goodwill and identifiable intangible assets (4,855) Tangible common shareholders’ equity $ 75,721 2. Source: Dealogic – January 1, 2020 through December 31, 2020 Slide 2: 1. Medium-term refers to 3 year time horizon from December 31, 2019 2. ROTE is a non-GAAP measure and may not be comparable to similar non-GAAP measures used by other companies. See end note 1 for slide 1 for further information about ROTE, including the reconciliation of average common shareholders’ equity to average tangible common shareholders’ equity. 15 15

End Notes These notes refer to the financial metrics and/or defined term presented on: Slide 5: 1. Source: Dealogic – January 1, 2020 through December 31, 2020 2. Debt U/W wallet share as measured by reported revenues, per peer filings as of September 30, 2020. Peers include JPM, BAC, C, MS, CS, DBS and BARC 3. Americas and EMEA advisory, underwriting and derivatives net revenues from footprint expansion clients accrued in 2020 4. Longer-term refers to 5 year time horizon from December 31, 2019 Slide 6: 1. Source: McKinsey institutional client analytics for 3Q20 YTD. Analysis excludes captive wallets 2. Sources: Client Ranking / Scorecard / Feedback and / or McKinsey revenue ranking (data as of 1H20 or 3Q20 as applicable) 3. Unique users within the prior 30 days, as of December 15, 2020 vs. December 15, 2019. The use of these dates represents recent usage before the seasonal slowdown at year end Slide 8: 1. Includes Advisors, Content Specialists and Client Service Specialists 2. Includes global cross-divisional events and webinars to which PWM clients had access 3. Total client assets includes AUS, brokerage assets, and consumer deposits 4. Represents bi-lateral referrals between Private Wealth Management and Personal Financial Management (PFM) and eligible Corporate employees referred to PFM Slide 9: Note: Marcus by Goldman Sachs® is a brand of Goldman Sachs Bank USA and Goldman Sachs & Co. LLC. All loans and deposit products are provided by Goldman Sachs Bank USA. Member FDIC. Brokerage and investment advisory services offered by Marcus by Goldman Sachs are provided by Goldman Sachs & Co. LLC. Member SIPC. 1. Certain functionality displayed is not currently available but may not be available in the future. Visuals are for illustrative purposes only Slide 10: 1. As of December 31, 2020 2. Excludes assets related to other GS affiliates Slide 12: 1. Targets may change as regulatory landscape and firm business mix evolve 16 16End Notes These notes refer to the financial metrics and/or defined term presented on: Slide 5: 1. Source: Dealogic – January 1, 2020 through December 31, 2020 2. Debt U/W wallet share as measured by reported revenues, per peer filings as of September 30, 2020. Peers include JPM, BAC, C, MS, CS, DBS and BARC 3. Americas and EMEA advisory, underwriting and derivatives net revenues from footprint expansion clients accrued in 2020 4. Longer-term refers to 5 year time horizon from December 31, 2019 Slide 6: 1. Source: McKinsey institutional client analytics for 3Q20 YTD. Analysis excludes captive wallets 2. Sources: Client Ranking / Scorecard / Feedback and / or McKinsey revenue ranking (data as of 1H20 or 3Q20 as applicable) 3. Unique users within the prior 30 days, as of December 15, 2020 vs. December 15, 2019. The use of these dates represents recent usage before the seasonal slowdown at year end Slide 8: 1. Includes Advisors, Content Specialists and Client Service Specialists 2. Includes global cross-divisional events and webinars to which PWM clients had access 3. Total client assets includes AUS, brokerage assets, and consumer deposits 4. Represents bi-lateral referrals between Private Wealth Management and Personal Financial Management (PFM) and eligible Corporate employees referred to PFM Slide 9: Note: Marcus by Goldman Sachs® is a brand of Goldman Sachs Bank USA and Goldman Sachs & Co. LLC. All loans and deposit products are provided by Goldman Sachs Bank USA. Member FDIC. Brokerage and investment advisory services offered by Marcus by Goldman Sachs are provided by Goldman Sachs & Co. LLC. Member SIPC. 1. Certain functionality displayed is not currently available but may not be available in the future. Visuals are for illustrative purposes only Slide 10: 1. As of December 31, 2020 2. Excludes assets related to other GS affiliates Slide 12: 1. Targets may change as regulatory landscape and firm business mix evolve 16 16

Cautionary Note on Forward-Looking Statements Statements about the firm’s target metrics, including its target ROE, ROTE, efficiency ratio and CET1 capital ratios, and how they can be achieved (including resumption of share repurchases), and statements about future operating expense (including future litigation expense), efficiency ratio reductions and expense savings initiatives, the impact of the COVID-19 pandemic on its business, results, financial position and liquidity, amount and composition of future Assets under Supervision, planned debt issuances, growth of deposits and other funding, asset liability management and funding strategies and associated interest expense savings, future geographic location of its employees, and the timing and profitability of its business initiatives, including its launch of new businesses or new activities, its ability to increase its market share in incumbent businesses and its ability to achieve more durable revenues and higher returns from these initiatives, are forward- looking statements, and it is possible that the firm’s actual results may differ, possibly materially, from the targeted results indicated in these statements. Forward looking statements, including those about the firm’s target ROE, ROTE, efficiency ratio, and expense savings, and how they can be achieved, are based on the firm’s current expectations regarding its business prospects and are subject to the risk that the firm may be unable to achieve its targets due to, among other things, changes in the firm’s business mix, lower profitability of new business initiatives, increases in technology and other costs to launch and bring new business initiatives to scale, and increases in liquidity requirements. Statements about the firm’s target ROE, ROTE and CET1 capital ratios, and how they can be achieved, are based on the firm’s current expectations regarding the capital requirements applicable to the firm and are subject to the risk that the firm’s actual capital requirements may be higher than currently anticipated because of, among other factors, changes in the regulatory capital requirements applicable to the firm resulting from changes in regulations or the interpretation or application of existing regulations or changes in the nature and composition of the firm’s activities or its expectations around the sale of assets. Statements about the projected growth of the firm’s deposits and other funding, asset liability management and funding strategies and associated interest expense savings are subject to the risk that actual growth and savings may differ, possibly materially from that currently anticipated due to, among other things, changes in interest rates and competition from similar products. Statements about the timing, profitability, benefits and other prospective aspects of business and expense savings initiatives, the achievability of medium and long-term targets, the level and composition of more durable revenues and increases in market share are based on the firm’s current expectations regarding its ability to implement these initiatives and achieve these targets and goals and may change, possibly materially, from what is currently expected. Statements about the effects of the COVID-19 pandemic on the firm’s business, results, financial position and liquidity are subject to the risk that the actual impact may differ, possibly materially, from what is currently expected. Due to the inherent uncertainty in these forward-looking statements, investors should not place undue reliance on the firm’s ability to achieve these results. For information about some of the risks and important factors that could affect the firm’s future results, financial condition and liquidity and the forward-looking statements above, see “Risk Factors” in Part II, Item 1A of the firm’s Quarterly Report on Form 10-Q for the period ended September 30, 2020 and in Part I, Item 1A of the firm’s Annual Report on Form 10-K for the year ended December 31, 2019. You should also read the cautionary notes on forward-looking statements in the firm’s Quarterly Report on Form 10-Q for the period ended September 30, 2020 and Earnings Results Presentation for the Full Year and Fourth Quarter 2020. The statements in the presentation are current only as of January 19, 2021 and the firm does not undertake to update forward-looking statements to reflect the impact of subsequent events or circumstances. 17 17Cautionary Note on Forward-Looking Statements Statements about the firm’s target metrics, including its target ROE, ROTE, efficiency ratio and CET1 capital ratios, and how they can be achieved (including resumption of share repurchases), and statements about future operating expense (including future litigation expense), efficiency ratio reductions and expense savings initiatives, the impact of the COVID-19 pandemic on its business, results, financial position and liquidity, amount and composition of future Assets under Supervision, planned debt issuances, growth of deposits and other funding, asset liability management and funding strategies and associated interest expense savings, future geographic location of its employees, and the timing and profitability of its business initiatives, including its launch of new businesses or new activities, its ability to increase its market share in incumbent businesses and its ability to achieve more durable revenues and higher returns from these initiatives, are forward- looking statements, and it is possible that the firm’s actual results may differ, possibly materially, from the targeted results indicated in these statements. Forward looking statements, including those about the firm’s target ROE, ROTE, efficiency ratio, and expense savings, and how they can be achieved, are based on the firm’s current expectations regarding its business prospects and are subject to the risk that the firm may be unable to achieve its targets due to, among other things, changes in the firm’s business mix, lower profitability of new business initiatives, increases in technology and other costs to launch and bring new business initiatives to scale, and increases in liquidity requirements. Statements about the firm’s target ROE, ROTE and CET1 capital ratios, and how they can be achieved, are based on the firm’s current expectations regarding the capital requirements applicable to the firm and are subject to the risk that the firm’s actual capital requirements may be higher than currently anticipated because of, among other factors, changes in the regulatory capital requirements applicable to the firm resulting from changes in regulations or the interpretation or application of existing regulations or changes in the nature and composition of the firm’s activities or its expectations around the sale of assets. Statements about the projected growth of the firm’s deposits and other funding, asset liability management and funding strategies and associated interest expense savings are subject to the risk that actual growth and savings may differ, possibly materially from that currently anticipated due to, among other things, changes in interest rates and competition from similar products. Statements about the timing, profitability, benefits and other prospective aspects of business and expense savings initiatives, the achievability of medium and long-term targets, the level and composition of more durable revenues and increases in market share are based on the firm’s current expectations regarding its ability to implement these initiatives and achieve these targets and goals and may change, possibly materially, from what is currently expected. Statements about the effects of the COVID-19 pandemic on the firm’s business, results, financial position and liquidity are subject to the risk that the actual impact may differ, possibly materially, from what is currently expected. Due to the inherent uncertainty in these forward-looking statements, investors should not place undue reliance on the firm’s ability to achieve these results. For information about some of the risks and important factors that could affect the firm’s future results, financial condition and liquidity and the forward-looking statements above, see “Risk Factors” in Part II, Item 1A of the firm’s Quarterly Report on Form 10-Q for the period ended September 30, 2020 and in Part I, Item 1A of the firm’s Annual Report on Form 10-K for the year ended December 31, 2019. You should also read the cautionary notes on forward-looking statements in the firm’s Quarterly Report on Form 10-Q for the period ended September 30, 2020 and Earnings Results Presentation for the Full Year and Fourth Quarter 2020. The statements in the presentation are current only as of January 19, 2021 and the firm does not undertake to update forward-looking statements to reflect the impact of subsequent events or circumstances. 17 17