
Form 424B2 GOLDMAN SACHS GROUP INC
Filed Pursuant to Rule 424(b)(2)
Registration Statement No. 333-239610
BlackRock® Dynamic Factor Index Supplement No. 10 to the Prospectus and the Prospectus Supplement, each as may be amended from time to time, that form a part of Registration Statement No. 333-239610
|
|
GS Finance Corp. Medium-Term Notes, Series E Medium-Term Notes, Series F guaranteed by The Goldman Sachs Group, Inc. BlackRock® Dynamic Factor Index Supplement No. 10 Notes Linked to the Performance of the BlackRock® Dynamic Factor Index |

GS Finance Corp. may from time to time offer and sell notes, the payments and performance of which will be linked to the BlackRock® Dynamic Factor Index (the “index”). The index measures the extent to which the performance of the combination of an equity ETF basket composed of up to five equity ETFs, a fixed income ETF basket composed of up to three fixed income ETFs and a cash constituent (together with the ETFs, the underlying assets) outperforms the sum of the return on 3-month USD LIBOR plus an additional 0.65% per annum fee (accruing daily). The weights of the ETFs within the equity ETF basket are determined based on three common economic measures (factors) – “economic regime”, “value” and “momentum”, while the weights of the ETFs within the fixed income ETF basket are determined based on how medium-term interest rates are trending. The relative weights of the equity ETF basket, the fixed income ETF basket and the cash constituent that compose the index are determined based on measures of volatility using the past returns of the ETFs (i.e., the degree of variation in past returns given the various weightings of these components). The equity ETF basket rebalances monthly and the fixed income ETF basket rebalances on each index business day. Allocations of the index among the equity ETF basket, the fixed income ETF basket and the cash constituent are determined on each index business day with a goal of limiting volatility (i.e., the degree of variation in the past returns) to no more than 5%.
As a result of such allocations, the index may include limited exposure to the ETFs and may allocate a significant portion of its exposure to the cash constituent, the return on which will be less than the sum of the return on 3-month USD LIBOR plus 0.65% per annum. In recent months, a very significant portion (up to 85.5%) of the index has been allocated to the cash constituent. The greater the percentage of the index allocated to the cash constituent, the higher the return that will be required on the ETFs in order to have a return on your investment.
Because the index measures the performance of the selected underlying assets less the sum of the return on 3-month USD LIBOR plus 0.65% per annum (accruing daily), on any day such underlying assets must outperform the return on 3-month USD LIBOR plus 0.65% per annum for the index level to increase.
The accompanying prospectus and the accompanying prospectus supplement, each as may be amended from time to time, that form a part of Registration Statement No. 333-239610, describes some of the terms that may apply generally to the notes, including any notes you purchase. A separate pricing supplement, which we refer to as the applicable pricing supplement and, if specified in the applicable pricing supplement, a separate product supplement, which we refer to as the applicable product supplement, will describe additional terms that apply to your notes.
This index supplement contains the following:
|
● |
A summary overview of the index. You should read this summary overview in conjunction with (i) the more detailed description of index to be set forth in the applicable pricing supplement and (ii) the descriptions of the index’s underlying assets (including the ETFs) set forth herein. |
|
• |
Certain risks applicable to the index’s ETFs. You should read these risks in conjunction with the risks and considerations described in the applicable pricing supplement (including risks and considerations relating to the index itself, the particular notes being offered thereby and certain other matters), the applicable product supplement, if any, the accompanying prospectus supplement and the accompanying prospectus. |
|
• |
A description of the index’s underlying assets. |
Your investment in the notes involves certain risks. See “Additional Risk Factors Specific to the Notes” beginning on page S-9 to read about investment risks relating to the notes.
Neither the Securities and Exchange Commission nor any other regulatory body has approved or disapproved of these securities or passed upon the accuracy or adequacy of this index supplement no. 10, the applicable pricing supplement, the applicable product supplement, if any, the accompanying prospectus supplement or the accompanying prospectus. Any representation to the contrary is a criminal offense.
The notes are not bank deposits and are not insured by the Federal Deposit Insurance Corporation or any other governmental agency, nor are they obligations of, or guaranteed by, a bank.
GS Finance Corp. may use this index supplement in the initial sale of the notes. In addition, Goldman Sachs & Co. LLC (GS&Co.), or any other affiliate of GS Finance Corp., may use this index supplement in a market-making transaction in a note after its initial sale. Unless GS Finance Corp. or its agent informs the purchaser otherwise in the confirmation of sale, this index supplement is being used in a market-making transaction.
|
|
Goldman Sachs & Co. LLC BlackRock® Dynamic Factor Index Supplement No. 10 dated November 24, 2020. |
The Notes Are Part of a Series
The notes are part of a series of debt securities that we may issue under our indenture from time to time. The notes are “indexed debt securities”, as defined in the accompanying prospectus. The applicable pricing supplement will specify whether the series is entitled “Medium-Term Notes, Series E” or “Medium-Term Notes, Series F.” The notes will be fully and unconditionally guaranteed by The Goldman Sachs Group, Inc. We describe terms that apply generally to all medium-term notes of the applicable series in “Description of Notes We May Offer” and “Description of Debt Securities We May Offer” in the accompanying prospectus supplement for the applicable series of medium-term notes and the accompanying prospectus, respectively. The applicable pricing supplement will describe any additions or changes to the terms of the notes being offered thereby.
Please note that the information about the settlement or trade dates, issue price, underwriting discounts or commissions and net proceeds to us in the applicable pricing supplement relates only to the initial issuances and sales of your notes. If you have purchased your notes in a market-making transaction after any initial issuance and sale, any such relevant information about the sale to you will be provided in a separate confirmation of sale.
Specific Terms Will Be Described in the Applicable Pricing Supplement and the Applicable Product Supplement, If Any
The specific terms of your notes will be described in the applicable pricing supplement and the applicable product supplement, if any, accompanying this index supplement. The terms described therein are in addition to those described herein and in the accompanying prospectus and the accompanying prospectus supplement.
S-2
|
Please note that this section constitutes only a brief overview of the index. The index will be described in more detail in the applicable pricing supplement. You should not invest in the notes without also reading the applicable pricing supplement in full, including the sections entitled “The Index” and “Additional Risk Factors Specific to Your Notes” (including risks and considerations relating to the index, the particular notes being offered thereby and certain other matters). Neither this section, the section entitled “Additional Risks Factors Specific to the ETFs” nor any other information in this index supplement is intended to be a substitute for the information relating to the index, including the risk factors relating to the index, set forth in the applicable pricing supplement. |
The BlackRock® Dynamic Factor Index (the index) measures the extent to which the performance of the combination of an equity ETF basket composed of five equity ETFs, a fixed income ETF basket composed of three fixed income ETFs and a cash constituent (together with the ETFs, the underlying assets) outperforms the sum of the return on a notional interest rate (3-month USD LIBOR) plus 0.65% per annum (accruing daily). The weights of the ETFs within the equity ETF basket are determined based on three common economic measures (factors) — “economic regime”, “value” and “momentum”, while the weights of the ETFs and within the fixed income ETF basket are determined based on how medium-term interest rates are trending. The relative weights of the equity ETF basket, the fixed income ETF basket and the cash constituent that compose the index are determined based on measures of volatility using the past returns of the ETFs (i.e., the degree of variation in past returns given the various weightings of these components).
The following is a summary of the index components:
|
• |
An equity ETF basket with components that are weighted to provide exposure to three common economic measures (factors) — “economic regime”, “value” (which is composed of a “cash flow from operations to price” signal and a “forward earnings yield” signal) and “momentum”. For purposes of calculating the index, a signal is a measurement of a specified economic measure that is used to determine the components of the equity and fixed income ETF baskets. Each month, the allocation to the five equity ETFs in the equity ETF basket is rebalanced based primarily on the characteristics of each equity ETF as measured by each of the three common factors and the volatility of the returns of each equity ETF. The five equity ETFs are as follows: |
|
|
o |
iShares® MSCI USA Momentum Factor ETF (MTUM); |
|
|
o |
iShares® MSCI USA Size Factor ETF (SIZE); |
|
|
o |
iShares® MSCI USA Quality Factor ETF (QUAL); |
|
|
o |
iShares® MSCI USA Value Factor ETF (VLUE); and |
|
|
o |
iShares® MSCI USA Min Vol Factor ETF (USMV). |
|
• |
A fixed income ETF basket with components that are weighted based on a rates momentum signal which measures how medium-term interest rates are trending. On each index index business day, the allocation to the fixed income ETFs in the fixed income ETF basket is rebalanced, with 50% allocated to the iShares® 7-10 Year Treasury Bond ETF and the remaining 50% allocated to one of the other fixed income ETFs (other than during periods when a transition is being effected between the iShares® 1-3 Year Treasury Bond ETF and the iShares® 20+ Year Treasury Bond ETF). The three fixed income ETFs are as follows: |
|
|
o |
iShares® 1-3 Year Treasury Bond ETF (SHY); |
|
|
o |
iShares® 7-10 Year Treasury Bond ETF (IEF); and |
|
|
o |
iShares® 20+ Year Treasury Bond ETF (TLT). |
|
• |
A cash constituent that reflects the notional returns accruing to a hypothetical investor from an investment in a notional money market account that accrues interest at 3-month USD LIBOR, calculated in accordance with the Act/360 day count convention (i.e., using the actual number of days in the relevant accrual period divided by 360). |
Allocations of the index among the equity ETF basket, the fixed income ETF basket and the cash constituent are determined on each index business day according to the following volatility control procedures:
|
• |
First, to the extent that the volatility (i.e., the degree of variation in the past returns) of the equity ETF basket exceeds the target volatility of 5%, the fixed income ETF basket is assigned a positive weight, and the weight of the equity ETF basket is reduced by the amount needed to achieve the 5% volatility target. For purposes of calculating volatility in this portion of the volatility control procedures, the volatility contribution of the fixed income ETF basket is not taken into account. |
|
• |
Second, to the extent that the historically realized volatility of a weighted four asset portfolio consisting of the equity ETF basket and the three fixed income ETFs exceeds the 5% volatility target, the index will make an allocation to the cash constituent, and the weights of the equity ETF basket and fixed income ETFs will be ratably reduced. |
How the volatilities used to make allocations of the index among its components are calculated, including over what time periods historical data is employed and the method of calculation, is described in greater detail below.
S-3
|
• |
an “underlying asset” is one of the ETFs or the cash constituent that is eligible for inclusion in the index on an index business day; |
|
• |
an “ETF” is one of the ETFs that is eligible for inclusion in the index on an index business day; and |
|
• |
an “index business day” is a day on which the New York Stock Exchange is open for regular trading. |
BlackRock Index Services, LLC (“Index Services” or the “index administrator”), a subsidiary of BlackRock, Inc., designs, sponsors, calculates, administers and publishes the index.
S-4
As of November 12, 2020, the following chart sets forth the weighting of each underlying asset and the hypothetical and historical average percentage weightings of the underlying assets, the highest percentage weightings of the underlying assets and the percentage of index business days with positive weightings for the underlying assets from January 1, 2015 to November 12, 2020. The chart uses historical information from October 31, 2019 (the index launch date) to November 12, 2020 and hypothetical data from January 1, 2015 to October 31, 2019. The hypothetical data is based on the historical levels of the underlying assets and uses the same methodology that is used to calculate the index. As a result, the following chart does not reflect the global financial crisis which began in 2008, which had a materially negative impact on certain of the underlying assets. You should not take the historical information or hypothetical data as an indication of the future performance of the index.
|
Underlying Asset |
Weighting (as of November 12, 2020)* |
Average Weighting (as of November 12, 2020)* |
Highest Weighting (as of November 12, 2020)* |
Percentage of Index Business Days When Underlying Asset is Included in the Index (as of November 12, 2020)* |
|
iShares® MSCI USA Momentum Factor ETF |
5.14% |
9.3% |
41.1% |
94.8% |
|
iShares® MSCI USA Quality Factor ETF |
0.00% |
9.6% |
33.1% |
76.3% |
|
iShares® MSCI USA Size Factor ETF |
4.36% |
8.5% |
46.4% |
91.3% |
|
iShares® MSCI USA Min Vol Factor ETF |
1.06% |
5.2% |
24.7% |
83.1% |
|
iShares® MSCI USA Value Factor ETF |
2.05% |
4.8% |
26.3% |
62.3% |
|
iShares® 1-3 Year Treasury Bond ETF |
0.00% |
5.2% |
38.7% |
22.7% |
|
iShares® 7-10 Year Treasury Bond ETF |
19.68% |
23.0% |
40.0% |
100.0% |
|
iShares® 20+ Year Treasury Bond ETF |
19.68% |
17.7% |
40.0% |
79.2% |
|
Cash Constituent |
48.03% |
16.6% |
85.5% |
81.2% |
*Current weighting information is updated from time to time by the index administrator at blackrock.com/us/individual/products/309029/blackrock-dynamic-factor-index. We are not incorporating by reference the website or any material it includes in this index supplement.
S-5
Index Allocations Among Asset Classes
The following chart sets forth the daily allocation on each index business day among each asset class (equity, fixed income and cash constituent) from January 1, 2015 to November 12, 2020, using the historical index information and hypothetical index data described above. (In the chart, this historical information can be found to the right of the vertical solid line marker.) You should not take the historical information or hypothetical data as an indication of the future performance of the index.

S-6
Allocation of Equity ETF Basket
The following chart sets forth the daily allocation on each index business day within the equity ETF basket among the equity ETFs from January 1, 2015 to November 12, 2020, using the historical index information and hypothetical index data described above. (In the chart, historical information can be found to the right of the vertical solid line marker.) You should not take the historical information or hypothetical data as an indication of the future performance of the index.

S-7
Allocation of Fixed Income ETF Basket
The following chart sets forth the daily allocation on each index business day within the fixed income ETF basket among the fixed income ETFs from January 1, 2015 to November 12, 2020, using the historical index information and hypothetical index data described above. (In the chart, historical information can be found to the right of the vertical solid line marker.) You should not take the historical information or hypothetical data as an indication of the future performance of the index.

S-8
Additional Risk Factors Specific to the ETFs
|
The following risks relate only to the ETFs underlying the index. For risks and considerations relating to the index itself and certain other matters, see the applicable pricing supplement. You should carefully review all of the risks and considerations herein and in the applicable pricing supplement, the applicable product supplement, if any, the accompanying prospectus supplement and the accompanying prospectus. An investment in your notes is subject to the risks described below as well as the risks and considerations described in the applicable pricing supplement, the applicable product supplement, if any, the accompanying prospectus supplement and the accompanying prospectus. Your notes are a riskier investment than ordinary debt securities. Also, your notes are not equivalent to investing directly in any underlying asset or the assets held by any ETF or in notes that bear interest at the notional interest rate. You should carefully consider whether the offered notes are appropriate given your particular circumstances. |
Risks related to all of the ETFs
The ETFs Are Passively Managed to Track an Index and May Not Perform as Well as an Actively Managed Fund or Another Investment
The ETFs are not actively managed and may be affected by a general decline in the assets tracked by their underlying indices. Each passively managed ETF invests in assets included in, or representative of, the underlying index. These ETFs’ investment advisors do not attempt to take defensive positions under any market conditions, including during declining markets. This means, among other things, that the investment advisor typically will not sell a particular holding just because it is performing poorly. Instead, the ETF seeks to track the index regardless of whether the index level is increasing or decreasing. As a result, shares of the passively managed ETFs may not perform as well as an investment in actively managed ETFs or a basket comprised solely of actively managed ETFs or some other investment that seeks to outperform a benchmark or market.
There is No Affiliation Between Us and Any Issuer of Assets Held by Any ETF or Any Sponsor of Any ETF
GS&Co. and one or more of our other affiliates may act, from time to time, as authorized participants in the distribution of shares of ETFs, and, at any time, may hold shares of ETFs. We are not affiliated with the issuers of the assets held by the ETFs, the underlying index sponsors or the ETF sponsors or investment advisors. However, our affiliates may currently or from time to time in the future own securities of, or engage in business with, the ETFs, their sponsors, their investment advisors, the sponsors of the underlying indexes or the issuers of assets held by the ETFs. Nevertheless, neither we nor any of our affiliates has verified the accuracy or the completeness of any information about the ETFs, the investment advisors or the issuers of assets held by the ETFs, and we have consulted only publicly available sources of information about them. You, as an investor in the notes, should make your own investigation into the ETFs, the investment advisors and the issuers of the assets held by the ETFs. See “The Underlying Assets” below for additional information about the ETFs.
None of the ETF sponsors, the sponsors of the underlying indexes, the ETFs’ investment advisors and the issuers of assets held by the ETFs are involved in the offering of your notes in any way and none of them have any obligation of any sort with respect to your notes. Thus, none of the ETF sponsors, the sponsors of the underlying indexes, the ETFs’ investment advisors and the issuers of assets held by the ETFs have any obligation to take your interests into consideration for any reason, including in taking any corporate actions that might adversely affect the level of an index or making any investment decision for the ETFs.
The Policies of the ETF Sponsors and/or Investment Advisor, and the Policies of Any Sponsor of an Underlying Index Tracked by an ETF, Could Affect the Level of the Index
Any ETF sponsor or investment advisor may from time to time be called upon to make certain decisions or judgments with respect to the implementation of the strategy of the ETF’s investment advisor concerning additions, deletions or substitutions of securities or assets held by the ETF, the manner in which changes affecting the underlying index, if any, are reflected in the ETF, the means of executing trading on behalf of an ETF, and the best means of tracking an underlying index, if any. The ETF sponsor’s or investment advisor’s decisions or judgments could affect the market price of the shares of the ETF and may adversely affect the level of the index.
In addition, the sponsor of an underlying index tracked by an ETF is responsible for the design and maintenance of such underlying index. The policies of the sponsor of such underlying index concerning the calculation of the underlying index, including decisions regarding the addition, deletion or substitution of the assets included in the underlying index, could affect the level of the underlying index and, consequently, could affect the market price of shares of the ETF and could adversely affect the level of the index, the amount payable on your notes and the market value of your notes.
S-9
There is No Assurance That an Active Trading Market Will Continue for the ETFs or That There Will Be Liquidity in Any Such Trading Market; Further, Each ETF is Subject to Management Risks, Securities Risks, Lending Risks and Custody Risks
Although all of the shares of the ETFs are listed for trading on Cboe BZX Exchange, Inc. (Cboe BZX), NYSE Arca, Inc. (NYSE Arca) or the NASDAQ Stock Market (NASDAQ) and a number of similar products have been traded on the Cboe BZX, NYSE Arca, NASDAQ or other securities exchanges for varying periods of time, there is no assurance that an active trading market will continue for the ETFs or that there will be liquidity in any such trading market.
In addition, each ETF is subject to management risk, which is the risk that an ETF’s investment advisor’s investment strategy, the implementation of which is subject to a number of constraints, may not produce the intended results. In addition, each investment advisor is permitted to engage in securities lending with respect to a portion of the applicable ETF’s total assets, which could subject such ETF to the risk that the borrower of such loaned securities fails to return the securities in a timely manner or at all.
Further, each ETF is subject to custody risk, which refers to the risks in the process of clearing and settling trades and the holding of securities by local banks, agents and depositories. Low trading volumes and volatile prices in less developed markets make trades harder to complete and settle, and governments or trade groups may compel local agents to hold securities in designated depositories that are not subject to independent evaluation. The less developed a country’s securities market is, the greater the likelihood of custody problems.
Further, each ETF is subject to listing standards adopted by Cboe BZX, NYSE Arca or NASDAQ, as applicable. There can be no assurance that an ETF will continue to meet the applicable listing requirements, or that an ETF will not be delisted.
The ETFs May Be Subject to Pricing Dislocations and Other Market Forces, Which May Adversely Affect the Level of the Index
Even if the net asset value of an ETF’s assets is increasing, the market price of its shares may not. Shares of an ETF may trade in the secondary market at times when the ETF does not accept orders to purchase or redeem shares. At such times, shares may trade in the secondary market with more significant premiums or discounts than might be experienced at times when the ETF accepts purchase and redemption orders. Further, from time to time, an authorized participant, a third party investor, an ETF advisor, an affiliate of an ETF advisor or a fund may invest in an ETF and hold its investment for a specific period of time in order to facilitate commencement of an ETF’s operations or for the ETF to achieve size or scale, which could negatively impact such ETF. In addition, shares of each ETF trade at prices at, above or below the most recent net asset value of the ETF’s assets. The trading prices of an ETF’s shares fluctuate continuously throughout trading hours based on market supply and demand rather than the net asset value. The trading prices of the ETF’s shares may deviate significantly from the ETF’s net asset value during periods of market volatility, and disruptions due to creations and redemptions of the ETF’s shares by authorized participants (or disruptions due to the lack of authorized participants able to create or redeem the ETF’s shares) or the existence of extreme market volatility may result in trading prices for shares of the ETF that differ significantly from its net asset value. If any of these dislocations were to occur, the level of the index, the amount payable on your notes and the market value of your notes may be adversely affected.
The Values of the ETFs May Not Completely Track the Level of the Indices Underlying Such ETFs
Although the trading characteristics and valuations of the shares of an ETF will usually mirror to some extent the characteristics and valuations of the underlying index, the value of the shares of an ETF may not completely track the level of the underlying index. One of the common reasons this occurs is that an index is a theoretical financial calculation of the performance of certain assets, but an ETF holds an actual investment portfolio. The value of a share of the ETF may reflect transaction costs and fees incurred or imposed by the investment advisor of the ETF as well as the costs to the ETF to buy and sell its assets. These costs and fees are not included in the calculation of the underlying index. Additionally, because an ETF may not actually hold all of the assets that comprise the underlying index, and may invest in securities that are not part of the underlying index, the ETF may not closely track the performance of the underlying index. Some additional reasons for these tracking differences are described under “The Underlying Assets” below. As a result of these tracking differences, the index may not perform as well as an investment linked directly to the underlying indices of the ETFs.
The ETFs May Be Subject to Global or Regional Financial Risks, Which May Adversely Affect the Level of the Index
Many of the ETFs invest wholly or substantially in regionally-focused debt or equity securities. If a financial crisis occurs in a region, or if there is another global financial crisis such as the one experienced beginning in 2007/2008, any number (if not all) of the ETFs may be severely affected, which may adversely affect the level of the index.
S-10
Risks related to ETFs concentrated in the Information Technology sector
Certain ETFs Are Concentrated in the Information Technology Sector and Do Not Provide Diversified Exposure
Certain ETFs hold assets that are concentrated in the Information Technology sector, which means the ETFs are more likely to be more adversely affected by any negative performance of the Information Technology sector than ETFs that have more diversified holdings across a number of sectors. Market or economic factors impacting technology companies and companies that rely heavily on technological advances could have a major effect on the value of the ETFs’ investments. The value of stocks of technology companies and companies that rely heavily on technology are particularly vulnerable to rapid changes in technology product cycles, rapid product obsolescence, government regulation and competition, both domestically and internationally, including competition from foreign competitors with lower production costs. Stocks of technology companies and companies that rely heavily on technology, especially those of smaller, less-seasoned companies, tend to be more volatile than the overall market. Technology companies are heavily dependent on patent and intellectual property rights, the loss or impairment of which may adversely affect profitability. Additionally, companies in the Information Technology sector may face dramatic and often unpredictable changes in growth rates and competition for the services of qualified personnel.
Risks related to the iShares® MSCI USA Momentum Factor ETF
Momentum Securities Risk
The iShares® MSCI USA Momentum Factor ETF tracks an underlying index that is designed to measure the performance of an equity momentum strategy by emphasizing stocks with high price momentum. Stocks that have previously exhibited high momentum characteristics may not experience positive momentum in the future or may experience more volatility than the market as a whole. The underlying index sponsor may be unsuccessful in creating an underlying index that emphasizes momentum securities. In addition, there may be periods when the momentum style of investing is out of favor and the investment performance of the iShares® MSCI USA Momentum Factor ETF may suffer.
The iShares® MSCI USA Momentum Factor ETF Recently Changed the Index it Tracks
The iShares® MSCI USA Momentum Factor ETF will generally invest in the securities included in the index it tracks, but may invest in cash, cash equivalents and other securities not included in the index. Previously, the iShares® MSCI USA Momentum Factor ETF tracked the MSCI USA Momentum Index, but, beginning on November 23, 2020, the iShares® MSCI USA Momentum Factor ETF began tracking the MSCI USA Momentum SR Variant Index. Any historical information about the performance of the iShares® MSCI USA Momentum Factor ETF for any period before November 23, 2020 was during a period in which the iShares® MSCI USA Momentum Factor ETF tracked a different index, and therefore should not be considered information relevant to how the iShares® MSCI USA Momentum Factor ETF will perform as it tracks the MSCI USA Momentum SR Variant Index.
The performance of the MSCI USA Momentum SR Variant Index may deviate from the performance of the MSCI USA Momentum Index as a result of its different rebalancing mechanics. Such divergence in performance may occur during any period that includes a rebalancing (whether scheduled or ad-hoc), and may be particularly acute during periods characterized by more frequent ad-hoc rebalancing or market volatility.
The Index Which the iShares® MSCI USA Momentum Factor ETF Tracks Is a New Index Without a Historical Track Record
The MSCI USA Momentum SR Variant Index was launched on May 19, 2020. The index sponsor of the MSCI USA Momentum SR Variant Index has published hypothetical historical information regarding the historical performance of the MSCI USA Momentum SR Variant Index prior to May 19, 2020. Because the MSCI USA Momentum SR Variant Index was not published during those periods, these levels should not be relied upon when making your investment decision.
Risks related to the iShares® MSCI USA Quality Factor ETF
Quality Stocks Risk
The iShares® MSCI USA Quality Factor ETF tracks an underlying index that is designed to measure historical and expected high returns on equity, stable earnings growth and low debt-to-asset ratio. However, there is no guarantee that the past performance of these stocks will continue. The underlying index sponsor may be unsuccessful in creating an underlying index that reflects the quality of individual stocks. Companies that issue these stocks may not be able to sustain consistently high returns on equity, earnings and growth year after year and may need to borrow money or issue debt despite their prior history. Earnings, growth and other measures of a stock’s quality can be adversely affected by market, regulatory, political, environmental and other factors. The price of a stock also may be affected by factors other than those factors considered by the underlying index sponsor. The degree to which these factors affect a stock’s
S-11
performance can be difficult to predict.
Risks related to the iShares® MSCI USA Size Factor ETF
Low Size Risk
The iShares® MSCI USA Size Factor ETF tracks an underlying index that is designed to select equity securities based on certain investment style factors, including low size. Low size companies are those that are on the smaller end of the market capitalization range of securities in the MSCI USA Index. Low size is not a capitalization range similar to large, mid- and small capitalization companies, but rather a factor score determined by a security’s relative position within the market capitalization range of the MSCI USA Index.
Low size companies may be more volatile than those of larger companies, and therefore, the iShares® MSCI USA Size Factor ETF’s share price may be more volatile than those of funds that invest a larger percentage of their assets in stocks issued by larger capitalization companies. Stock prices of low size companies are more vulnerable to adverse business and economic developments. Securities of low size companies may be thinly traded, making it difficult for the iShares® MSCI USA Size Factor ETF to buy and sell them. In addition, low size companies may be less financially stable than larger, more established companies and may depend on a small number of essential personnel, making these companies more vulnerable to experiencing adverse effects due to the loss of personnel. Low size companies also may have less diverse product lines than those of larger capitalization companies and are more susceptible to adverse developments concerning their products.
Risks related to the iShares® MSCI USA Min Vol Factor ETF
Volatility Risk
The value of the securities in the iShares® MSCI USA Min Vol Factor ETF’s portfolio may fluctuate, sometimes rapidly and unpredictably. The value of a security may fluctuate due to factors affecting markets generally or particular industries. This volatility may affect the iShares® MSCI USA Min Vol Factor ETF’s net asset value. Although the underlying index was created by the underlying index sponsor to seek lower volatility than the MSCI USA Index, and the iShares® MSCI USA Min Vol Factor ETF’s name reflects the name of the underlying index as provided by the underlying index sponsor, there is no guarantee that the underlying index sponsor will be successful in creating an underlying index that minimizes volatility, and there is a risk that the iShares® MSCI USA Min Vol Factor ETF may experience more than minimum volatility. Securities in the iShares® MSCI USA Min Vol Factor ETF’s portfolio may be subject to price volatility, and their prices may not be any less volatile than the market as a whole, and could be more volatile. Events or financial circumstances affecting individual securities or sectors may increase the volatility of the iShares® MSCI USA Min Vol Factor ETF.
Risks related to the iShares® MSCI USA Value Factor ETF
Value Risk
The iShares® MSCI USA Value Factor ETF tracks an underlying index that is designed to measure the performance of securities in the MSCI USA Index that, in the aggregate, have value characteristics and relatively lower valuations relative to the large- and mid-cap U.S. equity market. Value securities are those issued by companies that may be perceived as undervalued. Value securities may fail to appreciate for long periods of time and may never realize their full potential value. The underlying index sponsor may be unsuccessful in creating an underlying index that emphasizes undervalued securities. Value securities have generally performed better than non-value securities during periods of economic recovery (although there is no assurance that they will continue to do so). Value securities may go in and out of favor over time.
Risks related to ETFs holding U.S. government debt securities
Your Investment is Subject to Concentration Risks
Certain of the ETFs invest in U.S. Treasury bonds that are all obligations of the United States, including the iShares® 1-3 Year Treasury Bond ETF, the iShares® 7-10 Year Treasury Bond ETF and the iShares® 20+ Year Treasury Bond ETF. In addition, the iShares® 20+ Year Treasury Bond ETF invests in securities with a similar remaining time to maturity. As a result, these ETFs are concentrated in the performance of bonds issued by a single issuer and having the same general tenor and terms. Although your investment in the notes will not result in the ownership or other direct interest in the U.S. Treasury bonds held by any ETF, the return on your investment in the notes will be subject to certain risks similar to those associated with direct investment in a U.S. Treasury bonds. This increases the risk that any downgrade of the credit ratings of the U.S. government from its current ratings, any increase in risk that the U.S. Treasury may default on its obligations by the market (whether for credit or legislative process reasons) or any other market events that create a
S-12
decrease in demand for U.S. Treasury bonds would significantly adversely affect such ETFs and may adversely affect the level of the index. In addition, to the extent that any such decrease in demand is more concentrated in particular U.S. Treasury bond maturities, the ETFs that are concentrated in those maturities could be severely affected, which may adversely affect the level of the index.
ETFs Holding U.S. Government Bonds May Change in Unexpected Ways
The indexes to which ETFs holding U.S. Treasury bonds tend to be linked tend to have very limited public disclosure about the underlying indexes. The index sponsors of these indexes retain discretion to make changes to the indexes at any time. The lack of detailed information about the indexes and how their constituents may change in the future creates the risk that the indexes could change in the future to perform much differently from the way they would perform if such changes were not made. If the indexes are changed in unexpected ways, the ETFs holding such bonds would similarly change to better reflect the indexes. The performance of the ETFs holding such bonds could be adversely affected in that case, which could adversely affect your investment in the notes.
Risks related to ETFs holding debt securities
Your Investment is Subject to Income Risk and Interest Rate Risk
The income of ETFs that invest in debt securities, or “bonds,” may decline when interest rates fall. This decline can occur because the ETF must invest in lower-yielding bonds as bonds in its portfolio fall outside the time to maturity limits required by the ETF’s investment objective or are called, bonds in the underlying index are substituted or the ETF otherwise needs to purchase additional bonds. In addition, an increase in interest rates may cause the value of the fixed rate bonds held by an ETF to decrease, may lead to heightened volatility in the fixed income markets and may adversely affect the liquidity of certain fixed income bonds. Securities with longer durations tend to be more sensitive to interest rate changes, usually making them more volatile than securities with shorter durations. If any of these events occur, the shares of the ETFs invested in bonds and the level of the index could be adversely affected.
Risks related to the iShares® 1-3 Year Treasury Bond ETF
The iShares® 1-3 Year Treasury Bond ETF Previously Changed the Index it Tracks
The iShares® 1-3 Year Treasury Bond ETF will generally invest in the securities included in the index it tracks, but may invest in cash, cash equivalents and other securities not included in the index. Previously, the iShares® 1-3 Year Treasury Bond ETF tracked the Barclays U.S. 1-3 Year Treasury Bond Index, but, beginning on April 1, 2016, the iShares® 1-3 Year Treasury Bond ETF began tracking the ICE U.S. Treasury 1-3 Year Bond Index. Any historical performance of the iShares® 1-3 Year Treasury Bond ETF for any period before April 1, 2016 was during a period in which the iShares® 1-3 Year Treasury Bond ETF tracked a different index, and therefore should not be considered information relevant to how the iShares® 1-3 Year Treasury Bond ETF will perform as it tracks the ICE U.S. Treasury 1-3 Year Bond Index.
The Index Which the iShares® 1-3 Year Treasury Bond ETF Tracks Is a Relatively New Index With a Limited Historical Track Record
The ICE U.S. Treasury 1-3 Year Bond Index was launched on December 31, 2015. The index sponsor of the ICE U.S. Treasury 1-3 Year Bond Index has published hypothetical historical information regarding the historical performance of ICE U.S. Treasury 1-3 Year Bond Index prior to December 31, 2015. Because the ICE U.S. Treasury 1-3 Year Bond Index was not published during those periods, these levels should not be relied upon when making your investment decision.
Risks related to the iShares® 7-10 Year Treasury Bond ETF
The iShares® 7-10 Year Treasury Bond ETF Previously Changed the Index it Tracks
The iShares® 7-10 Year Treasury Bond ETF will generally invest in the securities included in the index it tracks, but may invest in cash, cash equivalents and other securities not included in the index. Previously, the iShares® 7-10 Year Treasury Bond ETF tracked the Barclays U.S. 7-10 Year Treasury Bond Index, but, beginning on April 1, 2016, the iShares® 7-10 Year Treasury Bond ETF began tracking the ICE U.S. Treasury 7-10 Year Bond Index. Any historical performance of the iShares® 7-10 Year Treasury Bond ETF for any period before April 1, 2016 was during a period in which the iShares® 7-10 Year Treasury Bond ETF tracked a different index, and therefore should not be considered information relevant to how the iShares® 7-10 Year Treasury Bond ETF will perform as it tracks the ICE U.S. Treasury 7-10 Year Bond Index.
The Index Which the iShares® 7-10 Year Treasury Bond ETF Tracks Is a Relatively New Index With a Limited Historical Track Record
The ICE U.S. Treasury 7-10 Year Bond Index was launched on December 31, 2015. The index sponsor of the ICE U.S. Treasury 7-10 Year Bond Index has published hypothetical historical information regarding the historical performance of
S-13
ICE U.S. Treasury 7-10 Year Bond Index prior to December 31, 2015. Because the ICE U.S. Treasury 7-10 Year Bond Index was not published during those periods, these levels should not be relied upon when making your investment decision.
Risks related to the iShares® 20+ Year Treasury Bond ETF
The iShares® 20+ Year Treasury Bond ETF Previously Changed the Index it Tracks
The iShares® 20+ Year Treasury Bond ETF will generally invest in the securities included in the index it tracks, but may invest in cash, cash equivalents and other securities not included in the index. Previously, the iShares® 20+ Year Treasury Bond ETF tracked the Barclays U.S. 20+ Year Treasury Bond Index, but, beginning on April 1, 2016, the iShares® 20+ Year Treasury Bond ETF began tracking the ICE U.S. Treasury 20+ Year Bond Index. Any historical information about the performance of the iShares® 20+ Year Treasury Bond ETF for any period before April 1, 2016 was during a period in which the iShares® 20+ Year Treasury Bond ETF tracked a different index, and therefore should not be considered information relevant to how the iShares® 20+ Year Treasury Bond ETF will perform as it tracks the ICE U.S. Treasury 20+ Year Bond Index.
The Index Which the iShares® 20+ Year Treasury Bond ETF Tracks Is a Relatively New Index With a Limited Historical Track Record
The ICE U.S. Treasury 20+ Year Bond Index was launched on December 31, 2015. The index sponsor of the ICE U.S. Treasury 20+ Year Bond Index has published hypothetical historical information regarding the historical performance of ICE U.S. Treasury 20+ Year Bond Index prior to December 31, 2015. Because the ICE U.S. Treasury 20+ Year Bond Index was not published during those periods, these levels should not be relied upon when making your investment decision.
S-14
THE UNDERLYING ASSETS
The defined terms provided in the description of each underlying asset apply only in the description in which they are used. Unless otherwise indicated, these definitions are not intended to be used in other sections of this index supplement.
The underlying asset descriptions below are provided in the following order:
|
ASSET CLASS |
ASSET CLASS MINIMUM WEIGHT |
ASSET CLASS MAXIMUM |
UNDERLYING |
TICKER |
|
Equities |
0% |
100% |
iShares® MSCI USA Momentum Factor ETF |
MTUM |
|
iShares® MSCI USA Size Factor ETF |
SIZE |
|||
|
iShares® MSCI USA Quality Factor ETF |
QUAL |
|||
|
iShares® MSCI USA Value Factor ETF |
VLUE |
|||
|
iShares® MSCI USA Min Vol Factor ETF |
USMV |
|||
|
Fixed Income |
0% |
100% |
iShares® 1-3 Year Treasury Bond ETF |
SHY |
|
iShares® 7-10 Year Treasury Bond ETF |
IEF |
|||
|
iShares® 20+ Year Treasury Bond ETF |
TLT |
|||
|
Cash Constituent |
0% |
100% |
Notional Interest Rate (3-month USD LIBOR) |
N/A |
Some Common Concepts
Each description of an ETF provides information about the particular structure (type of entity) of that ETF. Each of the ETFs files information with the SEC. Information provided to or filed with the SEC can be inspected and copied at the public reference facilities maintained by the SEC or through the SEC’s website at sec.gov. The descriptions below will provide the “CIK number” for each of the ETFs, which is an identifying number that will assist you in finding information about the ETFs filed with the SEC.
Each of the ETFs also has certain concepts in common with most or all of the other ETFs. We have described some of these common concepts below.
Investment Objective
The investment objective of most ETFs is to achieve investment results that correspond generally to the price and yield performance, before fees and expenses, of a particular index. That type of ETF, sometimes called a “tracking ETF,” uses a passive or indexing approach to try to achieve the ETF’s investment objective. The investment advisor to the ETF does not try to beat the index; the ETF tracks and does not seek temporary defensive positions when markets decline or appear overvalued. This means, among other things, that a tracking ETF typically will not sell a particular holding just because it is performing poorly. Instead, the ETF seeks to track the index regardless of whether the index level is increasing or decreasing. The descriptions below will indicate the investment objective of each ETF and will indicate which index a particular ETF tracks if it is a tracking ETF. The description also will state how much of the ETF’s assets generally will be invested in the securities in the index and what else the ETF may invest in. The descriptions also will state the strategy the investment advisor uses to track the index.
The ETFs that track an equity index seek to track the performance of the “total return” version of such index. A total return index represents the total return earned in a portfolio that tracks the price return index and reinvests dividend income in the overall index, not in the specific stock paying the dividend. The difference between the price return calculation and the total return calculation of an index is that, with respect to the price return calculation, changes in the index level reflect changes in stock prices, whereas with respect to the total return calculation of the index, changes in the index level reflect both movements in stock prices and the reinvestment of dividend income. In addition, some of the ETFs track an index that is calculated on a net daily total return basis, which tracks the price return index and reinvests dividend income in the overall index, except that the dividend income is reinvested net of certain withholding taxes. Notwithstanding an ETF’s investment objective to track the performance of the total return version of an index, the return on your notes will not reflect any dividends paid on the ETF shares, on the securities purchased by the ETF or on the securities that comprise the index such ETF tracks. See “Additional Risk Factors Specific to Your Notes — You Have No Shareholder Rights or Rights to Receive Any Shares or Units of Any ETF, or Any Assets Held by Any ETF or the Cash Constituent” in the applicable pricing supplement.
Tracking Error
In the case of a tracking ETF, as described above, the difference between the performance of the ETF over a period of time and the performance of the index over such period of time is called the “tracking error” over that period of time. This is typically measured as the difference between the ETF’s returns and the index returns over the same period of time. This is also sometimes referred to as the “correlation” between the index and the tracking ETF. An index and ETF are
S-15
perfectly correlated if the correlation is 1.00 (i.e., the tracking error is 0.00%). Tracking errors can result for a variety of reasons, but one of the common reasons is that an index is a theoretical financial calculation of the performance of certain assets, but an ETF holds an actual investment portfolio. The descriptions below will discuss some of the additional reasons for tracking errors in the ETFs. The ETFs provide information about the performance of the index and the performance of the ETF for the same period. In some cases, the ETFs assume reinvestment of share distributions when calculating the performance of the market price of the shares.
Creation Units
Prior to trading in the secondary market, shares of an ETF are issued at net asset value to certain institutional investors (typically market makers or other broker-dealers) only in large block-size units, known as creation units. As a practical matter, only institutions, market makers or large investors purchase or redeem creation units. Except when aggregated in creation units (or upon the liquidation of the ETF), shares of an ETF are not redeemable securities. The descriptions below will describe the size of the creation units for each ETF. For most investors, the important thing to know is that redemptions of creation units may cause temporary dislocations in tracking errors for tracking ETFs.
Investment Advisor
Each of the ETFs has an investment advisor. Depending on the structure of the ETF, there may be other key roles with respect to that ETF. Those roles and the entities that perform them will be described below.
Net Asset Value and Share Prices
Each of the ETFs calculates a net asset value, or NAV, at the end of each trading day. This value represents the value of the ETF’s assets less any applicable fees and expenses. The actual trading price of an ETF’s shares or units in the secondary market generally differs (and may deviate significantly during periods of market volatility) from the ETF’s daily net asset value. This is because the trading price is affected by market forces such as supply and demand, economic conditions and other factors. For purposes of your notes and the index, the trading prices of the shares or units of the ETFs included in the calculation of the index will be based on the trading prices alone and not the NAV or any indicative values.
S-16
iShares® MSCI USA Momentum Factor ETF
The shares of the iShares® MSCI USA Momentum Factor ETF (the “ETF”) are issued by iShares® Trust, a registered investment company.
|
• |
The ETF is a tracking ETF that seeks investment results which correspond generally to the price and yield performance, before fees and expenses, of the MSCI USA Momentum SR Variant Index (the “index”). Prior to November 23, 2020, the ETF tracked the MSCI USA Momentum Index. |
|
• |
The ETF’s investment advisor is BlackRock Fund Advisors (“BFA”). |
|
• |
The ETF’s shares trade on the Cboe BZX under the ticker symbol “MTUM”. |
|
• |
The iShares® Trust’s SEC CIK Number is 0001100663. |
|
• |
The ETF’s inception date was April 16, 2013. |
|
• |
The ETF’s shares are issued or redeemed only in creation units of 50,000 shares or multiples thereof. |
Effective August 17, 2020, the name of the ETF changed from the iShares® Edge MSCI USA Momentum Factor ETF to the iShares® MSCI USA Momentum Factor ETF.
We obtained the following fee information from the iShares® website without independent verification. The investment advisor is paid a management fee from the ETF based on a percentage of the ETF’s average daily net assets, at the annual rate of 0.15%. BFA may from time to time voluntarily waive and/or reimburse fees or expenses in order to limit total annual ETF operating expenses (excluding acquired fund fees and expenses, if any). Any such voluntary waiver or reimbursement may be eliminated by BFA at any time. As of September 30, 2020, the aggregate expense ratio of the ETF was 0.15% per annum.
For additional information regarding iShares® Trust or BFA, please consult the reports (including the Annual Report to Shareholders on Form N-CSR for the fiscal year ended July 31, 2020) and other information iShares® Trust files with the SEC. In addition, information regarding the ETF, including its top portfolio holdings, may be obtained from other sources including, but not limited to, press releases, newspaper articles, other publicly available documents, and the iShares® website at us.ishares.com/product_info/fund/overview/MTUM.htm. We are not incorporating by reference the website, the sources listed above or any material they include in this index supplement.
Investment Objective
The ETF seeks to provide investment results that correspond generally to the price and yield performance, before fees and expenses, of the index. The ETF’s investment objective and the index may be changed without the approval of BFA’s shareholders.
The following table displays the top holdings and weightings by industry sector of the ETF. (Sector designations are determined by the ETF sponsor using criteria it has selected or developed. Index and ETF sponsors may use very different standards for determining sector designations. In addition, many companies operate in a number of sectors, but are listed in only one sector and the basis on which that sector is selected may also differ. As a result, sector comparisons between indices or ETFs with different sponsors may reflect differences in methodology as well as actual differences in the sector composition of the indices or ETFs.) We obtained the information in the tables below from the ETF website without independent verification.
S-17
iShares® MSCI USA Momentum Factor ETF Top Ten Holdings as of November 12, 2020
|
ETF Stock Issuer |
Percentage (%) |
|
APPLE INC |
6.21% |
|
TESLA INC |
6.10% |
|
AMAZON COM INC |
5.18% |
|
MICROSOFT CORP |
4.78% |
|
NVIDIA CORP |
4.59% |
|
JOHNSON & JOHNSON |
3.80% |
|
UNITEDHEALTH GROUP INC |
3.52% |
|
ADOBE INC |
2.93% |
|
ALPHABET INC CLASS C |
2.65% |
|
ALPHABET INC CLASS A |
2.54% |
|
Total |
42.30% |
iShares® MSCI USA Momentum Factor ETF Weighting by Sector as of November 12, 2020*
|
Sector |
Percentage (%) |
|
Information Technology |
32.09% |
|
Health Care |
29.22% |
|
Communication |
10.92% |
|
Industrials |
1.32% |
|
Consumer Discretionary |
13.49% |
|
Financials |
3.37% |
|
Utilities |
1.43% |
|
Consumer Staples |
3.22% |
|
Materials |
1.06% |
|
Real Estate |
3.72% |
|
Cash and/or Derivatives |
0.16% |
|
Total |
100.00% |
* Percentages may not sum to 100% due to rounding.
Representative Sampling
BFA uses a representative sampling indexing strategy to manage the ETF. This strategy involves investing in a representative sample of securities that collectively has an investment profile similar to that of the index. The securities selected are expected to have, in the aggregate, investment characteristics (based on factors such as market capitalization and industry weightings), fundamental characteristics (such as return variability and yield) and liquidity measures similar to those of the index.
The ETF generally will invest at least 90% of its assets in the component securities of the index and may invest up to 10% of its assets in certain futures, options and swap contracts, cash and cash equivalents, including shares of money market funds advised by BFA or its affiliates, as well as in securities not included in the index, but which BFA believes will help the ETF track the index. The ETF may temporarily invest a lesser amount in the component securities of the index outside of normal circumstances, such as when the index rebalances during periods of high volatility in the markets for the component securities. Also, the ETF may lend securities representing up to one-third of the value of the ETF’s total assets (including the value of the collateral received).
Tracking Error
The performance of the ETF and the index may vary due to a variety of factors, including differences between the securities and other instruments held in the ETF’s portfolio and those included in the index, pricing differences, transaction costs incurred by the ETF, the ETF’s holding of uninvested cash, differences in timing of the accrual of or the valuation of dividends or interest, the requirements to maintain pass-through tax treatment, portfolio transactions carried out to minimize the distribution of capital gains to shareholders, acceptance of custom baskets, changes to the index or the costs to the ETF of complying with various new or existing regulatory requirements. Tracking error also may result because the ETF incurs fees and expenses, while the index does not. BFA expects that, over time, the ETF’s tracking error will not exceed 5%. The ETF’s use of a representative sampling indexing strategy can be expected to produce a larger tracking error than would result if the ETF used a replication indexing strategy in which an ETF invests in substantially all of the securities in its index in approximately the same proportions as in the index.
S-18
As of October 31, 2020, iShares® reported the following average annual returns on the market price of the ETF’s shares and the MSCI USA Momentum Index. The market price of the ETF’s shares takes into account distributions on the shares and the returns shown account for changes in the mid-point of the bid and ask prices at 4:00 p.m., Eastern time on the relevant date. ETF shares: 1 year, 19.25 %; 3 years, 13.49%; 5 years, 15.55%; since inception, 15.72 %; MSCI USA Momentum Index: 1 year, 19.46%; 3 years, 13.76%; 5 years, 15.80%; since ETF inception, 15.97%.
Industry Concentration Policy
The ETF will concentrate its investments (i.e., hold 25% or more of its total assets) in a particular industry or group of industries to approximately the same extent that the index is concentrated.
The MSCI USA Momentum SR Variant Index
The MSCI USA Momentum SR Variant Index aims to reflect the performance of the MSCI USA Momentum Index (for purposes of the descriptions of the MSCI USA Momentum SR Variant Index, the “reference index”), except that the MSCI USA Momentum SR Variant Index is rebalanced by staggering changes in the number of security shares due to rebalancing in equal proportion over three business days ending on the effective date of the reference index rebalancing, whereas the reference index implements the entire rebalancing on the effective date. Please read “Additional Risk Factors Specific to the ETFs—Risks related to the iShares® MSCI USA Momentum Factor ETF – The iShares® MSCI USA Momentum Factor ETF Recently Changed the Index it Tracks” on S-11. For more information about the reference index, see “The MSCI USA Momentum Index” below.
The MSCI USA Momentum SR Variant Index is calculated, published and disseminated daily by MSCI through numerous data vendors, on the MSCI website and in real time on Bloomberg Financial Markets and Reuters Limited. The MSCI USA Momentum SR Variant Index was launched on May 19, 2020. Additional information about the MSCI USA Momentum SR Variant Index is available on the following website: msci.com/index-methodology. We are not incorporating by reference the website, the sources listed above or any material they include in this index supplement.
Rebalancing of the MSCI USA Momentum SR Variant Index
The MSCI USA Momentum SR Variant Index is rebalanced by staggering the changes in the number of shares of securities due to rebalancing in equal proportions over three days: T-2, T-1 and T (where “T” is the effective date of the rebalancing of the reference index, T-1 is the preceding business day, and T-2 is the second preceding business day). In case any of the three consecutive business days ending in business day T is preceded by a scheduled exchange holiday (any day on which any exchange on which any security in the MSCI USA Momentum SR Variant Index is listed has a trading holiday (either full or partial)), the start date of the staggering will be advanced to ensure that the implementation continues to be staggered over three business days (which may be non-consecutive), none of which are preceded by a scheduled exchange holiday. The pro forma MSCI USA Momentum SR Variant Index in general is announced nine business days before T (T-9), where T is the effective date of the rebalancing of the reference index.
Other than with respect to the staggered implementation of rebalancings, the MSCI USA Momentum SR Variant Index generally follows the rebalancing schedule of the reference index. The reference index’s scheduled rebalancings occur semi-annually, usually as of the close of the last business day of May and November, coinciding with the May and November semi-annual index review of the reference index (which reference index rebalancing day would serve as the reference date for the staggered rebalancing of the MSCI USA Momentum SR Variant Index, as described below). In addition, the MSCI USA Momentum SR Variant Index generally will be subject to ad-hoc rebalancing if a trigger condition for an ad-hoc rebalancing of the reference index is satisfied, but such ad-hoc rebalancing will also be implemented on a staggered basis (i.e., over three business days). For more information about the rebalancing schedule and trigger conditions for ad-hoc rebalancings of the reference index, see “The MSCI USA Momentum Index—Maintenance of the MSCI USA Momentum Index” below.
For each day of staggering, the number of shares for each security included in the MSCI USA Momentum SR Variant Index equals the sum of (i) the number of shares of such security in the reference index effective on the particular date of staggering plus (ii) the product of (a) the difference between the targeted number of shares of such security that will be in the reference index on the effective date of the reference index’s rebalancing date (T), adjusted for changes to the overall number of shares due to corporate events (spinoffs, mergers, etc.), minus the actual number of shares of such security in the reference index on the particular date of staggering multiplied by (b) the quotient of N divided 3, where N is the nth day of staggering (e.g., t-2 is the first day of staggering). The number of shares of a security in the reference index effective on a particular date of staggering is calculated as the product of the end of day number of shares of the security as of the close of trading on the prior business day as adjusted for certain corporate events as described in “The MSCI USA Momentum Index—Maintenance of the MSCI USA Momentum Index—Corporate Events” below.
S-19
Maintenance of the MSCI USA Momentum SR Variant Index
Except as otherwise specified below, the MSCI USA Momentum SR Variant Index is generally maintained on the same basis as the reference index.
Corporate Events
Corporate event treatment for the MSCI USA Momentum SR Variant Index depends on whether the effective date of the event falls within the staggering period (T-2, T-1, T), or outside the staggering period.
The general treatment of corporate events effective outside the staggering period in the MSCI USA Momentum SR Variant Index aims to minimize turnover outside of index reviews. The methodology aims to appropriately represent an investor’s participation in an event based on relevant deal terms and pre-event weighting of the index constituents that are involved. Further, changes in index market capitalization that occur as a result of corporate event implementation will be offset by a corresponding change in the variable weighting factor of the constituent. Additionally, if the frequency of index reviews in the MSCI USA Index is greater than the frequency of index reviews in the MSCI USA Momentum SR Variant Index, the changes made to the MSCI USA Index during intermediate index reviews will be neutralized in the MSCI USA Momentum SR Variant Index.
For more information about the treatment of common corporate events, see “The MSCI USA Momentum Index— Maintenance of the MSCI USA Momentum Index—Corporate Events” below. No new securities will be added (except where noted below in “The MSCI USA Momentum Index— Maintenance of the MSCI USA Momentum Index—Corporate Events”) to the MSCI USA Momentum SR Variant Index outside of the staggering period. MSCI USA Index deletions will be reflected simultaneously in the MSCI USA Momentum SR Variant Index.
Events effective in MSCI USA Momentum SR Variant Index during the staggering period incorporate the event implementation in the reference index. The impact of an event on the MSCI USA Momentum SR Variant Index depends on the type of event and calculation date of the index.
The MSCI USA Momentum Index
The MSCI USA Momentum Index is designed to measure the performance of an equity momentum strategy by emphasizing stocks with high price momentum, while maintaining reasonably high trading liquidity and investment capacity and moderate index turnover, each as determined by MSCI Inc. (“MSCI”). The MSCI USA Momentum Index’s constituent stocks exhibit relatively higher momentum characteristics than its traditional market capitalization weighted parent index, the MSCI USA Index. The MSCI USA Index includes U.S. large- and mid-capitalization stocks, as defined by MSCI. For more information about the MSCI USA Index, see “The MSCI USA Index” below.
The MSCI USA Momentum Index is calculated, published and disseminated daily by MSCI through numerous data vendors, on the MSCI website and in real time on Bloomberg Financial Markets and Reuters Limited. The MSCI USA Momentum Index was launched on February 15, 2013. Additional information about the MSCI USA Momentum Index is available on the following website: msci.com/index-methodology. We are not incorporating by reference the website, the sources listed above or any material they include in this index supplement.
Construction of the MSCI USA Momentum Index
The MSCI USA Momentum Index selects a predetermined number of constituent securities with the highest risk-adjusted price momentum from the MSCI USA Index. With respect to a security, MSCI defines risk-adjusted price momentum as (i) the excess return over 6- and 12-month time periods over the risk-free rate divided by (ii) the annualized standard deviation of weekly returns over the past three years. The 6- and 12-month risk-adjusted price momentum calculations are then capped/floored at +/-3 standard deviations and translated into an average momentum score. MSCI uses an algorithm to determine the number of constituent securities to be selected from the MSCI USA Index for inclusion in the MSCI USA Momentum Index with an aim to attain a high exposure to the momentum factor while maintaining sufficient market capitalization and number of securities coverage. The number of components is evaluated semi-annually. The weight of each constituent security in the MSCI USA Momentum Index is determined based on the product of the constituent security’s momentum score and its market capitalization weight in the MSCI USA Index, as further adjusted to, among others, mitigate the impact of stock-specific risk. Additionally, each individual constituent security is capped at 5%.
MSCI USA Momentum Index rebalancings occur semi-annually, usually as of the close of the last business day of May and November, coinciding with the May and November semi-annual index review of the MSCI USA Index. The pro forma Momentum Indexes are in general announced nine business days before the effective date.
Calculate Momentum Values
In order to calculate the momentum score for each security in the MSCI USA Index, the first step is to calculate the 6-month price momentum and the 12-month price momentum on the rebalancing date for that security as follows:
S-20
|
• |
“12-month price momentum” equals (i) the quotient of (a) the price of the security one month prior to the rebalancing date divided by (b) the price of the security 13 months prior to the rebalancing date, minus (ii) 1, minus (iii) the 3-month treasury bill rate on the rebalancing date |
If the 12-month price momentum is not available, only the 6-month price momentum is used to calculate the momentum score. However, if the 6-month price momentum is not available on the rebalancing date, the momentum score will not be calculated and the security is not eligible for inclusion in the MSCI USA Momentum Index.
Calculate Risk-Adjusted Momentum Value
Second, for each security, the 6-month price momentum is used to calculate the 6-month risk-adjusted price momentum, and the 12-month price momentum is used to calculate the 12-month risk-adjusted price momentum, as follows:
|
• |
“6-month risk-adjusted price momentum” equals (i) 6-month risk-adjusted price momentum divided by (ii) the annualized standard deviation of weekly USD price returns over the preceding three years |
|
• |
“12-month risk-adjusted price momentum” equals (i) 12-month risk-adjusted price momentum divided by (ii) the annualized standard deviation of weekly USD price returns over the preceding three years |
Calculate Z-Scores
Third, for each security, the 6-month risk-adjusted price momentum and the 12-month risk-adjusted price momentum are standardized into z-scores as follows:
|
• |
“6-month momentum z-score” equals the number of standard deviations the 6-month risk-adjusted price momentum is from the average 6-month risk-adjusted price momentum for all of the securities in the MSCI USA Index |
|
• |
“12-month momentum z-score” equals the number of standard deviations the 12-month risk-adjusted price momentum 12-month risk-adjusted price momentum for all of the securities in the MSCI USA Index |
Calculate Momentum Score
Fourth, the 6-month momentum z-score and 12-month momentum z-score are combined in equal proportions to arrive at a single combined momentum z-score as follows:
|
(i) |
if both the 6-month momentum z-score and the 12-month momentum z-score is available, “combined momentum z-score” equals (i) the product of 0.5 times 6-month risk-adjusted price momentum plus (ii) the product of 0.5 times 12-month risk-adjusted price momentum, 9 or |
|
(ii) |
if the 12-month momentum z-score is not available, “combined momentum z-score” equals the 6-month risk-adjusted price momentum. |
Fifth, the combined momentum z-score is then standardized by calculating the standardized momentum z-score. The standardized momentum z-score equals the number of standard deviations the combined momentum z-score is from the average of the combined momentum z-scores for all of the securities in the MSCI USA Index. The standardinzing momentum z-score is then winsorized at +/- 3, i.e., a standardized momentum z-score above 3 is capped at 3 standard deviations and a combined momentum z-score below -3 is floored at -3 standard deviations.
Sixth, the momentum score is then computed from the momentum z-scores as follows:
|
(i) |
If the standardized z-score is greater than or equal to 0, the “momentum score” equals 1 plus the momentum z-score; or |
|
(ii) |
If the momentum z-score is less than 0, the “momentum score” equals the quotient of (i) 1 divided by (ii) the difference of 1 minus the momentum z-score. |
Security Selection
The number of securities targeted for inclusion in the MSCI USA Momentum Index at initial construction and upon each rebalancing is determined based on certain rules relating to free-float market capitalization (market price per share multiplied by the number of shares held by non-controlling interests) and numbers of constituent securities as described below.
S-21
Initial Construction. The number of securities targeted for inclusion in the MSCI USA Momentum Index at initial construction (or on any semi-annual rebalancing when the initial construction methodology is required to be applied, as described below under the caption “—Rebalancing”) is determined by (i) ranking each constituent security in the MSCI USA Index according to its momentum z-score (before applying any cap or floor, and using such securities’ weights in the MSCI USA Index if multiple securities have the same score) and (ii) applying the following rules in order of priority:
|
• |
if the MSCI USA Index has 25 or fewer constituent securities on the relevant date, each constituent security in the MSCI USA Index is included as a constituent security in the MSCI USA Momentum Index; or |
|
• |
if 25 or fewer of the highest ranking MSCI USA Index constituent securities account for at least 30% of the MSCI USA Index’s free-float market capitalization, the target number of MSCI USA Momentum Index constituent securities will be 25, subject to the rounding rules; or |
|
• |
if 25 of the highest ranking MSCI USA Index constituent securities DO NOT account for at least 30% of the MSCI USA Index’s free-float market capitalization, but the top 10% of the highest ranking MSCI USA Index constituent securities DO account for at least 30% of the MSCI USA Index’s free-float market capitalization, the number of constituent securities constituting the top 10% of the highest ranking MSCI USA Index constituent securities, after rounding, is the number of securities targeted for inclusion in the MSCI USA Momentum Index; or |
|
• |
if the number of top ranking MSCI USA Index constituent securities accounting for 30% of the MSCI USA Index’s free-float market capitalization, after rounding, account for less than 40% of the total number of MSCI USA Index constituent securities, such rounded number is the number of securities targeted for inclusion in the MSCI USA Momentum Index; or |
|
• |
if the number of top ranking MSCI USA Index constituent securities accounting for 30% of the MSCI USA Index’s free-float market capitalization, after rounding, account for 40% or more of the total number of MSCI USA Index constituent securities, eliminate each of the lowest ranking MSCI USA Index constituent securities from such rounded number until the number of those remaining account for 40% or less of the total number of MSCI USA Index constituent securities; and |
|
|
o |
if the remaining MSCI USA Index constituent securities account for at least 20% of the MSCI USA Index’s free-float market capitalization, the number of such remaining MSCI USA Index constituent securities, after rounding, is the number of securities targeted for inclusion in the MSCI USA Momentum Index; or |
|
|
o |
if the remaining MSCI USA Index constituent securities account for less than 20% of the MSCI USA Index’s free-float market capitalization, add back the next highest ranking MSCI USA Index constituent securities previously eliminated until the MSCI USA Momentum Index’s constituent securities account for at least 20% of the MSCI USA Index’s free-float market capitalization and such number of MSCI USA Index constituent securities, after rounding, is the number of securities targeted for inclusion in the MSCI USA Momentum Index. |
Where indicated above, the following rounding conventions apply:
|
• |
if the number of constituent securities is less than 100, round to the nearest 10 constituent securities; |
|
• |
if the number of constituent securities is greater than or equal to 100 but less than 300, round to the nearest 25 constituent securities; and |
|
• |
if the number of constituent securities is greater than or equal to 300, round to the nearest 50 constituent securities. |
Rebalancing. The target number of securities for inclusion in the MSCI USA Momentum Index at each semi-annual rebalancing is determined by applying the following rules in order of priority:
|
• |
if the target number of MSCI USA Momentum Index constituent securities on the immediately preceding rebalancing date or initial construction (following rebalancing or construction) exceeds the number of MSCI USA Index constituent securities on the rebalancing date, the initial construction methodology described above should be applied to determine the number of constituent securities to be included in the MSCI USA Momentum Index; or |
|
• |
if the MSCI USA Index has 25 or fewer constituent securities on the rebalancing date, each constituent security in the MSCI USA Index is included as a constituent security in the MSCI USA Momentum Index; or |
|
• |
if the number of constituent securities included in the MSCI USA Index on the immediately preceding rebalancing or initial construction date (following rebalancing or construction) is less than 25, repeat the initial construction process described above to determine the number of constituent securities to be included in the MSCI USA Momentum Index; or |
S-22
|
• |
otherwise, the target number of MSCI USA Momentum Index constituent securities will not change from the immediately preceding rebalancing or construction date (following rebalancing or construction). |
Weighting Scheme for the MSCI USA Momentum Index
For a given rebalancing effective date, each security eligible for inclusion in the MSCI USA Momentum Index is weighted according to the product of its market capitalization weight in the MSCI USA Index as of the rebalancing date and its momentum score. Weights are then normalized to 100%, with the weight of an individual constituent security over 5% is capped at 5%.
Maintenance of the MSCI USA Momentum Index
The MSCI USA Momentum Index is rebalanced on a semi-annual basis, usually as of the close of the last business day of May and November, coinciding with the May and November semi-annual index review of the MSCI USA Index. In addition to the two semi-annual reviews in May and November, the MSCI USA Momentum Index undergoes ad-hoc rebalancing if the change in annualized volatility of the MSCI USA Index (measured using trailing 3-month daily returns) on any monthly measuring date (the ninth business day prior to month end) compared to the prior month is in the 95th percentile of monthly changes in volatility over the available history of the MSCI USA Index. The trigger condition for ad-hoc rebalancing is checked every month.
Buffer Rules
To reduce index turnover and enhance index stability, buffer rules are applied to 50% of the fixed number of securities in the MSCI USA Momentum Index. As a result, 50% of the positions in the rebalancing will be selected from among the highest ranking MSCI USA Index constituent securities without regard to whether they are currently included in the MSCI USA Momentum Index and existing constituent securities of the MSCI USA Momentum Index as of the rebalancing date (prior to effecting the rebalancing) will be given priority for the next 50% of constituent security positions. For example, if the fixed number of securities is 100, the buffers are applied between rank 51 and 150. If the target number of MSCI USA Momentum Index constituent securities is not achieved after this step, the highest ranking remaining MSCI USA Index constituent securities are added until the target number is achieved.
Corporate Events
The general treatment of corporate events in the MSCI USA Momentum Index aims to minimize turnover outside of index reviews. The methodology aims to appropriately represent an investor’s participation in an event based on relevant deal terms and pre-event weighting of the index constituents that are involved. The following section briefly describes the treatment of common corporate events within the MSCI Momentum Indexes. Further, changes in index market capitalization that occur as a result of corporate event implementation will be offset by a corresponding change in the variable weighting factor of the constituent. Additionally, the changes made to the MSCI USA Index during its quarterly index reviews (described below) will be neutralized in the MSCI USA Momentum Index.
No new securities will be added (except where noted below) to the MSCI USA Momentum Index between index reviews. MSCI USA Index deletions will be reflected simultaneously in the MSCI USA Momentum Index.
S-23
|
Event Details |
|
|
New additions to the MSCI USA Index |
A new security added to the MSCI USA Index (such as IPO and other early inclusions) will not be added to the index. |
|
Spin-Offs |
All securities created as a result of the spin-off of an existing MSCI USA Momentum Index constituent will be added to the MSCI USA Momentum Index at the time of event implementation. Reevaluation for continued inclusion in the MSCI USA Momentum Index will occur at the subsequent index review. |
|
Merger/acquisition |
For mergers and acquisitions, the acquirer’s post event weight will account for the proportionate amount of shares involved in deal consideration, while cash proceeds will be invested across the MSCI USA Momentum Index.
If an existing MSCI USA Momentum Index constituent is acquired by a security that is not a constituent of the MSCI USA Momentum Index, the existing constituent will be deleted from the MSCI USA Momentum Index and the acquiring non-constituent will not be added to the MSCI USA Momentum Index. |
|
Changes in security characteristics |
A security will continue to be a constituent of the MSCI USA Momentum Index if there are changes in characteristics (country, sector, size segment, etc.). Reevaluation for continued inclusion in the MSCI USA Momentum Index will occur at the subsequent index review. |
The MSCI USA Index
MSCI USA Index is a free float adjusted market capitalization index that is designed to measure large- and mid-cap U.S. equity market performance. The MSCI USA Index is member of the MSCI Global Equity Indices and represents the U.S. equity portion of the global benchmark MSCI ACWI Index.
Construction of the MSCI USA Index
MSCI undertakes an index construction process, which involves: (i) defining the equity universe; (ii) determining the market investable equity universe for each market; (iii) determining market capitalization size segments for each market; (iv) applying index continuity rules for standard indices; and (v) classifying securities under the Global Industry Classification Standard. The MSCI USA Index is a standard index, meaning that only securities that would qualify for inclusion in a large-cap index or a mid-cap index will be included as described below.
Defining the Equity Universe
Identifying Eligible Equity Securities: The equity universe for the MSCI USA Index initially looks at securities classified as belonging to the United States, which is classified as “developed markets”. All listed equity securities, including real estate investment trusts are eligible for inclusion in the equity universe. Limited partnerships, limited liability companies and business trusts, which are listed in the US and are not structured to be taxed as limited partnerships, are likewise eligible for inclusion in the equity universe. Conversely, mutual funds, exchange traded funds, equity derivatives and most investment trusts are not eligible for inclusion in the equity universe. Preferred shares that exhibit characteristics of equity securities are eligible.
Country Classification of Eligible Securities: Each company and its securities (i.e., share classes) are classified in one and only one country, which allows for a distinctive sorting of each company by its respective country.
Determining the Market Investable Equity Universes
A market investable equity universe for a market is derived by (i) identifying eligible listings for each security in the equity universe; and (ii) applying investability screens to individual companies and securities in the equity universe that are classified in that market. A market is generally equivalent to a single country. The global investable equity universe is the aggregation of all market investable equity universes.
(i) Identifying Eligible Listings: A security may have a listing in the country where it is classified (a “local listing”) and/or in a different country (a “foreign listing”). A security may be represented by either a local listing or a foreign listing (including a depositary receipt) in the global investable equity universe. A security may be represented by a foreign listing only if the security is classified in a country that meets the foreign listing materiality requirement (as described below), and the security’s foreign listing is traded on an eligible stock exchange of a developed market country if the security is
S-24
classified in a developed market country or, if the security is classified in an emerging market country, an eligible stock exchange of a developed market country or an emerging market country.
In order for a country to meet the foreign listing materiality requirement, the following is determined: all securities represented by a foreign listing that would be included in the country’s MSCI Country Investable Market Index if foreign listings were eligible from that country. The aggregate free-float adjusted market capitalization for all such securities should represent at least (i) 5% of the free float-adjusted market capitalization of the relevant MSCI Country Investable Market Index and (ii) 0.05% of the free-float adjusted market capitalization of the MSCI ACWI Investable Market Index. If a country does not meet the foreign listing materiality requirement, then securities in that country may not be represented by a foreign listing in the global investable equity universe.
(ii) Applying Investability Screens: The investability screens used to determine the investable equity universe in each market are:
(a) Equity Universe Minimum Size Requirement: This investability screen is applied at the company level. In order to be included in a market investable equity universe, a company must have the required minimum full market capitalization. The equity universe minimum size requirement applies to companies in all markets and is derived as follows:
|
• |
First, the companies in the developed market equity universe are sorted in descending order of full market capitalization and the cumulative coverage of the free float-adjusted market capitalization of the developed market equity universe is calculated for each company. Each company’s free float-adjusted market capitalization is represented by the aggregation of the free float-adjusted market capitalization of the securities of that company in the equity universe. |
|
• |
Second, when the cumulative free float-adjusted market capitalization coverage of 99% of the sorted equity universe is achieved, by adding each company’s free float-adjusted market capitalization in descending order, the full market capitalization of the company that reaches the 99% threshold defines the equity universe minimum size requirement. |
|
• |
The rank of this company by descending order of full market capitalization within the developed market equity universe is noted, and will be used in determining the equity universe minimum size requirement at the next rebalance. |
As of May 2020, the equity universe minimum size requirement was set at US$238,000,000. Companies with a full market capitalization below this level are not included in any market investable equity universe. The equity universe minimum size requirement is reviewed and, if necessary, revised at each semi-annual index review, as described below.
(b) Equity Universe Minimum Free Float-Adjusted Market Capitalization Requirement: This investability screen is applied at the individual security level. To be eligible for inclusion in a market investable equity universe, a security must have a free float-adjusted market capitalization equal to or higher than 50% of the equity universe minimum size requirement.
(c) Minimum Liquidity Requirement: This investability screen is applied at the individual security level. To be eligible for inclusion in a market investable equity universe, a security must have at least one eligible listing that has adequate liquidity as measured by its 12-month and 3-month annualized traded value ratio (“ATVR”) and 3-month frequency of trading. The ATVR attempts to mitigate the impact of extreme daily trading volumes and takes into account the free float-adjusted market capitalization of securities. A minimum liquidity level of 20% of the 3-month ATVR and 90% of 3-month frequency of trading over the last 4 consecutive quarters, as well as 20% of the 12-month ATVR, are required for inclusion of a security in a market investable equity universe of a developed market. A minimum liquidity level of 15% of the 3-month ATVR and 80% of 3-month frequency of trading over the last 4 consecutive quarters, as well as 15% of the 12-month ATVR, are required for inclusion of a security in a market investable equity universe of an emerging market.
Only one listing per security may be included in the market investable equity universe. In instances where a security has two or more eligible listings that meet the above liquidity requirements, then the following priority rules are used to determine which listing will be used for potential inclusion of the security in the market investable equity universe:
(1) Local listing (if the security has two or more local listings, then the listing with the highest 3-month ATVR will be used).
(2) Foreign listing in the same geographical region (MSCI classifies markets into three main geographical regions: EMEA, Asia Pacific and Americas. If the security has two or more foreign listings in the same geographical region, then the listing with the highest 3-month ATVR will be used).
(3) Foreign listing in a different geographical region (if the security has two or more foreign listings in a different geographical region, then the listing with the highest 3-month ATVR will be used).
S-25
Due to liquidity concerns relating to securities trading at very high stock prices, a security that is currently not a constituent of a MSCI Global Investable Markets Index that is trading at a stock price above US$10,000 will fail the liquidity screening and will not be included in any market investable equity universe.
(d) Global Minimum Foreign Inclusion Factor Requirement: This investability screen is applied at the individual security level. To determine the free float of a security, MSCI considers the proportion of shares of such security available for purchase in the public equity markets by international investors. In practice, limitations on the investment opportunities for international investors include: strategic stakes in a company held by private or public shareholders whose investment objective indicates that the shares held are not likely to be available in the market; limits on the proportion of a security’s share capital authorized for purchase by non-domestic investors; or other foreign investment restrictions which materially limit the ability of foreign investors to freely invest in a particular equity market, sector or security.
MSCI will then derive a “foreign inclusion factor” for the company that reflects the proportion of shares outstanding that is available for purchase in the public equity markets by international investors. MSCI will then “float-adjust” the weight of each constituent company in an index by the company’s foreign inclusion factor.
Once the free float factor has been determined for a security, the security’s total market capitalization is then adjusted by such free float factor, resulting in the free float-adjusted market capitalization figure for the security.
(e) Minimum Length of Trading Requirement: This investability screen is applied at the individual security level. For an initial public offering to be eligible for inclusion in a market investable equity universe, the new issue must have started trading at least three months before the implementation of a semi-annual index review. This requirement is applicable to small new issues in all markets. Large initial public offerings are not subject to the minimum length of trading requirement and may be included in a market investable equity universe and a standard index, such as the MSCI USA Index, outside of a quarterly or semi-annual index review.
(f) Minimum Foreign Room Requirement: This investability screen is applied at the individual security level. For a security that is subject to a foreign ownership limit to be eligible for inclusion in a market investable equity universe, the proportion of shares still available to foreign investors relative to the maximum allowed (referred to as “foreign room”) must be at least 15%.
Determining Market Capitalization Size Segments for Each Market
Once a market investable equity universe is defined, it is segmented into the following size-based indices:
|
• |
Investable Market Index (Large Cap + Mid Cap + Small Cap) |
|
• |
Standard Index (Large Cap + Mid Cap) |
|
• |
Large Cap Index |
|
• |
Mid Cap Index |
|
• |
Small Cap Index |
Creating the size segment indices in each market involves the following steps: (i) defining the market coverage target range for each size segment; (ii) determining the global minimum size range for each size segment; (iii) determining the market size-segment cutoffs and associated segment number of companies; (iv) assigning companies to the size segments; and (v) applying final size-segment investability requirements. For developed market indices, the market coverage for a standard index is 85%. As of April 2020, the global minimum size range for a developed market standard index is a full market capitalization of USD 2.8 billion to USD 6.44 billion.
Applying Index Continuity Rules for Standard Indices
In order to achieve index continuity, as well as provide some basic level of diversification within a market index, notwithstanding the effect of other index construction rules, a minimum number of five constituents will be maintained for a developed market standard index and a minimum number of three constituents will be maintained for an emerging market standard index, and involves the following steps:
If after the application of the index construction methodology, a developed market standard index contains fewer than five securities or an emerging market standard index contains fewer than three securities, then the largest securities by free float-adjusted market capitalization are added to the index in order to reach the minimum number of required constituents.
At subsequent index reviews, if the minimum number of securities described above is not met, then after the market investable equity universe is identified, the securities are ranked by free float-adjusted market capitalization, however, in order to increase stability the free float-adjusted market capitalization of the existing index constituents (prior to review) is multiplied by 1.50, and securities are added until the desired minimum number of securities is reached.
S-26
Classifying Securities under the Global Industry Classification Standard
All securities in the global investable equity universe are assigned to the industry that best describes their business activities. The Global Industry Classification Standard classification of each security is used by MSCI to construct additional indices.
Calculation Methodology for the MSCI USA Index
The performance of the MSCI USA Index is a free float weighted average of the US dollar values of its component securities, subject to the daily total return methodology (as described below).
Prices used to calculate the component securities are the official exchange closing prices or prices accepted as such in the relevant market. In the case of a market closure, or if a security does not trade on a specific day or during a specific period, MSCI carries the latest available closing price. In the event of a market outage resulting in any component security price to be unavailable, MSCI will generally use the last reported price for such component security for the purpose of performance calculation. If MSCI determines that another price is more appropriate based on the circumstances, an announcement would be sent to clients with the related information. Closing prices are converted into US dollars, as applicable, using the closing spot exchange rates calculated by WM/Reuters at 4:00 P.M. London Time.
Daily Total Return Methodology
The MSCI USA Index is a daily total return index. A daily total return index measures the market performance, including price performance and income from regular cash distributions. This income is reinvested in the MSCI USA Index and thus makes up part of the total index performance. MSCI’s daily total return methodology reinvests cash dividends in the MSCI USA Index the day the security is quoted ex-dividend, or on the ex-date (converted to US dollars, as applicable). Certain dividends, including special/extraordinary dividends and commemorative dividends, are reinvested in the MSCI USA Index if, a day prior to the ex-date, the dividend impact on price is less than 5%. If the impact is 5% or more, the dividend will be reinvested in the MSCI USA Index through a price adjustment on the ex-date. A specific price adjustment is always applied for stock dividends that are issued at no cost to the shareholders, an extraordinary capital repayment or a dividend paid in the shares of another company. Cash payments related to corporate events, such as mergers and acquisitions, are considered on a case-by-case basis.
Notwithstanding the ETF’s investment objective, the return on your notes will not reflect any dividends paid on the ETF shares, on the securities purchased by the ETF or on the securities that comprise the MSCI USA Index.
Maintenance of the MSCI USA Index
In order to maintain the representativeness of the MSCI USA Index, structural changes may be made by adding or deleting component securities. Currently, such changes may generally only be made on four dates throughout the year: after the close of the last business day of each February, May, August and November.
The MSCI USA Index is maintained with the objective of reflecting, on a timely basis, the evolution of the underlying equity markets. In maintaining the MSCI USA Index, emphasis is also placed on its continuity, continuous investability of constituents and replicability of the index and on index stability and minimizing turnover.
MSCI classifies index maintenance in three broad categories. The first consists of ongoing event related changes, such as mergers and acquisitions. The second category consists of quarterly index reviews, aimed at promptly reflecting other significant market events. The third category consists of semi-annual index reviews that systematically re-assess the various dimensions of the equity universe.
Ongoing event-related changes to the MSCI USA Index are the result of mergers, acquisitions, spin-offs, bankruptcies, reorganizations and other similar corporate events. They can also result from capital reorganizations in the form of rights issues, stock bonus issues, public placements and other similar corporate actions that take place on a continuing basis. MSCI will remove from the index as soon as practicable securities of companies that file for bankruptcy or other protection from their creditors, that are suspended and for which a return to normal business activity and trading is unlikely in the near future; or that fail stock exchange listing requirements with a delisting announcement. Securities may also be considered for early deletion in other significant cases, such as decreases in free float and foreign ownership limits, or when a constituent company acquires or merges with a non-constituent company or spins-off another company. In practice, when a constituent company is involved in a corporate event which results in a significant decrease in the company’s free float-adjusted market capitalization or the company decreases its foreign inclusion factor to below 0.15, the securities of that constituent company are considered for early deletion from the indices simultaneously with the event unless, in either case, it is a standard index constituent with a minimum free float-adjusted market capitalization meeting at least two-thirds of 1.8 times one-half of the standard index interim size segment cut-off. Share conversions may also give rise to an early deletion. Changes in number of shares and foreign inclusion factors resulting from primary equity
S-27
offerings representing at least 5% of the security’s pre-event number of shares are implemented as of the close of the first trading day of the new shares, if all necessary information is available at that time. Otherwise, the event is implemented as soon as practicable after the relevant information is made available. MSCI implements pending number of shares and/or free float updates simultaneously with the event, unless the change in number of shares is less than 1% on a post-event number of shares basis, in which case it will be implemented at a subsequent index review. Changes in the number of shares smaller than 5% are implemented at a subsequent index review. Secondary offerings/block sales with sizes representing at least 5% of the security’s pre-event number of shares are implemented at the time of the event. All changes resulting from corporate events are announced prior to their implementation, provided all necessary information on the event is available.
MSCI’s quarterly index review process is designed to ensure that the MSCI USA Index continues to be an accurate reflection of evolving equity markets. This goal is achieved by timely reflecting significant market driven changes that were not captured in each index at the time of their actual occurrence and that should not wait until the semi-annual index review due to their importance. These quarterly index reviews may result in additions and deletions of component securities from the MSCI USA Index and changes in “foreign inclusion factors” and in number of shares. Additions and deletions to component securities may result from: the addition of large companies that did not meet the minimum size criterion for inclusion at the time of their initial public offering or secondary offering; the replacement of companies which are no longer suitable industry representatives; the deletion of securities whose overall free float has fallen to less than 15% and that do not meet specified criteria; the deletion of securities that have become very small or illiquid; and the addition or deletion of securities as a result of other market events. Significant changes in free float estimates and corresponding changes in the foreign inclusion factor for component securities may result from: corporate events that should have been implemented at the time of such event but could not be reflected immediately due to lack of publicly available details at the time of the event; exercise of IPO over-allotment options which result in an increase in free float; increases in foreign ownership limits; decreases in foreign ownership limits which did not require foreign investors to immediately sell shares in the market; re-estimates of free float figures resulting from the reclassification of shareholders from strategic to non-strategic, and vice versa; the end of lock-up periods or expiration of loyalty incentives for non-strategic shareholders; and conversion of a non-index constituent share class or an unlisted line of shares which has an impact on index constituents. However, no changes in foreign inclusion factors are implemented for any of the above events if the change in free float estimate is less than 1%, except in cases of correction. Small changes in the number of shares resulting from, for example, exercise of options or warrants and employee stock option plans, conversion of convertible bonds or other instruments (including periodic conversion of preferred stocks), conversion of a non-index constituent share class or an unlisted line of shares which has an impact on index constituents, periodical conversion of a share class into another share class, exercise of over-allotment options, periodic share buybacks, the cancellation of shares, acquisition for shares of non-listed companies or assets, or other events that could not be implemented on or near the effective dates where no price adjustment factor is necessary, are generally updated at the quarterly index review rather than at the time of the event. The results of the quarterly index reviews are announced at least two weeks in advance of their effective implementation dates as of the close of the last business day of February and August. MSCI has noted that consistency is a factor in maintaining the MSCI USA Index.
MSCI’s semi-annual index review is designed to systematically reassess the component securities of the MSCI USA Index. During each semi-annual index review, the universe of component securities is updated and the global minimum size range for the MSCI USA Index is recalculated, which is based on the full market capitalization and the cumulative free float-adjusted market capitalization coverage of each security that is eligible to be included in the MSCI USA Index. The following MSCI USA Index maintenance activities, among others, are undertaken during each semi-annual index review: the list of countries in which securities may be represented by foreign listings is reviewed; the component securities are updated by identifying new equity securities that were not part of the MSCI USA Index at the time of the previous quarterly index review; the minimum size requirement for the MSCI USA Index is updated and new companies are evaluated relative to the new minimum size requirement; existing component securities that do not meet the minimum liquidity requirements of the MSCI USA Index may be removed (or, with respect to any such security that has other listings, a determination is made as to whether any such listing can be used to represent the security in the market investable universe); and changes in “foreign inclusion factors” are implemented (provided the change in free float is greater than 1%, except in cases of correction). During a semi-annual index review, component securities may be added or deleted from the MSCI USA Index for a range of reasons, including the reasons discussed with respect to component securities changes during quarterly index reviews as discussed above. Foreign listings may become eligible to represent securities only from the countries that met the foreign listing materiality requirement during the previous semi-annual index review (this requirement is applied only to countries that do not yet include foreign listed securities). Once a country meets the foreign listing materiality requirement at a given semi-annual index review, foreign listings will remain eligible for such country even if the foreign listing materiality requirements are not met in the future.
S-28
The results of the semi-annual index reviews are announced at least two weeks in advance of their effective implementation date as of the close of the last business day of May and November.
MSCI USA Index maintenance also includes monitoring and completing adjustments for share changes, stock splits, stock dividends, and stock price adjustments due to company restructurings or spin-offs.
These guidelines and the policies implementing the guidelines are the responsibility of, and, ultimately, subject to adjustment by, MSCI.
S-29
Historical Closing Prices of the ETF’s Shares
The closing price of shares of the ETF has fluctuated in the past and may, in the future, experience significant fluctuations. Any historical upward or downward trend in the closing price of the shares during the period shown below is not an indication that the shares are more or less likely to increase or decrease at any time during the life of your notes.
You should not take the historical closing prices of the shares as an indication of the future performance of the shares. We cannot give you any assurance that the future performance of the shares will result in your receiving an amount greater than the outstanding face amount of your notes on the stated maturity date. Neither we nor any of our affiliates make any representation to you as to the performance of the shares. Before investing in the offered notes, you should consult publicly available information to determine the relevant ETF closing prices between the date of this index supplement and the date of your purchase of the offered notes. The actual performance of the ETF over the life of the offered notes, as well as the cash settlement amount at maturity may bear little relation to the historical prices shown below.
The graph below shows the daily historical prices of the shares of the ETF from January 1, 2015 through November 23, 2020. We obtained the closing prices shown in the graph below from Bloomberg Financial Services without independent verification. In the graph, historical closing prices after the ETF began tracking the MSCI USA Momentum SR Variant Index on November 23, 2020 can be found to the right of the vertical solid line marker. Closing prices to the left of the vertical solid line marker reflect the ETF closing prices before the ETF began tracking the MSCI USA Momentum SR Variant Index on November 23, 2020.
Historical Performance of iShares® MSCI USA Momentum Factor ETF*

*Prior to November 23, 2020, the ETF tracked the MSCI USA Momentum Index. On and after November 23, 2020, the ETF tracks the MSCI USA Momentum SR Variant Index. Any historical information about the performance of the ETF for any period before November 23, 2020 will be during a period in which the ETF tracked a different underlying index, and therefore should not be considered information relevant to how the ETF will perform tracking the MSCI USA Momentum SR Variant Index.
“iShares®” is a registered trademark of BlackRock Institutional Trust Company, N.A. (“BITC”). The index is not sponsored, endorsed, sold, or promoted by BITC. BITC makes no representations or warranties to the owners of the index or any member of the public regarding the advisability of investing in the index. BITC has no obligation or liability in connection with the operation, marketing, trading or sale of the index.
S-30
iShares® MSCI USA Value Factor ETF
The shares of the iShares® MSCI USA Value Factor ETF (the “ETF”) are issued by iShares® Trust, a registered investment company.
|
• |
The ETF is a tracking ETF that seeks investment results which correspond generally to the price and yield performance, before fees and expenses, of the MSCI USA Enhanced Value Index (the “index”). Prior to September 1, 2015, the ETF tracked the MSCI USA Value Weighted Index. |
|
• |
The ETF’s investment advisor is BlackRock Fund Advisors (“BFA”). |
|
• |
The ETF’s shares trade on the Cboe BZX under the ticker symbol “VLUE”. |
|
• |
The iShares® Trust’s SEC CIK Number is 0001100663. |
|
• |
The ETF’s inception date was April 16, 2013. |
|
• |
The ETF’s shares are issued or redeemed only in creation units of 50,000 shares or multiples thereof. |
Effective August 17, 2020, the name of the ETF changed from the iShares® Edge MSCI USA Value Factor ETF to the iShares® MSCI USA Value Factor ETF.
We obtained the following fee information from the iShares® website without independent verification. The investment advisor is paid a management fee from the ETF based on a percentage of the ETF’s average daily net assets, at the annual rate of 0.15%. BFA may from time to time voluntarily waive and/or reimburse fees or expenses in order to limit total annual ETF operating expenses (excluding acquired fund fees and expenses, if any). Any such voluntary waiver or reimbursement may be eliminated by BFA at any time. As of September 30, 2020, the aggregate expense ratio of the ETF was 0.15% per annum.
For additional information regarding iShares® Trust or BFA, please consult the reports (including the Annual Report to Shareholders on Form N-CSR for the fiscal year ended July 31, 2020) and other information iShares® Trust files with the SEC. In addition, information regarding the ETF, including its top portfolio holdings, may be obtained from other sources including, but not limited to, press releases, newspaper articles, other publicly available documents, and the iShares® website at us.ishares.com/product_info/fund/overview/VLUE.htm. We are not incorporating by reference the website, the sources listed above or any material they include in this index supplement.
Investment Objective
The ETF seeks to provide investment results that correspond generally to the price and yield performance, before fees and expenses, of the index. The ETF’s investment objective and the index may be changed without the approval of BFA’s shareholders.
The following table displays the top holdings and weightings by industry sector of the ETF. (Sector designations are determined by the ETF sponsor using criteria it has selected or developed. Index and ETF sponsors may use very different standards for determining sector designations. In addition, many companies operate in a number of sectors, but are listed in only one sector and the basis on which that sector is selected may also differ. As a result, sector comparisons between indices or ETFs with different sponsors may reflect differences in methodology as well as actual differences in the sector composition of the indices or ETFs.) We obtained the information in the tables below from the ETF website without independent verification.
iShares® MSCI USA Value Factor ETF Top Ten Holdings as of November 12, 2020
|
ETF Stock Issuer |
Percentage (%) |
|
AT&T INC |
7.31% |
|
INTEL CORP |
6.63% |
|
MICRON TECHNOLOGY INC |
3.71% |
|
GENERAL MOTORS |
3.51% |
|
INTERNATIONAL BUSINESS MACHINES CO |
3.09% |
|
FEDEX CORP |
2.35% |
|
TARGET CORP |
2.29% |
|
PFIZER INC |
2.25% |
|
CITIGROUP INC |
2.18% |
|
CVS HEALTH CORP |
1.79% |
|
Total |
35.11% |
S-31
iShares® MSCI USA Value Factor ETF Weighting by Sector as of November 12, 2020*
|
Sector |
Percentage (%) |
|
Information Technology |
23.78% |
|
Health Care |
13.70% |
|
Communication |
9.70% |
|
Financials |
10.86% |
|
Industrials |
10.69% |
|
Consumer Staples |
6.20% |
|
Consumer Discretionary |
13.31% |
|
Utilities |
3.09% |
|
Real Estate |
3.06% |
|
Materials |
3.02% |
|
Energy |
2.21% |
|
Cash and/or Derivatives |
0.36% |
|
Total |
99.98% |
* Percentages may not sum to 100% due to rounding.
Representative Sampling
BFA uses a representative sampling indexing strategy to manage the ETF. This strategy involves investing in a representative sample of securities that collectively has an investment profile similar to that of the index. The securities selected are expected to have, in the aggregate, investment characteristics (based on factors such as market capitalization and industry weightings), fundamental characteristics (such as return variability and yield) and liquidity measures similar to those of the index.
The ETF generally will invest at least 90% of its assets in the component securities of the index and may invest up to 10% of its assets in certain futures, options and swap contracts, cash and cash equivalents, including shares of money market funds advised by BFA or its affiliates, as well as in securities not included in the index, but which BFA believes will help the ETF track the index. Also, the ETF may lend securities representing up to one-third of the value of the ETF’s total assets (including the value of the collateral received).
Tracking Error
The performance of the ETF and the index may vary due to a variety of factors, including differences between the securities and other instruments held in the ETF’s portfolio and those included in the index, pricing differences, transaction costs incurred by the ETF, the ETF’s holding of uninvested cash, differences in timing of the accrual of or the valuation of dividends or interest, the requirements to maintain pass-through tax treatment, portfolio transactions carried out to minimize the distribution of capital gains to shareholders, acceptance of custom baskets, changes to the index or the costs to the ETF of complying with various new or existing regulatory requirements. Tracking error also may result because the ETF incurs fees and expenses, while the index does not. BFA expects that, over time, the ETF’s tracking error will not exceed 5%. The ETF’s use of a representative sampling indexing strategy can be expected to produce a larger tracking error than would result if the ETF used a replication indexing strategy in which an ETF invests in substantially all of the securities in its index in approximately the same proportions as in the index.
As of October 31, 2020, iShares® reported the following average annual returns on the market price of the ETF’s shares and the MSCI USA Enhanced Value Index. The market price of the ETF’s shares takes into account distributions on the shares and the returns shown account for changes in the mid-point of the bid and ask prices at 4:00 p.m., Eastern time on the relevant date. ETF shares: 1 year, -10.84%; 3 years, -0.07%; 5 years, 5.25%; since inception, 7.56%; MSCI USA Enhanced Value Index: 1 year, -10.84%; 3 years, 0.02%; 5 years, 5.40%; since ETF inception, 7.71%.
Industry Concentration Policy
The ETF will concentrate its investments (i.e., hold 25% or more of its total assets) in a particular industry or group of industries to approximately the same extent that the index is concentrated.
The MSCI USA Enhanced Value Index
The MSCI USA Enhanced Value Index is designed to measure the performance of securities in the MSCI USA Index that exhibit higher value characteristics relative to their peers within the corresponding Global Industry Classification Standard (GICS®) sector. The MSCI USA Index includes U.S. large- and mid-capitalization stocks, as defined by MSCI Inc. (“MSCI”). MSCI divides the companies included in the MSCI USA Enhanced Value Index into eleven GICS sectors: Communication Services, Consumer Discretionary, Consumer Staples, Energy, Financials, Health Care, Industrials,
S-32
Information Technology, Materials, Real Estate and Utilities. For additional information about the MSCI USA Index, please see “iShares® MSCI USA Momentum Factor ETF — The MSCI USA Index” above.
The MSCI USA Enhanced Value Index is calculated, published and disseminated daily by MSCI through numerous data vendors, on the MSCI website and in real time on Bloomberg Financial Markets and Reuters Limited. The MSCI USA Enhanced Value Index was launched on December 12, 2014. Additional information about the MSCI USA Enhanced Value Index is available on the following website: msci.com/index-methodology. We are not incorporating by reference the website, the sources listed above or any material they include in this index supplement.
Construction of the MSCI USA Enhanced Value Index
To construct the MSCI USA Enhanced Value Index, MSCI selects a predetermined number of constituent securities from the MSCI USA Index based on a value weighting using the following fundamental values:
|
(1) |
forward price-to-earnings; |
|
(2) |
price-to-book value; and |
|
(3) |
enterprise value-to-cash flow from operations, |
(except companies in the Financials sector do not consider enterprise value-to-cash flow from operations and companies in the Real Estate sector are evaluated based on enterprise value-to-cash flow from operations alone). MSCI uses an algorithm to determine the number of constituent securities to be selected from the MSCI USA Index for inclusion in the MSCI USA Enhanced Value Index with an aim to maintain sufficient market capitalization and number of securities coverage. The number of components is evaluated semi-annually. MSCI assigns weights by multiplying a constituent security’s value score by its market capitalization. Weights in the MSCI USA Enhanced Value Index are next normalized so that sectors in the MSCI USA Enhanced Value Index represent the same relative weight as in the MSCI USA Index, thereby promoting sector neutrality.
Calculate the Z-Score for Each Variable
The z-score with respect to each of the variables for each security is calculated using the mean and standard deviation of the inverse of the corresponding variable. The z-score with respect to each individual variable is computed for each constituent security within the MSCI USA Index, and generally measures the extent to which an individual security is an outlier with respect to a particular variable compared to all of the constituent securities included in the MSCI USA Index, measured in terms of standard deviations. The variables used are as follows:
|
• |
forward price-to-earnings, price-to-book value and enterprise value-to-cash flow from operations for all securities except for those classified in “Financials” or “Real Estate” sectors; |
|
• |
forward price-to-earnings and price-to-book value for all securities classified in the “Financials” sector; and |
|
• |
enterprise value-to-cash flow from operations for all securities classified in the “Real Estate” sector. |
The latest available data at the time of rebalancing is used for the individual value descriptors.
Calculate the Sector Relative Value Z-Score
After calculating individual variable z-scores, a composite value z-score for each security is computed by taking the weighted average of individual variable z-scores for each security. Each individual variable z-score is assigned an equal weight (e.g., a 1/3 weight is assigned when 3 variables are used, a 1/2 weight when 2 variables are used (i.e., for Financial sector) and a weight of 1 when 1 variable is used (i.e., Real Estate sector)). However, no adjustment to the weights will be made to compensate for missing variables (e.g., for a non-Financial/non-Real Estate sector security, the weight of the remaining variable will remain 1/3 if the other 2 variables are not available).
A sector relative score is then derived from the composite value z-score. It is arrived at by standardizing the composite value z-score within each sector. A sector relative score above 3 is capped at 3 standard deviations and a sector relative score below -3 is floored at -3 standard deviations.
Calculate the Final Value Score
The final value score is computed from the sector relative z-score as follows:
S-33
|
(i) |
If the sector relative z-score is greater than or equal to 0, the “final value score” equals 1 plus the sector relative z-score; or |
|
(ii) |
If the sector relative z-score is less than 0, the “final value score” equals the quotient of (i) 1 divided by (ii) the difference of 1 minus the sector relative z-score |
Security Selection
In order to be selected for inclusion in the MSCI USA Enhanced Value Index, a constituent security’s final value score must rank among the highest final value scores in the MSCI USA Index. The number of securities targeted for inclusion in the MSCI USA Enhanced Value Index at initial construction and upon each rebalancing is then determined based on certain rules relating to free-float market capitalization (market price per share multiplied by the number of shares held by non-controlling interests) and numbers of constituent securities as described below.
Initial Construction. The number of securities targeted for inclusion in the MSCI USA Enhanced Value Index at initial construction (or on any semi-annual rebalancing when the initial construction methodology is required to be applied, as described below under the caption “—Rebalancing”) is determined by (i) ranking each constituent security in the MSCI USA Index according to its final value score (using such securities’ weights in the MSCI USA Index if multiple securities have the same score) and (ii) applying the following rules in order of priority:
|
• |
if the MSCI USA Index has 25 or fewer constituent securities on the relevant date, each constituent security in the MSCI USA Index is included as a constituent security in the MSCI USA Enhanced Value Index; or |
|
• |
if 25 or fewer of the highest ranking MSCI USA Index constituent securities account for at least 30% of the MSCI USA Index’s free-float market capitalization, the target number of Value Index constituent securities will be 25, subject to the rounding rules; or |
|
• |
if 25 of the highest ranking MSCI USA Index constituent securities do not account for at least 30% of the MSCI USA Index’s free-float market capitalization, but the top 10% of the highest ranking MSCI USA Index constituent securities do account for at least 30% of the MSCI USA Index’s free-float market capitalization, the number of constituent securities constituting the top 10% of the highest ranking MSCI USA Index constituent securities, after rounding, is the number of securities targeted for inclusion in the MSCI USA Enhanced Value Index; or |
|
• |
if the number of top ranking MSCI USA Index constituent securities accounting for 30% of the MSCI USA Index’s free-float market capitalization, after rounding, account for less than 40% of the total number of MSCI USA Index constituent securities, such rounded number is the number of securities targeted for inclusion in the MSCI USA Enhanced Value Index; or |
|
• |
if the number of top ranking MSCI USA Index constituent securities accounting for 30% of the MSCI USA Index’s free-float market capitalization, after rounding, account for 40% or more of the total number of MSCI USA Index constituent securities, eliminate each of the lowest ranking MSCI USA Index constituent securities from such rounded number until the number of those remaining account for 40% or less of the total number of MSCI USA Index constituent securities; and |
|
|
o |
if the remaining MSCI USA Index constituent securities account for at least 20% of the MSCI USA Index’s free-float market capitalization, the number of such remaining MSCI USA Index constituent securities, after rounding, is the number of securities targeted for inclusion in the MSCI USA Enhanced Value Index; or |
|
|
o |
if the remaining MSCI USA Index constituent securities account for less than 20% of the MSCI USA Index’s free-float market capitalization, add back the next highest ranking MSCI USA Index constituent securities previously eliminated until the MSCI USA Enhanced Value Index’s constituent securities account for at least 20% of the MSCI USA Index’s public float and such number of MSCI USA Index constituent securities, after rounding, is the number of securities targeted for inclusion in the MSCI USA Enhanced Value Index. |
Where indicated above, the following rounding conventions apply:
|
• |
if the number of constituent securities is less than 100, round to the nearest 10 constituent securities; |
|
• |
if the number of constituent securities is greater than or equal to 100 but less than 300, round to the nearest 25 constituent securities; and |
|
• |
if the number of constituent securities is greater than or equal to 300, round to the nearest 50 constituent securities. |
Rebalancing. The target number of securities for inclusion in the MSCI USA Enhanced Value Index at each semi-annual rebalancing is determined by applying the following rules in order of priority:
S-34
|
• |
if the target number of MSCI USA Enhanced Value Index constituent securities on the immediately preceding rebalancing date or initial construction (following rebalancing or construction) exceeds the number of MSCI USA Index constituent securities on the rebalancing date, the initial construction methodology described above should be applied to determine the number of constituent securities to be included in the MSCI USA Enhanced Value Index; or |
|
• |
if the MSCI USA Index has 25 or fewer constituent securities on the rebalancing date, each constituent security in the MSCI USA Index is included as a constituent security in the MSCI USA Enhanced Value Index; or |
|
• |
if the number of constituent securities included in the MSCI USA Index on the immediately preceding rebalancing or initial construction date (following rebalancing or construction) is less than 25, repeat the initial construction process described above to determine the number of constituent securities to be included in the MSCI USA Enhanced Value Index; or |
|
• |
if the constituent securities of the MSCI USA Enhanced Value Index determined on the rebalancing or initial construction date (following rebalancing or construction) immediately preceding the semi-annual rebalancing date account for less than 10% of the MSCI USA Index’s free-float market capitalization on the current rebalancing date, repeat the initial construction process described above to determine the constituent securities to be included in the MSCI USA Enhanced Value Index; or |
|
• |
otherwise, the target number of MSCI USA Enhanced Value Index constituent securities will not change from the immediately preceding rebalancing or construction date (following rebalancing or construction). |
Weighting Scheme for the MSCI USA Enhanced Value Index
The securities selected above are assigned weights in proportion to their market capitalization weight in the MSCI USA Index and final value score. These weights are then updated to implement sector neutrality (i.e., the weight of each sector in the MSCI USA Enhanced Value Index is equated with the weight of that sector in the MSCI USA Index). This is done by normalizing the weights of the constituents within each sector to reflect the effective MSCI USA Index sector weight. The final security level inclusion factor is determined as the ratio of the final security level weight and the security level pro forma market capitalization weight in the MSCI USA Index.
Maintenance of the MSCI USA Enhanced Value Index
The MSCI USA Enhanced Value Index is rebalanced semi-annually and the changes from the rebalancing are made as of the close of the last business day of each May and November, to coincide with the semi-annual index reviews of the MSCI USA Index, using fundamental values from the end of April and October, respectively. The pro forma MSCI USA Enhanced Value Index is generally announced nine business days before the effective date.
Buffer Rules
To reduce index turnover and enhance index stability, buffer rules are applied to 50% of the fixed number of securities in the MSCI USA Enhanced Value Index. As a result, 50% of the positions in the rebalancing will be selected from among the highest ranking MSCI USA Index constituent securities without regard to whether they are currently included in the MSCI USA Enhanced Value Index and existing constituent securities of the MSCI USA Enhanced Value Index as of the rebalancing date (prior to effecting the rebalancing) will be given priority for the next 50% of constituent security positions. For example, if the fixed number of securities is 100, the buffers are applied between rank 51 and 150. If the target number of MSCI USA Enhanced Value Index constituent securities is not achieved after this step, the highest ranking remaining MSCI USA Index constituent securities are added until the target number is achieved.
Ongoing Event Related Changes
The general treatment of corporate events in the MSCI USA Enhanced Value Index aims to minimize turnover outside of index reviews. The methodology aims to appropriately represent an investor’s participation in an event based on relevant deal terms and pre-event weighting of the index constituents that are involved. Further, changes in index market capitalization that occur as a result of corporate event implementation will be offset by a corresponding change in the variable weighting factor of the constituent.
Additionally, if the frequency of index reviews in the MSCI USA Index is greater than the frequency of index reviews in the MSCI USA Enhanced Value Index, the changes made to the MSCI USA Index during intermediate index reviews will be neutralized in the MSCI USA Enhanced Value Index.
The following section briefly describes the treatment of common corporate events within the MSCI USA Enhanced Value Index.
No new securities will be added (except where noted below) to the MSCI USA Enhanced Value Index between index reviews. MSCI USA Index deletions will be reflected simultaneously.
S-35
|
Event Type |
Event Details |
|
New additions to the MSCI USA Index |
A new security added to the MSCI USA Index (such as IPO and other early inclusions) will not be added to the MSCI USA Enhanced Value Index. |
|
Spin-Offs |
All securities created as a result of the spin-off of an existing MSCI USA Enhanced Value Index constituent will be added to the MSCI USA Enhanced Value Index at the time of event implementation. Reevaluation for continued inclusion in the MSCI USA Enhanced Value Index will occur at the subsequent index review. |
|
Merger/acquisition |
For mergers and acquisitions, the acquirer’s post event weight will account for the proportionate amount of shares involved in deal consideration, while cash proceeds will be invested across the MSCI USA Enhanced Value Index.
If an existing MSCI USA Enhanced Value Index constituent is acquired by a security that is not a constituent of the MSCI USA Enhanced Value Index, the existing constituent will be deleted from the MSCI USA Enhanced Value Index and the acquiring non-constituent will not be added to the MSCI USA Enhanced Value Index. |
|
Changes in security characteristics |
A security will continue to be a constituent of the MSCI USA Enhanced Value Index if there are changes in characteristics (country, sector, size segment, etc.). Reevaluation for continued inclusion in the MSCI USA Enhanced Value Index will occur at the subsequent index review. |
S-36
Historical Closing Prices of the ETF’s Shares
The closing price of shares of the ETF has fluctuated in the past and may, in the future, experience significant fluctuations. Any historical upward or downward trend in the closing price of the shares during the period shown below is not an indication that the shares are more or less likely to increase or decrease at any time during the life of your notes.
You should not take the historical closing prices of the shares as an indication of the future performance of the shares. We cannot give you any assurance that the future performance of the shares will result in your receiving an amount greater than the outstanding face amount of your notes on the stated maturity date. Neither we nor any of our affiliates make any representation to you as to the performance of the shares. Before investing in the offered notes, you should consult publicly available information to determine the relevant ETF closing prices between the date of this index supplement and the date of your purchase of the offered notes. The actual performance of the ETF over the life of the offered notes, as well as the cash settlement amount at maturity may bear little relation to the historical prices shown below.
The graph below shows the daily historical prices of the shares of the ETF from January 1, 2015 through November 12, 2020. We obtained the closing prices shown in the graph below from Bloomberg Financial Services without independent verification. In the graph, historical closing prices after the ETF began tracking the MSCI USA Enhanced Value Index on September 1, 2015 can be found to the right of the vertical solid line marker. Closing prices to the left of the vertical solid line marker reflect the ETF closing prices before the ETF began tracking the MSCI USA Enhanced Value Index on September 1, 2015.
Historical Performance of iShares® MSCI USA Value Factor ETF
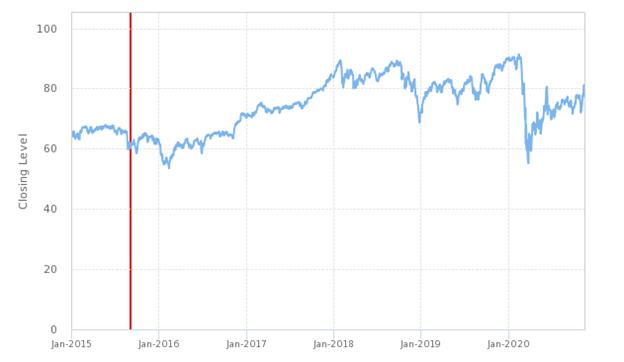
“iShares®” is a registered trademark of BlackRock Institutional Trust Company, N.A. (“BITC”). The index is not sponsored, endorsed, sold, or promoted by BITC. BITC makes no representations or warranties to the owners of the index or any member of the public regarding the advisability of investing in the index. BITC has no obligation or liability in connection with the operation, marketing, trading or sale of the index.
S-37
iShares® MSCI USA Quality Factor ETF
The shares of the iShares® MSCI USA Quality Factor ETF (the “ETF”) are issued by iShares® Trust, a registered investment company.
|
• |
The ETF is a tracking ETF that seeks investment results which correspond generally to the price and yield performance, before fees and expenses, of the MSCI USA Sector Neutral Quality Index (the “index”). Prior to September 1, 2015, the ETF tracked the MSCI USA Quality Index. |
|
• |
The ETF’s investment advisor is BlackRock Fund Advisors (“BFA”). |
|
• |
The ETF’s shares trade on the Cboe BZX under the ticker symbol “QUAL”. |
|
• |
The iShares® Trust’s SEC CIK Number is 0001100663. |
|
• |
The ETF’s inception date was July 16, 2013. |
|
• |
The ETF’s shares are issued or redeemed only in creation units of 50,000 shares or multiples thereof. |
Effective August 17, 2020, the name of the ETF changed from the iShares® Edge MSCI USA Quality Factor ETF to the iShares® MSCI USA Quality Factor ETF.
We obtained the following fee information from the iShares® website without independent verification. The investment advisor is paid a management fee from the ETF based on a percentage of the ETF’s average daily net assets, at the annual rate of 0.15%. BFA may from time to time voluntarily waive and/or reimburse fees or expenses in order to limit total annual ETF operating expenses (excluding acquired fund fees and expenses, if any). Any such voluntary waiver or reimbursement may be eliminated by BFA at any time. As of September 30, 2020, the aggregate expense ratio of the ETF was 0.15% per annum.
For additional information regarding iShares® Trust or BFA, please consult the reports (including the Annual Report to Shareholders on Form N-CSR for the fiscal year ended July 31, 2020) and other information iShares® Trust files with the SEC. In addition, information regarding the ETF, including its top portfolio holdings, may be obtained from other sources including, but not limited to, press releases, newspaper articles, other publicly available documents, and the iShares® website at us.ishares.com/product_info/fund/overview/QUAL.htm. We are not incorporating by reference the website, the sources listed above or any material they include in this index supplement.
Investment Objective
The ETF seeks to provide investment results that correspond generally to the price and yield performance, before fees and expenses, of the index. The ETF’s investment objective and the index may be changed without the approval of BFA’s shareholders.
The following table displays the top holdings and weightings by industry sector of the ETF. (Sector designations are determined by the ETF sponsor using criteria it has selected or developed. Index and ETF sponsors may use very different standards for determining sector designations. In addition, many companies operate in a number of sectors, but are listed in only one sector and the basis on which that sector is selected may also differ. As a result, sector comparisons between indices or ETFs with different sponsors may reflect differences in methodology as well as actual differences in the sector composition of the indices or ETFs.) We obtained the information in the tables below from the ETF website without independent verification.
iShares® MSCI USA Quality Factor ETF Top Ten Holdings as of November 12, 2020
|
ETF Stock Issuer |
Percentage (%) |
|
APPLE INC |
4.41% |
|
NIKE INC CLASS B |
4.24% |
|
COCA-COLA |
3.96% |
|
FACEBOOK CLASS A INC |
3.95% |
|
MICROSOFT CORP |
3.40% |
|
JOHNSON & JOHNSON |
3.09% |
|
VISA INC CLASS A |
3.04% |
|
MASTERCARD INC CLASS A |
2.97% |
|
UNITEDHEALTH GROUP INC |
2.53% |
|
ILLINOIS TOOL INC |
2.26% |
|
Total |
33.85% |
S-38
iShares® MSCI USA Quality Factor ETF Weighting by Sector as of November 12, 2020*
|
Sector |
Percentage (%) |
|
Information Technology |
26.47% |
|
Health Care |
13.80% |
|
Financials |
10.18% |
|
Communication |
11.23% |
|
Consumer Discretionary |
11.79% |
|
Industrials |
9.17% |
|
Consumer Staples |
7.16% |
|
Utilities |
2.72% |
|
Real Estate |
2.97% |
|
Energy |
1.82% |
|
Materials |
2.45% |
|
Cash and/or Derivatives |
0.23% |
|
Total |
99.99% |
* Percentages may not sum to 100% due to rounding.
Representative Sampling
BFA uses a representative sampling indexing strategy to manage the ETF. This strategy involves investing in a representative sample of securities that collectively has an investment profile similar to that of the index. The securities selected are expected to have, in the aggregate, investment characteristics (based on factors such as market capitalization and industry weightings), fundamental characteristics (such as return variability and yield) and liquidity measures similar to those of the index.
The ETF generally will invest at least 90% of its assets in the component securities of the index and may invest up to 10% of its assets in certain futures, options and swap contracts, cash and cash equivalents, including shares of money market funds advised by BFA or its affiliates, as well as in securities not included in the index, but which BFA believes will help the ETF track the index. Also, the ETF may lend securities representing up to one-third of the value of the ETF’s total assets (including the value of the collateral received).
Tracking Error
The performance of the ETF and the index may vary due to a variety of factors, including differences between the securities and other instruments held in the ETF’s portfolio and those included in the index, pricing differences, transaction costs incurred by the ETF, the ETF’s holding of uninvested cash, differences in timing of the accrual of or the valuation of dividends or interest, the requirements to maintain pass-through tax treatment, portfolio transactions carried out to minimize the distribution of capital gains to shareholders, acceptance of custom baskets, changes to the index or the costs to the ETF of complying with various new or existing regulatory requirements. Tracking error also may result because the ETF incurs fees and expenses, while the index does not. BFA expects that, over time, the ETF’s tracking error will not exceed 5%. The ETF’s use of a representative sampling indexing strategy can be expected to produce a larger tracking error than would result if the ETF used a replication indexing strategy in which an ETF invests in substantially all of the securities in its index in approximately the same proportions as in the index.
As of October 31, 2020, iShares® reported the following average annual returns on the market price of the ETF’s shares and the MSCI USA Sector Neutral Quality Index. The market price of the ETF’s shares takes into account distributions on the shares and the returns shown account for changes in the mid-point of the bid and ask prices at 4:00 p.m., Eastern time on the relevant date. ETF shares: 1 year, 8.91%; 3 years, 10.34%; 5 years, 11.04%; since inception, 12.03%; MSCI USA Sector Neutral Quality Index: 1 year, 8.91%; 3 years, 10.46%; 5 years, 11.20%; since ETF inception, 12.19%.
Industry Concentration Policy
The ETF will concentrate its investments (i.e., hold 25% or more of its total assets) in a particular industry or group of industries to approximately the same extent that the index is concentrated.
The MSCI USA Sector Neutral Quality Index
The MSCI USA Sector Neutral Quality Index is designed to measure the performance of securities in the MSCI USA Index that exhibit stronger quality characteristics relative to their peers within the corresponding Global Industry Classification Standard (GICS®) sector. The MSCI USA Index includes U.S. large- and mid-capitalization stocks, as defined by MSCI Inc. (“MSCI”). MSCI divides the companies included in the MSCI USA Enhanced Value Index into eleven GICS sectors: Communication Services, Consumer Discretionary, Consumer Staples, Energy, Financials, Health Care, Industrials,
S-39
Information Technology, Materials, Real Estate and Utilities. For additional information about the MSCI USA Index, please see “iShares® MSCI USA Momentum Factor ETF — The MSCI USA Index” above.
The MSCI USA Sector Neutral Quality Index is calculated, published and disseminated daily by MSCI through numerous data vendors, on the MSCI website and in real time on Bloomberg Financial Markets and Reuters Limited. The MSCI USA Sector Neutral Quality Index was launched on December 12, 2014. Additional information about the MSCI USA Sector Neutral Quality Index is available on the following website: msci.com/index-methodology. We are not incorporating by reference the website, the sources listed above or any material they include in this index supplement.
Construction of the MSCI USA Sector Neutral Quality Index
To construct the MSCI USA Sector Neutral Quality Index, MSCI selects a predetermined number of constituent securities from the MSCI USA Index based on three main fundamental variables:
|
(i) |
high return on equity (defined as trailing 12 month earnings per share divided by book value per share), |
|
(ii) |
low earnings variability (defined as standard deviation of year-over-year earnings per share growth over the past five years), and |
|
(iii) |
low debt to equity (defined as total debt to book value). |
MSCI uses an algorithm to determine the number of constituent securities to be selected from the MSCI USA Index for inclusion in the MSCI USA Sector Neutral Quality Index with an aim to attain a high exposure to the quality factor while maintaining sufficient market capitalization and number of securities coverage. The number of components is evaluated semi-annually. MSCI assigns weights by multiplying a constituent security’s quality score by its market capitalization, as further adjusted to, among others, mitigate the impact of stock-specific risk. Weights in the MSCI USA Sector Neutral Quality Index are next normalized so that sectors in the MSCI USA Sector Neutral Quality Index represent the same relative weight as in the MSCI USA Index, thereby promoting sector neutrality. Additionally, each individual constituent security is capped at 5%.
Cap/Floor the Variable
As part of the standardization process, outlier fundamental variable values are capped/floored to ensure that the average values used to standardize the variables are less affected by extreme values. To do this, for a given variable, the values for all securities are first ranked in ascending order within the MSCI USA Index. Missing values are excluded from the ranking. Then, for securities that lie below the 5th percentile rank or above the 95th percentile rank, their value is set equal to the value of the 5th percentile ranked or 95th percentile ranked security, as applicable. This process is repeated for each of the three fundamental variables.
Calculate the Z-Scores
After capping/flooring the three fundamental variables within the MSCI USA Index, the z-score with respect to each of the three fundamental variables for each security is calculated using the mean and standard deviation of the relevant variable within the MSCI USA Index. The z-score for each individual security generally measures the extent to which an individual security is an outlier with respect to a particular variable compared to all of the constituent securities included in the MSCI USA Index, measured in terms of standard deviations, and is calculated as follows:
|
(i) |
with respect to return on equity, the “z-score” equals (i) (a) the capped/floored return on equity for such security minus (b) the mean of the capped/floored returns on equity for all of the securities in the MSCI USA Index divided by (ii) the standard deviation of the capped/floored returns on equity for the securities in the MSCI USA Index; and |
|
(ii) |
with respect to debt to equity and earnings variability, the “z-score” equals the negative (to ensure securities of companies with higher debt to equity or higher variable earnings are ranked lower) of (i) (a) the capped/floored debt to equity/earnings variability for such security minus (b) the mean of the capped/floored debt to equity/earnings variability for all of the securities in the MSCI USA Index divided by (ii) the standard deviation of the capped/floored debt to equity/earnings variability for the securities in the MSCI USA Index. |
Calculate the Quality Score
After standardizing each of the three variable values for each security and calculating z-scores with respect to each of the three fundamental variables, a “composite quality z-score” for each security is computed by averaging the z-scores of the
S-40
three fundamental variables. Computation of the composite quality z-score also depends on the availability of fundamental variables, as described below.
|
Case |
Detail |
Action |
|
Case 1 |
return on equity is missing |
If return on equity is missing, composite quality z-score is not calculated and the security will not be part of the MSCI USA Sector Neutral Quality Index |
|
Case 2 |
debt to equity is missing, but other two variables are available |
composite quality z-score is calculated using return on equity and earnings variability z-scores |
|
Case 3 |
earnings variability is missing, but other two variables are available |
composite quality z-score is calculated using return on equity and debt to equity z-scores |
|
Case 4 |
debt to equity and earnings variability are missing but return on equity is available |
composite quality z-score is not calculated and the security will not be part of the MSCI USA Sector Neutral Quality Index |
|
Case 5 |
All three variables are missing |
Security will not be part of the MSCI USA Sector Neutral Quality Index |
The “quality score” is then computed from the composite quality z-score as follows:
|
(i) |
If the composite quality z-score is greater than 0, the quality score equals 1 plus the composite quality z-score; or |
|
(ii) |
If the composite quality z-score is less than 0, the quality score equals the quotient of (i) 1 divided by (ii) the difference of 1 minus the composite quality z-score |
Security Selection
In order to be selected for inclusion in the MSCI USA Sector Neutral Quality Index, a constituent security’s quality score must rank among the highest quality scores in the MSCI USA Index. The number of securities targeted for inclusion in the MSCI USA Sector Neutral Quality Index at initial construction and upon each rebalancing is then determined based on certain rules relating to free-float market capitalization (market price per share multiplied by the number of shares held by non-controlling interests) and numbers of constituent securities as described below.
Initial Construction. The number of securities targeted for inclusion in the MSCI USA Sector Neutral Quality Index at initial construction (or on any semi-annual rebalancing when the initial construction methodology is required to be applied, as described below under the caption “—Rebalancing”) is determined by (i) ranking each constituent security in the MSCI USA Index according to its quality score (using such securities’ weights in the MSCI USA Index if multiple securities have the same score) and (ii) applying the following rules in order of priority:
|
• |
if the MSCI USA Index has 25 or fewer constituent securities on the relevant date, each constituent security in the MSCI USA Index is included as a constituent security in the MSCI USA Sector Neutral Quality Index; or |
|
• |
if 25 or fewer of the highest ranking MSCI USA Index constituent securities account for at least 30% of the MSCI USA Index’s free-float market capitalization, the target number of Quality Index constituent securities will be 25, subject to the rounding rules; or |
|
• |
if 25 of the highest ranking MSCI USA Index constituent securities do not account for at least 30% of the MSCI USA Index’s free-float market capitalization, but the top 10% of the highest ranking MSCI USA Index constituent securities do account for at least 30% of the MSCI USA Index’s free-float market capitalization, the number of constituent securities constituting the top 10% of the highest ranking MSCI USA Index constituent securities, after rounding, is the number of securities targeted for inclusion in the MSCI USA Sector Neutral Quality Index; or |
S-41
|
constituent securities, such rounded number is the number of securities targeted for inclusion in the MSCI USA Sector Neutral Quality Index; or |
|
• |
if the number of top ranking MSCI USA Index constituent securities accounting for 30% of the MSCI USA Index’s free-float market capitalization, after rounding, account for 40% or more of the total number of MSCI USA Index constituent securities, eliminate each of the lowest ranking MSCI USA Index constituent securities from such rounded number until the number of those remaining account for 40% or less of the total number of MSCI USA Index constituent securities; and |
|
|
o |
if the remaining MSCI USA Index constituent securities account for at least 20% of the MSCI USA Index’s free-float market capitalization, the number of such remaining MSCI USA Index constituent securities, after rounding, is the number of securities targeted for inclusion in the MSCI USA Sector Neutral Quality Index; or |
|
|
o |
if the remaining MSCI USA Index constituent securities account for less than 20% of the MSCI USA Index’s free-float market capitalization, add back the next highest ranking MSCI USA Index constituent securities previously eliminated until the MSCI USA Sector Neutral Quality Index’s constituent securities account for at least 20% of the MSCI USA Index’s public float and such number of MSCI USA Index constituent securities, after rounding, is the number of securities targeted for inclusion in the MSCI USA Sector Neutral Quality Index. |
Where indicated above, the following rounding conventions apply:
|
• |
if the number of constituent securities is less than 100, round to the nearest 10 constituent securities; |
|
• |
if the number of constituent securities is greater than or equal to 100 but less than 300, round to the nearest 25 constituent securities; and |
|
• |
if the number of constituent securities is greater than or equal to 300, round to the nearest 50 constituent securities. |
Rebalancing. The target number of securities for inclusion in the MSCI USA Sector Neutral Quality Index at each semi-annual rebalancing is determined by applying the following rules in order of priority:
|
• |
if the target number of MSCI USA Sector Neutral Quality Index constituent securities on the immediately preceding rebalancing date or initial construction (following rebalancing or construction) exceeds the number of MSCI USA Index constituent securities on the rebalancing date, the initial construction methodology described above should be applied to determine the number of constituent securities to be included in the MSCI USA Sector Neutral Quality Index; or |
|
• |
if the MSCI USA Index has 25 or fewer constituent securities on the rebalancing date, each constituent security in the MSCI USA Index is included as a constituent security in the MSCI USA Sector Neutral Quality Index; or |
|
• |
if the number of constituent securities included in the MSCI USA Index on the immediately preceding rebalancing or initial construction date (following rebalancing or construction) is less than 25, repeat the initial construction process described above to determine the number of constituent securities to be included in the MSCI USA Sector Neutral Quality Index; or |
|
• |
if the constituent securities of the MSCI USA Sector Neutral Quality Index determined on the rebalancing or initial construction date (following rebalancing or construction) immediately preceding the semi-annual rebalancing date account for less than 10% of the MSCI USA Index’s free-float market capitalization on the current rebalancing date, repeat the initial construction process described above to determine the constituent securities to be included in the MSCI USA Sector Neutral Quality Index; or |
|
• |
otherwise, the target number of MSCI USA Sector Neutral Quality Index constituent securities will not change from the immediately preceding rebalancing or construction date (following rebalancing or construction). |
Weighting Scheme
The securities selected in the previous step are assigned weights in proportion to their market capitalization weight in the MSCI USA Index and quality score. These weights are then updated to implement sector neutrality (i.e., the weight of each sector in the MSCI USA Sector Neutral Quality Index is equated with the weight of that sector in the MSCI USA Index). This is done by normalizing the weights of the constituents within each sector to reflect the effective MSCI USA Index sector weight. Additionally, each individual constituent security is capped at 5%.
Maintenance of the MSCI USA Sector Neutral Quality Index
The MSCI USA Sector Neutral Quality Index is rebalanced semi-annually and the changes from the rebalancing are made as of the close of the last business day of each May and November, to coincide with the semi-annual index reviews of the
S-42
MSCI USA Index. The pro forma MSCI USA Sector Neutral Quality Index is generally announced nine business days before the effective date.
Buffer Rules
In selecting securities for inclusion in the MSCI USA Sector Neutral Quality Index on any rebalancing date, certain buffer rules are applied to maintain continuity and reduce turnover in constituent securities. Although 80% of the positions in the rebalancing will be selected from among the highest ranking MSCI USA Index constituent securities without regard to whether they are currently included in the MSCI USA Sector Neutral Quality Index, existing constituent securities of the MSCI USA Sector Neutral Quality Index as of the rebalancing date (prior to effecting the rebalancing) will be given priority for the next 20% of constituent security positions. If the target number of Quality Index constituent securities is not achieved after this step, the highest ranking remaining MSCI USA Index constituent securities are added until the target number is achieved.
Ongoing Event Related Changes
The general treatment of corporate events in the MSCI USA Sector Neutral Quality Index aims to minimize turnover outside of index reviews. The methodology aims to appropriately represent an investor’s participation in an event based on relevant deal terms and pre-event weighting of the index constituents that are involved. Further, changes in index market capitalization that occur as a result of corporate event implementation will be offset by a corresponding change in the variable weighting factor of the constituent.
Additionally, if the frequency of index reviews in the MSCI USA Index is greater than the frequency of index reviews in the MSCI USA Sector Neutral Quality Index, the changes made to the MSCI USA Index during intermediate index reviews will be neutralized in the MSCI USA Sector Neutral Quality Index.
The following section briefly describes the treatment of common corporate events within the MSCI USA Sector Neutral Quality Index.
No new securities will be added (except where noted below) to the MSCI USA Sector Neutral Quality Index between index reviews. MSCI USA Index deletions will be reflected simultaneously.
|
Event Type |
Event Details |
|
New additions to the MSCI USA Index |
A new security added to the MSCI USA Index (such as IPO and other early inclusions) will not be added to the MSCI USA Sector Neutral Quality Index. |
|
Spin-Offs |
All securities created as a result of the spin-off of an existing MSCI USA Sector Neutral Quality Index constituent will be added to the MSCI USA Sector Neutral Quality Index at the time of event implementation. Reevaluation for continued inclusion in the MSCI USA Sector Neutral Quality Index will occur at the subsequent index review. |
|
Merger/acquisition |
For mergers and acquisitions, the acquirer’s post event weight will account for the proportionate amount of shares involved in deal consideration, while cash proceeds will be invested across the MSCI USA Sector Neutral Quality Index.
If an existing MSCI USA Sector Neutral Quality Index constituent is acquired by a security that is not a constituent of the MSCI USA Sector Neutral Quality Index, the existing constituent will be deleted from the MSCI USA Sector Neutral Quality Index and the acquiring non-constituent will not be added to the MSCI USA Sector Neutral Quality Index. |
|
Changes in security characteristics |
A security will continue to be a constituent of the MSCI USA Sector Neutral Quality Index if there are changes in characteristics (country, sector, size segment, etc.). Reevaluation for continued inclusion in the MSCI USA Sector Neutral Quality Index will occur at the subsequent index review. |
S-43
Historical Closing Prices of the ETF’s Shares
The closing price of shares of the ETF has fluctuated in the past and may, in the future, experience significant fluctuations. Any historical upward or downward trend in the closing price of the shares during the period shown below is not an indication that the shares are more or less likely to increase or decrease at any time during the life of your notes.
You should not take the historical closing prices of the shares as an indication of the future performance of the shares. We cannot give you any assurance that the future performance of the shares will result in your receiving an amount greater than the outstanding face amount of your notes on the stated maturity date. Neither we nor any of our affiliates make any representation to you as to the performance of the shares. Before investing in the offered notes, you should consult publicly available information to determine the relevant ETF closing prices between the date of this index supplement and the date of your purchase of the offered notes. The actual performance of the ETF over the life of the offered notes, as well as the cash settlement amount at maturity may bear little relation to the historical prices shown below.
The graph below shows the daily historical prices of the shares of the ETF from January 1, 2015 through November 12, 2020. We obtained the closing prices shown in the graph below from Bloomberg Financial Services without independent verification. In the graph, historical closing prices after the ETF began tracking the MSCI USA Sector Neutral Quality Index on September 1, 2015 can be found to the right of the vertical solid line marker. Closing prices to the left of the vertical solid line marker reflect the ETF closing prices before the ETF began tracking the MSCI USA Sector Neutral Quality Index on September 1, 2015.
Historical Performance of iShares® MSCI USA Quality Factor ETF

“iShares®” is a registered trademark of BlackRock Institutional Trust Company, N.A. (“BITC”). The index is not sponsored, endorsed, sold, or promoted by BITC. BITC makes no representations or warranties to the owners of the index or any member of the public regarding the advisability of investing in the index. BITC has no obligation or liability in connection with the operation, marketing, trading or sale of the index.
S-44
iShares® MSCI USA Size Factor ETF
The shares of the iShares® MSCI USA Size Factor ETF (the “ETF”) are issued by iShares® Trust, a registered investment company.
|
• |
The ETF is a tracking ETF that seeks investment results which correspond generally to the price and yield performance, before fees and expenses, of the MSCI USA Low Size Index (the “index”). Prior to December 3, 2018, the ETF tracked the MSCI USA Risk Weighted Index. The inception date of the index was September 11, 2018. |
|
• |
The ETF’s investment advisor is BlackRock Fund Advisors (“BFA”). |
|
• |
The ETF’s shares trade on the NYSE Arca under the ticker symbol “SIZE”. |
|
• |
The iShares® Trust’s SEC CIK Number is 0001100663. |
|
• |
The ETF’s inception date was April 16, 2013. |
|
• |
The ETF’s shares are issued or redeemed only in creation units of 50,000 shares or multiples thereof. |
Effective August 17, 2020, the name of the ETF changed from the iShares® Edge MSCI USA Size Factor ETF to the iShares® MSCI USA Size Factor ETF.
We obtained the following fee information from the iShares® website without independent verification. The investment advisor is paid a management fee from the ETF based on a percentage of the ETF’s average daily net assets, at the annual rate of 0.15%. BFA may from time to time voluntarily waive and/or reimburse fees or expenses in order to limit total annual ETF operating expenses (excluding acquired fund fees and expenses, if any). Any such voluntary waiver or reimbursement may be eliminated by BFA at any time. As of September 30, 2020, the aggregate expense ratio of the ETF was 0.15% per annum.
For additional information regarding iShares® Trust or BFA, please consult the reports (including the Annual Report to Shareholders on Form N-CSR for the fiscal year ended July 31, 2020) and other information iShares® Trust files with the SEC. In addition, information regarding the ETF, including its top portfolio holdings, may be obtained from other sources including, but not limited to, press releases, newspaper articles, other publicly available documents, and the iShares® website at us.ishares.com/product_info/fund/overview/SIZE.htm. We are not incorporating by reference the website, the sources listed above or any material they include in this index supplement.
Investment Objective
The ETF seeks to provide investment results that correspond generally to the price and yield performance, before fees and expenses, of the index. The ETF’s investment objective and the index may be changed without the approval of BFA’s shareholders.
The following table displays the top holdings and weightings by industry sector of the ETF. (Sector designations are determined by the ETF sponsor using criteria it has selected or developed. Index and ETF sponsors may use very different standards for determining sector designations. In addition, many companies operate in a number of sectors, but are listed in only one sector and the basis on which that sector is selected may also differ. As a result, sector comparisons between indices or ETFs with different sponsors may reflect differences in methodology as well as actual differences in the sector composition of the indices or ETFs.) We obtained the information in the tables below from the ETF website without independent verification.
iShares® MSCI USA Size Factor ETF Top Ten Holdings as of November 12, 2020
|
ETF Stock Issuer |
Percentage (%) |
|
PINTEREST INC CLASS A |
0.43% |
|
MORGAN STANLEY |
0.37% |
|
CHARLES SCHWAB CORP |
0.36% |
|
MATCH GROUP INC |
0.35% |
|
TRADE DESK INC CLASS A |
0.33% |
|
ZOOM VIDEO COMMUNICATIONS INC CLASS A |
0.31% |
|
TESLA INC |
0.31% |
|
FEDEX CORP |
0.30% |
|
SNAP INC CLASS A |
0.30% |
|
INVESCO LTD |
0.29% |
|
Total |
3.35% |
S-45
iShares® MSCI USA Size Factor ETF Weighting by Sector as of November 12, 2020*
|
Sector |
Percentage (%) |
|
Information Technology |
17.55% |
|
Health Care |
11.88% |
|
Industrials |
14.47% |
|
Financials |
15.06% |
|
Consumer Discretionary |
10.34% |
|
Consumer Staples |
5.10% |
|
Real Estate |
6.06% |
|
Communication |
6.02% |
|
Utilities |
4.95% |
|
Materials |
5.79% |
|
Energy |
2.50% |
|
Cash and/or Derivatives |
0.27% |
|
Total |
99.99% |
* Percentages may not sum to 100% due to rounding.
Representative Sampling
BFA uses a representative sampling indexing strategy to manage the ETF. This strategy involves investing in a representative sample of securities that collectively has an investment profile similar to that of the index. The securities selected are expected to have, in the aggregate, investment characteristics (based on factors such as market capitalization and industry weightings), fundamental characteristics (such as return variability and yield) and liquidity measures similar to those of the index.
The ETF generally will invest at least 90% of its assets in the component securities of the index and may invest up to 10% of its assets in certain futures, options and swap contracts, cash and cash equivalents, including shares of money market funds advised by BFA or its affiliates, as well as in securities not included in the index, but which BFA believes will help the ETF track the index. Also, the ETF may lend securities representing up to one-third of the value of the ETF’s total assets (including the value of the collateral received).
Tracking Error
The performance of the ETF and the index may vary due to a variety of factors, including differences between the securities and other instruments held in the ETF’s portfolio and those included in the index, pricing differences, transaction costs incurred by the ETF, the ETF’s holding of uninvested cash, differences in timing of the accrual of or the valuation of dividends or interest, the requirements to maintain pass-through tax treatment, portfolio transactions carried out to minimize the distribution of capital gains to shareholders, acceptance of custom baskets, changes to the index or the costs to the ETF of complying with various new or existing regulatory requirements. Tracking error also may result because the ETF incurs fees and expenses, while the index does not. BFA expects that, over time, the ETF’s tracking error will not exceed 5%. The ETF’s use of a representative sampling indexing strategy can be expected to produce a larger tracking error than would result if the ETF used a replication indexing strategy in which an ETF invests in substantially all of the securities in its index in approximately the same proportions as in the index.
As of October 31, 2020, iShares® reported the following average annual returns on the market price of the ETF’s shares and the MSCI USA Low Size Index. The market price of the ETF’s shares takes into account distributions on the shares and the returns shown account for changes in the mid-point of the bid and ask prices at 4:00 p.m., Eastern time on the relevant date. ETF shares: 1 year, 3.63%; 3 years, 7.04%; 5 years, 9.35%; since inception, 10.52%; MSCI USA Low Size Index: 1 year, 3.73%; 3 years, 7.17%; 5 years, 9.49%; since ETF inception, 10.68%.
Industry Concentration Policy
The ETF will concentrate its investments (i.e., hold 25% or more of its total assets) in a particular industry or group of industries to approximately the same extent that the index is concentrated.
The MSCI USA Low Size Index
The MSCI USA Low Size Index is designed to emphasize the stock performance of small market-capitalization companies included in a traditional market capitalization weighted parent index, the MSCI USA Index. The MSCI USA Index includes U.S. large- and mid-capitalization stocks, as defined by MSCI, Inc. (“MSCI”). For additional information about the MSCI USA Index, please see “iShares® MSCI USA Momentum Factor ETF — The MSCI USA Index” above.
S-46
The MSCI USA Low Size Index is calculated, published and disseminated daily by MSCI through numerous data vendors, on the MSCI website and in real time on Bloomberg Financial Markets and Reuters Limited. The MSCI USA Low Size Index was launched on September 11, 2018. Additional information about the MSCI USA Low Size Index is available on the following website: msci.com/index-methodology. We are not incorporating by reference the website, the sources listed above or any material they include in this index supplement.
Construction of the MSCI USA Low Size Index
The MSCI USA Low Size Index is constructed by applying a mathematical formula at each rebalancing that reweights the components of its market capitalization-weighted MSCI USA Index, such that the representation of smaller capitalization companies is increased relative to larger capitalization companies (by assigning weights in the inverse proportion of natural logarithm of total issuer market capitalization of the constituents of the MSCI USA Index). In addition, at each rebalancing, MSCI calculates a “constraint factor” for each component. The constraint factor is the ratio of the component’s weight in the MSCI USA Low Size Index to that component’s weight in the MSCI USA Index. The constraint factor is held constant between each index review, except in the case of certain corporate events, as defined by MSCI. Changes in the relative weight of an individual component in the MSCI USA Index due to market appreciation/depreciation result in that component increasing/decreasing in weight in the MSCI USA Low Size Index to hold the constraint factor for that component constant between each rebalancing.
Maintenance of the MSCI USA Low Size Index
The MSCI USA Low Size Index is rebalanced semi-annually and the changes from the rebalancing are made as of the close of the last business day of each May and November, to coincide with the semi-annual index reviews of the MSCI USA Index. The pro forma MSCI USA Low Size Index is generally announced nine business days before the effective date.
Ongoing Event Related Changes
The general treatment of corporate events in the MSCI USA Low Size Index aims to minimize turnover outside of index reviews. The methodology aims to appropriately represent an investor’s participation in an event based on relevant deal terms and pre-event weighting of the index constituents that are involved. Further, changes in index market capitalization that occur as a result of corporate event implementation will be offset by a corresponding change in the variable weighting factor of the constituent.
Additionally, if the frequency of index reviews in the MSCI USA Index is greater than the frequency of index reviews in the MSCI USA Low Size Index, the changes made to the MSCI USA Index during intermediate index reviews will be neutralized in the MSCI USA Low Size Index.
The following section briefly describes the treatment of common corporate events within the MSCI USA Low Size Index.
No new securities will be added (except where noted below) to the MSCI USA Low Size Index between index reviews. MSCI USA Index deletions will be reflected simultaneously.
|
Event Type |
Event Details |
|
New additions to the MSCI USA Index |
A new security added to the MSCI USA Index (such as IPO and other early inclusions) will be added to the MSCI USA Low Size Index at an estimated full market capitalization adjustment factor on the date of security inclusion. |
|
Spin-Offs |
All securities created as a result of the spin-off of an existing MSCI USA Low Size Index constituent will be added to the MSCI USA Low Size Index at the time of event implementation. Reevaluation for continued inclusion in the MSCI USA Low Size Index will occur at the subsequent index review. |
|
Merger/acquisition |
For mergers and acquisitions, the acquirer’s post event weight will account for the proportionate amount of shares involved in deal consideration, while cash proceeds will be invested across the MSCI USA Low Size Index.
If an existing MSCI USA Low Size Index constituent is acquired by a security that is not a constituent of the MSCI USA Low Size Index, the existing constituent will be deleted from the MSCI USA Low Size Index and the acquiring non-constituent will not be added to the MSCI USA Low Size Index. |
|
Changes in security characteristics |
A security will continue to be a constituent of the MSCI USA Low Size Index if there are changes in characteristics (country, sector, size segment, etc.). Reevaluation for continued inclusion in the MSCI USA Low Size Index will occur at the subsequent index review. |
S-47
Historical Closing Prices of the ETF’s Shares
The closing price of shares of the ETF has fluctuated in the past and may, in the future, experience significant fluctuations. Any historical upward or downward trend in the closing price of the shares during the period shown below is not an indication that the shares are more or less likely to increase or decrease at any time during the life of your notes.
You should not take the historical closing prices of the shares as an indication of the future performance of the shares. We cannot give you any assurance that the future performance of the shares will result in your receiving an amount greater than the outstanding face amount of your notes on the stated maturity date. Neither we nor any of our affiliates make any representation to you as to the performance of the shares. Before investing in the offered notes, you should consult publicly available information to determine the relevant ETF closing prices between the date of this index supplement and the date of your purchase of the offered notes. The actual performance of the ETF over the life of the offered notes, as well as the cash settlement amount at maturity may bear little relation to the historical prices shown below.
The graph below shows the daily historical prices of the shares of the ETF from January 1, 2015 through November 12, 2020. We obtained the closing prices shown in the graph below from Bloomberg Financial Services without independent verification. In the graph, historical closing prices after the ETF began tracking the MSCI USA Low Size Index on December 3, 2018 can be found to the right of the vertical solid line marker. Closing prices to the left of the vertical solid line marker reflect the ETF closing prices before the ETF began tracking the MSCI USA Low Size Index on December 3, 2018.
Historical Performance of iShares® MSCI USA Size Factor ETF

“iShares®” is a registered trademark of BlackRock Institutional Trust Company, N.A. (“BITC”). The index is not sponsored, endorsed, sold, or promoted by BITC. BITC makes no representations or warranties to the owners of the index or any member of the public regarding the advisability of investing in the index. BITC has no obligation or liability in connection with the operation, marketing, trading or sale of the index.
S-48
iShares® MSCI USA Min Vol Factor ETF
The shares of the iShares® MSCI USA Min Vol Factor ETF (the “ETF”) are issued by iShares® Trust, a registered investment company.
|
• |
The ETF is a tracking ETF that seeks investment results which correspond generally to the price and yield performance, before fees and expenses, of the MSCI USA Minimum Volatility Index (the “index”). |
|
• |
The ETF’s investment advisor is BlackRock Fund Advisors (“BFA”). |
|
• |
The ETF’s shares trade on the CBOE BZX under the ticker symbol “USMV”. |
|
• |
The iShares® Trust’s SEC CIK Number is 0001100663. |
|
• |
The ETF’s inception date was October 18, 2011. |
|
• |
The ETF’s shares are issued or redeemed only in creation units of 100,000 shares or multiples thereof. |
Effective August 17, 2020, the name of the ETF changed from the iShares® Edge MSCI Min Vol USA ETF to the iShares® MSCI USA Min Vol Factor ETF.
We obtained the following fee information from the iShares® website without independent verification. The investment advisor is paid a management fee from the ETF based on a percentage of the ETF’s average daily net assets, at the annual rate of 0.15%. BFA may from time to time voluntarily waive and/or reimburse fees or expenses in order to limit total annual ETF operating expenses (excluding acquired fund fees and expenses, if any). Any such voluntary waiver or reimbursement may be eliminated by BFA at any time. As of September 30, 2020, the aggregate expense ratio of the ETF was 0.15% per annum.
For additional information regarding iShares® Trust or BFA, please consult the reports (including the Annual Report to Shareholders on Form N-CSR for the fiscal year ended July 31, 2020) and other information iShares® Trust files with the SEC. In addition, information regarding the ETF, including its top portfolio holdings, may be obtained from other sources including, but not limited to, press releases, newspaper articles, other publicly available documents, and the iShares® website at us.ishares.com/product_info/fund/overview/USMV.htm. We are not incorporating by reference the website, the sources listed above or any material they include in this index supplement.
Investment Objective
The ETF seeks to provide investment results that correspond generally to the price and yield performance, before fees and expenses, of the index. The ETF’s investment objective and the index may be changed without the approval of BFA’s shareholders.
The following table displays the top holdings and weightings by industry sector of the ETF. (Sector designations are determined by the ETF sponsor using criteria it has selected or developed. Index and ETF sponsors may use very different standards for determining sector designations. In addition, many companies operate in a number of sectors, but are listed in only one sector and the basis on which that sector is selected may also differ. As a result, sector comparisons between indices or ETFs with different sponsors may reflect differences in methodology as well as actual differences in the sector composition of the indices or ETFs.) We obtained the information in the tables below from the ETF website without independent verification.
iShares® MSCI USA Min Vol Factor ETF Top Ten Holdings as of November 12, 2020
|
ETF Stock Issuer |
Percentage (%) |
|
NEXTERA ENERGY INC |
1.78% |
|
T MOBILE US INC |
1.72% |
|
MCDONALDS CORP |
1.58% |
|
REPUBLIC SERVICES INC |
1.56% |
|
WASTE MANAGEMENT INC |
1.53% |
|
MICROSOFT CORP |
1.51% |
|
VERIZON COMMUNICATIONS INC |
1.49% |
|
VISA INC CLASS A |
1.47% |
|
COCA-COLA |
1.46% |
|
PEPSICO INC |
1.46% |
|
Total |
15.56% |
S-49
iShares® MSCI USA Min Vol Factor ETF Weighting by Sector as of November 12, 2020*
|
Sector |
Percentage (%) |
|
Information Technology |
22.03% |
|
Financials |
11.73% |
|
Consumer Staples |
11.99% |
|
Health Care |
15.49% |
|
Utilities |
8.62% |
|
Consumer Discretionary |
7.12% |
|
Real Estate |
4.97% |
|
Industrials |
7.52% |
|
Communication |
6.72% |
|
Materials |
2.68% |
|
Energy |
0.86% |
|
Cash and/or Derivatives |
0.26% |
|
Total |
99.99% |
* Percentages may not sum to 100% due to rounding.
Representative Sampling
BFA uses a representative sampling indexing strategy to manage the ETF. This strategy involves investing in a representative sample of securities that collectively has an investment profile similar to that of the index. The securities selected are expected to have, in the aggregate, investment characteristics (based on factors such as market capitalization and industry weightings), fundamental characteristics (such as return variability and yield) and liquidity measures similar to those of the index.
The ETF generally will invest at least 90% of its assets in the component securities of the index. The ETF may invest up to 10% of its assets in certain futures, options and swap contracts, cash and cash equivalents, including shares of money market funds advised by BFA or its affiliates, as well as in securities not included in the index, but which BFA believes will help the ETF track the index. Also, the ETF may lend securities representing up to one-third of the value of the ETF’s total assets (including the value of the collateral received).
Tracking Error
The performance of the ETF and the index may vary due to a variety of factors, including differences between the securities and other instruments held in the ETF’s portfolio and those included in the index, pricing differences, transaction costs incurred by the ETF, the ETF’s holding of uninvested cash, differences in timing of the accrual of or the valuation of dividends or interest, the requirements to maintain pass-through tax treatment, portfolio transactions carried out to minimize the distribution of capital gains to shareholders, acceptance of custom baskets, changes to the index or the costs to the ETF of complying with various new or existing regulatory requirements. Tracking error also may result because the ETF incurs fees and expenses, while the index does not. BFA expects that, over time, the ETF’s tracking error will not exceed 5%. The ETF’s use of a representative sampling indexing strategy can be expected to produce a larger tracking error than would result if the ETF used a replication indexing strategy in which an ETF invests in substantially all of the securities in its index in approximately the same proportions as in the index.
As of October 31, 2020, iShares® reported the following average annual returns on the market price of the ETF’s shares and the MSCI USA Minimum Volatility Index. The market price of the ETF’s shares takes into account distributions on the shares and the returns shown account for changes in the mid-point of the bid and ask prices at 4:00 p.m., Eastern time on the relevant date. ETF shares: 1 year, -1.45%; 3 years, 8.51%; 5 years, 10.26%; since inception, 12.61%; MSCI USA Minimum Volatility Index: 1 year, -1.40%; 3 years, 8.65%; 5 years, 10.42%; 10 years, 12.68%; since ETF inception, 12.78%.
Industry Concentration Policy
The ETF will concentrate its investments (i.e., hold 25% or more of its total assets) in a particular industry or group of industries to approximately the same extent that the index is concentrated.
MSCI USA Minimum Volatility Index
The MSCI USA Minimum Volatility Index is designed to measure the performance of securities in the MSCI USA Index that, in the aggregate, have lower volatility relative to the large- and mid-cap U.S. equity market. The MSCI USA Index includes U.S. large- and mid-capitalization stocks, as defined by MSCI, Inc. (“MSCI”). For additional information about the MSCI USA Index, please see “iShares® MSCI USA Momentum Factor ETF — The MSCI USA Index” above. MSCI divides the companies included in the MSCI USA Minimum Volatility Index into eleven GICS sectors: Communication Services,
S-50
Consumer Discretionary, Consumer Staples, Energy, Financials, Health Care, Industrials, Information Technology, Materials, Real Estate and Utilities.
The MSCI USA Minimum Volatility Index is calculated, published and disseminated daily by MSCI through numerous data vendors, on the MSCI website and in real time on Bloomberg Financial Markets and Reuters Limited. The MSCI USA Minimum Volatility Index was launched on June 2, 2008. Additional information about the MSCI USA Minimum Volatility Index is available on the following website: msci.com/index-methodology, which we are not incorporating by reference in this index supplement.
Construction of the MSCI USA Minimum Volatility Index
The MSCI USA Minimum Volatility Index seeks to optimize the MSCI USA Index, in U.S. dollars, for the lowest absolute risk within a given set of constraints: (i) minimum and maximum component weights, (ii) limitations on divergence in sector representation and non-volatility related factor exposures between the MSCI USA Minimum Volatility Index and the MSCI USA Index and (iii) turnover in the MSCI USA Minimum Volatility Index.
Details about the Barra multi-factor risk models are available at msci.com/portfolio-management, which we are not incorporating by reference in this index supplement
At each semi-annual index review, the following optimization constraints are employed, which aim to ensure replicability and investability while achieving the lowest volatility for a given set of constraints.
|
• |
The maximum weight of an index constituent will be restricted to the lower of 1.5% or 20 times the weight of the security in the MSCI USA Index. |
|
• |
The minimum weight of an index constituent will be 0.05%. |
|
• |
The sector weights of the MSCI USA Minimum Volatility Index will not deviate more than +/-5% from the sector weights of the MSCI USA Index. MSCI divides the companies included in the MSCI USA Minimum Volatility Index into eleven GICS sectors: Communication Services, Consumer Discretionary, Consumer Staples, Energy, Financials, Health Care, Industrials, Information Technology, Materials, Real Estate and Utilities. |
|
• |
No constraint will be applied on the exposure of the MSCI USA Minimum Volatility Index to volatility-related risk index factors (beta volatility and residual volatility). Exposure to all other risk index factors will be restricted to +/-0.25 standard deviations relative to the MSCI USA Index. |
|
• |
The one way turnover of the MSCI USA Minimum Volatility Index is constrained to a maximum of 10%. |
The MSCI USA Minimum Volatility Index is constructed using the Barra Optimizer in combination with the relevant Barra Equity Model. The optimization uses the MSCI USA Index as the universe of eligible securities and the specified optimization objective and constraints to determine the optimal MSCI USA Minimum Volatility Index. The Barra Optimizer determines the optimal solution, i.e. the portfolio with the lowest total risk, using an estimated security co-variance matrix under the applicable investment constraints. The MSCI USA Minimum Volatility Index seeks to have the lowest absolute volatility based on the set of constraints.
Optimization Settings
The MSCI USA Minimum MSCI USA Minimum Volatility Index is constructed using the Barra Optimizer in combination with the relevant Barra Equity Model. The following optimization settings are applied to construct the MSCI USA Minimum Volatility Index.
Specify “Initial Portfolio” and “Trade Universe” settings on the Barra Optimizer
|
• |
“Initial portfolio” is set as the current MSCI USA Minimum Volatility Index, using the constituent weights as of the close of the rebalancing date (before the rebalancing) updated for corporate actions up to the effective date of the rebalancing. When there is no current MSCI USA Minimum Volatility Index (for example, when no optimization has been applied to the MSCI USA Index yet), the initial portfolio is set to be to the MSCI USA Index. |
|
• |
“Trade universe” is set to be the index constituents of the MSCI USA Index. |
Specify Risk Model
|
• |
The factor exposures for all the securities in the trade universe are set using the most recent monthly release of factor exposure data of the relevant Barra Equity Model. |
|
• |
The common factor co-variances are set using the most recent monthly release of factor co-variance data of the relevant Barra Equity Model. |
S-51
|
• |
The specific co-variances of all securities in the trade universe are set using the most recent monthly release of specific co-variances data of the relevant Barra Equity Model. |
Setup Utility function
|
• |
The optimization objective is to find a pro forma MSCI USA Minimum Volatility Index that minimizes the total risk of MSCI USA Index, as determined by the relevant Barra Equity Model. The risk aversion parameters used in the optimization are as follows: |
|
|
o |
Common factor risk aversion = 0.0075 |
|
|
o |
Specific risk aversion = 0.075 |
Setup Constraints for Initial Construction
|
• |
The maximum weight of an index constituent will be restricted to the lower of 1.5% or 20 times the weight of the security in the MSCI USA Index. |
|
• |
The minimum weight of an index constituent will be 0.05%. |
|
• |
The sector weights of the MSCI USA Minimum Volatility Index will not deviate more than +/-5% from the sector weights of the MSCI USA Index. |
|
• |
No constraint will be applied on the exposure of the MSCI USA Minimum Volatility Index to the Beta and Residual Volatility risk index factors. Exposure to all other risk index factors will be restricted to +/-0.25 standard deviations relative to the MSCI USA Index. |
Additional Setup constraints for Semi-Annual Index Reviews
|
• |
The one way turnover of the MSCI USA Minimum Volatility Index is constrained to a maximum of 10% |
Handling Indefeasible Optimizations
During the semi-annual index review, in the event that there is no optimal solution that satisfies all the optimization constraints defined above, the following constraints will be relaxed, until an optimal solution is found:
|
• |
Relax the turnover constraint in steps of 5%, up to a maximum of 30% |
|
• |
Relax the minimum weight constraint in steps of 0.01% up to a minimum of 0.01%. |
In the event that no optimal solution is found after the above constraints have been relaxed, the MSCI USA Minimum Volatility Index will not be rebalanced for that semi-annual index review.
Maintenance of the MSCI USA Minimum Volatility Index
The MSCI USA Minimum Volatility Index is rebalanced semi-annually and the changes from the rebalancing are made as of the close of the last business day of each May and November, to coincide with the semi-annual index reviews of the MSCI USA Index. The pro forma MSCI USA Minimum Volatility Index is generally announced nine business days before the effective date.
The security co-variance matrix used to determine the MSCI USA Minimum Volatility Index is maintained on a monthly basis. For the May and the November semi-annual MSCI USA Minimum Volatility Index reviews, the security covariance matrices as of the end of April and the end of October are used respectively.
At each rebalancing, a constraint factor is calculated for each constituent in the MSCI USA Minimum Volatility Index. The constraint factor is defined as the weight in the MSCI USA Minimum Volatility Index at the time of the rebalancing divided by the weight in the MSCI USA Index. The constraint factor as well as the constituents in the index remains constant between index reviews except in case of corporate events as described below.
Ongoing Event Related Changes
The general treatment of corporate events in the MSCI USA Minimum Volatility Index aims to minimize turnover outside of index reviews. The methodology aims to appropriately represent an investor’s participation in an event based on relevant deal terms and pre-event weighting of the index constituents that are involved. Further, changes in index market capitalization that occur as a result of corporate event implementation will be offset by a corresponding change in the variable weighting factor of the constituent.
S-52
Additionally, if the frequency of index reviews in the MSCI USA Index is greater than the frequency of index reviews in the MSCI USA Minimum Volatility Index, the changes made to the MSCI USA Index during intermediate index reviews will be neutralized in the MSCI USA Minimum Volatility Index.
The following section briefly describes the treatment of common corporate events within the MSCI USA Minimum Volatility Index.
No new securities will be added (except where noted below) to the MSCI USA Minimum Volatility Index between index reviews. MSCI USA Index deletions will be reflected simultaneously.
|
Event Type |
Event Details |
|
New additions to the MSCI USA Index |
A new security added to the MSCI USA Index (such as IPO and other early inclusions) will not be added to the index. |
|
Spin-Offs |
All securities created as a result of the spin-off of an existing MSCI USA Minimum Volatility Index constituent will be added to the MSCI USA Minimum Volatility Index at the time of event implementation. Reevaluation for continued inclusion in the MSCI USA Minimum Volatility Index will occur at the subsequent index review. |
|
Merger/acquisition |
For mergers and acquisitions, the acquirer’s post event weight will account for the proportionate amount of shares involved in deal consideration, while cash proceeds will be invested across the MSCI USA Minimum Volatility Index.
If an existing MSCI USA Minimum Volatility Index constituent is acquired by a security that is not a constituent of the MSCI USA Minimum Volatility Index, the existing constituent will be deleted from the MSCI USA Minimum Volatility Index and the acquiring non-constituent will not be added to the MSCI USA Minimum Volatility Index. |
|
Changes in security characteristics |
A security will continue to be a constituent of the MSCI USA Minimum Volatility Index if there are changes in characteristics (country, sector, size segment, etc.). Reevaluation for continued inclusion in the MSCI USA Minimum Volatility Index will occur at the subsequent index review. |
S-53
Historical Closing Prices of the ETF’s Shares
The closing price of shares of the ETF has fluctuated in the past and may, in the future, experience significant fluctuations. Any historical upward or downward trend in the closing price of the shares during the period shown below is not an indication that the shares are more or less likely to increase or decrease at any time during the life of your notes.
You should not take the historical closing prices of the shares as an indication of the future performance of the shares. We cannot give you any assurance that the future performance of the shares will result in your receiving an amount greater than the outstanding face amount of your notes on the stated maturity date. Neither we nor any of our affiliates make any representation to you as to the performance of the shares. Before investing in the offered notes, you should consult publicly available information to determine the relevant ETF closing prices between the date of this index supplement and the date of your purchase of the offered notes. The actual performance of the ETF over the life of the offered notes, as well as the cash settlement amount at maturity may bear little relation to the historical prices shown below.
The graph below shows the daily historical prices of the shares of the ETF from January 1, 2015 through November 12, 2020. We obtained the closing prices shown in the graph below from Bloomberg Financial Services without independent verification.
Historical Performance of iShares® MSCI USA Min Vol Factor ETF

“iShares®” is a registered trademark of BlackRock Institutional Trust Company, N.A. (“BITC”). The index is not sponsored, endorsed, sold, or promoted by BITC. BITC makes no representations or warranties to the owners of the index or any member of the public regarding the advisability of investing in the index. BITC has no obligation or liability in connection with the operation, marketing, trading or sale of the index.
S-54
iShares ® 1-3 Year Treasury Bond ETF
The shares of the iShares® 1-3 Year Treasury Bond ETF (the “ETF”) are issued by iShares® Trust, a registered investment company.
|
● |
The ETF is a tracking ETF that seeks investment results which correspond generally to the price and yield performance, before fees and expenses, of the ICE U.S. Treasury 1-3 Year Bond Index (the “index”). Prior to April 1, 2016, the ETF tracked the Barclays U.S. 1-3 Year Treasury Bond Index. |
|
● |
The ETF’s investment advisor is BlackRock Fund Advisors (“BFA”). |
|
● |
The ETF’s shares trade on the NASDAQ under the ticker symbol “SHY”. |
|
● |
The iShares® Trust’s SEC CIK Number is 0001100663. |
|
● |
The ETF’s inception date was July 22, 2002. |
|
● |
The ETF’s shares are issued or redeemed only in creation units of 100,000 shares or multiples thereof. |
We obtained the following fee information from the iShares® website without independent verification. The investment advisor is paid a management fee from the ETF based on a percentage of the ETF’s average daily net assets, at an annual rate of 0.15%. BFA is responsible for substantially all expenses of the ETF, except interest expenses, taxes, brokerage expenses, future distribution fees or expenses and extraordinary expenses. As of September 30, 2020, the expense ratio of the ETF was 0.15% per annum.
For additional information regarding iShares® Trust or BFA, please consult the reports (including the Semi-Annual Report to Shareholders on Form N−CSRS for the period ended August 31, 2020) and other information iShares® Trust files with the SEC. In addition, information regarding the ETF, including its top portfolio holdings, may be obtained from other sources including, but not limited to, press releases, newspaper articles, other publicly available documents, and the iShares® website at us.ishares.com/product_info/fund/overview/SHY.htm. We are not incorporating by reference the website, the sources listed above or any material they include in this index supplement.
Investment Objective and Strategy
The ETF seeks to provide investment results that correspond generally to the price and yield performance, before fees and expenses, of the index. The ETF’s investment objective and the index that the ETF tracks may be changed without shareholder approval.
BFA uses a representative sampling indexing strategy to attempt to track the performance of the index. For the ETF, this strategy involves investing in a representative sample of securities that collectively have an investment profile similar to that of the index. The securities selected are expected to have, in the aggregate, investment characteristics (based on factors such as market value and industry weightings), fundamental characteristics (such as return variability, duration, maturity or credit ratings and yield) and liquidity measures similar to those of the index. The ETF may or may not hold all of the securities in the index.
The ETF generally invests at least 90% of its assets in the bonds in the index and at least 95% of its assets in U.S. government bonds. The ETF may invest up to 10% of its assets in U.S. government bonds not included in the index, but which BFA believes will help the ETF track the index. The ETF may also invest up to 5% of its assets in repurchase agreements collateralized by U.S. government obligations and in cash and cash equivalents, including shares of money market funds advised by BFA or its affiliates. The ETF may lend securities representing up to one-third of the value of the ETF’s total assets (including the value of the collateral received).
S-55
The ETF’s Holdings
The following table displays the top holdings of the ETF. We obtained the information in the tables below from the iShares® website without independent verification.
iShares® 1-3 Year Treasury Bond ETF Top Ten Holdings as of November 12, 2020*
|
U.S. Treasury Bond |
Percentage (%) |
|
2.50% due 1/15/2022 |
6.13% |
|
2.13% due 5/15/2022 |
5.60% |
|
1.75% due 7/15/2022 |
5.55% |
|
1.63% due 11/15/2022 |
5.48% |
|
1.88% due 4/30/2022 |
5.36% |
|
2.50% due 2/15/2022 |
4.38% |
|
2.25% due 4/15/2022 |
4.38% |
|
0.13% due 10/15/2023 |
4.04% |
|
0.13% due 8/15/2023 |
3.98% |
|
0.25% due 4/15/2023 |
3.87% |
|
Total |
48.77% |
The following table displays additional information about the bonds held by the ETF and the annualized performance difference, in each case as of November 12, 2020*. We obtained the information in the table below from the iShares® website without independent verification.
|
Weighted average maturity |
1.93 years |
|
Weighted average coupon |
1.60% |
|
Effective duration |
1.90 years |
Weighted average maturity is the length of time until the average security in the ETF will mature or be redeemed by its issuer. Weighted average coupon is the average coupon rate of the underlying bonds in the ETF, weighted by the relative size in the ETF. Effective duration is a measure of the potential responsiveness of a bond or portfolio price to small parallel shifts in interest rates, taking into account the possible changes in expected bond cash flows due to small parallel shifts in interest rates.
As of November 12, 2020*, the ETF’s holdings were comprised of 75 U.S. Treasury bonds (99.82% of holdings) and cash and/or derivatives (0.18% of holdings). Of the ETF’s U.S. Treasury bond holdings, all were AAA rated under the S&P major rating category. The S&P major rating categories are derived from the S&P, Moody’s and Fitch ratings for a security.
*Prior to April 1, 2016, the ETF tracked the Barclays U.S. 1-3 Year Treasury Bond Index.
Tracking Error
The performance of the ETF and the index may vary due to a variety of factors, including differences between the securities held in the ETF’s portfolio and those included in the index, pricing differences, transaction costs incurred by the ETF, the ETF holding uninvested cash, differences in timing of the accrual of or the valuation of distributions, the requirements to maintain pass-through tax treatment, portfolio transactions carried out to minimize the distribution of capital gains to shareholders, acceptances of custom baskets, changes to the index or the costs to the ETF of complying with new or existing regulatory requirements. Tracking error also may result because the ETF incurs fees and expenses, while the index does not. BFA expects that, over time, the ETF’s tracking error will not exceed 5%. The ETF’s use of a representative sampling indexing strategy can be expected to produce a larger tracking error than would result if the ETF used a replication indexing strategy in which an ETF invests in substantially all of the securities in its index in approximately the same proportions as in the index.
As of October 31, 2020, iShares® reported the following average annual returns on the market price of the ETF’s shares and the index. The market price of the ETF’s shares takes into account distributions on the shares and the returns shown account for changes in the mid-point of the bid and ask prices at 4:00 p.m., Eastern time on the relevant date. ETF shares: 1 year, 3.08%; 3 years, 2.52%; 5 years, 1.69%; 10 years, 1.13%; since inception, 2.09%; index: 1 year, 3.25%; 3 years, 2.67%; 5 years, 1.83%; 10 years, 1.26%; since ETF inception, 2.22%. Prior to April 1, 2016, the ETF tracked the Barclays U.S. 1-3 Year Treasury Bond Index.
S-56
The ICE U.S. Treasury 1-3 Year Bond Index
The index is sponsored by ICE Data Indices, LLC (“IDI”). It is market value weighted and designed to measure the performance of U.S. dollar-denominated, fixed rate treasuries with a minimum term to maturity greater than or equal to one years and less than three years.
The ICE Data Indices, LLC Index Governance Committee (the “governance committee”) is responsible for governance and oversight of the index along with oversight of the ICE Data Index Services team (the “IDIS”), which has the daily responsibility for the operation of the index. The governance committee will approve any necessary changes to the index methodology, and the IDIS is responsible for implementing the changes and notifying subscribers. Where a change is material, IDI will consult with stakeholders and subscribers in accordance with the IDI consultation process. For other changes, advance notice will be provided, where possible, to allow stakeholders and subscribers appropriate preparation to implement the change.
Eligibility Criteria and Inclusion Rules
In order to be included in the index, a security must be a U.S. dollar denominated, fixed rate U.S. Treasury issued debt security (“treasury”) with a minimum term to maturity greater than or equal to one years and less than three years. Inflation-linked securities, floating rate notes, cash management and treasury bills and government agency debt, whether issued with or without a government guarantee, are excluded from the index, as are zero coupon securities. The treasury is required to have a minimum amount outstanding of $300 million U.S. dollars. Amount outstanding is defined as the par amount outstanding of each treasury, inclusive of any announced auctions or re-openings, less the par amount of that treasury held in the Federal Reserve System Open Market Account (“SOMA”) or bought at issuance (including by auction) by the Federal Reserve. Secondary market purchases by the Federal Reserve are reflected in the index in the month following the purchase.
Index Calculation
Index returns are calculated by aggregating the constituent level returns using market weights. The total market value of the index at any time is the sum of the market value of each constituent plus any intra-month cash from coupon payments or principal repayments. Calculations are performed daily, using bid prices at 3 p.m. Eastern Time.
Index Maintenance
The index is rebalanced at each month end. The new index for the next month is available three days prior to month end and is intended to reflect the constituent changes from the prior rebalancing date based on index eligibility. Newly issued securities that are issued on or before the month-end rebalancing date that qualify for inclusion in the index will be included in the pro forma index with a price of $100 until replaced with an evaluated price as soon as available after the auction day.
No adjustments are made for treasuries that become eligible or ineligible intra-month. The index is rebalanced after the end of the last calendar day of each month. Pro forma files are provided from the fourth to last business day of the month through the last business day of the month with each day’s file reflecting the most current projected index holdings based on available data up to and including that date.
Cash that has accrued intra-month from interest and principal payments earns no reinvestment return during the month. The accumulated intra-month cash is removed from the index at month-end, which implies that it is reinvested pro rata across the entire index.
Current Composition of the Index
As of November 12, 2020, the index’s holdings were comprised of 94 U.S. Treasury bonds. The following table displays additional information about the bonds held by the index as of Novmeber 12, 2020. We obtained the information in the table below from the ICE website without independent verification.
|
Weighted average maturity |
1.93 years |
|
Weighted average coupon |
1.55% |
S-57
Historical Closing Prices of the ETF’s Shares
The closing price of shares of the ETF has fluctuated in the past and may, in the future, experience significant fluctuations. Any historical upward or downward trend in the closing price of the shares during the period shown below is not an indication that the shares are more or less likely to increase or decrease at any time during the life of your notes.
You should not take the historical closing prices of the shares as an indication of the future performance of the shares. We cannot give you any assurance that the future performance of the shares will result in your receiving an amount greater than the outstanding face amount of your notes on the stated maturity date. Neither we nor any of our affiliates make any representation to you as to the performance of the shares. Before investing in the offered notes, you should consult publicly available information to determine the relevant ETF closing prices between the date of this index supplement and the date of your purchase of the offered notes. The actual performance of the ETF over the life of the offered notes, as well as the cash settlement amount at maturity may bear little relation to the historical prices shown below.
The graph below shows the daily historical prices of the shares of the ETF from January 1, 2015 through November 12, 2020. We obtained the closing prices shown in the graph below from Bloomberg Financial Services without independent verification.
Historical Performance of iShares® 1-3 Year Treasury Bond ETF
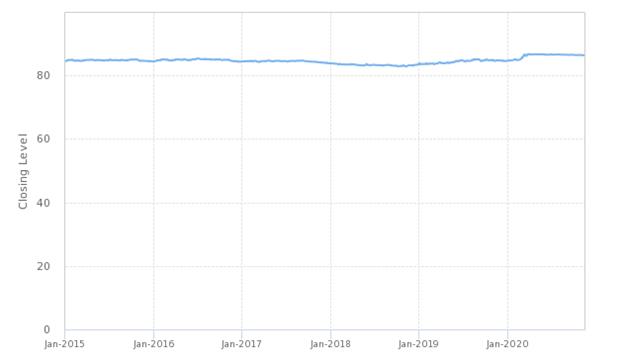
*Prior to April 1, 2016, the ETF tracked the Barclays U.S. 1-3 Year Treasury Bond Index.
S-58
Hypothetical and Historical Closing Levels of the ICE U.S. Treasury 1-3 Year Bond Index
The closing level of the ICE U.S. Treasury 1-3 Year Bond Index has fluctuated in the past and may, in the future, experience significant fluctuations. Any upward or downward trend in the historical or hypothetical closing level of the ICE U.S. Treasury 1-3 Year Bond Index during the period shown below is not an indication that the ICE U.S. Treasury 1-3 Year Bond Index is more or less likely to increase or decrease at any time during the life of your notes.
You should not take the historical or hypothetical closing levels of the ICE U.S. Treasury 1-3 Year Bond Index as an indication of the future performance of the ICE U.S. Treasury 1-3 Year Bond Index or make any assumptions, based on the ICE U.S. Treasury 1-3 Year Bond Index’s historical or hypothetical performance, about the performance of the ETF. We cannot give you any assurance that the future performance of the ETF’s shares will be consistent with the historical or hypothetical performance of ICE U.S. Treasury 1-3 Year Bond Index.
The graph below shows the closing levels of the ICE U.S. Treasury 1-3 Year Bond Index from January 1, 2015 through November 12, 2020 (using hypothetical performance data and historical closing levels). Since the ICE U.S. Treasury 1-3 Year Bond Index was launched on December 31, 2015 and has a limited operating history, the graph includes hypothetical performance data for the underlier prior to its launch on December 31, 2015. The hypothetical performance data and historical closing levels were obtained from ICE’s website, without independent verification. (In the graph, historical closing levels can be found to the right of the vertical solid line marker.)
Historical Performance of ICE U.S. Treasury 1-3 Year Bond Index

*The ETF began tracking the ICE U.S. Treasury 1-3 Year Bond Index on April 1, 2016.
“iShares®” is a registered trademark of BlackRock Institutional Trust Company, N.A. (“BITC”). The index is not sponsored, endorsed, sold, or promoted by BITC. BITC makes no representations or warranties to the owners of the index or any member of the public regarding the advisability of investing in the index. BITC has no obligation or liability in connection with the operation, marketing, trading or sale of the index.
S-59
iShares® 7-10 Year Treasury Bond ETF
The shares of the iShares® 7-10 Year Treasury Bond ETF (the “ETF”) are issued by iShares® Trust, a registered investment company.
|
● |
The ETF is a tracking ETF that seeks investment results which correspond generally to the price and yield performance, before fees and expenses, of the ICE U.S. Treasury 7-10 Year Bond Index (the “index”). Prior to April 1, 2016, the ETF tracked the Barclays U.S. 7-10 Year Treasury Bond Index. |
|
● |
The ETF’s investment advisor is BlackRock Fund Advisors (“BFA”). |
|
● |
The ETF’s shares trade on the NASDAQ under the ticker symbol “IEF”. |
|
● |
The iShares® Trust’s SEC CIK Number is 0001100663. |
|
● |
The ETF’s inception date was July 22, 2002. |
|
● |
The ETF’s shares are issued or redeemed only in creation units of 100,000 shares or multiples thereof. |
We obtained the following fee information from the iShares® website without independent verification. The investment advisor is paid a management fee from the ETF based on a percentage of the ETF’s average daily net assets, at an annual rate of 0.15%. BFA is responsible for substantially all expenses of the ETF, except interest expenses, taxes, brokerage expenses, future distribution fees or expenses and extraordinary expenses. As of September 30, 2020, the expense ratio of the ETF was 0.15% per annum.
For additional information regarding iShares® Trust or BFA, please consult the reports (including the Semi-Annual Report to Shareholders on Form N−CSRS for the period ended August 31, 2020) and other information iShares® Trust files with the SEC. In addition, information regarding the ETF, including its top portfolio holdings, may be obtained from other sources including, but not limited to, press releases, newspaper articles, other publicly available documents, and the iShares® website at us.ishares.com/product_info/fund/overview/IEF.htm. We are not incorporating by reference the website, the sources listed above or any material they include in this index supplement.
Investment Objective and Strategy
The ETF seeks to provide investment results that correspond generally to the price and yield performance, before fees and expenses, of the index. The ETF’s investment objective and the index that the ETF tracks may be changed without shareholder approval.
BFA uses a representative sampling indexing strategy to attempt to track the performance of the index. For the ETF, this strategy involves investing in a representative sample of securities that collectively have an investment profile similar to that of the index. The securities selected are expected to have, in the aggregate, investment characteristics (based on factors such as market value and industry weightings), fundamental characteristics (such as return variability, duration, maturity or credit ratings and yield) and liquidity measures similar to those of the index. The ETF may or may not hold all of the securities in the index.
The ETF generally invests at least 90% of its assets in the bonds in the index and at least 95% of its assets in U.S. government bonds. The ETF may invest up to 10% of its assets in U.S. government bonds not included in the index, but which BFA believes will help the ETF track the index. The ETF may also invest up to 5% of its assets in repurchase agreements collateralized by U.S. government obligations and in cash and cash equivalents, including shares of money market funds advised by BFA or its affiliates. The ETF may lend securities representing up to one-third of the value of the ETF’s total assets (including the value of the collateral received).
S-60
The ETF’s Holdings
The following table displays the top holdings of the ETF. We obtained the information in the tables below from the iShares® website without independent verification.
iShares® 7-10 Year Treasury Bond ETF Top Ten Holdings as of November 12, 2020*
|
U.S. Treasury Bond |
Percentage (%) |
|
0.63% due 8/15/2030 |
21.78% |
|
3.13% due 11/15/2028 |
14.75% |
|
2.88% due 5/15/2028 |
12.26% |
|
2.63% due 2/15/2029 |
11.52% |
|
2.88% due 8/15/2028 |
11.29% |
|
2.38% due 5/15/2029 |
9.18% |
|
1.50% due 2/15/2030 |
7.01% |
|
2.75% due 2/15/2028 |
6.02% |
|
1.63% due 8/15/2029 |
1.68% |
|
1.75% due 11/15/2029 |
1.60% |
|
Total |
97.09% |
The following table displays additional information about the bonds held by the ETF and the annualized performance difference, in each case as of November 12, 2020*. We obtained the information in the table below from the iShares® website without independent verification.
|
Weighted average maturity |
8.37 years |
|
Weighted average coupon |
2.07% |
|
Effective duration |
7.71 years |
Weighted average maturity is the length of time until the average security in the ETF will mature or be redeemed by its issuer. Weighted average coupon is the average coupon rate of the underlying bonds in the ETF, weighted by the relative size in the ETF. Effective duration is a measure of the potential responsiveness of a bond or portfolio price to small parallel shifts in interest rates, taking into account the possible changes in expected bond cash flows due to small parallel shifts in interest rates.
As of November 12, 2020*, the ETF’s holdings were comprised of 17 U.S. Treasury bonds (99.22% of holdings) and cash and/or derivatives (0.78% of holdings). Of the ETF’s U.S. Treasury bond holdings, all were AAA rated under the S&P major rating category. The S&P major rating categories are derived from the S&P, Moody’s and Fitch ratings for a security.
*Prior to April 1, 2016, the ETF tracked the Barclays U.S. 7-10 Year Treasury Bond Index.
Tracking Error
The performance of the ETF and the index may vary due to a variety of factors, including differences between the securities held in the ETF’s portfolio and those included in the index, pricing differences, transaction costs incurred by the ETF, the ETF holding uninvested cash, differences in timing of the accrual of or the valuation of distributions, the requirements to maintain pass-through tax treatment, portfolio transactions carried out to minimize the distribution of capital gains to shareholders, acceptance of custom baskets, changes to the index or the costs to the ETF of complying with new or existing regulatory requirements. Tracking error also may result because the ETF incurs fees and expenses, while the index does not. BFA expects that, over time, the ETF’s tracking error will not exceed 5%. The ETF’s use of a representative sampling indexing strategy can be expected to produce a larger tracking error than would result if the ETF used a replication indexing strategy in which an ETF invests in substantially all of the securities in its index in approximately the same proportions as in the index.
As of October 31, 2020, iShares® reported the following average annual returns on the market price of the ETF’s shares and the index. The market price of the ETF’s shares takes into account distributions on the shares and the returns shown account for changes in the mid-point of the bid and ask prices at 4:00 p.m., Eastern time on the relevant date. ETF shares: 1 year, 8.13%; 3 years, 6.20%; 5 years, 4.24%; 10 years, 4.01%; since inception, 5.06%; index: 1 year, 8.48%; 3 years, 6.37%; 5 years, 4.38%; 10 years, 4.12%; since ETF inception, 5.13%. Prior to April 1, 2016, the ETF tracked the Barclays U.S. 7-10 Year Treasury Bond Index.
S-61
The ICE U.S. Treasury 7-10 Year Bond Index
The index is sponsored by ICE Data Indices, LLC (“IDI”). It is market value weighted and designed to measure the performance of U.S. dollar-denominated, fixed rate treasuries with a minimum term to maturity greater than or equal to seven years and less than ten years.
The ICE Data Indices, LLC Index Governance Committee (the “governance committee”) is responsible for governance and oversight of the index along with oversight of the ICE Data Index Services team (the “IDIS”), which has the daily responsibility for the operation of the index. The governance committee will approve any necessary changes to the index methodology, and the IDIS is responsible for implementing the changes and notifying subscribers. Where a change is material, IDI will consult with stakeholders and subscribers in accordance with the IDI consultation process. For other changes, advance notice will be provided, where possible, to allow stakeholders and subscribers appropriate preparation to implement the change.
Eligibility Criteria and Inclusion Rules
In order to be included in the index, a security must be a U.S. dollar denominated, fixed rate U.S. Treasury issued debt security (“treasury”) with a minimum term to maturity greater than or equal to seven years and less than ten years. Inflation-linked securities, floating rate notes, cash management and treasury bills and government agency debt, whether issued with or without a government guarantee, are excluded from the index, as are zero coupon securities. The treasury is required to have a minimum amount outstanding of $300 million U.S. dollars. Amount outstanding is defined as the par amount outstanding of each treasury, inclusive of any announced auctions or re-openings, less the par amount of that treasury held in the Federal Reserve System Open Market Account (“SOMA”) or bought at issuance (including by auction) by the Federal Reserve. Secondary market purchases by the Federal Reserve are reflected in the index in the month following the purchase.
Index Calculation
Index returns are calculated by aggregating the constituent level returns using market weights. The total market value of the index at any time is the sum of the market value of each constituent plus any intra-month cash from coupon payments or principal repayments. Calculations are performed daily, using bid prices at 3 p.m. Eastern Time.
Index Maintenance
The index is rebalanced at each month end. The new index for the next month is available three days prior to month end and is intended to reflect the constituent changes from the prior rebalancing date based on index eligibility. Newly issued securities that are issued on or before the month-end rebalancing date that qualify for inclusion in the index will be included in the pro forma index with a price of $100 until replaced with an evaluated price as soon as available after the auction day.
No adjustments are made for treasuries that become eligible or ineligible intra-month. The index is rebalanced after the end of the last calendar day of each month. Pro forma files are provided from the fourth to last business day of the month through the last business day of the month with each day’s file reflecting the most current projected index holdings based on available data up to and including that date.
Cash that has accrued intra-month from interest and principal payments earns no reinvestment return during the month. The accumulated intra-month cash is removed from the index at month-end, which implies that it is reinvested pro rata across the entire index.
Current Composition of the Index
As of November 12, 2020, the index’s holdings were comprised of 18 U.S. Treasury bonds. The following table displays additional information about the bonds held by the index as of November 12, 2020. We obtained the information in the table below from the ICE website without independent verification.
|
Weighted average maturity |
8.41 years |
|
Weighted average coupon |
2.16% |
S-62
Historical Closing Prices of the ETF’s Shares
The closing price of shares of the ETF has fluctuated in the past and may, in the future, experience significant fluctuations. Any historical upward or downward trend in the closing price of the shares during the period shown below is not an indication that the shares are more or less likely to increase or decrease at any time during the life of your notes.
You should not take the historical closing prices of the shares as an indication of the future performance of the shares. We cannot give you any assurance that the future performance of the shares will result in your receiving an amount greater than the outstanding face amount of your notes on the stated maturity date. Neither we nor any of our affiliates make any representation to you as to the performance of the shares. Before investing in the offered notes, you should consult publicly available information to determine the relevant ETF closing prices between the date of this index supplement and the date of your purchase of the offered notes. The actual performance of the ETF over the life of the offered notes, as well as the cash settlement amount at maturity may bear little relation to the historical prices shown below.
The graph below shows the daily historical prices of the shares of the ETF from January 1, 2015 through November 12, 2020. We obtained the closing prices shown in the graph below from Bloomberg Financial Services without independent verification.
Historical Performance of iShares® 7-10 Year Treasury Bond ETF

*Prior to April 1, 2016, the ETF tracked the Barclays U.S. 7-10 Year Treasury Bond Index.
S-63
Hypothetical and Historical Closing Levels of the ICE U.S. Treasury 7-10 Year Bond Index
The closing level of the ICE U.S. Treasury 7-10 Year Bond Index has fluctuated in the past and may, in the future, experience significant fluctuations. Any upward or downward trend in the historical or hypothetical closing level of the ICE U.S. Treasury 7-10 Year Bond Index during the period shown below is not an indication that the ICE U.S. Treasury 7-10 Year Bond Index is more or less likely to increase or decrease at any time during the life of your notes.
You should not take the historical or hypothetical closing levels of the ICE U.S. Treasury 7-10 Year Bond Index as an indication of the future performance of the ICE U.S. Treasury 7-10 Year Bond Index or make any assumptions, based on the ICE U.S. Treasury 7-10 Year Bond Index’s historical or hypothetical performance, about the performance of the ETF. We cannot give you any assurance that the future performance of the ETF’s shares will be consistent with the historical or hypothetical performance of ICE U.S. Treasury 7-10 Year Bond Index.
The graph below shows the closing levels of the ICE U.S. Treasury 7-10 Year Bond Index from January 1, 2015 through November 12, 2020 (using hypothetical performance data and historical closing levels). Since the ICE U.S. Treasury 7-10 Year Bond Index was launched on December 31, 2015 and has a limited operating history, the graph includes hypothetical performance data for the underlier prior to its launch on December 31, 2015. The hypothetical performance data and historical closing levels were obtained from ICE’s website, without independent verification. (In the graph, historical closing levels can be found to the right of the vertical solid line marker.)
Historical Performance of ICE U.S. Treasury 7-10 Year Bond Index

*The ETF began tracking the ICE U.S. Treasury 7-10 Year Bond Index on April 1, 2016.
“iShares®” is a registered trademark of BlackRock Institutional Trust Company, N.A. (“BITC”). The index is not sponsored, endorsed, sold, or promoted by BITC. BITC makes no representations or warranties to the owners of the index or any member of the public regarding the advisability of investing in the index. BITC has no obligation or liability in connection with the operation, marketing, trading or sale of the index.
S-64
iShares ® 20+ Year Treasury Bond ETF
The shares of the iShares® 20+ Year Treasury Bond ETF (the “ETF”) are issued by iShares® Trust, a registered investment company.
|
● |
The ETF is a tracking ETF that seeks investment results which correspond generally to the price and yield performance, before fees and expenses, of the ICE U.S. Treasury 20+ Year Bond Index (the “index”). Prior to April 1, 2016, the ETF tracked the Barclays U.S. 20+ Year Treasury Bond Index. |
|
● |
The ETF’s investment advisor is BlackRock Fund Advisors (“BFA”). |
|
● |
The ETF’s shares trade on the NASDAQ under the ticker symbol “TLT”. |
|
● |
The iShares® Trust’s SEC CIK Number is 0001100663. |
|
● |
The ETF’s inception date was July 22, 2002. |
|
● |
The ETF’s shares are issued or redeemed only in creation units of 100,000 shares or multiples thereof. |
We obtained the following fee information from the iShares® website without independent verification. The investment advisor is paid a management fee from the ETF based on a percentage of the ETF’s average daily net assets, at an annual rate of 0.15%. BFA is responsible for substantially all expenses of the ETF, except interest expenses, taxes, brokerage expenses, future distribution fees or expenses and extraordinary expenses. As of September 30, 2020, the expense ratio of the ETF was 0.15% per annum.
For additional information regarding iShares® Trust or BFA, please consult the reports (including the Semi-Annual Report to Shareholders on Form N−CSRS for the period ended August 31, 2020) and other information iShares® Trust files with the SEC. In addition, information regarding the ETF, including its top portfolio holdings, may be obtained from other sources including, but not limited to, press releases, newspaper articles, other publicly available documents, and the iShares® website at us.ishares.com/product_info/fund/overview/TLT.htm. We are not incorporating by reference the website, the sources listed above or any material they include in this index supplement.
Investment Objective and Strategy
The ETF seeks to provide investment results that correspond generally to the price and yield performance, before fees and expenses, of the index. The ETF’s investment objective and the index that the ETF tracks may be changed without shareholder approval.
BFA uses a representative sampling indexing strategy to attempt to track the performance of the index. For the ETF, this strategy involves investing in a representative sample of securities that collectively have an investment profile similar to that of the index. The securities selected are expected to have, in the aggregate, investment characteristics (based on factors such as market value and industry weightings), fundamental characteristics (such as return variability, duration, maturity or credit ratings and yield) and liquidity measures similar to those of the index. The ETF may or may not hold all of the securities in the index.
The ETF generally invests at least 90% of its assets in the bonds in the index and at least 95% of its assets in U.S. government bonds. The ETF may invest up to 10% of its assets in U.S. government bonds not included in the index, but which BFA believes will help the ETF track the index. The ETF may also invest up to 5% of its assets in repurchase agreements collateralized by U.S. government obligations and in cash and cash equivalents, including shares of money market funds advised by BFA or its affiliates. The ETF may lend securities representing up to one-third of the value of the ETF’s total assets (including the value of the collateral received).
S-65
The following table displays the top holdings of the ETF. We obtained the information in the tables below from the iShares® website without independent verification.
iShares® 20+ Year Treasury Bond ETF Top Ten Holdings as of November 12, 2020*
|
U.S. Treasury Bond |
Percentage (%) |
|
3.00% due 2/15/2049 |
8.77% |
|
3.00% due 8/15/2048 |
7.39% |
|
2.88% due 5/15/2043 |
5.95% |
|
3.13% due 8/15/2044 |
5.41% |
|
3.13% due 5/15/2048 |
4.89% |
|
3.38% due 11/15/2048 |
4.59% |
|
2.50% due 5/15/2046 |
4.57% |
|
2.00% due 2/15/2050 |
4.56% |
|
2.50% due 2/15/2046 |
4.49% |
|
3.00% due 2/15/2048 |
4.38% |
|
Total |
55.00% |
The following table displays additional information about the bonds held by the ETF and the annualized performance difference, in each case as of November 12, 2020*. We obtained the information in the table below from the iShares® website without independent verification.
|
Weighted average maturity |
25.89 years |
|
Weighted average coupon |
2.78% |
|
Effective duration |
18.91 years |
Weighted average maturity is the length of time until the average security in the ETF will mature or be redeemed by its issuer. Weighted average coupon is the average coupon rate of the underlying bonds in the ETF, weighted by the relative size in the ETF. Effective duration is a measure of the potential responsiveness of a bond or portfolio price to small parallel shifts in interest rates, taking into account the possible changes in expected bond cash flows due to small parallel shifts in interest rates.
As of November 12, 2020*, the ETF’s holdings were comprised of 49 U.S. Treasury bonds (99.60% of holdings) and cash and/or derivatives (0.40% of holdings). Of the ETF’s U.S. Treasury bond holdings, all were AAA rated under the S&P major rating category. The S&P major rating categories are derived from the S&P, Moody’s and Fitch ratings for a security.
*Prior to April 1, 2016, the ETF tracked the Barclays U.S. 20+ Year Treasury Bond Index.
Tracking Error
The performance of the ETF and the index may vary due to a variety of factors, including differences between the securities held in the ETF’s portfolio and those included in the index, pricing differences, transaction costs incurred by the ETF, the ETF holding uninvested cash, differences in timing of the accrual of or the valuation of distributions, the requirements to maintain pass-through tax treatment, portfolio transactions carried out to minimize the distribution of capital gains to shareholders, acceptance of custom baskets, changes to the index or the costs to the ETF of complying with new or existing regulatory requirements. Tracking error also may result because the ETF incurs fees and expenses, while the index does not. BFA expects that, over time, the ETF’s tracking error will not exceed 5%. The ETF’s use of a representative sampling indexing strategy can be expected to produce a larger tracking error than would result if the ETF used a replication indexing strategy in which an ETF invests in substantially all of the securities in its index in approximately the same proportions as in the index.
As of October 31, 2020, iShares® reported the following average annual returns on the market price of the ETF’s shares and the index. The market price of the ETF’s shares takes into account distributions on the shares and the returns shown account for changes in the mid-point of the bid and ask prices at 4:00 p.m., Eastern time on the relevant date. ETF shares: 1 year, 13.44%; 3 years, 10.66%; 5 years, 7.61%; 10 years, 7.49%; since inception, 7.29%; index: 1 year, 14.10%; 3 years, 10.98%; 5 years, 7.86%; 10 years, 7.67%; since ETF inception, 7.43%. Prior to April 1, 2016, the ETF tracked the Barclays U.S. 20+ Year Treasury Bond Index.
S-66
The ICE U.S. Treasury 20+ Year Bond Index
The index is sponsored by ICE Data Indices, LLC (“IDI”). It is market value weighted and designed to measure the performance of U.S. dollar-denominated, fixed rate treasuries with a minimum term to maturity greater than or equal to 20 years.
The ICE Data Indices, LLC Index Governance Committee (the “governance committee”) is responsible for governance and oversight of the index along with oversight of the ICE Data Index Services team (the “IDIS”), which has the daily responsibility for the operation of the index. The governance committee will approve any necessary changes to the index methodology, and the IDIS is responsible for implementing the changes and notifying subscribers. Where a change is material, IDI will consult with stakeholders and subscribers in accordance with the IDI consultation process. For other changes, advance notice will be provided, where possible, to allow stakeholders and subscribers appropriate preparation to implement the change.
Eligibility Criteria and Inclusion Rules
In order to be included in the index, a security must be a U.S. dollar denominated, fixed rate U.S. Treasury issued debt security (“treasury”) with a minimum term to maturity greater than or equal to 20 years. Inflation-linked securities, floating rate notes, cash management and treasury bills and government agency debt, whether issued with or without a government guarantee, are excluded from the index, as are zero coupon securities. The treasury is required to have a minimum amount outstanding of $300 million U.S. dollars. Amount outstanding is defined as the par amount outstanding of each treasury, inclusive of any announced auctions or re-openings, less the par amount of that treasury held in the Federal Reserve System Open Market Account (“SOMA”) or bought at issuance (including by auction) by the Federal Reserve. Secondary market purchases by the Federal Reserve are reflected in the index in the month following the purchase.
Index Calculation
Index returns are calculated by aggregating the constituent level returns using market weights. The total market value of the index at any time is the sum of the market value of each constituent plus any intra-month cash from coupon payments or principal repayments and the weight for the constituent. Calculations are performed daily, using bid prices at 3 p.m. Eastern Time.
Index Maintenance
The index is rebalanced at each month end. The new index for the next month is available three days prior to month end and is intended to reflect the constituent changes from the prior rebalancing date based on index eligibility. Newly issued securities that are issued on or before the month-end rebalancing date that qualify for inclusion in the index will be included in the pro forma index with a price of $100 until replaced with an evaluated price as soon as available after the auction day.
No adjustments are made for treasuries that become eligible or ineligible intra-month. The index is rebalanced after the end of the last calendar day of each month. Pro forma files are provided from the fourth to last business day of the month through the last business day of the month with each day’s file reflecting the most current projected index holdings based on available data up to and including that date.
Cash that has accrued intra-month from interest and principal payments earns no reinvestment return during the month. The accumulated intra-month cash is removed from the index at month-end, which implies that it is reinvested pro rata across the entire index.
Current Composition of the Index
As of November 12 2020, the index’s holdings were comprised of 40 U.S. Treasury bonds. The following table displays additional information about the bonds held by the index as of November 12, 2020. We obtained the information in the table below from the ICE website without independent verification.
|
Weighted average maturity |
25.78 years |
|
Weighted average coupon |
2.77% |
S-67
Historical Closing Prices of the ETF’s Shares
The closing price of shares of the ETF has fluctuated in the past and may, in the future, experience significant fluctuations. Any historical upward or downward trend in the closing price of the shares during the period shown below is not an indication that the shares are more or less likely to increase or decrease at any time during the life of your notes.
You should not take the historical closing prices of the shares as an indication of the future performance of the shares. We cannot give you any assurance that the future performance of the shares will result in your receiving an amount greater than the outstanding face amount of your notes on the stated maturity date. Neither we nor any of our affiliates make any representation to you as to the performance of the shares. Before investing in the offered notes, you should consult publicly available information to determine the relevant ETF closing prices between the date of this index supplement and the date of your purchase of the offered notes. The actual performance of the ETF over the life of the offered notes, as well as the cash settlement amount at maturity may bear little relation to the historical prices shown below.
The graph below shows the daily historical prices of the shares of the ETF from January 1, 2015 through November 12, 2020. We obtained the closing prices shown in the graph below from Bloomberg Financial Services without independent verification.
Historical Performance of the iShares® 20+ Year Treasury Bond ETF

*Prior to April 1, 2016, the ETF tracked the Barclays U.S. 20+ Year Treasury Bond Index.
S-68
Hypothetical and Historical Closing Levels of the ICE U.S. Treasury 20+ Year Bond Index
The closing level of the ICE U.S. Treasury 20+ Year Bond Index has fluctuated in the past and may, in the future, experience significant fluctuations. Any upward or downward trend in the historical or hypothetical closing level of the ICE U.S. Treasury 20+ Year Bond Index during the period shown below is not an indication that the ICE U.S. Treasury 20+ Year Bond Index is more or less likely to increase or decrease at any time during the life of your notes.
You should not take the historical or hypothetical closing levels of the ICE U.S. Treasury 20+ Year Bond Index as an indication of the future performance of the ICE U.S. Treasury 20+ Year Bond Index or make any assumptions, based on the ICE U.S. Treasury 20+ Year Bond Index’s historical or hypothetical performance, about the performance of the ETF. We cannot give you any assurance that the future performance of the ETF’s shares will be consistent with the historical or hypothetical performance of the ICE U.S. Treasury 20+ Year Bond Index.
The graph below shows the closing levels of the ICE U.S. Treasury 20+ Year Bond Index from January 1, 2015 through November 12, 2020 (using hypothetical performance data and historical closing levels). Since the ICE U.S. Treasury 20+ Year Bond Index was launched on December 31, 2015 and has a limited operating history, the graph includes hypothetical performance data for the underlier prior to its launch on December 31, 2015. The hypothetical performance data and historical closing levels were obtained from ICE’s website, without independent verification. (In the graph, historical closing levels can be found to the right of the vertical solid line marker.)
Historical Performance of ICE U.S. Treasury 20+ Year Bond Index

*The ETF began tracking the ICE U.S. Treasury 20+ Year Bond Index on April 1, 2016.
“iShares®” is a registered trademark of BlackRock Institutional Trust Company, N.A. (“BITC”). The index is not sponsored, endorsed, sold, or promoted by BITC. BITC makes no representations or warranties to the owners of the index or any member of the public regarding the advisability of investing in the index. BITC has no obligation or liability in connection with the operation, marketing, trading or sale of the index.
S-69
The cash constituent reflects the notional return accruing to a hypothetical investor from an investment in a money market account denominated in U.S. dollars that accrues interest at a rate determined by reference to the notional interest rate, which is the notional interest rate.
The graph below illustrates the historical levels of the 3-month USD LIBOR rate for the period shown below. The level of the 3-month USD LIBOR rate has fluctuated in the past and may, in the future, experience significant fluctuations. Any historical upward or downward trend in the level of the 3-month USD LIBOR rate during the period shown below is not an indication that the level of the 3- month USD LIBOR rate is more or less likely to increase or decrease at any time during the life of the notes. See “U.K. Regulators Will No Longer Persuade or Compel Banks to Submit Rates for Calculation of LIBOR After 2021; Interest Rate Benchmark May Be Discontinued” and “Additional Risk Factors Specific to Your Notes — Regulation and Reform of “Benchmarks”, Including LIBOR and Other Types of Benchmarks, May Cause such “Benchmarks” to Perform Differently Than in the Past, or to Disappear Entirely, or Have Other Consequences Which Cannot be Predicted” in the applicable pricing supplement for more information about 3-month USD LIBOR.
You should not take the historical level of the 3-month USD LIBOR rate as an indication of future levels of the 3-month USD LIBOR rate.
Neither we nor any of our affiliates make any representation to you as to the performance of the 3-month USD LIBOR rate. The actual levels of the 3-month USD LIBOR rate during the term of the notes may bear little relation to the historical levels of the 3-month USD LIBOR rate shown below.
The graph below shows the daily historical levels of the 3-month USD LIBOR rate from January 1, 2015 through November 12, 2020. We obtained the 3-month USD LIBOR rates shown in the graph below from Reuters, without independent verification.
Historical Performance of 3-month USD LIBOR

The notes are not sponsored, endorsed, sold or promoted by ICE Benchmark Administration and ICE Benchmark Administration makes no representation regarding the advisability of investing in the notes.
S-70
We intend to lend the net proceeds from the sale of the notes to The Goldman Sachs Group, Inc. or its affiliates. The Goldman Sachs Group, Inc. expects to use the proceeds from such loans for the purposes we describe in the accompanying prospectus under “Use of Proceeds”. We or our affiliates may also use those proceeds in transactions intended to hedge our obligations under the offered notes as described below.
In anticipation of the sale of the notes, we and/or our affiliates expect to enter into hedging transactions involving purchases of listed or over-the-counter options, futures and/or other instruments linked to the index, the underlying assets or 3-month USD LIBOR on or before the trade date. In addition, from time to time after we issue the notes, we and/or our affiliates expect to enter into additional hedging transactions and to unwind those we have entered into, in connection with the notes and perhaps in connection with other index-linked notes we issue, some of which may have returns linked to the index, the underlying assets or 3-month USD LIBOR. Consequently, with regard to your notes, from time to time, we and/or our affiliates:
|
● |
expect to acquire or dispose of positions in listed or over-the-counter options, futures or other instruments linked to the index or some or all of the underlying assets or 3-month USD LIBOR, |
|
● |
may take or dispose of positions in the assets held by the ETFs, |
|
● |
may take or dispose of positions in listed or over-the-counter options or other instruments based on indices designed to track the performance of the New York Stock Exchange or other components of the U.S. equity market, |
|
● |
may take short positions in the underlying assets or other securities of the kind described above — i.e., we and/or our affiliates may sell securities of the kind that we do not own or that we borrow for delivery to purchaser, and/or |
|
● |
may take or dispose of positions in interest rate swaps, options swaps and treasury bonds. |
We and/or our affiliates may acquire a long or short position in securities similar to your notes from time to time and may, in our or their sole discretion, hold or resell those securities.
In the future, we and/or our affiliates expect to close out hedge positions relating to the notes and perhaps relating to other notes with returns linked to the index, the underlying assets, 3-month USD LIBOR or assets held by the ETFs. We expect our affiliates’ steps to involve sales of instruments linked to the index, the underlying assets, 3-month USD LIBOR or assets held by the ETFs on or shortly before the determination date. Our affiliates’ steps also may involve sales and/or purchases of some or all of the listed or over-the-counter options, futures or other instruments linked to the index.
S-71
EMPLOYEE RETIREMENT INCOME SECURITY ACT
This section is only relevant to you if you are an insurance company or the fiduciary of a pension plan or an employee benefit plan (including a governmental plan, an IRA or a Keogh Plan) proposing to invest in the notes.
The U.S. Employee Retirement Income Security Act of 1974, as amended (“ERISA”) and the U.S. Internal Revenue Code of 1986, as amended (the “Code”), prohibit certain transactions (“prohibited transactions”) involving the assets of an employee benefit plan that is subject to the fiduciary responsibility provisions of ERISA or Section 4975 of the Code (including individual retirement accounts, Keogh plans and other plans described in Section 4975(e)(1) of the Code) (a “Plan”) and certain persons who are “parties in interest” (within the meaning of ERISA) or “disqualified persons” (within the meaning of the Code) with respect to the Plan; governmental plans may be subject to similar prohibitions unless an exemption applies to the transaction. The assets of a Plan may include assets held in the general account of an insurance company that are deemed “plan assets” under ERISA or assets of certain investment vehicles in which the Plan invests. Each of The Goldman Sachs Group, Inc. and certain of its affiliates may be considered a “party in interest” or a “disqualified person” with respect to many Plans, and, accordingly, prohibited transactions may arise if the notes are acquired by or on behalf of a Plan unless those notes are acquired and held pursuant to an available exemption. In general, available exemptions include: transactions effected on behalf of that Plan by a “qualified professional asset manager” (prohibited transaction exemption 84-14) or an “in-house asset manager” (prohibited transaction exemption 96- 23), transactions involving insurance company general accounts (prohibited transaction exemption 95-60), transactions involving insurance company pooled separate accounts (prohibited transaction exemption 90-1), transactions involving bank collective investment funds (prohibited transaction exemption 91-38) and transactions with service providers under Section 408(b)(17) of ERISA and Section 4975(d)(20) of the Code where the Plan receives no less and pays no more than “adequate consideration” (within the meaning of Section 408(b)(17) of ERISA and Section 4975(f)(10) of the Code). The person making the decision on behalf of a Plan or a governmental plan shall be deemed, on behalf of itself and the plan, by purchasing and holding the notes, or exercising any rights related thereto, to represent that (a) the plan will receive no less and pay no more than “adequate consideration” (within the meaning of Section 408(b)(17) of ERISA and Section 4975(f)(10) of the Code) in connection with the purchase and holding of the notes, (b) none of the purchase, holding or disposition of the notes or the exercise of any rights related to the notes will result in a non-exempt prohibited transaction under ERISA or the Code (or, with respect to a governmental plan, under any similar applicable law or regulation), and (c) neither The Goldman Sachs Group, Inc. nor any of its affiliates is a “fiduciary” (within the meaning of Section 3(21) of ERISA or, with respect to a governmental plan, under any similar applicable law or regulation) with respect to the purchaser or holder in connection with such person’s acquisition, disposition or holding of the notes, or as a result of any exercise by The Goldman Sachs Group, Inc. or any of its affiliates of any rights in connection with the notes, and neither The Goldman Sachs Group, Inc. nor any of its affiliates has provided investment advice in connection with such person’s acquisition, disposition or holding of the notes.
|
If you are an insurance company or the fiduciary of a pension plan or an employee benefit plan (including a governmental plan, an IRA or a Keogh plan) and propose to invest in the notes, you should consult your legal counsel. |
S-72
SUPPLEMENTAL PLAN OF DISTRIBUTION
With respect to each note to be issued, GS Finance Corp. expects to agree to sell to GS&Co., and GS&Co. expects to agree to purchase from GS Finance Corp., the principal amount of the notes specified, at the price specified under “Net proceeds to the issuer”, in the applicable pricing supplement. GS&Co. proposes initially to offer each note it purchases to the public at the original issue price specified in the applicable pricing supplement and, if the applicable pricing supplement so provides, to certain securities dealers at such price less a concession or no concession as specified in the applicable pricing supplement.
In the future, GS&Co. or other affiliates of GS Finance Corp. may repurchase and resell the notes in market-making transactions, with resales being made at prices related to prevailing market prices at the time of resale or at negotiated prices. The estimated share of GS Finance Corp. of the total offering expenses for your notes, excluding underwriting discounts and commissions and marketing and licensing fees, will be provided in the applicable pricing supplement. For more Information about the plan of distribution and possible market-making activities, see “Plan of Distribution” in the accompanying prospectus.
Any notes which are the subject of the offering contemplated by this index supplement, the accompanying prospectus, the accompanying prospectus supplement, the applicable product supplement, if any, and the applicable pricing supplement may not be offered, sold or otherwise made available to any retail investor in the European Economic Area or in the United Kingdom (each, a “Relevant State”). Consequently no key information document required by Regulation (EU) No 1286/2014 (the “PRIIPs Regulation”) for offering or selling the notes or otherwise making them available to retail investors in any Relevant State has been prepared and therefore offering or selling the notes or otherwise making them available to any retail investor in any Relevant State may be unlawful under the PRIIPs Regulation. For the purposes of this provision:
|
(a) |
the expression “retail investor” means a person who is one (or more) of the following: |
|
|
(i) |
a retail client as defined in point (11) of Article 4(1) of Directive 2014/65/EU (as amended, “MiFID II”); or |
|
|
(ii) |
a customer within the meaning of Directive (EU) 2016/97 (the Insurance Distribution Directive), where that customer would not qualify as a professional client as defined in point (10) of Article 4(1) of MiFID II; or |
|
|
(iii) |
not a qualified investor as defined in Regulation (EU) 2017/1129 (the "Prospectus Regulation"); and |
|
(b) |
the expression an “offer” includes the communication in any form and by any means of sufficient information on the terms of the offer and the notes to be offered so as to enable an investor to decide to purchase or subscribe for the notes. |
Notes which have a maturity of less than one year may not be offered or sold other than to persons whose ordinary activities involve them in acquiring, holding, managing or disposing of investments (as principal or as agent) for the purposes of their businesses or who it is reasonable to expect will acquire, hold, manage or dispose of investments (as principal or agent) for the purposes of their businesses where the issue of the notes would otherwise constitute a contravention of Section 19 of the Financial Services and Markets Act 2000, as amended (the “FSMA”) by GS Finance Corp.
Any invitation or inducement to engage in investment activity (within the meaning of Section 21 of the FSMA) in connection with the issue or sale of the notes may only be communicated or caused to be communicated in circumstances in which Section 21(1) of the FSMA does not apply to GS Finance Corp. or The Goldman Sachs Group, Inc.
All applicable provisions of the FSMA must be complied with in respect to anything done by any person in relation to the notes in, from or otherwise involving the United Kingdom.
The notes may not be offered or sold in Hong Kong by means of any document other than (i) to “professional investors” as defined in the Securities and Futures Ordinance (Cap. 571 of the Laws of Hong Kong) and any rules made thereunder, or (ii) in other circumstances which do not result in the document being a “prospectus” as defined in the Companies (Winding Up and Miscellaneous Provisions) Ordinance (Cap. 32 of the Laws of Hong Kong) or which do not constitute an offer to the public within the meaning of that Ordinance; and no advertisement, invitation or document relating to the notes may be issued or may be in the possession of any person for the purpose of issue (in each case whether in Hong Kong or elsewhere) which is directed at, or the contents of which are likely to be accessed or read by, the public in Hong Kong (except if permitted to do so under the securities laws of Hong Kong) other than with respect to the notes which are or are intended to be disposed of only to persons outside Hong Kong or only to “professional investors” as defined in the Securities and Futures Ordinance and any rules made thereunder.
This index supplement, along with the applicable pricing supplement, the accompanying prospectus supplement and the accompanying prospectus have not been registered as a prospectus with the Monetary Authority of Singapore. Accordingly, this index supplement, along with the applicable pricing supplement, the accompanying prospectus supplement and the accompanying prospectus and any other document or material in connection with the offer or sale, or
S-73
invitation for subscription or purchase, of the notes may not be circulated or distributed, nor may the notes be offered or sold, or be made the subject of an invitation for subscription or purchase, whether directly or indirectly, to persons in Singapore other than (i) to an institutional investor (as defined in Section 4A of the Securities and Futures Act, Chapter 289 of Singapore (the “SFA”)) under Section 274 of the SFA, (ii) to a relevant person (as defined in Section 275(2) of the SFA) pursuant to Section 275(1) of the SFA, or any person pursuant to Section 275(1A) of the SFA, and in accordance with the conditions specified in Section 275 of the SFA or (iii) otherwise pursuant to, and in accordance with the conditions of, any other applicable provision of the SFA, in each case subject to conditions set forth in the SFA.
Where the notes are subscribed or purchased under Section 275 of the SFA by a relevant person which is a corporation (which is not an accredited investor (as defined in Section 4A of the SFA)) the sole business of which is to hold investments and the entire share capital of which is owned by one or more individuals, each of whom is an accredited investor, the securities (as defined in Section 239(1) of the SFA) of that corporation shall not be transferable for six months after that corporation has acquired the notes under Section 275 of the SFA except: (1) to an institutional investor under Section 274 of the SFA or to a relevant person (as defined in Section 275(2) of the SFA), (2) where such transfer arises from an offer in that corporation’s securities pursuant to Section 275(1A) of the SFA, (3) where no consideration is or will be given for the transfer, (4) where the transfer is by operation of law, (5) as specified in Section 276(7) of the SFA, or (6) as specified in Regulation 32 of the Securities and Futures (Offers of Investments) (Shares and Debentures) Regulations 2005 of Singapore (“Regulation 32”).
Where the notes are subscribed or purchased under Section 275 of the SFA by a relevant person which is a trust (where the trustee is not an accredited investor (as defined in Section 4A of the SFA)) whose sole purpose is to hold investments and each beneficiary of the trust is an accredited investor, the beneficiaries’ rights and interest (howsoever described) in that trust shall not be transferable for six months after that trust has acquired the notes under Section 275 of the SFA except: (1) to an institutional investor under Section 274 of the SFA or to a relevant person (as defined in Section 275(2) of the SFA), (2) where such transfer arises from an offer that is made on terms that such rights or interest are acquired at a consideration of not less than S$200,000 (or its equivalent in a foreign currency) for each transaction (whether such amount is to be paid for in cash or by exchange of securities or other assets), (3) where no consideration is or will be given for the transfer, (4) where the transfer is by operation of law, (5) as specified in Section 276(7) of the SFA, or (6) as specified in Regulation 32.
The notes have not been and will not be registered under the Financial Instruments and Exchange Act of Japan (Act No. 25 of 1948, as amended), or the FIEA. The notes may not be offered or sold, directly or indirectly, in Japan or to or for the benefit of any resident of Japan (including any person resident in Japan or any corporation or other entity organized under the laws of Japan) or to others for reoffering or resale, directly or indirectly, in Japan or to or for the benefit of any resident of Japan, except pursuant to an exemption from the registration requirements of the FIEA and otherwise in compliance with any relevant laws and regulations of Japan.
The notes are not offered, sold or advertised, directly or indirectly, in, into or from Switzerland on the basis of a public offering and will not be listed on the SIX Swiss Exchange or any other offering or regulated trading facility in Switzerland. Accordingly, neither this index supplement nor any accompanying prospectus supplement, prospectus or other marketing material constitute a prospectus as defined in article 652a or article 1156 of the Swiss Code of Obligations or a listing prospectus as defined in article 32 of the Listing Rules of the SIX Swiss Exchange or any other regulated trading facility in Switzerland. Any resales of the notes by the underwriters thereof may only be undertaken on a private basis to selected individual investors in compliance with Swiss law. This index supplement and accompanying prospectus and prospectus supplement may not be copied, reproduced, distributed or passed on to others or otherwise made available in Switzerland without our prior written consent. By accepting this index supplement and accompanying prospectus and prospectus supplement or by subscribing to the notes, investors are deemed to have acknowledged and agreed to abide by these restrictions. Investors are advised to consult with their financial, legal or tax advisers before investing in the notes.
The notes will not be listed on any securities exchange or interdealer quotation system.
GS&Co. is an affiliate of GS Finance Corp. and The Goldman Sachs Group, Inc. and, as such, will have a “conflict of interest” in any offering of notes within the meaning of Financial Industry Regulatory Authority, Inc. (FINRA) Rule 5121. Consequently, any offering of notes will be conducted in compliance with the provisions of FINRA Rule 5121. GS&Co. will not be permitted to sell notes in any offering to an account over which it exercises discretionary authority without the prior specific written approval of the account holder.
S-74
|
|
|
GS Finance Corp. Medium-Term Notes, Series E Medium-Term Notes, Series F guaranteed by The Goldman Sachs Group, Inc.
BlackRock® Dynamic Factor Index Supplement No. 10 Notes Linked to the Performance of the BlackRock® Dynamic Factor Index
|
|
|
TABLE OF CONTENTS |
|||
|
|
|||
|
BlackRock® Dynamic Factor Index Supplement No. 10 |
|||
|
|
|||
|
|
Page |
||
|
S-3 |
|||
|
S-9 |
|||
|
S-15 |
|||
|
S-71 |
|||
|
S-71 |
|||
|
S-72 |
|||
|
S-73 |
|||
|
S-74 |
|||
|
|
|||
