
Nutanix Reports First Quarter Fiscal 2021 Financial Results
-- Delivers Strong Start to the Fiscal Year with ACV Billings up 10% YoY
-- Grows Run-rate ACV to $1.3 Billion, up 29% YoY
-- Reaches Record-High New ACV from New Products, up 87% YoY
SAN JOSE, Calif.--(BUSINESS WIRE)-- Nutanix, Inc. (NASDAQ: NTNX), a leader in private cloud, hybrid, and multicloud computing, today announced financial results for its first quarter ended October 31, 2020.
This press release features multimedia. View the full release here: https://www.businesswire.com/news/home/20201123006190/en/
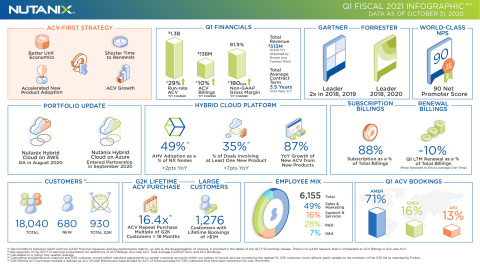
Nutanix Q1FY21 Earnings Infographic (Graphic: Nutanix)
“We are pleased with our financial performance in the first quarter, which marked a strong start to fiscal 2021 including increased adoption of new products as well as continued growth in our core hyperconverged infrastructure software,” said Dheeraj Pandey, Chairman, Co-Founder and CEO of Nutanix. “After launching our solutions on AWS in August, we announced a major partnership with Microsoft to develop our portfolio on Azure, placing the Nutanix HCI (Hybrid Cloud Infrastructure) at a significant competitive advantage to help our customers build out their hybrid and multicloud environments.”
“Our ACV-first strategy and solid go-to-market execution drove outperformance across all key financial metrics including ACV billings growth of 10 percent year-over-year and run-rate ACV growth of 29 percent year-over-year,” said Duston Williams, CFO of Nutanix. “Looking ahead, we remain focused on thoughtfully managing operating expenses as we continue to execute on our business model transformation and are confident in Nutanix’s ability to drive long-term growth for the benefit of all stakeholders.”
First Quarter Fiscal 2021 Financial Summary
|
Q1 FY’21 |
Q1 FY’20 |
Y/Y Change |
|||
Annual Contract Value (ACV)1 Billings |
$137.8 million |
|
$125.6 million |
|
10% |
|
Run-rate Annual Contract Value (ACV)2 |
$1.29 billion |
|
$1.00 billion |
|
29% |
|
Total Average Contract Term3 |
3.5 years |
|
3.9 years |
|
(0.4) years |
|
Total Revenue4 |
$312.8 million |
|
$314.8 million |
|
(0.6)% |
|
GAAP Gross Margin |
78.3% |
|
77.1% |
|
120 bps |
|
Non-GAAP Gross Margin |
81.9% |
|
80.1% |
|
180 bps |
|
GAAP Operating Expenses |
$426.9 million |
|
$462.9 million |
|
(8)% |
|
Non-GAAP Operating Expenses |
$341.2 million |
|
$386.3 million |
|
(12)% |
|
Free Cash Flow |
$(16.3) million |
|
$(44.4) million |
|
$28 million |
Reconciliations between GAAP and non-GAAP financial measures and key performance measures are provided in the tables of this press release.
Recent Company Highlights
- Entered into a Partnership with Microsoft Azure: Nutanix announced a new partnership with Microsoft that will enable both companies to deliver a hybrid cloud solution with seamless application, data, and license mobility as well as unified management across on-premises and Azure environments, using Nutanix HCI (Hybrid Cloud Infrastructure) on Azure.
- Reset the Bar for Innovation in Hyperconverged Infrastructure Market: Nutanix introduced major new capabilities in its popular hyperconverged infrastructure software, delivering significant innovation to datacenter and cloud customers, which will result in up to 50% faster performance, easier cloud deployments with native virtual networking, simplified Zero-Trust security, and expanded automation and budgeting capabilities for cloud resources.
- Expanded Innovation Including Launch of Karbon Container Technology: Additional innovation during the quarter continued in both the core platform and new products with announcements about new capabilities added to the hyperconverged infrastructure software platform, significant updates to the Database-as-a-Service solution (Era), as well as the launch of a new Kubernetes-based PaaS solution (Karbon Platform Services) to democratize containers beyond DevOps for IT operators, building on the AHV revolution to revolutionize hypervisors.
- Introduced New Cloud Partner Program: Nutanix announced Elevate, a new global partner program, to simplify engagement for Nutanix’s entire partner ecosystem using a consistent set of tools, resources, and marketing platforms to take advantage of cloud business models. Under one integrated architecture, Elevate enables Value Added Resellers, Value Added Distributors, Service Providers and Telcos, Hyperscalers, Independent Software, Hardware, and Platform Vendors, Global System Integrators, and Services Delivery Partners to grow their business with hybrid and multicloud solutions.
- Launched the Third Annual Enterprise Cloud Index, Showing Importance of Hybrid Cloud: For the third year, Nutanix partnered with a leading third-party research firm to analyze key trends and priorities in the industry. This year, the survey also provided a window into companies’ responses to COVID-19 and how it affected spending priorities. The research showed that IT leaders overwhelmingly (86%) continue to see hybrid cloud as the ideal deployment model, and that companies are taking important steps in their digital transformation journey including deploying hyperconverged infrastructure.
- Expanded New Customer Base and New Business with Existing Customers: Despite the ongoing pandemic, Nutanix continued to add new customers, ending the first quarter of fiscal 2021 with a total of 18,040 end-customers. Further, Nutanix saw increased demand from new and existing customers for both new products and new workloads. First quarter customer wins included the following Global 2000 companies: Allianz (China) Insurance Holding Co., Ltd, CaixaBank, HCL Technologies Limited, Nomura Research Institute, Ltd., Royal Vopak, Teleperformance Colombia, and more.
- Transformed .NEXT to Digital Experience: Nutanix held its largest ever .NEXT user conference this year, 100% virtually, with record attendance of over 40,000 prospects, customers and partners across multiple time zones and languages, resulting in a record weekly number of Test Drives and product trials. In addition, .NEXT is on track to deliver strong pipeline generation at a significantly lower cost than in-person events.
Second Quarter Fiscal 2021 Outlook
|
Q2 FY’21 Outlook |
|||||
ACV Billings |
$145-$148 million |
|||||
Non-GAAP Gross Margin |
Approximately 81.5% |
|||||
Non-GAAP Operating Expenses |
$360-$370 million |
|||||
Weighted Shares Outstanding |
Approximately 202 million |
Supplementary materials to this press release, including our first quarter fiscal year 2021 earnings presentation, can be found at https://ir.nutanix.com/company/financial.
Webcast and Conference Call Information
Nutanix executives will discuss the company’s first quarter fiscal 2021 financial results on a conference call at 4:30 p.m. Eastern Time/1:30 p.m. Pacific Time. To listen to the call via telephone, dial 1-833-227-5841 from within the United States or 1-647-689-4068 from outside the United States. The conference ID is 3994985. This call will be webcast live and available to all interested parties on our Investor Relations website at ir.nutanix.com. Shortly after the conclusion of the conference call, a replay of the audio webcast will be available on our Investor Relations website. A telephonic replay will be available for one week and can be accessed by calling 1-800-585-8367 or 1-416-621-4642, and entering the conference ID 3994985.
Definitions and Total Revenue Impact
1Annual Contract Value, or ACV, is defined as the total annualized value of a contract, excluding amounts related to professional services and hardware. The total annualized value for a contract is calculated by dividing the total value of the contract by the number of years in the term of such contract, using, where applicable, an assumed term of five years for contracts that do not have a specified term. ACV Billings for any given period is defined as the sum of the ACV for all contracts billed during the given period.
2Run-rate ACV at the end of any period, is the sum of ACV for all contracts that are in effect as of the end of that period. For the purposes of this calculation, the company assumes that the contract term begins on the date a contract is booked, irrespective of the periods in which we would recognize revenue for such contract.
3Total Average Contract Term represents the dollar-weighted term, calculated on a billings basis, across all subscription and life-of-device contracts, using an assumed term of five years for life-of-device licenses, executed in the quarter.
4Total Revenue was negatively impacted by year-over-year decline in average contract term associated with the ongoing transition to a subscription-based business model.
Non-GAAP Financial Measures and Other Key Performance Measures
To supplement our consolidated financial statements, which are prepared and presented in accordance with GAAP, we use the following non-GAAP financial and other key performance measures: billings, non-GAAP gross margin, non-GAAP operating expenses, non-GAAP net loss, non-GAAP net loss per share, free cash flow, subscription revenue, subscription billings, Annual Contract Value billings (or ACV billings), Run-rate Annual Contract Value (or Run-rate ACV), and professional services billings. In computing these non-GAAP financial measures and key performance measures, we exclude certain items such as stock-based compensation and the related income tax impact, costs associated with our acquisitions (such as amortization of acquired intangible assets, income tax-related impact, and other acquisition-related costs), impairment of operating lease-related assets, change in fair value of derivative liability, amortization of debt discount and issuance costs, non-cash interest expense, other non-recurring transactions and the related tax impact, and the revenue and billings associated with pass-through hardware sales. Billings is a performance measure which we believe provides useful information to investors because it represents the amounts under binding purchase orders received by us during a given period that have been billed, and we calculate billings by adding the change in deferred revenue between the start and end of the period to total revenue recognized in the same period. Non-GAAP gross margin, non-GAAP operating expenses, non-GAAP net loss, and non-GAAP net loss per share are financial measures which we believe provide useful information to investors because they provide meaningful supplemental information regarding our performance and liquidity by excluding certain expenses and expenditures such as stock-based compensation expense that may not be indicative of our ongoing core business operating results. Free cash flow is a performance measure that we believe provides useful information to our management and investors about the amount of cash generated by the business after necessary capital expenditures, and we define free cash flow as net cash used in operating activities less purchases of property and equipment. Subscription revenue, subscription billings, and professional services billings are performance measures that we believe provide useful information to our management and investors as they allow us to better track the growth of the subscription-based portion of our business, which is a critical part of our business plan. ACV billings and Run-rate ACV are performance measures that we believe provide useful information to our management and investors as they allow us to better track the topline growth of our business during our transition to a subscription-based business model because they take into account variability in term lengths. We use these non-GAAP financial and key performance measures for financial and operational decision-making and as a means to evaluate period-to-period comparisons. However, these non-GAAP financial and key performance measures have limitations as analytical tools and you should not consider them in isolation or as substitutes for analysis of our results as reported under GAAP. Billings, non-GAAP gross margin, non-GAAP operating expenses, non-GAAP net loss, non-GAAP net loss per share, and free cash flow are not substitutes for total revenue, gross margin, operating expenses, net loss, net loss per share, or net cash (used in) provided by operating activities, respectively; subscription revenue is not a substitute for total revenue; and subscription and professional services billings are not substitutes for subscription and professional services revenue, respectively. There is no GAAP measure that is comparable to either ACV billings or Run-rate ACV, so we have not reconciled either ACV billings or Run-rate ACV numbers included in this press release to any GAAP measure. In addition, other companies, including companies in our industry, may calculate non-GAAP financial measures and key performance measures differently or may use other measures to evaluate their performance, all of which could reduce the usefulness of our non-GAAP financial measures and key performance measures as tools for comparison. We urge you to review the reconciliation of our non-GAAP financial measures and key performance measures to the most directly comparable GAAP financial measures included below in the tables captioned “Reconciliation of Revenue to Billings,” “Disaggregation of Revenue and Billings,” “Reconciliation of Subscription and Professional Services Revenue to Subscription and Professional Services Billings,” “Reconciliation of GAAP to Non-GAAP Profit Measures,” and “Reconciliation of GAAP Net Cash Used In Operating Activities to Non-GAAP Free Cash Flow,” and not to rely on any single financial measure to evaluate our business.
Forward-Looking Statements
This press release contains express and implied forward-looking statements, including, but not limited to, statements regarding: our business plans, initiatives, objectives and outlook, including changes we have made or anticipate making in response to the COVID-19 pandemic and the launch of our new global partner program, our ability to manage our business during the pandemic, and the position we anticipate being in following the pandemic; our ability to execute such plans, initiatives and objectives successfully and in a timely manner, and the benefits and impact of such plans, initiatives and objectives, including our ability to manage our expenses and decrease our cash usage in future periods and drive long-term growth; the competitive market, including our competitive position, our projections about our market share and the size of our total addressable market; our customer needs and our response to those needs; the benefits and capabilities of our platform, solutions, products, services and technology, including the interoperability and availability of our solutions with and on third-party platforms; our plans and expectations regarding new products, services, product features and technology, including those that are still under development or in process; the success and impact of our customer, partner, industry, analyst, investor, and employee events on our business, including on future pipeline generation; our plans and timing for, and the success and impact of, our transition to a subscription-based business model and our changes in guidance metrics; the timing and potential impact of the COVID-19 pandemic on the global market environment and the IT industry, as well as on our business, operations and financial results, including the actions we have taken to manage operating expenses; and our guidance on estimated ACV Billings, non-GAAP gross margin, non-GAAP operating expenses and weighted shares outstanding for any future fiscal periods. These forward-looking statements are not historical facts and instead are based on our current expectations, estimates, opinions, and beliefs. Consequently, you should not rely on these forward-looking statements. The accuracy of these forward-looking statements depends upon future events and involves risks, uncertainties, and other factors, including factors that may be beyond our control, that may cause these statements to be inaccurate and cause our actual results, performance or achievements to differ materially and adversely from those anticipated or implied by such statements, including, among others: failure to successfully implement or realize the full benefits of, or unexpected difficulties or delays in successfully implementing or realizing the full benefits of, our business plans, initiatives and objectives; the timing, breadth, and impact of the COVID-19 pandemic on our business, operations, and financial results, as well as the impact on our customers, partners, and end markets; failure to timely and successfully meet our customer needs; delays in or lack of customer or market acceptance of our new products, services, product features or technology; delays or unexpected accelerations in the transition to a subscription-based business model; the rapid evolution of the markets in which we compete; our ability to achieve, sustain and/or manage future growth effectively; factors that could result in the significant fluctuation of our future quarterly operating results, including, among other things, anticipated changes to our revenue and product mix, including changes as a result of our transition to a subscription-based business model, which will slow revenue growth during such transition and make forecasting future performance more difficult, the timing and magnitude of orders, shipments and acceptance of our solutions in any given quarter, our ability to attract new and retain existing end-customers, changes in the pricing of certain components of our solutions, and fluctuations in demand and competitive pricing pressures for our solutions; the introduction, or acceleration of adoption of, competing solutions, including public cloud infrastructure; and other risks detailed in our Annual Report on Form 10-K for the fiscal year ended July 31, 2020, filed with the U.S. Securities and Exchange Commission, or the SEC, on September 23, 2020. Additional information will also be set forth in our Quarterly Report on Form 10-Q that will be filed for the fiscal quarter ended October 31, 2020 which should be read in conjunction with this press release and the financial results included herein. Our SEC filings are available on the Investor Relations section of the company’s website at ir.nutanix.com and on the SEC's website at www.sec.gov. These forward-looking statements speak only as of the date of this press release and, except as required by law, we assume no obligation, and expressly disclaim any obligation, to update, alter or otherwise revise any of these forward-looking statements to reflect actual results or subsequent events or circumstances.
About Nutanix
Nutanix is a global leader in cloud software and a pioneer in hyperconverged infrastructure solutions, making computing invisible anywhere. Organizations around the world use Nutanix software to leverage a single platform to manage any app at any location for their private, hybrid and multicloud environments. Learn more at www.nutanix.com or follow us on Twitter @nutanix.
© 2020 Nutanix, Inc. All rights reserved. Nutanix, the Nutanix logo, and all Nutanix product and service names mentioned herein are registered trademarks or trademarks of Nutanix, Inc. in the United States and other countries. All other brand names mentioned herein are for identification purposes only and may be the trademarks of their respective holder(s). This press release contains links to external websites that are not part of Nutanix.com. Nutanix does not control these sites and disclaims all responsibility for the content or accuracy of any external site. Our decision to link to an external site should not be considered an endorsement of any content on such a site.
NUTANIX, INC. |
||||||||
CONDENSED CONSOLIDATED BALANCE SHEETS |
||||||||
(Unaudited) |
||||||||
|
As of |
|||||||
|
July 31,
|
October 31,
|
||||||
|
|
|
||||||
|
(in thousands) |
|||||||
Assets |
|
|
||||||
Current assets: |
|
|
||||||
Cash and cash equivalents |
$ |
318,737 |
|
$ |
504,482 |
|
||
Short-term investments |
|
401,041 |
|
|
813,603 |
|
||
Accounts receivable, net |
|
242,516 |
|
|
183,270 |
|
||
Deferred commissions—current |
|
68,694 |
|
|
76,047 |
|
||
Prepaid expenses and other current assets |
|
63,032 |
|
|
56,719 |
|
||
Total current assets |
|
1,094,020 |
|
|
1,634,121 |
|
||
Property and equipment, net |
|
143,172 |
|
|
133,156 |
|
||
Operating lease right-of-use assets |
|
127,326 |
|
|
126,542 |
|
||
Deferred commissions—non-current |
|
146,834 |
|
|
167,711 |
|
||
Intangible assets, net |
|
49,392 |
|
|
45,047 |
|
||
Goodwill |
|
185,260 |
|
|
185,260 |
|
||
Other assets—non-current |
|
22,543 |
|
|
24,035 |
|
||
Total assets |
$ |
1,768,547 |
|
$ |
2,315,872 |
|
||
|
|
|
||||||
Liabilities and Stockholders’ Deficit |
|
|
||||||
Current liabilities: |
|
|
||||||
Accounts payable |
$ |
54,029 |
|
$ |
48,272 |
|
||
Accrued compensation and benefits |
|
109,109 |
|
|
115,725 |
|
||
Accrued expenses and other current liabilities |
|
25,924 |
|
|
24,563 |
|
||
Deferred revenue—current |
|
534,572 |
|
|
549,938 |
|
||
Operating lease liabilities—current |
|
36,569 |
|
|
41,080 |
|
||
Total current liabilities |
|
760,203 |
|
|
779,578 |
|
||
Deferred revenue—non-current |
|
648,869 |
|
|
656,545 |
|
||
Operating lease liabilities—non-current |
|
116,794 |
|
|
113,491 |
|
||
Convertible senior notes, net |
|
490,222 |
|
|
994,637 |
|
||
Derivative liability |
|
— |
|
|
295,650 |
|
||
Other liabilities—non-current |
|
27,436 |
|
|
33,326 |
|
||
Total liabilities |
|
2,043,524 |
|
|
2,873,227 |
|
||
Stockholders’ deficit: |
|
|
||||||
Common stock |
|
5 |
|
|
5 |
|
||
Additional paid-in capital |
|
2,245,180 |
|
|
2,299,903 |
|
||
Accumulated other comprehensive income |
|
2,030 |
|
|
880 |
|
||
Accumulated deficit |
|
(2,522,192 |
) |
|
(2,858,143 |
) |
||
Total stockholders’ deficit |
|
(274,977 |
) |
|
(557,355 |
) |
||
Total liabilities and stockholders’ deficit |
$ |
1,768,547 |
|
$ |
2,315,872 |
|
||
NUTANIX, INC. |
||||||||
CONDENSED CONSOLIDATED STATEMENTS OF OPERATIONS |
||||||||
(Unaudited) |
||||||||
|
Three Months Ended
|
|||||||
|
2019 |
2020 |
||||||
|
|
|
||||||
|
(in thousands, except per share data) |
|||||||
Revenue: |
|
|
||||||
Product |
$ |
192,444 |
|
$ |
155,752 |
|
||
Support, entitlements and other services |
|
122,324 |
|
|
157,002 |
|
||
Total revenue |
|
314,768 |
|
|
312,754 |
|
||
Cost of revenue: |
|
|
||||||
Product (1)(2) |
|
21,233 |
|
|
12,814 |
|
||
Support, entitlements and other services (1) |
|
50,968 |
|
|
55,145 |
|
||
Total cost of revenue |
|
72,201 |
|
|
67,959 |
|
||
Gross profit |
|
242,567 |
|
|
244,795 |
|
||
Operating expenses: |
|
|
||||||
Sales and marketing (1)(2) |
|
291,838 |
|
|
257,290 |
|
||
Research and development (1) |
|
138,206 |
|
|
135,804 |
|
||
General and administrative (1) |
|
32,860 |
|
|
33,774 |
|
||
Total operating expenses |
|
462,904 |
|
|
426,868 |
|
||
Loss from operations |
|
(220,337 |
) |
|
(182,073 |
) |
||
Other expense, net |
|
(5,040 |
) |
|
(78,732 |
) |
||
Loss before provision for income taxes |
|
(225,377 |
) |
|
(260,805 |
) |
||
Provision for income taxes |
|
3,923 |
|
|
4,243 |
|
||
Net loss |
$ |
(229,300 |
) |
$ |
(265,048 |
) |
||
Net loss per share attributable to Class A and Class B common stockholders—basic and diluted |
$ |
(1.21 |
) |
$ |
(1.31 |
) |
||
Weighted average shares used in computing net loss per share attributable to Class A and Class B common stockholders—basic and diluted |
|
189,671 |
|
|
203,095 |
|
||
| __________________________________________________ | |
(1) |
Includes the following stock-based compensation expense: |
|
Three Months Ended
|
|||||||
|
2019 |
2020 |
||||||
|
|
|
||||||
|
(in thousands) |
|||||||
Product cost of revenue |
$ |
1,112 |
|
$ |
1,504 |
|
||
Support, entitlements and other services cost of revenue |
|
4,751 |
|
5,761 |
||||
Sales and marketing |
|
27,775 |
|
|
32,227 |
|
||
Research and development |
|
37,563 |
|
|
37,887 |
|
||
General and administrative |
|
10,225 |
|
|
11,819 |
|
||
Total stock-based compensation expense |
$ |
81,426 |
|
$ |
89,198 |
|
||
(2) |
Includes the following amortization of intangible assets: |
|
Three Months Ended
|
|||||||
|
2019 |
2020 |
||||||
|
|
|
||||||
|
(in thousands) |
|||||||
Product cost of revenue |
$ |
3,694 |
|
$ |
3,694 |
|
||
Sales and marketing |
|
651 |
|
651 |
||||
Total amortization of intangible assets |
$ |
4,345 |
|
$ |
4,345 |
|
||
NUTANIX, INC. |
||||||||
CONDENSED CONSOLIDATED STATEMENTS OF CASH FLOWS |
||||||||
(Unaudited) |
||||||||
|
Three Months Ended
|
|||||||
|
2019 |
2020 |
||||||
|
|
|
||||||
|
(in thousands) |
|||||||
Cash flows from operating activities: |
|
|
||||||
Net loss |
$ |
(229,300 |
) |
$ |
(265,048 |
) |
||
Adjustments to reconcile net loss to net cash used in operating activities: |
|
|
||||||
Depreciation and amortization |
|
22,462 |
|
|
23,499 |
|
||
Stock-based compensation |
|
81,426 |
|
|
89,198 |
|
||
Change in fair value of derivative liability |
|
— |
|
|
64,740 |
|
||
Amortization of debt discount and debt issuance costs |
|
7,635 |
|
|
11,708 |
|
||
Operating lease cost, net of accretion |
|
6,671 |
|
|
8,347 |
|
||
Impairment of lease-related assets |
|
— |
|
|
2,822 |
|
||
Non-cash interest expense |
|
— |
|
|
1,952 |
|
||
Other |
|
103 |
|
|
1,671 |
|
||
Changes in operating assets and liabilities: |
|
|
||||||
Accounts receivable, net |
|
30,592 |
|
|
60,094 |
|
||
Deferred commissions |
|
(18,313 |
) |
|
(28,230 |
) |
||
Prepaid expenses and other assets |
|
16,150 |
|
|
6,222 |
|
||
Accounts payable |
|
5,208 |
|
|
(4,075 |
) |
||
Accrued compensation and benefits |
|
(4,786 |
) |
|
10,041 |
|
||
Accrued expenses and other liabilities |
|
(5,772 |
) |
|
(1,238 |
) |
||
Operating leases, net |
|
(3,469 |
) |
|
(7,970 |
) |
||
Deferred revenue |
|
65,230 |
|
|
22,194 |
|
||
Net cash used in operating activities |
|
(26,163 |
) |
|
(4,073 |
) |
||
Cash flows from investing activities: |
|
|
||||||
Maturities of investments |
|
171,441 |
|
|
97,578 |
|
||
Purchases of investments |
|
(321,474 |
) |
|
(513,998 |
) |
||
Sales of investments |
|
7,870 |
|
|
— |
|
||
Purchases of property and equipment |
|
(18,203 |
) |
|
(12,252 |
) |
||
Net cash used in investing activities |
|
(160,366 |
) |
|
(428,672 |
) |
||
Cash flows from financing activities: |
|
|
||||||
Proceeds from sales of shares through employee equity incentive plans |
|
23,973 |
|
|
19,600 |
|
||
Proceeds from the issuance of convertible notes, net of issuance costs |
|
— |
|
|
723,757 |
|
||
Repurchases of common stock |
|
— |
|
|
(125,079 |
) |
||
Net cash provided by financing activities |
|
23,973 |
|
|
618,278 |
|
||
Net (decrease) increase in cash, cash equivalents and restricted cash |
$ |
(162,556 |
) |
$ |
185,533 |
|
||
Cash, cash equivalents and restricted cash—beginning of period |
|
399,520 |
|
|
321,991 |
|
||
Cash, cash equivalents and restricted cash—end of period |
$ |
236,964 |
|
$ |
507,524 |
|
||
Restricted cash (1) |
|
3,144 |
|
|
3,042 |
|
||
Cash and cash equivalents—end of period |
$ |
233,820 |
|
$ |
504,482 |
|
||
Supplemental disclosures of cash flow information: |
|
|
||||||
Cash paid for income taxes |
$ |
7,779 |
|
$ |
5,050 |
|
||
Supplemental disclosures of non-cash investing and financing information: |
|
|
||||||
Purchases of property and equipment included in accounts payable and accrued liabilities |
$ |
12,200 |
|
$ |
2,948 |
|
||
| __________________________________________________ | |
(1) |
Included within other assets—non-current in the condensed consolidated balance sheets. |
Reconciliation of Revenue to Billings |
||||||||
(Unaudited) |
||||||||
|
Three Months Ended
|
|||||||
|
2019 |
2020 |
||||||
|
|
|
||||||
|
(in thousands) |
|||||||
Total revenue |
$ |
314,768 |
|
$ |
312,754 |
|
||
Change in deferred revenue |
|
65,230 |
|
|
22,194 |
|
||
Total billings |
$ |
379,998 |
|
$ |
334,948 |
|
||
Disaggregation of Revenue and Billings |
||||||||
(Unaudited) |
||||||||
|
Three Months Ended
|
|||||||
|
2019 |
2020 |
||||||
|
|
|
||||||
|
(in thousands) |
|||||||
Disaggregation of Revenue: |
|
|
||||||
Subscription |
$ |
217,896 |
|
$ |
278,165 |
|
||
Non-portable software |
|
77,571 |
|
|
20,043 |
|
||
Hardware |
|
9,724 |
|
|
729 |
|
||
Professional services |
|
9,577 |
|
|
13,817 |
|
||
Total revenue |
$ |
314,768 |
|
$ |
312,754 |
|
||
|
|
|
||||||
Disaggregation of Billings: |
|
|
||||||
Subscription |
$ |
275,538 |
|
$ |
293,923 |
|
||
Non-portable software |
|
77,571 |
|
|
20,043 |
|
||
Hardware |
|
9,724 |
|
|
729 |
|
||
Professional services |
|
17,165 |
|
|
20,253 |
|
||
Total billings |
$ |
379,998 |
|
$ |
334,948 |
|
||
Subscription — Subscription revenue includes any performance obligation which has a defined term, and is generated from the sales of software entitlement and support subscriptions, subscription software licenses and cloud-based Software as a Service, or SaaS offerings.
- Ratable — We recognize revenue from software entitlement and support subscriptions and SaaS offerings ratably over the contractual service period, the substantial majority of which relate to software entitlement and support subscriptions.
- Upfront — Revenue from our subscription software licenses is generally recognized upfront upon transfer of control to the customer, which happens when we make the software available to the customer.
Non-portable software — Non-portable software revenue includes sales of our enterprise cloud platform when delivered on a configured-to-order appliance by us or one of our OEM partners. The software licenses associated with these sales are typically non-portable and have a term equal to the life of the appliance on which the software is delivered. Revenue from our non-portable software products is generally recognized upon transfer of control to the customer.
Hardware — In transactions where we deliver the hardware appliance, we consider ourselves to be the principal in the transaction and we record revenue and costs of goods sold on a gross basis. We consider the amount allocated to hardware revenue to be equivalent to the cost of the hardware procured. Hardware revenue is generally recognized upon transfer of control to the customer.
Professional services — We also sell professional services with our products. We recognize revenue related to professional services as they are performed.
Annual Contract Value Billings and Run-rate Annual Contract Value |
||||||||
(Unaudited) |
||||||||
|
Three Months Ended
|
|||||||
|
2019 |
2020 |
||||||
|
|
|
||||||
|
(in thousands) |
|||||||
Annual Contract Value Billings (ACV Billings) |
$ |
125,575 |
$ |
137,831 |
|
|||
Run-rate Annual Contract Value (Run-rate ACV) |
$ |
1,002,117 |
|
$ |
1,290,742 |
|
||
Reconciliation of Subscription and Professional Services Revenue to Subscription and Professional Services Billings |
||||||||
(Unaudited) |
||||||||
|
Three Months Ended
|
|||||||
|
2019 |
2020 |
||||||
|
|
|
||||||
|
(in thousands) |
|||||||
Subscription revenue |
$ |
217,896 |
|
|
$ |
278,165 |
|
|
Change in subscription deferred revenue |
|
57,642 |
|
|
15,758 |
|||
Subscription billings |
$ |
275,538 |
|
|
$ |
293,923 |
|
|
|
|
|
|
|||||
Professional services revenue |
$ |
9,577 |
|
|
$ |
13,817 |
|
|
Change in professional services deferred revenue |
|
7,588 |
|
|
|
6,436 |
|
|
Professional services billings |
$ |
17,165 |
|
|
$ |
20,253 |
|
|
Reconciliation of GAAP to Non-GAAP Profit Measures |
||||||||||||||||||||||||||||||||||||
(Unaudited) |
||||||||||||||||||||||||||||||||||||
|
GAAP |
Non-GAAP Adjustments |
Non-GAAP |
|||||||||||||||||||||||||||||||||
|
Three Months Ended October 31, 2020 |
(1) |
|
(2) |
|
(3) |
|
(4) |
|
(5) |
|
(6) |
|
(7) |
Three Months Ended October 31, 2020 |
|||||||||||||||||||||
|
|
|
|
|
|
|
|
|
|
|||||||||||||||||||||||||||
|
(in thousands, except percentages and per share data) |
|||||||||||||||||||||||||||||||||||
Gross profit |
$ |
244,795 |
|
$ |
7,265 |
|
$ |
3,694 |
|
$ |
287 |
|
$ |
— |
|
$ |
— |
$ |
— |
$ |
— |
$ |
256,041 |
|
||||||||||||
Gross margin |
|
78.3 |
% |
|
2.3 |
% |
|
1.2 |
% |
|
0.1 |
% |
|
— |
|
|
— |
|
|
— |
|
|
— |
|
|
81.9 |
% |
|||||||||
Operating expenses: |
|
|
|
|
|
|
|
|
|
|||||||||||||||||||||||||||
Sales and marketing |
|
257,290 |
|
|
(32,227 |
) |
|
(651 |
) |
|
— |
|
|
— |
|
|
— |
|
|
— |
|
|
— |
|
|
224,412 |
|
|||||||||
Research and development |
|
135,804 |
|
|
(37,887 |
) |
|
— |
|
|
(2,535 |
) |
|
— |
|
|
— |
|
|
— |
|
|
— |
|
|
95,382 |
|
|||||||||
General and administrative |
|
33,774 |
|
|
(11,819 |
) |
|
— |
|
|
— |
|
|
(506 |
) |
|
— |
|
|
— |
|
|
— |
|
|
21,449 |
|
|||||||||
Total operating expenses |
|
426,868 |
|
|
(81,933 |
) |
|
(651 |
) |
|
(2,535 |
) |
|
(506 |
) |
|
— |
|
|
— |
|
|
— |
|
|
341,243 |
|
|||||||||
Loss from operations |
|
(182,073 |
) |
|
89,198 |
|
|
4,345 |
|
|
2,822 |
|
|
506 |
|
|
— |
|
|
— |
|
|
— |
|
|
(85,202 |
) |
|||||||||
Net loss |
$ |
(265,048 |
) |
$ |
89,198 |
|
$ |
4,345 |
|
$ |
2,822 |
|
$ |
506 |
|
$ |
64,740 |
|
$ |
13,660 |
|
$ |
393 |
|
$ |
(89,384 |
) |
|||||||||
Weighted shares outstanding, basic and diluted |
|
203,095 |
|
|
|
|
|
|
|
|
|
203,095 |
|
|||||||||||||||||||||||
Net loss per share, basic and diluted |
$ |
(1.31 |
) |
$ |
0.44 |
|
$ |
0.02 |
|
$ |
0.02 |
|
$ |
— |
|
$ |
0.32 |
|
$ |
0.07 |
|
$ |
— |
|
$ |
(0.44 |
) |
|||||||||
| __________________________________________________ | ||
(1) |
Stock-based compensation |
|
(2) |
Amortization of intangible assets |
|
(3) |
Impairment of lease-related assets |
|
(4) |
Other |
|
(5) |
Change in fair value of derivative liability |
|
(6) |
Amortization of debt discount and issuance costs and non-cash interest expense |
|
(7) |
Income tax effect primarily related to stock-based compensation expense |
|
|
GAAP |
Non-GAAP Adjustments |
Non-GAAP |
|||||||||||||||||||||||||
|
Three Months Ended October 31, 2019 |
(1) |
|
(2) |
|
(3) |
|
(4) |
|
(5) |
Three Months Ended October 31, 2019 |
|||||||||||||||||
|
|
|
|
|
|
|
|
|||||||||||||||||||||
|
(in thousands, except percentages and per share data) |
|||||||||||||||||||||||||||
Gross profit |
$ |
242,567 |
|
$ |
5,863 |
|
$ |
3,694 |
|
$ |
— |
|
$ |
— |
$ |
— |
$ |
252,124 |
|
|||||||||
Gross margin |
|
77.1 |
% |
|
1.8 |
% |
|
1.2 |
% |
|
— |
|
|
— |
|
|
— |
|
|
80.1 |
% |
|||||||
Operating expenses: |
|
|
|
|
|
|
|
|||||||||||||||||||||
Sales and marketing |
|
291,838 |
|
|
(27,775 |
) |
|
(651 |
) |
|
— |
|
|
— |
|
|
— |
|
|
263,412 |
|
|||||||
Research and development |
|
138,206 |
|
|
(37,563 |
) |
|
— |
|
|
— |
|
|
— |
|
|
— |
|
|
100,643 |
|
|||||||
General and administrative |
|
32,860 |
|
|
(10,225 |
) |
|
— |
|
|
(353 |
) |
|
— |
|
|
— |
|
|
22,282 |
|
|||||||
Total operating expenses |
|
462,904 |
|
|
(75,563 |
) |
|
(651 |
) |
|
(353 |
) |
|
— |
|
|
— |
|
|
386,337 |
|
|||||||
Loss from operations |
|
(220,337 |
) |
|
81,426 |
|
|
4,345 |
|
|
353 |
|
|
— |
|
|
— |
|
|
(134,213 |
) |
|||||||
Net loss |
$ |
(229,300 |
) |
$ |
81,426 |
|
$ |
4,345 |
|
$ |
353 |
|
$ |
7,635 |
|
$ |
213 |
|
$ |
(135,328 |
) |
|||||||
Weighted shares outstanding, basic and diluted |
|
189,671 |
|
|
|
|
|
|
|
189,671 |
|
|||||||||||||||||
Net loss per share, basic and diluted |
$ |
(1.21 |
) |
$ |
0.43 |
|
$ |
0.03 |
|
$ |
— |
|
$ |
0.04 |
|
$ |
— |
|
$ |
(0.71 |
) |
|||||||
| __________________________________________________ | ||
(1) |
Stock-based compensation |
|
(2) |
Amortization of intangible assets |
|
(3) |
Other |
|
(4) |
Amortization of debt discount and debt issuance costs |
|
(5) |
Income tax effect primarily related to stock-based compensation expense |
|
Reconciliation of GAAP Net Cash Used In Operating Activities to Non-GAAP Free Cash Flow |
||||||||
(Unaudited) |
||||||||
|
Three Months Ended
|
|||||||
|
2019 |
2020 |
||||||
|
|
|
||||||
|
(in thousands) |
|||||||
Net cash used in operating activities |
$ |
(26,163 |
) |
$ |
(4,073 |
) |
||
Purchases of property and equipment |
|
(18,203 |
) |
|
(12,252 |
) |
||
Free cash flow |
$ |
(44,366 |
) |
$ |
(16,325 |
) |
||
View source version on businesswire.com: https://www.businesswire.com/news/home/20201123006190/en/
Investor Contact:
Shane Xie
[email protected]
Media Contact:
Jennifer Massaro
[email protected]
Source: Nutanix, Inc.