
Form 8-K IMPERIAL OIL LTD For: Nov 19

Exhibit 99.1 Investor Day November 19, 2020Exhibit 99.1 Investor Day November 19, 2020

Agenda Topic Speaker Time Brad Corson Opening remarks 8:00 Chairman, President and CEO Theresa Redburn Environmental/Social/Governance 8:20 SVP – Commercial and Corporate Development Simon Younger Upstream outlook 8:40 SVP – Upstream Break 9:20 Jon Wetmore Downstream & Chemical outlook 9:30 VP – Downstream Dan Lyons Financial outlook 10:00 Chief Financial Officer Brad Corson Closing remarks 10:20 Chairman, President and CEO Q&A 10:30 Imperial │ 2020 2Agenda Topic Speaker Time Brad Corson Opening remarks 8:00 Chairman, President and CEO Theresa Redburn Environmental/Social/Governance 8:20 SVP – Commercial and Corporate Development Simon Younger Upstream outlook 8:40 SVP – Upstream Break 9:20 Jon Wetmore Downstream & Chemical outlook 9:30 VP – Downstream Dan Lyons Financial outlook 10:00 Chief Financial Officer Brad Corson Closing remarks 10:20 Chairman, President and CEO Q&A 10:30 Imperial │ 2020 2
Opening remarks Brad Corson Chairman, President and Chief Executive OfficerOpening remarks Brad Corson Chairman, President and Chief Executive Officer

A history of success Well positioned for the future Imperial │ 2020 4A history of success Well positioned for the future Imperial │ 2020 4

Impressions to date Reflecting on the past year § Strong leadership team focused on winning and driving shareholder value § Impressive organizational talent and commitment § High-quality assets with significant long-term potential § Underpinned by integrated, resilient business model, innovative technology, powerful brands But that being said… § Challenging start to year with pandemic and economic downturn § Sector facing economic, environmental and regulatory pressures However… § Well positioned to drive relative value, whatever the shape of the recovery Imperial │ 2020 5Impressions to date Reflecting on the past year § Strong leadership team focused on winning and driving shareholder value § Impressive organizational talent and commitment § High-quality assets with significant long-term potential § Underpinned by integrated, resilient business model, innovative technology, powerful brands But that being said… § Challenging start to year with pandemic and economic downturn § Sector facing economic, environmental and regulatory pressures However… § Well positioned to drive relative value, whatever the shape of the recovery Imperial │ 2020 5

What you will hear today Themes and focus areas § Delivering superior value to shareholders î Driving down unit costs; relentless focus on reliability î Pursuing low-cost debottlenecks î Enhancing downstream logistics, growing high-value sales § Built to be resilient throughout the cycle î Strong balance sheet, liquidity î Integration delivers value, reduces volatility § Plans that will deliver increasing shareholder returns î Aggressive cash flow growth î Return excess cash to shareholders § Ongoing ESG focus î Deploying technology to economically reduce greenhouse gas intensity î Leveraging current capabilities Imperial │ 2020 6What you will hear today Themes and focus areas § Delivering superior value to shareholders î Driving down unit costs; relentless focus on reliability î Pursuing low-cost debottlenecks î Enhancing downstream logistics, growing high-value sales § Built to be resilient throughout the cycle î Strong balance sheet, liquidity î Integration delivers value, reduces volatility § Plans that will deliver increasing shareholder returns î Aggressive cash flow growth î Return excess cash to shareholders § Ongoing ESG focus î Deploying technology to economically reduce greenhouse gas intensity î Leveraging current capabilities Imperial │ 2020 6

Imperial’s COVID-19 response Protecting our workforce and communities; positioning for recovery § Continued operations ensuring reliable energy supply î Careful management of health and safety of workforce î Adjusted turnaround timing, scope to reduce cost and prepare to respond to recovery § Enhanced cleaning, health screening, PPE at sites î Safe distancing, working from home § Leveraged technology to reduce non-essential personnel at sites î Provides efficiency opportunities for the future § Giving back to communities where we operate î Healthcare Heroes, Fuel What Matters Imperial │ 2020 7Imperial’s COVID-19 response Protecting our workforce and communities; positioning for recovery § Continued operations ensuring reliable energy supply î Careful management of health and safety of workforce î Adjusted turnaround timing, scope to reduce cost and prepare to respond to recovery § Enhanced cleaning, health screening, PPE at sites î Safe distancing, working from home § Leveraged technology to reduce non-essential personnel at sites î Provides efficiency opportunities for the future § Giving back to communities where we operate î Healthcare Heroes, Fuel What Matters Imperial │ 2020 7
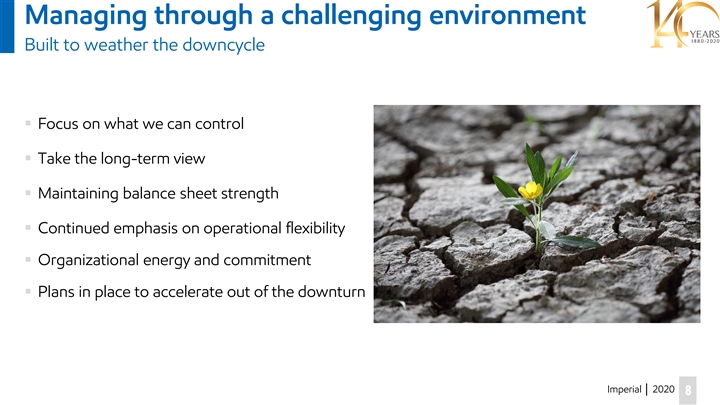
Managing through a challenging environment Built to weather the downcycle § Focus on what we can control § Take the long-term view § Maintaining balance sheet strength § Continued emphasis on operational flexibility § Organizational energy and commitment § Plans in place to accelerate out of the downturn Imperial │ 2020 8Managing through a challenging environment Built to weather the downcycle § Focus on what we can control § Take the long-term view § Maintaining balance sheet strength § Continued emphasis on operational flexibility § Organizational energy and commitment § Plans in place to accelerate out of the downturn Imperial │ 2020 8

Progress on capital and expense reductions Exceeding cost and capital control commitments to date Capital expenditures Production & manufacturing expenses $B $B 2 8 -$1B, (-16%) -$0.8B, (-45%) 4 1 0 0 2019 2020 OL 2020 PL 2020 OL § Non-regretted capital avoidance, deferral§ All business lines and service lines contributing § Protects long-term performance§ Focus on Kearl unit costs delivering results YTD All amounts in this presentation are in Canadian dollars, except where otherwise noted. Imperial │ 2020 9Progress on capital and expense reductions Exceeding cost and capital control commitments to date Capital expenditures Production & manufacturing expenses $B $B 2 8 -$1B, (-16%) -$0.8B, (-45%) 4 1 0 0 2019 2020 OL 2020 PL 2020 OL § Non-regretted capital avoidance, deferral§ All business lines and service lines contributing § Protects long-term performance§ Focus on Kearl unit costs delivering results YTD All amounts in this presentation are in Canadian dollars, except where otherwise noted. Imperial │ 2020 9

Near-term view of the recovery Unprecedented demand reduction due to COVID-19; recovery underway Global oil supply/demand balance mbd US$/bbl § Globally 105 80 î Energy demand decreased dramatically 70 î Rapid recovery through summer, primarily for gasoline 100 and diesel 60 î Ongoing recovery volatile, highly uncertain 95 50 90 40 § Locally 30 î Canadian gasoline and diesel demands 85-95% of normal 85 î Jet lagging at ~40% EIA Nov. 20 Supply î Demand recovery dependent on COVID-19 forecast 80 Demand 10 WTI price 75 0 2015 2016 2017 2018 2019 2020 2021 Source: EIA Short-term Energy Outlook, November, 2020 Imperial │ 2020 10Near-term view of the recovery Unprecedented demand reduction due to COVID-19; recovery underway Global oil supply/demand balance mbd US$/bbl § Globally 105 80 î Energy demand decreased dramatically 70 î Rapid recovery through summer, primarily for gasoline 100 and diesel 60 î Ongoing recovery volatile, highly uncertain 95 50 90 40 § Locally 30 î Canadian gasoline and diesel demands 85-95% of normal 85 î Jet lagging at ~40% EIA Nov. 20 Supply î Demand recovery dependent on COVID-19 forecast 80 Demand 10 WTI price 75 0 2015 2016 2017 2018 2019 2020 2021 Source: EIA Short-term Energy Outlook, November, 2020 Imperial │ 2020 10

ESG Theresa Redburn Senior Vice President, Commercial and Corporate DevelopmentESG Theresa Redburn Senior Vice President, Commercial and Corporate Development
Responsibly meeting global energy needs Imperial among the best in Canada and abroad § Oil and gas remain significant sources of energy § Canada is first in ESG among top global reserves holders § Imperial is an ESG leader in the oil and gas industry § Exciting new technologies support pathways to net zero § Imperial contributing to sustainable economic development in Indigenous and local communities § Real value comes from smart integration of environmental, economic and social innovation Imperial │ 2020 12Responsibly meeting global energy needs Imperial among the best in Canada and abroad § Oil and gas remain significant sources of energy § Canada is first in ESG among top global reserves holders § Imperial is an ESG leader in the oil and gas industry § Exciting new technologies support pathways to net zero § Imperial contributing to sustainable economic development in Indigenous and local communities § Real value comes from smart integration of environmental, economic and social innovation Imperial │ 2020 12

Oil and gas will continue to supply energy needs Global investment opportunities to meet future demand § Oil and gas remain a significant source of energy under a wide range of scenarios § Between $US 12 trillion and $US 17 trillion additional oil and gas investment needed by 2040 IEA world energy mix Global oil supply and demand % mbdoe 120 100% other renewables IEA STEPS bioenergy 80% hydro nuclear coal 60% IEA SDS gas 40% 20% Production without further oil investment 0% 0 2019 2040 STEPS 2040 SDS 2018 2040 Source: IEA World Energy Outlook, Oct 2020; Imperial │ 2020 Source: IEA, ExxonMobil analysis 13 STEPS: Stated Policies Scenario; SDS: Sustainable Development ScenarioOil and gas will continue to supply energy needs Global investment opportunities to meet future demand § Oil and gas remain a significant source of energy under a wide range of scenarios § Between $US 12 trillion and $US 17 trillion additional oil and gas investment needed by 2040 IEA world energy mix Global oil supply and demand % mbdoe 120 100% other renewables IEA STEPS bioenergy 80% hydro nuclear coal 60% IEA SDS gas 40% 20% Production without further oil investment 0% 0 2019 2040 STEPS 2040 SDS 2018 2040 Source: IEA World Energy Outlook, Oct 2020; Imperial │ 2020 Source: IEA, ExxonMobil analysis 13 STEPS: Stated Policies Scenario; SDS: Sustainable Development Scenario

Canada is an ESG leader The choice for responsible energy worldwide Worldwide Governance Environmental Performance Social Progress Index Indicators Index 80 100 100 40 50 50 not ranked 0 0 0 Yale, Columbia universities rank 180 countries on relative Social Progress Imperative ranks 149 countries on Worldwide Governance Indicators rank 200 countries on environmental performance overall quality of life governance practices Top 10 global reserve holders, 2019 results Imperial │ 2020 14Canada is an ESG leader The choice for responsible energy worldwide Worldwide Governance Environmental Performance Social Progress Index Indicators Index 80 100 100 40 50 50 not ranked 0 0 0 Yale, Columbia universities rank 180 countries on relative Social Progress Imperative ranks 149 countries on Worldwide Governance Indicators rank 200 countries on environmental performance overall quality of life governance practices Top 10 global reserve holders, 2019 results Imperial │ 2020 14
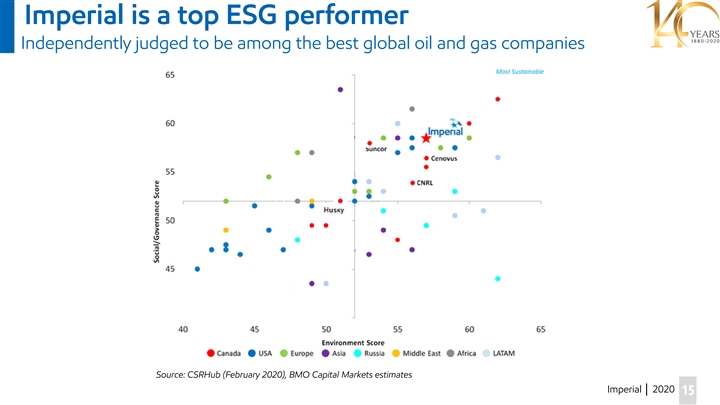
Imperial is a top ESG performer Independently judged to be among the best global oil and gas companies Source: CSRHub (February 2020), BMO Capital Markets estimates Imperial │ 2020 15Imperial is a top ESG performer Independently judged to be among the best global oil and gas companies Source: CSRHub (February 2020), BMO Capital Markets estimates Imperial │ 2020 15
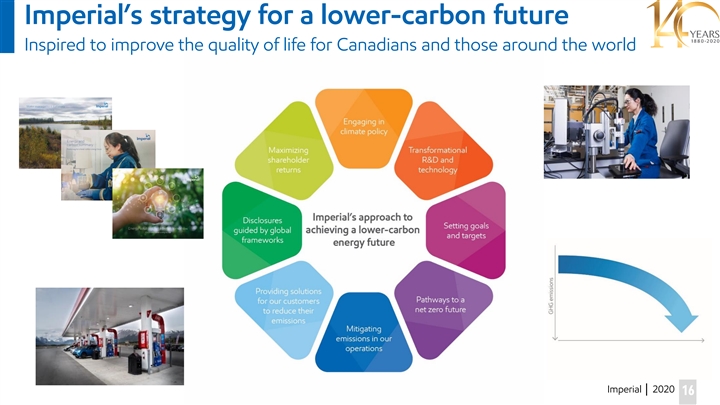
Imperial’s strategy for a lower-carbon future Inspired to improve the quality of life for Canadians and those around the world Imperial │ 2020 16Imperial’s strategy for a lower-carbon future Inspired to improve the quality of life for Canadians and those around the world Imperial │ 2020 16
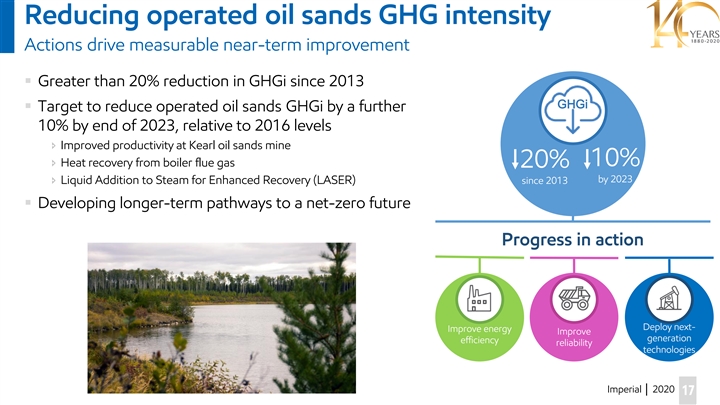
Reducing operated oil sands GHG intensity Actions drive measurable near-term improvement § Greater than 20% reduction in GHGi since 2013 GHGi § Target to reduce operated oil sands GHGi by a further 10% by end of 2023, relative to 2016 levels î Improved productivity at Kearl oil sands mine 10% î Heat recovery from boiler flue gas 20% by 2023 î Liquid Addition to Steam for Enhanced Recovery (LASER) since 2013 § Developing longer-term pathways to a net-zero future Progress in action Deploy next- Improve energy Improve generation efficiency reliability technologies Imperial │ 2020 17Reducing operated oil sands GHG intensity Actions drive measurable near-term improvement § Greater than 20% reduction in GHGi since 2013 GHGi § Target to reduce operated oil sands GHGi by a further 10% by end of 2023, relative to 2016 levels î Improved productivity at Kearl oil sands mine 10% î Heat recovery from boiler flue gas 20% by 2023 î Liquid Addition to Steam for Enhanced Recovery (LASER) since 2013 § Developing longer-term pathways to a net-zero future Progress in action Deploy next- Improve energy Improve generation efficiency reliability technologies Imperial │ 2020 17
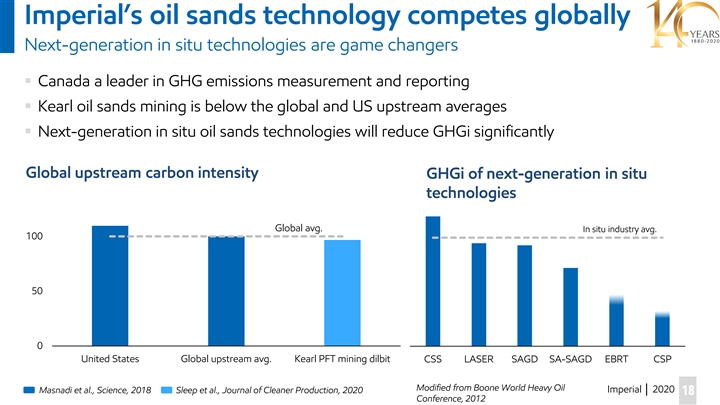
Imperial’s oil sands technology competes globally Next-generation in situ technologies are game changers § Canada a leader in GHG emissions measurement and reporting § Kearl oil sands mining is below the global and US upstream averages § Next-generation in situ oil sands technologies will reduce GHGi significantly Global upstream carbon intensity GHGi of next-generation in situ technologies Global avg. In situ industry avg. 100 50 0 United States Global upstream avg. Kearl PFT mining dilbit CSS LASER SAGD SA-SAGD EBRT CSP Modified from Boone World Heavy Oil Masnadi et al., Science, 2018 Sleep et al., Journal of Cleaner Production, 2020 Imperial │ 2020 18 Conference, 2012Imperial’s oil sands technology competes globally Next-generation in situ technologies are game changers § Canada a leader in GHG emissions measurement and reporting § Kearl oil sands mining is below the global and US upstream averages § Next-generation in situ oil sands technologies will reduce GHGi significantly Global upstream carbon intensity GHGi of next-generation in situ technologies Global avg. In situ industry avg. 100 50 0 United States Global upstream avg. Kearl PFT mining dilbit CSS LASER SAGD SA-SAGD EBRT CSP Modified from Boone World Heavy Oil Masnadi et al., Science, 2018 Sleep et al., Journal of Cleaner Production, 2020 Imperial │ 2020 18 Conference, 2012

Technology is key to the future Enables production growth and emissions reductions Short Term Medium Term Long Term Next-generation upstream Renewables and GHGi Energy diversification technologies Ongoing Developing Evaluating • Advanced in situ technologies • Cogeneration• Blue hydrogen • Renewable fuels•ELP•EBRT • Advanced biofuels • Satellite methane monitoring•NCG•CSP • Carbon fibre from bitumen • Advanced fuels and lubricants• Carbon capture and sequestration • Carbonate fuel cell technology • LASER• Next-generation technologies • Small modular nuclear reactors paired with CCS could result in (SMR) incremental production at net- Underway• Direct air capture zero emissions • Heat recovery from boiler flue gas • Expanded use of renewable fuels • SA-SAGD and new product offerings Potential solutions in support of a net-zero future Imperial │ 2020 19Technology is key to the future Enables production growth and emissions reductions Short Term Medium Term Long Term Next-generation upstream Renewables and GHGi Energy diversification technologies Ongoing Developing Evaluating • Advanced in situ technologies • Cogeneration• Blue hydrogen • Renewable fuels•ELP•EBRT • Advanced biofuels • Satellite methane monitoring•NCG•CSP • Carbon fibre from bitumen • Advanced fuels and lubricants• Carbon capture and sequestration • Carbonate fuel cell technology • LASER• Next-generation technologies • Small modular nuclear reactors paired with CCS could result in (SMR) incremental production at net- Underway• Direct air capture zero emissions • Heat recovery from boiler flue gas • Expanded use of renewable fuels • SA-SAGD and new product offerings Potential solutions in support of a net-zero future Imperial │ 2020 19

Social innovation Creating long-term economic and social benefit § Collaborating with Indigenous and community neighbours on: î A common vision for progress î Sustainable economic development î Environmental stewardship § Awarded Canadian Centre for Diversity and Inclusion Employer Initiative of the Year Safety - TRIR 0.6 § Imperial recognized as one of Canada’s Top 100 Employers § Industry-leading safety performance 0.3 Imperial's Indigenous engagement is supported by four pillars: 0 2015 2016 2017 2018 2019 Imperial Canadian peers Total Recordable Incident Rate Incidents per 200,000 hours worked; Source: company reports Over $3B invested with Indigenous business 10% increase in women in leadership and supervisory roles 0.25 TRIR in 2019 Imperial │ 2020 20Social innovation Creating long-term economic and social benefit § Collaborating with Indigenous and community neighbours on: î A common vision for progress î Sustainable economic development î Environmental stewardship § Awarded Canadian Centre for Diversity and Inclusion Employer Initiative of the Year Safety - TRIR 0.6 § Imperial recognized as one of Canada’s Top 100 Employers § Industry-leading safety performance 0.3 Imperial's Indigenous engagement is supported by four pillars: 0 2015 2016 2017 2018 2019 Imperial Canadian peers Total Recordable Incident Rate Incidents per 200,000 hours worked; Source: company reports Over $3B invested with Indigenous business 10% increase in women in leadership and supervisory roles 0.25 TRIR in 2019 Imperial │ 2020 20
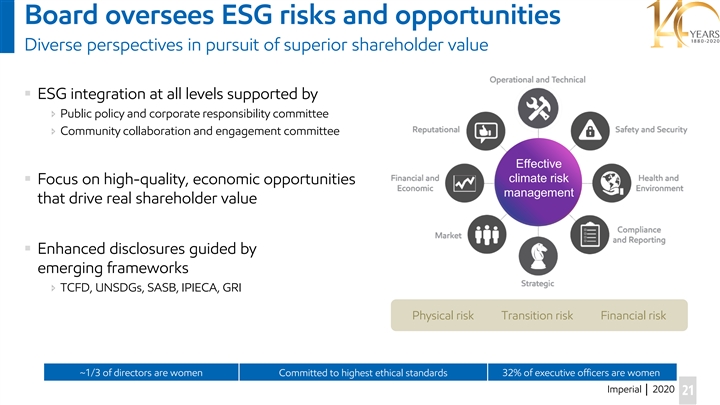
Board oversees ESG risks and opportunities Diverse perspectives in pursuit of superior shareholder value § ESG integration at all levels supported by î Public policy and corporate responsibility committee î Community collaboration and engagement committee Effective climate risk § Focus on high-quality, economic opportunities management that drive real shareholder value § Enhanced disclosures guided by emerging frameworks î TCFD, UNSDGs, SASB, IPIECA, GRI Physical risk Transition risk Financial risk ~1/3 of directors are women Committed to highest ethical standards 32% of executive officers are women Imperial │ 2020 21Board oversees ESG risks and opportunities Diverse perspectives in pursuit of superior shareholder value § ESG integration at all levels supported by î Public policy and corporate responsibility committee î Community collaboration and engagement committee Effective climate risk § Focus on high-quality, economic opportunities management that drive real shareholder value § Enhanced disclosures guided by emerging frameworks î TCFD, UNSDGs, SASB, IPIECA, GRI Physical risk Transition risk Financial risk ~1/3 of directors are women Committed to highest ethical standards 32% of executive officers are women Imperial │ 2020 21

Imperial’s triple win A formula for collective success and delivering real value Reduce environmental footprint § Leveraging industry-leading technologies to deliver GHGi reduction solutions § Helping our customers reduce their emissions Capture business efficiencies and opportunities § Pursuing energy and capital-efficient projects § Developing new carbon-efficient product offerings § Exploring technology pathways in support of a net-zero future Social innovation § Contributing to sustainable economic development in Indigenous and local communities § Top employer, committed to high standards across all areas of business Imperial │ 2020 22Imperial’s triple win A formula for collective success and delivering real value Reduce environmental footprint § Leveraging industry-leading technologies to deliver GHGi reduction solutions § Helping our customers reduce their emissions Capture business efficiencies and opportunities § Pursuing energy and capital-efficient projects § Developing new carbon-efficient product offerings § Exploring technology pathways in support of a net-zero future Social innovation § Contributing to sustainable economic development in Indigenous and local communities § Top employer, committed to high standards across all areas of business Imperial │ 2020 22

Upstream Outlook Simon Younger Senior Vice President, UpstreamUpstream Outlook Simon Younger Senior Vice President, Upstream

Upstream vision Best-in-class producer, maximizing cash flow § Maximize value from long-life, low-decline assets § Targeting industry-leading unit cost and reliability § Select, disciplined capital investments § High-impact innovation and digital solutions § Operational excellence and responsible development Imperial │ 2020 24Upstream vision Best-in-class producer, maximizing cash flow § Maximize value from long-life, low-decline assets § Targeting industry-leading unit cost and reliability § Select, disciplined capital investments § High-impact innovation and digital solutions § Operational excellence and responsible development Imperial │ 2020 24

2020 Upstream performance Demonstrating resilience through unprecedented external challenges Reduced spend $B 6 § Lowest-ever workplace hurts Savings § Safely assured business continuity 3 § Rapid response to weak demand and low realizations 0 2019 2020 OL î Expenses reduced by ~$700 million vs. 2019, down ~15% P&M expenses Capital î Capital reduced by ~$700 million vs. 2019, down ~50% Consistent production î Structural cost reductions, adjusted turnarounds koebd 400î Consistent production despite external events § Enabling production through technology î Remote operations centre 200 î Autonomous haul î Remote technical support 0 2019 2020 OL Production Imperial share, before royalties. P&M expenses = Production and Manufacturing expenses Imperial │ 2020 252020 Upstream performance Demonstrating resilience through unprecedented external challenges Reduced spend $B 6 § Lowest-ever workplace hurts Savings § Safely assured business continuity 3 § Rapid response to weak demand and low realizations 0 2019 2020 OL î Expenses reduced by ~$700 million vs. 2019, down ~15% P&M expenses Capital î Capital reduced by ~$700 million vs. 2019, down ~50% Consistent production î Structural cost reductions, adjusted turnarounds koebd 400î Consistent production despite external events § Enabling production through technology î Remote operations centre 200 î Autonomous haul î Remote technical support 0 2019 2020 OL Production Imperial share, before royalties. P&M expenses = Production and Manufacturing expenses Imperial │ 2020 25

Long-life, low-decline asset base Stable production base; focused on selective growth Production koebd § ~6.3 billion boe of proved and probable reserves 400 î Over 25-year proved reserves life 300 § ~415 koebd production in 2021 200 î Incremental growth at Kearl and Syncrude î Sustain Cold Lake volumes 100 § 12% growth 2020-25 0 2015 2017 2019 2021 2023 2025 î Reliability and productivity enhancements î Debottlenecking Kearl Syncrude Cold Lake Unconventional and conventional Production Imperial share, before royalties 2P reserves Imperial share, before royalties, YE 2019 NI51-101 Imperial │ 2020 26Long-life, low-decline asset base Stable production base; focused on selective growth Production koebd § ~6.3 billion boe of proved and probable reserves 400 î Over 25-year proved reserves life 300 § ~415 koebd production in 2021 200 î Incremental growth at Kearl and Syncrude î Sustain Cold Lake volumes 100 § 12% growth 2020-25 0 2015 2017 2019 2021 2023 2025 î Reliability and productivity enhancements î Debottlenecking Kearl Syncrude Cold Lake Unconventional and conventional Production Imperial share, before royalties 2P reserves Imperial share, before royalties, YE 2019 NI51-101 Imperial │ 2020 26

Upstream cash flow outlook Delivering value and generating strong cash from operating activities Average annual cash from operating activities § ~$1.5 billion annual average in 2017–19 $B Scenarios 3 $US 60/bbl WTI § Strengthened resilience to low prices 2 $US 50/bbl WTI § Improved cash generation at $US 50/bbl WTI 1 $US 40/bbl WTI î Incremental volumes at Kearl î Structural cost improvement 0 2015-16 2017-19 2020 OL 2021-25 WTI 46 58 40 40 / 50 / 60 § Significant upside potential WCS 32 41 29 30 / 37 / 45 î ~$2.7 billion per year at $US 60/bbl WTI Spread 14 17 11 10 / 13 / 15 Imperial │ 2020 27 ThousandsUpstream cash flow outlook Delivering value and generating strong cash from operating activities Average annual cash from operating activities § ~$1.5 billion annual average in 2017–19 $B Scenarios 3 $US 60/bbl WTI § Strengthened resilience to low prices 2 $US 50/bbl WTI § Improved cash generation at $US 50/bbl WTI 1 $US 40/bbl WTI î Incremental volumes at Kearl î Structural cost improvement 0 2015-16 2017-19 2020 OL 2021-25 WTI 46 58 40 40 / 50 / 60 § Significant upside potential WCS 32 41 29 30 / 37 / 45 î ~$2.7 billion per year at $US 60/bbl WTI Spread 14 17 11 10 / 13 / 15 Imperial │ 2020 27 Thousands

Upstream investment outlook Investing for value and select volume growth Average annual capital expenditures $B § Investment profile below prior outlook 2 î 2020-21 proactive reductions; capex down ~40% î Growing production to ~435 kboed by 2024 î Maintained optionality and capital discipline 1 § Maintaining low sustaining capital î 5-year average of ~$5 per barrel § Key infrastructure drives near-term profile 0 2015- 2020 2021 2022 2023 2024 2020- î Kearl transition to in-pit tailings 19 OL 24 î Syncrude Mildred Lake extension Kearl Syncrude Cold Lake/other 2019 capital forecast î Capital builds to levels consistent with 2015-19 average Imperial │ 2020 28Upstream investment outlook Investing for value and select volume growth Average annual capital expenditures $B § Investment profile below prior outlook 2 î 2020-21 proactive reductions; capex down ~40% î Growing production to ~435 kboed by 2024 î Maintained optionality and capital discipline 1 § Maintaining low sustaining capital î 5-year average of ~$5 per barrel § Key infrastructure drives near-term profile 0 2015- 2020 2021 2022 2023 2024 2020- î Kearl transition to in-pit tailings 19 OL 24 î Syncrude Mildred Lake extension Kearl Syncrude Cold Lake/other 2019 capital forecast î Capital builds to levels consistent with 2015-19 average Imperial │ 2020 28

Large portfolio of investment options Selecting investments to deliver maximum value NPV/I range § Deep portfolio of projects Opportunity type Representative projects $US 40-60 WTI î Optionality spans Upstream Schedule optimization Digital 30 - 500 Workforce visualization Advanced metallurgy Research & development 10 - 22 Enhanced tailings§ Rigorous capital discipline î Maximize returns within existing assets Autonomous haul Base optimization 2 - 6 Debottlenecking î Volume growth without large investment Enhanced extraction GHGi reduction 2 - 5 Heat recovery Syncrude MLX Development projects 1 - 5 § Priority on robust returns at low price In situ solvent î Value generation through cost reduction projects, Future opportunities research innovations and digital initiatives Aspen Growth 1 - 2 Unconventional Imperial │ 2020 29Large portfolio of investment options Selecting investments to deliver maximum value NPV/I range § Deep portfolio of projects Opportunity type Representative projects $US 40-60 WTI î Optionality spans Upstream Schedule optimization Digital 30 - 500 Workforce visualization Advanced metallurgy Research & development 10 - 22 Enhanced tailings§ Rigorous capital discipline î Maximize returns within existing assets Autonomous haul Base optimization 2 - 6 Debottlenecking î Volume growth without large investment Enhanced extraction GHGi reduction 2 - 5 Heat recovery Syncrude MLX Development projects 1 - 5 § Priority on robust returns at low price In situ solvent î Value generation through cost reduction projects, Future opportunities research innovations and digital initiatives Aspen Growth 1 - 2 Unconventional Imperial │ 2020 29

Accelerating innovation and modernization Industry-leading digital technology and artificial intelligence Advanced analytics, digital workforce, increased value Value § Maximize asset recovery and production Digital investment principles § Data-driven decision making § Capital efficient $750M/yr § Enhance worker safety and productivity § Fast payback § Agile development Near-term focus and wins § >15 successful projects $500M/yr Future potential G § Reducing costs § Improving reliability S Defined projects Build team and solidify foundation § >30 person global team, expertise § Digital infrastructure, networks, data lake Realized ~$150M/yr value 2017 2019 2021 2023 2025 Established digital Imperial │ 2020 30 visionAccelerating innovation and modernization Industry-leading digital technology and artificial intelligence Advanced analytics, digital workforce, increased value Value § Maximize asset recovery and production Digital investment principles § Data-driven decision making § Capital efficient $750M/yr § Enhance worker safety and productivity § Fast payback § Agile development Near-term focus and wins § >15 successful projects $500M/yr Future potential G § Reducing costs § Improving reliability S Defined projects Build team and solidify foundation § >30 person global team, expertise § Digital infrastructure, networks, data lake Realized ~$150M/yr value 2017 2019 2021 2023 2025 Established digital Imperial │ 2020 30 vision

Digital in action Intense focus on cost optimization and short payback on investment Workforce visualization: $50M+/yr Autonomous haul systems: ~$US 1/bbl cost savings Schedule optimization: $15M+/yr First autonomous 797F globally to haul ore to crusher 2019 2020 Shovel productivity improvements: Steamflood optimization: Digital scaffold management: $10M+/yr $15M+/yr $3M+/yr Imperial │ 2020 31Digital in action Intense focus on cost optimization and short payback on investment Workforce visualization: $50M+/yr Autonomous haul systems: ~$US 1/bbl cost savings Schedule optimization: $15M+/yr First autonomous 797F globally to haul ore to crusher 2019 2020 Shovel productivity improvements: Steamflood optimization: Digital scaffold management: $10M+/yr $15M+/yr $3M+/yr Imperial │ 2020 31

Digital in action with cutting-edge applications Progressing the next tranche of opportunities Kearl plant digital twin Advanced data-driven analytics Internal drone inspections Connected worker/equipment Commodity input reduction Automated fuelling Imperial │ 2020 32Digital in action with cutting-edge applications Progressing the next tranche of opportunities Kearl plant digital twin Advanced data-driven analytics Internal drone inspections Connected worker/equipment Commodity input reduction Automated fuelling Imperial │ 2020 32

Investing in technology to maximize value Ongoing commitment to research and development Enhanced in-line flocculation Advanced metallurgy Coarse tailings bitumen recovery Mining Enhanced Late-Life Process, ELP Non-Condensable Gas, NCG Enhanced Bitumen Recovery In Situ Imperial │ 2020 33Investing in technology to maximize value Ongoing commitment to research and development Enhanced in-line flocculation Advanced metallurgy Coarse tailings bitumen recovery Mining Enhanced Late-Life Process, ELP Non-Condensable Gas, NCG Enhanced Bitumen Recovery In Situ Imperial │ 2020 33

Kearl 2020 performance Supplemental crushers delivering significant value, demonstrating potential Production kbd § 2020 performance exceeding expectations COVID Adjusted turnarounds 300 î >85% plant availability IPL outage î Bitumen recovery improved 2% vs. 2019 î Supplemental crushers avoided >30 kbd downtime 200 § Record-breaking production 100 Q1 Q2 Q3 Q4 î Monthly production record 301 kbd in October 2019 2020 Unit P&M expenses § Relentless focus on reducing unit P&M $US/bbl 40 expenses î Oct. YTD ~$US 21/bbl î Q3 averaged ~$US 20/bbl 20 0 § Now targeting below $US 20/bbl in future Q1 Q2 Q3 Q4 years 2019 2020 Imperial │ 2020 34 Production 100% interest, before royaltiesKearl 2020 performance Supplemental crushers delivering significant value, demonstrating potential Production kbd § 2020 performance exceeding expectations COVID Adjusted turnarounds 300 î >85% plant availability IPL outage î Bitumen recovery improved 2% vs. 2019 î Supplemental crushers avoided >30 kbd downtime 200 § Record-breaking production 100 Q1 Q2 Q3 Q4 î Monthly production record 301 kbd in October 2019 2020 Unit P&M expenses § Relentless focus on reducing unit P&M $US/bbl 40 expenses î Oct. YTD ~$US 21/bbl î Q3 averaged ~$US 20/bbl 20 0 § Now targeting below $US 20/bbl in future Q1 Q2 Q3 Q4 years 2019 2020 Imperial │ 2020 34 Production 100% interest, before royalties

Kearl journey Stable, reliable operations enabling optimization phase Production Unit P&M expenses § Reliability focus delivering improvements kbd $US/bbl î Resolved significant reliability ‘bad actors’ 300 40 î Extraction and froth treatment upgrades î Supplemental crushers enabling 240+ kbd COVID î Improved mine fleet availability and utilization 200 20§ 255 kbd, $US 20/bbl in 2021, ahead of prior view Optimization 100 Crushers § Clear pathway to 280+ kbd Stable î Turnaround interval extension (2022) Ramp up î Plant debottlenecking 0 0 î Enhanced mine planning and bitumen recovery î Digital initiatives Production Unit P&M expense Production 100% interest, before royalties Imperial │ 2020 35Kearl journey Stable, reliable operations enabling optimization phase Production Unit P&M expenses § Reliability focus delivering improvements kbd $US/bbl î Resolved significant reliability ‘bad actors’ 300 40 î Extraction and froth treatment upgrades î Supplemental crushers enabling 240+ kbd COVID î Improved mine fleet availability and utilization 200 20§ 255 kbd, $US 20/bbl in 2021, ahead of prior view Optimization 100 Crushers § Clear pathway to 280+ kbd Stable î Turnaround interval extension (2022) Ramp up î Plant debottlenecking 0 0 î Enhanced mine planning and bitumen recovery î Digital initiatives Production Unit P&M expense Production 100% interest, before royalties Imperial │ 2020 35

Autonomous haul update Fleet conversion improves profitability and safety § First automated 797-model haul trucks in ore globally § Most ultra-class autonomous trucks in oil sands î 22 trucks converted, target of 25 by YE 2020 § Fully-automated north mine advance § Unit expense savings ~$US 1/bbl § Targeting fully autonomous fleet by 2023 Imperial │ 2020 36Autonomous haul update Fleet conversion improves profitability and safety § First automated 797-model haul trucks in ore globally § Most ultra-class autonomous trucks in oil sands î 22 trucks converted, target of 25 by YE 2020 § Fully-automated north mine advance § Unit expense savings ~$US 1/bbl § Targeting fully autonomous fleet by 2023 Imperial │ 2020 36

Kearl in-pit tailings project Sustaining production at lowest cost § Transition to in-pit tailings when external tailings reach capacity in 2023 § Safest and lowest-cost solution, minimizing land disturbance § ~ $750 million capital through 2025 § Extensively cost-benchmarked, competitive with industry norms Imperial │ 2020 37Kearl in-pit tailings project Sustaining production at lowest cost § Transition to in-pit tailings when external tailings reach capacity in 2023 § Safest and lowest-cost solution, minimizing land disturbance § ~ $750 million capital through 2025 § Extensively cost-benchmarked, competitive with industry norms Imperial │ 2020 37

Cold Lake strategy Maintain strong cash flow generation and reduce GHGi Production kbd § Resilient cash generation through cycles 150 î Positive cash generation in 2020 100 î Strong action to reduce costs; paced capital spending î Maintained unit P&M expenses flat vs. 2019, 50 ~$US 13.50/bbl 0 § Focused on base performance 2018-19 2020 OL 2021-23 2024-25 î Volumes near term at ~130 kbd î Optimizations and reliability enhancements Recovery method of production % î Digital initiatives 100 § Long-term strategy î Maintain optimum utilization of existing infrastructure 50 î Sequence development of the highest-value resource î Minimize energy, GHGi through solvent technologies 0 2000 2010 Current 2030 CSS Steamflood Solvent technology Imperial │ 2020 38Cold Lake strategy Maintain strong cash flow generation and reduce GHGi Production kbd § Resilient cash generation through cycles 150 î Positive cash generation in 2020 100 î Strong action to reduce costs; paced capital spending î Maintained unit P&M expenses flat vs. 2019, 50 ~$US 13.50/bbl 0 § Focused on base performance 2018-19 2020 OL 2021-23 2024-25 î Volumes near term at ~130 kbd î Optimizations and reliability enhancements Recovery method of production % î Digital initiatives 100 § Long-term strategy î Maintain optimum utilization of existing infrastructure 50 î Sequence development of the highest-value resource î Minimize energy, GHGi through solvent technologies 0 2000 2010 Current 2030 CSS Steamflood Solvent technology Imperial │ 2020 38

Select Cold Lake capital investments Production of 140 kbd by 2024 Infill drilling Mahkeses LASER Grand Rapids Phase 1 § Access adjacent reservoir § Solvent injection into existing wells § SA-SAGD leveraging existing Nabiye infrastructure § Flexible location and timing§ Injection to start Dec. 2020 § ~ 15 kbd, start-up 2023 § 3 Mahihkan pads, 26 wells in 2020§ $17,000 / flowing bbl/d capital intensity î Paced execution vs. prior outlook î Peak production of 8 kbd § Production uplift of ~11 kbd § Lowers Cold Lake cash cost by $US 1/bbl Imperial │ 2020 39Select Cold Lake capital investments Production of 140 kbd by 2024 Infill drilling Mahkeses LASER Grand Rapids Phase 1 § Access adjacent reservoir § Solvent injection into existing wells § SA-SAGD leveraging existing Nabiye infrastructure § Flexible location and timing§ Injection to start Dec. 2020 § ~ 15 kbd, start-up 2023 § 3 Mahihkan pads, 26 wells in 2020§ $17,000 / flowing bbl/d capital intensity î Paced execution vs. prior outlook î Peak production of 8 kbd § Production uplift of ~11 kbd § Lowers Cold Lake cash cost by $US 1/bbl Imperial │ 2020 39

Syncrude strategy Reliability focused, supported by collaboration Production § Strong partner engagement and collaboration kbd 90 § Capturing reliability investment benefits COVID î 2019 second-best year in asset’s history 60 § 15% combined capex and expense reduction in 2020 vs 2019 30 § High-value synthetic crude production î Integration with Strathcona refinery 0 2015-18 2019 2020 OL 2021-25 § Targeting <$US 30/bbl unit P&M expense Production Imperial share, before royalties Imperial │ 2020 40Syncrude strategy Reliability focused, supported by collaboration Production § Strong partner engagement and collaboration kbd 90 § Capturing reliability investment benefits COVID î 2019 second-best year in asset’s history 60 § 15% combined capex and expense reduction in 2020 vs 2019 30 § High-value synthetic crude production î Integration with Strathcona refinery 0 2015-18 2019 2020 OL 2021-25 § Targeting <$US 30/bbl unit P&M expense Production Imperial share, before royalties Imperial │ 2020 40

Syncrude interconnect pipeline Maximizing value through owner collaboration Syncrude Suncor Base Mine § Project commissioning Q4 2020 Mine & extraction Mine, extraction & SAGD § Asset integration drives incremental value Interconnect bitumen pipeline Primary upgrading Primary upgrading (cokers) (cokers) § Flexibility during turnarounds Interconnect sour pipelineî Bitumen imports during mine and extraction downtime î Bitumen exports during upgrader downtime Secondary Secondary î Sour gas-oil imports during coker downtime upgrading upgrading (hydrotreaters) (hydrotreaters) Sweet SCO to Sweet SCO to market market Imperial │ 2020 41Syncrude interconnect pipeline Maximizing value through owner collaboration Syncrude Suncor Base Mine § Project commissioning Q4 2020 Mine & extraction Mine, extraction & SAGD § Asset integration drives incremental value Interconnect bitumen pipeline Primary upgrading Primary upgrading (cokers) (cokers) § Flexibility during turnarounds Interconnect sour pipelineî Bitumen imports during mine and extraction downtime î Bitumen exports during upgrader downtime Secondary Secondary î Sour gas-oil imports during coker downtime upgrading upgrading (hydrotreaters) (hydrotreaters) Sweet SCO to Sweet SCO to market market Imperial │ 2020 41

Future resource optionality Material and diverse portfolio of organic growth opportunities § Large inventory of opportunities î In situ development: Aspen, Corner, Clarke Creek, Clyden Aspen – rendering of central plant î Unconventional § Strategic approach to future development î Minimal investment while maintaining optionality î Mature next-generation in situ technologies § Major investments on hold, pending: Duvernay – operated gas plant î Strengthening base assets through capital-efficient optimizations î Competitiveness with internal and external opportunities î Market, take-away capacity, and regulatory environment Imperial │ 2020 42Future resource optionality Material and diverse portfolio of organic growth opportunities § Large inventory of opportunities î In situ development: Aspen, Corner, Clarke Creek, Clyden Aspen – rendering of central plant î Unconventional § Strategic approach to future development î Minimal investment while maintaining optionality î Mature next-generation in situ technologies § Major investments on hold, pending: Duvernay – operated gas plant î Strengthening base assets through capital-efficient optimizations î Competitiveness with internal and external opportunities î Market, take-away capacity, and regulatory environment Imperial │ 2020 42

Upstream summary Best-in-class producer; maximizing value § Focus on maximizing value from existing assets and incremental efficient growth § Kearl volumes and cost improvement outpacing prior outlook § Realizing ~$150 million per year in digital value § Capital plan down significantly from prior outlook § Large portfolio of investment options Imperial │ 2020 43Upstream summary Best-in-class producer; maximizing value § Focus on maximizing value from existing assets and incremental efficient growth § Kearl volumes and cost improvement outpacing prior outlook § Realizing ~$150 million per year in digital value § Capital plan down significantly from prior outlook § Large portfolio of investment options Imperial │ 2020 43

BreakBreak

Downstream and Chemical Outlook Jon Wetmore Vice President, DownstreamDownstream and Chemical Outlook Jon Wetmore Vice President, Downstream

Downstream strengths Leveraging assets, logistics and sales to drive cash generation § Industry-leading refineries running advantaged crudes § Profitable markets accessed by industry-leading logistics § Product slate and sales portfolio enable broad market access § Superior brands and offers attract the highest value customers § Market leader in gasoline, jet fuel and asphalt Imperial │ 2020 46Downstream strengths Leveraging assets, logistics and sales to drive cash generation § Industry-leading refineries running advantaged crudes § Profitable markets accessed by industry-leading logistics § Product slate and sales portfolio enable broad market access § Superior brands and offers attract the highest value customers § Market leader in gasoline, jet fuel and asphalt Imperial │ 2020 46
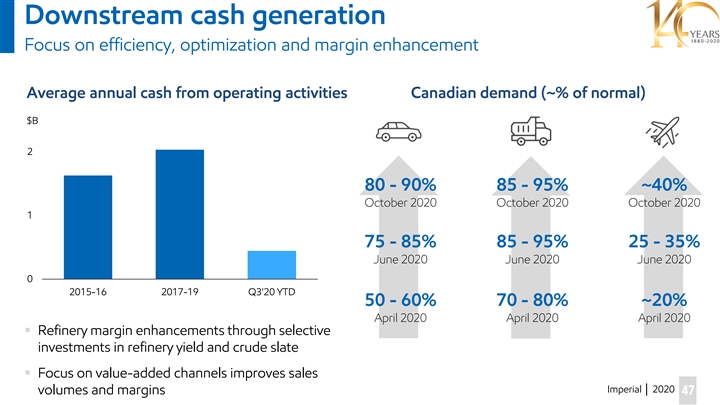
Downstream cash generation Focus on efficiency, optimization and margin enhancement Average annual cash from operating activities Canadian demand (~% of normal) $B 2 80 - 90% 85 - 95% ~40% October 2020 October 2020 October 2020 1 75 - 85% 85 - 95% 25 - 35% June 2020 June 2020 June 2020 0 2015-16 2017-19 Q3'20 YTD 50 - 60% 70 - 80% ~20% April 2020 April 2020 April 2020 § Refinery margin enhancements through selective investments in refinery yield and crude slate § Focus on value-added channels improves sales Imperial │ 2020 volumes and margins 47Downstream cash generation Focus on efficiency, optimization and margin enhancement Average annual cash from operating activities Canadian demand (~% of normal) $B 2 80 - 90% 85 - 95% ~40% October 2020 October 2020 October 2020 1 75 - 85% 85 - 95% 25 - 35% June 2020 June 2020 June 2020 0 2015-16 2017-19 Q3'20 YTD 50 - 60% 70 - 80% ~20% April 2020 April 2020 April 2020 § Refinery margin enhancements through selective investments in refinery yield and crude slate § Focus on value-added channels improves sales Imperial │ 2020 volumes and margins 47

Canadian downstream market environment Advantaged markets; Imperial well-positioned Market environment Imperial position § Large geography, dispersed demands§ Access to cost-advantaged logistics § Imports have limited reach§ Improved product margin as market trades at import parity § Structural short in Ontario§ Favourable supply/demand balance in core, growing market § Western Canadian crudes provide cost § Access to 100% Canadian crude advantage § Net export market favours domestic sales§ Product sales exceed production; long-term customer base Imperial │ 2020 48Canadian downstream market environment Advantaged markets; Imperial well-positioned Market environment Imperial position § Large geography, dispersed demands§ Access to cost-advantaged logistics § Imports have limited reach§ Improved product margin as market trades at import parity § Structural short in Ontario§ Favourable supply/demand balance in core, growing market § Western Canadian crudes provide cost § Access to 100% Canadian crude advantage § Net export market favours domestic sales§ Product sales exceed production; long-term customer base Imperial │ 2020 48

Canadian product margins Favourable and growing unit margins contribute to integration benefits Average monthly gasoline crack Average monthly diesel crack $US/bbl $US/bbl 80 80 Avg. Canadian diesel crack Avg. Canadian gasoline crack Avg. US diesel crack Avg. US gasoline crack 40 40 0 0 2010 2011 2012 2013 2014 2015 2016 2017 2018 2019 2010 2011 2012 2013 2014 2015 2016 2017 2018 2019 50/50 NYH/Chicago and 50/50 Toronto/Edmonton rack vs. MSW feedstock cost; Assumes $5/bbl crude tariff to Chicago, NYH & Toronto Imperial │ 2020 49Canadian product margins Favourable and growing unit margins contribute to integration benefits Average monthly gasoline crack Average monthly diesel crack $US/bbl $US/bbl 80 80 Avg. Canadian diesel crack Avg. Canadian gasoline crack Avg. US diesel crack Avg. US gasoline crack 40 40 0 0 2010 2011 2012 2013 2014 2015 2016 2017 2018 2019 2010 2011 2012 2013 2014 2015 2016 2017 2018 2019 50/50 NYH/Chicago and 50/50 Toronto/Edmonton rack vs. MSW feedstock cost; Assumes $5/bbl crude tariff to Chicago, NYH & Toronto Imperial │ 2020 49
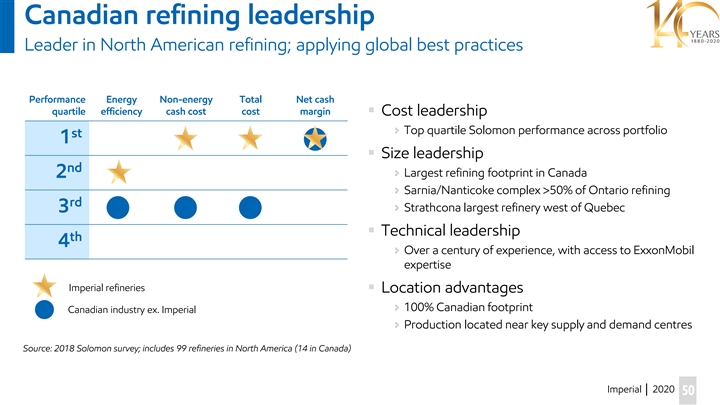
Canadian refining leadership Leader in North American refining; applying global best practices Performance Energy Non-energy Total Net cash quartile efficiency cash cost cost margin § Cost leadership î Top quartile Solomon performance across portfolio st 1 § Size leadership nd î Largest refining footprint in Canada 2 î Sarnia/Nanticoke complex >50% of Ontario refining rd î Strathcona largest refinery west of Quebec 3 § Technical leadership th 4 î Over a century of experience, with access to ExxonMobil expertise Imperial refineries § Location advantages î 100% Canadian footprint Canadian industry ex. Imperial î Production located near key supply and demand centres Source: 2018 Solomon survey; includes 99 refineries in North America (14 in Canada) Imperial │ 2020 50Canadian refining leadership Leader in North American refining; applying global best practices Performance Energy Non-energy Total Net cash quartile efficiency cash cost cost margin § Cost leadership î Top quartile Solomon performance across portfolio st 1 § Size leadership nd î Largest refining footprint in Canada 2 î Sarnia/Nanticoke complex >50% of Ontario refining rd î Strathcona largest refinery west of Quebec 3 § Technical leadership th 4 î Over a century of experience, with access to ExxonMobil expertise Imperial refineries § Location advantages î 100% Canadian footprint Canadian industry ex. Imperial î Production located near key supply and demand centres Source: 2018 Solomon survey; includes 99 refineries in North America (14 in Canada) Imperial │ 2020 50

Downstream value chain Imperial’s downstream participates in the full value chain to end consumers kbd 500 Trading Purchases Marine Other Synthetic B2B Flex Gasoline Commercial 250 Light Retail Jet Retail Diesel Flex Aviation Aviation Heavy HFO Asphalt Asphalt Asphalt 0 Crudes Products Channels Branded Sales Axis Title Imperial │ 2020 51 Crude selection Logistics Refining Distribution Branded retail B2B sales Downstream value chain Imperial’s downstream participates in the full value chain to end consumers kbd 500 Trading Purchases Marine Other Synthetic B2B Flex Gasoline Commercial 250 Light Retail Jet Retail Diesel Flex Aviation Aviation Heavy HFO Asphalt Asphalt Asphalt 0 Crudes Products Channels Branded Sales Axis Title Imperial │ 2020 51 Crude selection Logistics Refining Distribution Branded retail B2B sales

Fuels, lubricants, and asphalt sales channels Leading brands, products, offers, dealers and customers Sales volumes % § Branded Wholesaler relationships in Retail 100% î Efficient growth with specialist retailer partners; capital avoidance Unbranded § Lubricants use globally recognized brand and field technical support from specialized salesforce 50% Branded î Sarnia Research laboratory support for unique Canadian applications § Canada’s largest asphalt producer and market share, 0% integrated with high-quality Cold Lake crude 2016 2017 2018 2019 Q3'20 YTD î Sarnia Research uniquely supports variety of North America’s paving requirements î Significantly more profitable than heavy fuel oil Imperial │ 2020 52Fuels, lubricants, and asphalt sales channels Leading brands, products, offers, dealers and customers Sales volumes % § Branded Wholesaler relationships in Retail 100% î Efficient growth with specialist retailer partners; capital avoidance Unbranded § Lubricants use globally recognized brand and field technical support from specialized salesforce 50% Branded î Sarnia Research laboratory support for unique Canadian applications § Canada’s largest asphalt producer and market share, 0% integrated with high-quality Cold Lake crude 2016 2017 2018 2019 Q3'20 YTD î Sarnia Research uniquely supports variety of North America’s paving requirements î Significantly more profitable than heavy fuel oil Imperial │ 2020 52

Downstream investments Efficient, strategic investments in low-capital, high-return business Capital expenditures $M § Selective investments in refinery slate, 700 production, efficiency and resiliency § Support and enhancement of strategic logistics î Efficiency capture î Market opportunities, access and reliability 350 § Regulatory compliance and opportunities î Biofuel infrastructure î Cogeneration î Energy efficiency 0 î Emissions reductions 2015- 2020 2021 2022 2023 2024 2020- 19 OL 24 2020 Plan 2019 Plan Imperial │ 2020 53Downstream investments Efficient, strategic investments in low-capital, high-return business Capital expenditures $M § Selective investments in refinery slate, 700 production, efficiency and resiliency § Support and enhancement of strategic logistics î Efficiency capture î Market opportunities, access and reliability 350 § Regulatory compliance and opportunities î Biofuel infrastructure î Cogeneration î Energy efficiency 0 î Emissions reductions 2015- 2020 2021 2022 2023 2024 2020- 19 OL 24 2020 Plan 2019 Plan Imperial │ 2020 53

Strathcona cogeneration Increases efficiency, reduces cost and emissions § ~$200 million investment § 41megawatt capacity î 75 - 80% of site power î Up to 50% of steam § ~112,000 tonnes annual GHG emissions reduction î Nearly 24,000 cars removed from roads § Reduces electricity price exposure § Total of almost 600 megawatt cogeneration capacity across Imperial assets Imperial │ 2020 54Strathcona cogeneration Increases efficiency, reduces cost and emissions § ~$200 million investment § 41megawatt capacity î 75 - 80% of site power î Up to 50% of steam § ~112,000 tonnes annual GHG emissions reduction î Nearly 24,000 cars removed from roads § Reduces electricity price exposure § Total of almost 600 megawatt cogeneration capacity across Imperial assets Imperial │ 2020 54
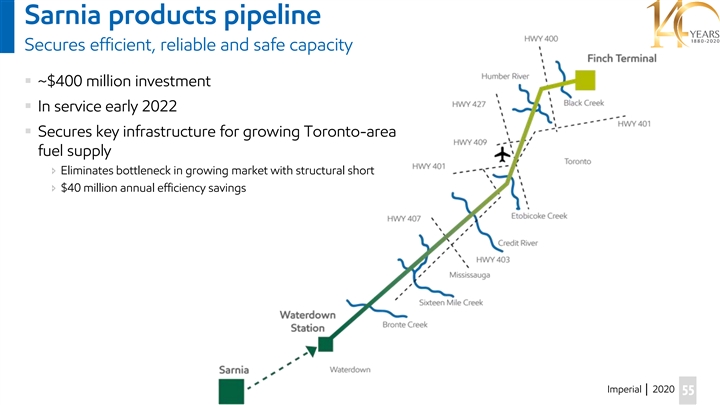
Sarnia products pipeline Secures efficient, reliable and safe capacity § ~$400 million investment § In service early 2022 § Secures key infrastructure for growing Toronto-area fuel supply î Eliminates bottleneck in growing market with structural short î $40 million annual efficiency savings Imperial │ 2020 55Sarnia products pipeline Secures efficient, reliable and safe capacity § ~$400 million investment § In service early 2022 § Secures key infrastructure for growing Toronto-area fuel supply î Eliminates bottleneck in growing market with structural short î $40 million annual efficiency savings Imperial │ 2020 55

Edmonton rail terminal Efficient, strategic egress and optionality § Provides strategic optionality and risk reduction § Transport flexibility provides increased market access for upstream production § Advantaged with low fixed costs and highly efficient and integrated supply chain § Dual-service rail carriers § Excess capacity available for third-party throughput Quarterly ERT shipments kbd $US /bbl 150 40 100 20 50 0 0 2018 2019 2020 Imperial │ 2020 56 Shipments WCS arbEdmonton rail terminal Efficient, strategic egress and optionality § Provides strategic optionality and risk reduction § Transport flexibility provides increased market access for upstream production § Advantaged with low fixed costs and highly efficient and integrated supply chain § Dual-service rail carriers § Excess capacity available for third-party throughput Quarterly ERT shipments kbd $US /bbl 150 40 100 20 50 0 0 2018 2019 2020 Imperial │ 2020 56 Shipments WCS arb

Downstream’s total package Coast-to-coast reach, leveraging strategically advantaged assets and brands Imperial and third-party owned sites ~2100 Retail service stations ~40 Terminals 14 Airports ~160 Truck Transport sites ~80 Branded Reseller sites Pipelines 3 Refineries Rail Imperial │ 2020 57Downstream’s total package Coast-to-coast reach, leveraging strategically advantaged assets and brands Imperial and third-party owned sites ~2100 Retail service stations ~40 Terminals 14 Airports ~160 Truck Transport sites ~80 Branded Reseller sites Pipelines 3 Refineries Rail Imperial │ 2020 57

Imperial’s downstream advantage Well positioned for future market success Market evolution Imperial position § Pipeline capacity additions§ Favourable light crude refining economics î WCS/MSW spreads tighten to transport parity î Enbridge Mainline light/heavy balancing§ Benefits both upstream and downstream § Biofuel penetration impacts refinery utilization § Efficient scale and operations provide resiliency î Inefficient refineries at greater risk î Logistics enable efficient blending and sales î Resilient jet, asphalt demands § Heightened incentive to maximize production to§ Strong domestic demands and markets reduce unit costs î Long-term strategic relationships, nationwide access î Greater exports into US î Net sales exceed production î Domestic Canadian demand extremely valuable î Strength in growing Ontario market § Pressure on smaller/less-efficient refineries§ Large refineries; integration advantage î Scale, access to capital, regulatory requirements Imperial │ 2020 58Imperial’s downstream advantage Well positioned for future market success Market evolution Imperial position § Pipeline capacity additions§ Favourable light crude refining economics î WCS/MSW spreads tighten to transport parity î Enbridge Mainline light/heavy balancing§ Benefits both upstream and downstream § Biofuel penetration impacts refinery utilization § Efficient scale and operations provide resiliency î Inefficient refineries at greater risk î Logistics enable efficient blending and sales î Resilient jet, asphalt demands § Heightened incentive to maximize production to§ Strong domestic demands and markets reduce unit costs î Long-term strategic relationships, nationwide access î Greater exports into US î Net sales exceed production î Domestic Canadian demand extremely valuable î Strength in growing Ontario market § Pressure on smaller/less-efficient refineries§ Large refineries; integration advantage î Scale, access to capital, regulatory requirements Imperial │ 2020 58

Imperial Chemical produces high-value products High-density polyethylene used in variety of durable products § Key end uses Other Spot î Injection molding (pails, containers, crates) î Rotational molding (storage tanks, toys) Marcellus Ethane Marcellus Mid-west Ethane Ethane § Superior customer service î Consistent resin quality, reliable supply î Highly-regarded technical service Refinery off gas î Specialty products Refinery off gas Imperial │ 2020 59Imperial Chemical produces high-value products High-density polyethylene used in variety of durable products § Key end uses Other Spot î Injection molding (pails, containers, crates) î Rotational molding (storage tanks, toys) Marcellus Ethane Marcellus Mid-west Ethane Ethane § Superior customer service î Consistent resin quality, reliable supply î Highly-regarded technical service Refinery off gas î Specialty products Refinery off gas Imperial │ 2020 59
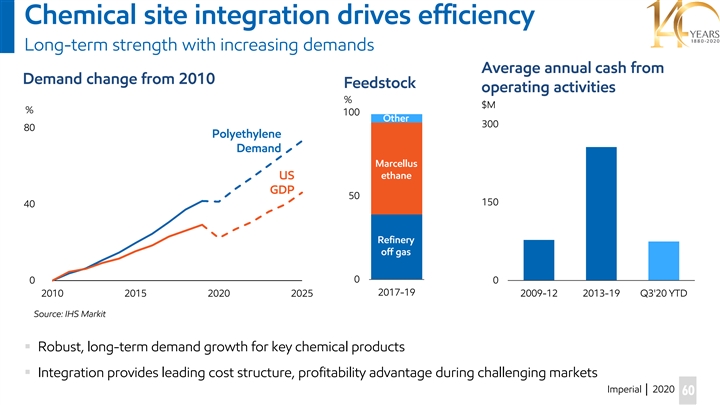
Chemical site integration drives efficiency Long-term strength with increasing demands Average annual cash from Demand change from 2010 Feedstock operating activities % $M % 100 Other 300 80% Polyethylene Demand Marcellus Mid-west US ethane Ethane GDP 50 150 40% Refinery off gas 0 0% 0 2017-19 2010 2015 2020 2025 2009-12 2013-19 Q3'20 YTD Source: IHS Markit § Robust, long-term demand growth for key chemical products § Integration provides leading cost structure, profitability advantage during challenging markets Imperial │ 2020 60Chemical site integration drives efficiency Long-term strength with increasing demands Average annual cash from Demand change from 2010 Feedstock operating activities % $M % 100 Other 300 80% Polyethylene Demand Marcellus Mid-west US ethane Ethane GDP 50 150 40% Refinery off gas 0 0% 0 2017-19 2010 2015 2020 2025 2009-12 2013-19 Q3'20 YTD Source: IHS Markit § Robust, long-term demand growth for key chemical products § Integration provides leading cost structure, profitability advantage during challenging markets Imperial │ 2020 60
Downstream and Chemical summary Sustainably advantaged assets and offers; strategically positioned for the future § 100% Canadian refining § Leading market share in most segments § Efficient pipeline access to Canadian crude § Highly integrated assets minimize costs § Coast-to-coast logistics enhance customer offers § Long-term, value-added customer relationships support volume and margins Imperial │ 2020 61Downstream and Chemical summary Sustainably advantaged assets and offers; strategically positioned for the future § 100% Canadian refining § Leading market share in most segments § Efficient pipeline access to Canadian crude § Highly integrated assets minimize costs § Coast-to-coast logistics enhance customer offers § Long-term, value-added customer relationships support volume and margins Imperial │ 2020 61

Financial Outlook Dan Lyons Chief Financial OfficerFinancial Outlook Dan Lyons Chief Financial Officer

Financial profile Resilient with upside leverage § Integrated, balanced business model 10-year average, % of cash from î Growing production, long-life assets operating activities î Advantaged refining, leading fuels marketer î Integrated logistics î Attractive Chemical business î ExxonMobil relationship / scale / expertise § Strong balance sheet Downstream, Chemical and Upstream § Low corporate breakeven Corporate î Volume growth î Reduced costs § Well positioned for recovery î Unhedged production î Flexible refinery production Imperial │ 2020 63Financial profile Resilient with upside leverage § Integrated, balanced business model 10-year average, % of cash from î Growing production, long-life assets operating activities î Advantaged refining, leading fuels marketer î Integrated logistics î Attractive Chemical business î ExxonMobil relationship / scale / expertise § Strong balance sheet Downstream, Chemical and Upstream § Low corporate breakeven Corporate î Volume growth î Reduced costs § Well positioned for recovery î Unhedged production î Flexible refinery production Imperial │ 2020 63
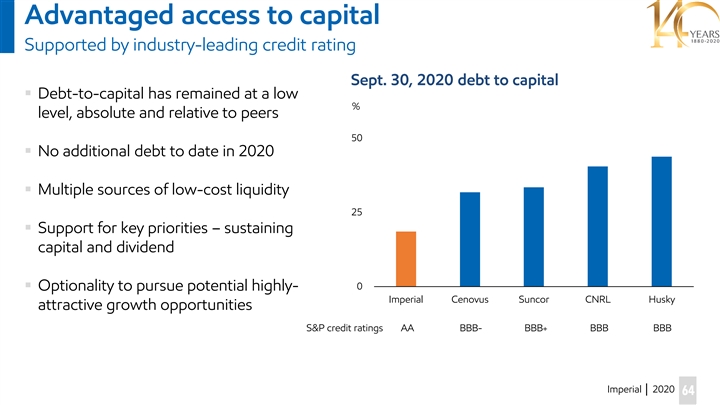
Advantaged access to capital Supported by industry-leading credit rating Sept. 30, 2020 debt to capital § Debt-to-capital has remained at a low % level, absolute and relative to peers 50 § No additional debt to date in 2020 § Multiple sources of low-cost liquidity 25 § Support for key priorities – sustaining capital and dividend 0 § Optionality to pursue potential highly- Imperial Cenovus Suncor CNRL Husky attractive growth opportunities S&P credit ratings AA BBB- BBB+ BBB BBB Imperial │ 2020 64Advantaged access to capital Supported by industry-leading credit rating Sept. 30, 2020 debt to capital § Debt-to-capital has remained at a low % level, absolute and relative to peers 50 § No additional debt to date in 2020 § Multiple sources of low-cost liquidity 25 § Support for key priorities – sustaining capital and dividend 0 § Optionality to pursue potential highly- Imperial Cenovus Suncor CNRL Husky attractive growth opportunities S&P credit ratings AA BBB- BBB+ BBB BBB Imperial │ 2020 64

Capital allocation priorities Focus on returning excess cash to shareholders Dividend per share § Reliable and growing dividend $ § Strong balance sheet 1.00 CAGR = 11% 0.80 § Sustaining capital CAGR = 5% 0.60 § Select investment in existing assets 0.40 § Share buybacks / special dividends 0.20 § Highly attractive growth opportunities 0.00 2011 2012 2013 2014 2015 2016 2017 2018 2019 2020 Paid basis Imperial │ 2020 65Capital allocation priorities Focus on returning excess cash to shareholders Dividend per share § Reliable and growing dividend $ § Strong balance sheet 1.00 CAGR = 11% 0.80 § Sustaining capital CAGR = 5% 0.60 § Select investment in existing assets 0.40 § Share buybacks / special dividends 0.20 § Highly attractive growth opportunities 0.00 2011 2012 2013 2014 2015 2016 2017 2018 2019 2020 Paid basis Imperial │ 2020 65

Capital expenditure outlook Focus on sustaining capital and select growth Total annual capital expenditures § 2021 target of $1.2 billion $B 2 § 5-year average down 30% vs. prior year view § Sustaining capital averages ~$1.1 billion 1 î Includes larger one-time investments (MLX, Kearl tailings) î Approximately 70% is Upstream § Growth capital averages ~$0.2-0.3 billion 0 2015- 2020 2021 2022 2023 2024 2020- î Enhance existing assets 19 OL 24 î Grand Rapids 2020 Plan 2019 Plan î Kearl pathway to 280+ kbd Imperial │ 2020 66Capital expenditure outlook Focus on sustaining capital and select growth Total annual capital expenditures § 2021 target of $1.2 billion $B 2 § 5-year average down 30% vs. prior year view § Sustaining capital averages ~$1.1 billion 1 î Includes larger one-time investments (MLX, Kearl tailings) î Approximately 70% is Upstream § Growth capital averages ~$0.2-0.3 billion 0 2015- 2020 2021 2022 2023 2024 2020- î Enhance existing assets 19 OL 24 î Grand Rapids 2020 Plan 2019 Plan î Kearl pathway to 280+ kbd Imperial │ 2020 66

Corporate WTI breakeven Resilience at low prices Estimated WTI breakevens Cash flow from operating activities breakeven $US 27/bbl Cash flow from operating activities and sustaining capital breakeven $US 33/bbl Cash flow from operating activities, sustaining capital and current dividend breakeven $US 36/bbl 0 10 20 30 40 $US/bbl 2021-2025 period average, $US 10 WCS differential, $US 0.75 FX rate, downstream margin normalization over time Imperial │ 2020 67Corporate WTI breakeven Resilience at low prices Estimated WTI breakevens Cash flow from operating activities breakeven $US 27/bbl Cash flow from operating activities and sustaining capital breakeven $US 33/bbl Cash flow from operating activities, sustaining capital and current dividend breakeven $US 36/bbl 0 10 20 30 40 $US/bbl 2021-2025 period average, $US 10 WCS differential, $US 0.75 FX rate, downstream margin normalization over time Imperial │ 2020 67
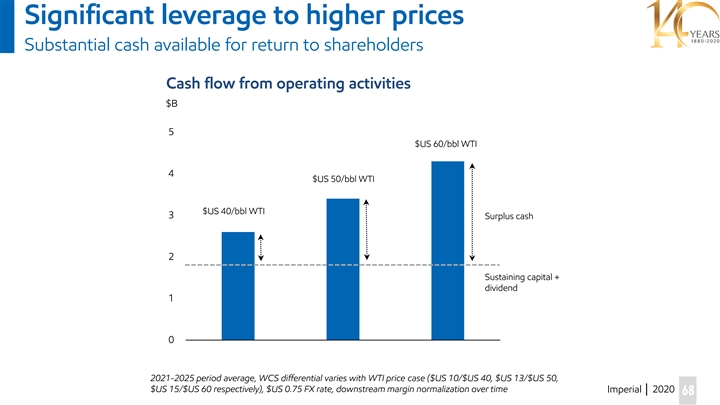
Significant leverage to higher prices Substantial cash available for return to shareholders Cash flow from operating activities $B 5 $US 60/bbl WTI 4 $US 50/bbl WTI $US 40/bbl WTI 3 Surplus cash 2 Sustaining capital + dividend 1 0 2021-2025 period average, WCS differential varies with WTI price case ($US 10/$US 40, $US 13/$US 50, $US 15/$US 60 respectively), $US 0.75 FX rate, downstream margin normalization over time Imperial │ 2020 68Significant leverage to higher prices Substantial cash available for return to shareholders Cash flow from operating activities $B 5 $US 60/bbl WTI 4 $US 50/bbl WTI $US 40/bbl WTI 3 Surplus cash 2 Sustaining capital + dividend 1 0 2021-2025 period average, WCS differential varies with WTI price case ($US 10/$US 40, $US 13/$US 50, $US 15/$US 60 respectively), $US 0.75 FX rate, downstream margin normalization over time Imperial │ 2020 68

Summary of 2020 and 2021 guidance Annual guidance 2020 OL 2021 FC Total capex $B 0.9 1.2 Upstream production kboed 395 415 Kearl kbd (gross) 220 255 Cold Lake kbd 135 130 Syncrude kbd 70 75 Refinery throughput kbd 340 375 Refinery utilization % 80 89 Production Imperial share, before royalties except Kearl which is 100% gross basis Imperial │ 2020 69Summary of 2020 and 2021 guidance Annual guidance 2020 OL 2021 FC Total capex $B 0.9 1.2 Upstream production kboed 395 415 Kearl kbd (gross) 220 255 Cold Lake kbd 135 130 Syncrude kbd 70 75 Refinery throughput kbd 340 375 Refinery utilization % 80 89 Production Imperial share, before royalties except Kearl which is 100% gross basis Imperial │ 2020 69

Closing remarks Brad Corson Chairman, President and Chief Executive OfficerClosing remarks Brad Corson Chairman, President and Chief Executive Officer

The Imperial advantage Robust through the cycle § Commitment to deliver winning shareholder value ü § High-quality, long-life assets ü § Integration supports resilience through market cycles ü § Industry-leading balance sheet strength ü § Focus on operational excellence ü § Unparalleled history of technology leadership ü § Synergies across full value chain ü Imperial │ 2020 § Commitment to returning cash to shareholders 71 üThe Imperial advantage Robust through the cycle § Commitment to deliver winning shareholder value ü § High-quality, long-life assets ü § Integration supports resilience through market cycles ü § Industry-leading balance sheet strength ü § Focus on operational excellence ü § Unparalleled history of technology leadership ü § Synergies across full value chain ü Imperial │ 2020 § Commitment to returning cash to shareholders 71 ü

Our winning strategy Focus and deliver § Focusing on the ‘core’ î Get the most out of existing assets î Target industry-leading reliability, cost structure î Capture value from integration î Progress towards ESG targets § Return more cash to shareholders î Deliver healthy free cash flow î Strong, growing, sustainable dividend î Share repurchases, cash management § Ensure capital discipline throughout the cycle î Debottlenecking î Selective high-return growth – organic/inorganic § Remain nimble î Ability to pivot as market dynamics change î Flexibility comes from strong balance sheet, low cost, high reliability Imperial │ 2020 72Our winning strategy Focus and deliver § Focusing on the ‘core’ î Get the most out of existing assets î Target industry-leading reliability, cost structure î Capture value from integration î Progress towards ESG targets § Return more cash to shareholders î Deliver healthy free cash flow î Strong, growing, sustainable dividend î Share repurchases, cash management § Ensure capital discipline throughout the cycle î Debottlenecking î Selective high-return growth – organic/inorganic § Remain nimble î Ability to pivot as market dynamics change î Flexibility comes from strong balance sheet, low cost, high reliability Imperial │ 2020 72
Cautionary statement Statements of future events or conditions in this report, including projections, targets, expectations, estimates, and business plans are forward-looking statements. Forward-looking statements can be identified by words such as believe, anticipate, intend, propose, plan, goal, target, estimate, expect, strategy, outlook, future, likely, may, should, will and similar references to future periods. Forward-looking statements in this report include, but are not limited to, references to the significant potential of high quality assets, a resilient business model and being well positioned to drive shareholder value; plans to deliver shareholder returns and an ongoing ESG focus; ability to manage through a challenging environment and accelerate out of the downturn; the global and local energy outlook and mix, and recovery from COVID-19; the company’s strategy for a lower-carbon future, target for reducing greenhouse gas emissions intensity by 2023 and the impact of new technologies on greenhouse gas emissions intensity reductions; developing pathways and solutions to a net zero future; the triple win strategy of reducing environmental footprint, capturing business efficiencies and social innovation; upstream focus on best-in-class producer and maximizing cash flow; production growth anticipated for 2021 and to 2025; the potential to generate significant upside cash from operations; projected capital expenditures from 2021-2024, including impact on volume growth and maintaining low sustaining capital; the selection of future investments and their impact on delivering value; the value and impact of digital technology and innovation activities; Kearl future unit cost targets; Kearl production outlook of 255kbd for 2021 and pathway to 280kbd; autonomous haul conversion target and projected unit costs savings; the Kearl in-pit tailings project; the Cold Lake long term strategy, production outlook of 140kbd by 2024 and the timing and impact of select capital investments; Syncrude production and unit cost forecast and timing and impact of the interconnect pipeline; the strategy for upstream organic growth opportunities; downstream strengths to drive cash generation and focus on efficiency, optimization and margin enhancement; benefits from integration and being well positioned in the Canadian downstream market for future success; the impact of sales channel strategy; downstream capital expenditure outlook to 2025; the timing and impact of the Strathcona cogeneration project, Sarnia products pipeline and Edmonton rail terminal; Chemicals long term strength and demand growth for key products; the company’s financial profile being well positioned for recovery and advantaged access to capital; capital allocation priorities and focus on returning excess cash to shareholders; total annual capital expenditure outlook, including sustaining and growth capital averages; corporate WTI breakeven estimates and resilience at low prices; potential cash flow from operations at various prices; and 2020 and 2021 annual guidance and priorities. Forward-looking statements are based on the company's current expectations, estimates, projections and assumptions at the time the statements are made. Actual future financial and operating results, including expectations and assumptions concerning demand growth and energy source, supply and mix; commodity prices, foreign exchange rates and general market conditions; production rates, growth and mix; project plans, timing, costs, technical evaluations and capacities and the company’s ability to effectively execute on these plans and operate its assets; production life, resource recoveries and reservoir performance; cost savings; progression of COVID-19 and its impacts on Imperial’s ability to operate its assets, including the possible shutdown of facilities due to COVID-19 outbreaks; the company’s ability to effectively execute on its business continuity plans and pandemic response activities; the performance of third-party service providers; the adoption and impact of new facilities or technologies, including on capital efficiency, production and reductions to greenhouse gas emissions intensity; refinery utilization and product sales; applicable laws and government policies, including taxation, climate change, production curtailment and restrictions in response to COVID- 19; financing sources and capital structure; and capital and environmental expenditures could differ materially depending on a number of factors. These factors include global, regional or local changes in supply and demand for oil, natural gas, and petroleum and petrochemical products and resulting price, differential and margin impacts, including foreign government action with respect to supply levels and prices and the impact of COVID-19 on demand; general economic conditions; currency exchange rates; political or regulatory events, including changes in law or government policy, applicable royalty rates, tax laws, production curtailment and actions in response to COVID-19; the receipt, in a timely manner, of regulatory and third-party approvals; availability and performance of third party service providers; availability and allocation of capital; third party opposition to operations, projects and infrastructure; environmental risks inherent in oil and gas exploration and production activities; environmental regulation, including climate change and greenhouse gas regulation and changes to such regulation; the results of research programs and new technologies, and ability to bring new technologies to commercial scale on a cost-competitive basis; transportation for accessing markets; unanticipated technical or operational difficulties; operational hazards and risks; project management and schedules and timely completion of projects; reservoir analysis and performance; cybersecurity incidents; and other factors discussed in Item 1A risk factors and Item 7 management’s discussion and analysis of Imperial’s most recent annual report on Form 10-K and subsequent interim reports on Form 10-Q. Forward-looking statements are not guarantees of future performance and involve a number of risks and uncertainties, some that are similar to other oil and gas companies and some that are unique to Imperial. Imperial’s actual results may differ materially from those expressed or implied by its forward-looking statements and readers are cautioned not to place undue reliance on them. Imperial undertakes no obligation to update any forward-looking statements contained herein, except as required by applicable law. In these materials, certain natural gas volumes have been converted to barrels of oil equivalent (BOE) on the basis of six thousand cubic feet (Mcf) to one barrel (bbl). BOE may be misleading, particularly if used in isolation. A BOE conversion ratio of 6 Mcf to one bbl is based on an energy-equivalency conversion method primarily applicable at the burner tip and does not represent a value equivalency at the wellhead. Given that the value ratio based on the current price of crude oil as compared to natural gas is significantly different than the energy equivalency ratio of 6 Mcf to 1 bbl, using a 6:1 conversion ratio may be misleading as an indication of value. The term “project” as used in these materials can refer to a variety of different activities and does not necessarily have the same meaning as in any government payment transparency reports. The estimates of various classes of reserves (proved and probable) and of contingent resources in these materials represent arithmetic sums of multiple estimates of such classes for different properties, which statistical principles indicate may be misleading as to volumes that may actually be recovered. Readers should give attention to the estimates of individual classes of reserves and contingent resources and appreciate the differing probabilities of recovery associated with each class. All reserves and contingent resources estimates provided in these materials are effective as of December 31, 2019, and based on definitions contained in the Canadian Oil and Gas Evaluation Handbook (COGEH) and are presented in accordance with National Instrument 51-101, as disclosed in Imperial’s Form 51-101F1 for the fiscal year ending December 31, 2019. Except as otherwise disclosed herein, reserves and contingent resource information are an estimate of the company’s working interest before royalties at year-end 2019, as determined by Imperial’s internal qualified reserves evaluator. Reserves are the estimated remaining quantities of commercially recoverable oil, natural gas, and related substances anticipated to be recoverable from known accumulations, as of a given date, based on the analysis of drilling, geological, geophysical and engineering data, the use of established technology, and specified economic conditions, which are generally accepted as being reasonable. Proved reserves are those reserves that can be estimated with a high degree of certainty to be recoverable. Probable reserves are those additional reserves that are less certain to be recovered than proved reserves. Imperial │ 2020 73Cautionary statement Statements of future events or conditions in this report, including projections, targets, expectations, estimates, and business plans are forward-looking statements. Forward-looking statements can be identified by words such as believe, anticipate, intend, propose, plan, goal, target, estimate, expect, strategy, outlook, future, likely, may, should, will and similar references to future periods. Forward-looking statements in this report include, but are not limited to, references to the significant potential of high quality assets, a resilient business model and being well positioned to drive shareholder value; plans to deliver shareholder returns and an ongoing ESG focus; ability to manage through a challenging environment and accelerate out of the downturn; the global and local energy outlook and mix, and recovery from COVID-19; the company’s strategy for a lower-carbon future, target for reducing greenhouse gas emissions intensity by 2023 and the impact of new technologies on greenhouse gas emissions intensity reductions; developing pathways and solutions to a net zero future; the triple win strategy of reducing environmental footprint, capturing business efficiencies and social innovation; upstream focus on best-in-class producer and maximizing cash flow; production growth anticipated for 2021 and to 2025; the potential to generate significant upside cash from operations; projected capital expenditures from 2021-2024, including impact on volume growth and maintaining low sustaining capital; the selection of future investments and their impact on delivering value; the value and impact of digital technology and innovation activities; Kearl future unit cost targets; Kearl production outlook of 255kbd for 2021 and pathway to 280kbd; autonomous haul conversion target and projected unit costs savings; the Kearl in-pit tailings project; the Cold Lake long term strategy, production outlook of 140kbd by 2024 and the timing and impact of select capital investments; Syncrude production and unit cost forecast and timing and impact of the interconnect pipeline; the strategy for upstream organic growth opportunities; downstream strengths to drive cash generation and focus on efficiency, optimization and margin enhancement; benefits from integration and being well positioned in the Canadian downstream market for future success; the impact of sales channel strategy; downstream capital expenditure outlook to 2025; the timing and impact of the Strathcona cogeneration project, Sarnia products pipeline and Edmonton rail terminal; Chemicals long term strength and demand growth for key products; the company’s financial profile being well positioned for recovery and advantaged access to capital; capital allocation priorities and focus on returning excess cash to shareholders; total annual capital expenditure outlook, including sustaining and growth capital averages; corporate WTI breakeven estimates and resilience at low prices; potential cash flow from operations at various prices; and 2020 and 2021 annual guidance and priorities. Forward-looking statements are based on the company's current expectations, estimates, projections and assumptions at the time the statements are made. Actual future financial and operating results, including expectations and assumptions concerning demand growth and energy source, supply and mix; commodity prices, foreign exchange rates and general market conditions; production rates, growth and mix; project plans, timing, costs, technical evaluations and capacities and the company’s ability to effectively execute on these plans and operate its assets; production life, resource recoveries and reservoir performance; cost savings; progression of COVID-19 and its impacts on Imperial’s ability to operate its assets, including the possible shutdown of facilities due to COVID-19 outbreaks; the company’s ability to effectively execute on its business continuity plans and pandemic response activities; the performance of third-party service providers; the adoption and impact of new facilities or technologies, including on capital efficiency, production and reductions to greenhouse gas emissions intensity; refinery utilization and product sales; applicable laws and government policies, including taxation, climate change, production curtailment and restrictions in response to COVID- 19; financing sources and capital structure; and capital and environmental expenditures could differ materially depending on a number of factors. These factors include global, regional or local changes in supply and demand for oil, natural gas, and petroleum and petrochemical products and resulting price, differential and margin impacts, including foreign government action with respect to supply levels and prices and the impact of COVID-19 on demand; general economic conditions; currency exchange rates; political or regulatory events, including changes in law or government policy, applicable royalty rates, tax laws, production curtailment and actions in response to COVID-19; the receipt, in a timely manner, of regulatory and third-party approvals; availability and performance of third party service providers; availability and allocation of capital; third party opposition to operations, projects and infrastructure; environmental risks inherent in oil and gas exploration and production activities; environmental regulation, including climate change and greenhouse gas regulation and changes to such regulation; the results of research programs and new technologies, and ability to bring new technologies to commercial scale on a cost-competitive basis; transportation for accessing markets; unanticipated technical or operational difficulties; operational hazards and risks; project management and schedules and timely completion of projects; reservoir analysis and performance; cybersecurity incidents; and other factors discussed in Item 1A risk factors and Item 7 management’s discussion and analysis of Imperial’s most recent annual report on Form 10-K and subsequent interim reports on Form 10-Q. Forward-looking statements are not guarantees of future performance and involve a number of risks and uncertainties, some that are similar to other oil and gas companies and some that are unique to Imperial. Imperial’s actual results may differ materially from those expressed or implied by its forward-looking statements and readers are cautioned not to place undue reliance on them. Imperial undertakes no obligation to update any forward-looking statements contained herein, except as required by applicable law. In these materials, certain natural gas volumes have been converted to barrels of oil equivalent (BOE) on the basis of six thousand cubic feet (Mcf) to one barrel (bbl). BOE may be misleading, particularly if used in isolation. A BOE conversion ratio of 6 Mcf to one bbl is based on an energy-equivalency conversion method primarily applicable at the burner tip and does not represent a value equivalency at the wellhead. Given that the value ratio based on the current price of crude oil as compared to natural gas is significantly different than the energy equivalency ratio of 6 Mcf to 1 bbl, using a 6:1 conversion ratio may be misleading as an indication of value. The term “project” as used in these materials can refer to a variety of different activities and does not necessarily have the same meaning as in any government payment transparency reports. The estimates of various classes of reserves (proved and probable) and of contingent resources in these materials represent arithmetic sums of multiple estimates of such classes for different properties, which statistical principles indicate may be misleading as to volumes that may actually be recovered. Readers should give attention to the estimates of individual classes of reserves and contingent resources and appreciate the differing probabilities of recovery associated with each class. All reserves and contingent resources estimates provided in these materials are effective as of December 31, 2019, and based on definitions contained in the Canadian Oil and Gas Evaluation Handbook (COGEH) and are presented in accordance with National Instrument 51-101, as disclosed in Imperial’s Form 51-101F1 for the fiscal year ending December 31, 2019. Except as otherwise disclosed herein, reserves and contingent resource information are an estimate of the company’s working interest before royalties at year-end 2019, as determined by Imperial’s internal qualified reserves evaluator. Reserves are the estimated remaining quantities of commercially recoverable oil, natural gas, and related substances anticipated to be recoverable from known accumulations, as of a given date, based on the analysis of drilling, geological, geophysical and engineering data, the use of established technology, and specified economic conditions, which are generally accepted as being reasonable. Proved reserves are those reserves that can be estimated with a high degree of certainty to be recoverable. Probable reserves are those additional reserves that are less certain to be recovered than proved reserves. Imperial │ 2020 73
For more information: Dave Hughes Vice President, Investor Relations +1 587.476.4743 [email protected] imperialoil.ca twitter.com/ImperialOil linkedin.com/company/Imperial-Oil youtube.com/ImperialOil facebook.com/ImperialOilLimitedFor more information: Dave Hughes Vice President, Investor Relations +1 587.476.4743 [email protected] imperialoil.ca twitter.com/ImperialOil linkedin.com/company/Imperial-Oil youtube.com/ImperialOil facebook.com/ImperialOilLimited

Q & AQ & A