

SRAX Reports 161% Year-Over-Year and 124% Quarter-Over-Quarter Revenue Growth
LOS ANGELES--(BUSINESS WIRE)-- SRAX, Inc. (NASDAQ: SRAX), a financial technology company that unlocks data and insights to publicly traded companies through Sequire, reported results for the three months ended September 30, 2020.
This press release features multimedia. View the full release here: https://www.businesswire.com/news/home/20201116005477/en/
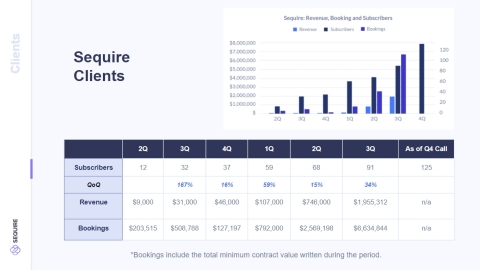
(Graphic: Business Wire)
Third Quarter 2020 and Recent Operational Highlights
- Revenue for Q3 of $2.6M up 161% year-over-year, 124% sequentially quarter-over-quarter
- Reduced operating expenses by 22% year-over-year for Q3 and 18% year-to-date
- EBITDA increase of $2.1M, or 53%, vs Q3 2019
- Sequire segment EBITDA positive in Q3 2020
- 7 consecutive quarters of Sequire SAAS growth
- Sequire bookings for the quarter were $6.7M
- Currently holding approximately $10M worth of publicly listed securities
- 125 public companies/partners have subscribed to Sequire, up 34 companies since Q2 release, a 37% increase
- BIGToken share exchange agreement signed – anticipated to move into its own publicly traded company in Q4 (TICKER:FPVD)
- Completed the acquisition of LD Micro
- Sold position in TI Health (SRAXmd) for $8M
- Fourth Quarter revenue guidance of $4M
Third Quarter 2020
- Total Revenue was $2.6M, an increase of 161% as compared to Q3 2019 and up 124% from Q2 2020.
- Gross Margin was 66%, as compared to 68% in the same period last year.
- Operating Expenses were $4.2M, a decrease of $1.2M, or 22% as compared to the same period last year.
- EBITDA was -$1.9M as compared to -$4M in the same period last year.
- Net Income was -$6.6M compared to $1.4M in the same period last year. This includes a one-time $3.3M in non-cash financing costs related to our convertible debenture financing, and $800K in non-cash mark-to-market adjustment on our publicly listed securities. The prior year net income includes a $6.3M derivative liability gain on the valuation of our warrants.
Nine Months Ended September 30, 2020
- Total Revenue was $4.1M, an increase of 65% as compared to the same period in prior year.
- Gross Margin was 66%, as compared to 57% in the same period last year.
- Operating Expenses were $12.3M, a decrease of $2.7M, or 18% as compared to the same period last year.
- EBITDA was -$7.7M as compared to -$12.2M in the same period last year.
- Net Income was -$14.9M compared to -$12.2M in the same period last year. This includes $5.3M in non-cash financing costs and $300K in non-cash mark-to-market adjustment on our publicly listed securities. The prior year includes a $359K in financing costs and $1.4M of derivative liability gain on the valuation of our warrants.
“As the Sequire platform continues to grow and adapt to customer needs, we are seeing a tremendous increase in our recurring revenue stream. Sequire is changing the way public issuers interact with and engage their investors, and it shows. We are pleased to report our first quarter of positive EBITDA from our Sequire segment,” said Chris Miglino, Founder and CEO of SRAX.
“The whole company is very proud of everything we’ve accomplished this quarter and is excited about the momentum we have going into quarter four. We acquired LD Micro, moved BIGToken to its own public company, and successfully sold our remaining MD asset, which was not on our balance sheet. Additionally, as we are seeing continued addition of our Sequire platform, SRAX is providing guidance of $4M in revenue for the fourth quarter,” Miglino added.
Conference Call:
Management will review the results on a conference call with a live question and answer session, November 16th, 2020, at 12:00 p.m. ET / 9:00 a.m. PT.
To access the live webcast and presentation, please register here: https://zoom.us/webinar/register/WN_Hj1BLJk9Rma0d-g4ZfBbVg
The webcast will be available on srax.com for at least 90 days. To dial-in to the conference call, please call US: +1 669 900 6833. Webinar ID: 942 4818 0377.
Non-GAAP Measures:
To supplement our condensed consolidated financial statements, which are prepared and presented in accordance with generally accepted accounting principles in the United States (GAAP), we use the following non-GAAP financial measures: Adjusted EBITDA. The presentation of these financial measures is not intended to be considered in isolation or as a substitute for, or superior to, financial information prepared and presented in accordance with GAAP. Investors are cautioned that there are material limitations associated with the use of non-GAAP financial measures as an analytical tool. In addition, these measures may be different from non-GAAP financial measures used by other companies, limiting their usefulness for comparison purposes. We compensate for these limitations by providing specific information regarding the GAAP amounts excluded from these non-GAAP financial measures. We believe these non-GAAP financial measures provide investors with useful supplemental information about the financial performance of our business, enable comparison of financial results between periods where certain items may vary independent of business performance, and allow for greater transparency with respect to key metrics used by management in operating our business. For more information on our non-GAAP financial measures and a reconciliation of GAAP to non-GAAP measures, please see the "Reconciliation of GAAP to Non-GAAP Results" table in this press release.
Adjusted EBITDA is defined as earnings before interest, taxes, depreciation and amortization, changes in the fair-value of derivative and warrant liabilities and certain additional one-time charges.
About SRAX:
SRAX (NASDAQ: SRAX) is a financial technology company that unlocks data and insights for publicly traded companies. Through its premier investor intelligence and communications platform, Sequire, companies can track their investors’ behaviors and trends and use those insights to engage current and potential investors across marketing channels. For more information on SRAX, visit srax.com.
Safe Harbor Statement:
This press release contains certain forward-looking statements that are based upon current expectations and involve certain risks and uncertainties within the meaning of the U.S. Private Securities Litigation Reform Act of 1995. Words or expressions such as "anticipate," "plan," "will," "intend," "believe" or "expect'" or variations of such words and similar expressions are intended to identify such forward-looking statements. These forward-looking statements are not guarantees of future performance and are subject to risks, uncertainties, and other factors, some of which are beyond our control and difficult to predict and could cause actual results to differ materially from those expressed or forecasted in the forward-looking statements, including, without limitation, statements made with respect to expectations of our ability to increase our revenues, satisfy our obligations as they become due, report profitable operations and other risks and uncertainties as set forth in our Annual Report on Form 10-K for the year ended December 31, 2019, and our subsequent Quarterly Reports on Form 10-Q as filed with the Securities and Exchange Commission. All forward-looking statements involve significant risks and uncertainties that could cause actual results to differ materially from those in the forward-looking statements, many of which are generally outside the control of SRAX and are difficult to predict. SRAX undertakes no obligation to publicly update any forward-looking statements, whether as a result of new information, future events or otherwise.
For the Three Months Ended September 30, |
||||||||||||||||||||||||
Sequire |
|
BIGToken |
|
Corporate and Other |
|
Consolidated |
||||||||||||||||||
|
|
2020 |
|
2019 |
|
2020 |
|
2019 |
|
2020 |
|
2019 |
|
2020 |
|
2019 |
||||||||
| Total Revenue | 1,956,000 |
|
31,000 |
|
604,000 |
|
915,000 |
|
49,000 |
|
54,000 |
|
2,609,000 |
|
1,000,000 |
|
||||||||
| Cost of Revenue | 650,000 |
|
- |
|
230,000 |
|
335,000 |
|
- |
|
(13,000 |
) |
880,000 |
|
322,000 |
|
||||||||
| Gross profit | 1,306,000 |
|
31,000 |
|
374,000 |
|
580,000 |
|
49,000 |
|
67,000 |
|
1,729,000 |
|
678,000 |
|
||||||||
| margin % | 66.8 |
% |
100.0 |
% |
61.9 |
% |
63.4 |
% |
100.0 |
% |
124.1 |
% |
66.3 |
% |
67.8 |
% |
||||||||
| Operating expenses | 1,128,000 |
|
96,000 |
|
1,140,000 |
|
3,171,000 |
|
1,930,000 |
|
2,102,000 |
|
4,198,000 |
|
5,369,000 |
|
||||||||
| Operating Income | 178,000 |
|
(65,000 |
) |
(766,000 |
) |
(2,591,000 |
) |
(1,882,000 |
) |
(2,035,000 |
) |
(2,470,000 |
) |
(4,691,000 |
) |
||||||||
For the Nine Months Ended September 30, |
||||||||||||||||||||||||
Sequire |
|
BIGToken |
|
Corporate and Other |
|
Consolidated |
||||||||||||||||||
|
|
2020 |
|
2019 |
|
2020 |
|
2019 |
|
2020 |
|
2019 |
|
2020 |
|
2019 |
||||||||
| Total Revenue | 2,808,000 |
41,000 |
1,174,000 |
2,291,000 |
142,000 |
164,000 |
4,124,000 |
2,496,000 |
||||||||||||||||
| Cost of Revenue | 896,000 |
|
- |
|
491,000 |
|
1,013,000 |
|
1,000 |
|
62,000 |
|
1,388,000 |
|
1,075,000 |
|
||||||||
| Gross profit | 1,912,000 |
|
41,000 |
|
683,000 |
|
1,278,000 |
|
141,000 |
|
102,000 |
|
2,736,000 |
|
1,421,000 |
|
||||||||
| margin % | 68.1 |
% |
100.0 |
% |
58.2 |
% |
55.8 |
% |
99.3 |
% |
62.2 |
% |
66.3 |
% |
56.9 |
% |
||||||||
| Operating expenses | 1,934,000 |
|
288,000 |
|
4,490,000 |
|
8,281,000 |
|
5,907,000 |
|
6,407,000 |
|
12,331,000 |
|
14,976,000 |
|
||||||||
| Operating Income | (22,000 |
) |
(247,000 |
) |
(3,807,000 |
) |
(7,003,000 |
) |
(5,766,000 |
) |
(6,305,000 |
) |
(9,595,000 |
) |
(13,555,000 |
) |
||||||||
| STATEMENT OF OPERATIONS | ||||||||||||||||||||||||||||||
| (Unaudited) | Three months ending September 30 |
|
Nine months ending June September 30 |
|||||||||||||||||||||||||||
| In dollars | 2020 |
|
2019 |
|
$ CHG |
|
% CHG |
|
2020 |
|
2019 |
|
$ CHG |
|
% CHG |
|||||||||||||||
| REVENUE | ||||||||||||||||||||||||||||||
| Total revenues |
|
2,609,000 |
|
|
1,001,000 |
|
1,608,000 |
|
161 |
% |
|
4,125,000 |
|
|
2,497,000 |
|
1,628,000 |
|
65 |
% |
||||||||||
| COST OF REVENUES | ||||||||||||||||||||||||||||||
| Total cost of revenues |
|
880,000 |
|
|
322,000 |
|
558,000 |
|
173 |
% |
|
1,388,000 |
|
|
1,075,000 |
|
313,000 |
|
29 |
% |
||||||||||
| Gross profit |
|
1,729,000 |
|
|
679,000 |
|
1,050,000 |
|
155 |
% |
|
2,737,000 |
|
|
1,422,000 |
|
1,315,000 |
|
92 |
% |
||||||||||
| Gross profit margin |
|
66 |
% |
|
68 |
% |
|
66 |
% |
|
57 |
% |
||||||||||||||||||
| OPERATING EXPENSES | ||||||||||||||||||||||||||||||
| Employee related costs | 1,689,000 |
2,162,000 |
(473,000 |
) |
-22 |
% |
5,406,000 |
6,730,000 |
(1,324,000 |
) |
-20 |
% |
||||||||||||||||||
| Marketing and selling expenses |
|
809,000 |
|
1,115,000 |
(306,000 |
) |
-27 |
% |
|
1,631,000 |
|
2,202,000 |
(571,000 |
) |
-26 |
% |
||||||||||||||
| Platform Costs |
|
391,000 |
|
453,000 |
(62,000 |
) |
-14 |
% |
|
1,181,000 |
|
|
1,159,000 |
|
22,000 |
|
2 |
% |
||||||||||||
| Depreciation and amortization |
|
333,000 |
|
304,000 |
29,000 |
10 |
% |
|
962,000 |
|
|
834,000 |
128,000 |
15 |
% |
|||||||||||||||
| General selling general and administrative |
|
984,000 |
|
1,355,000 |
(371,000 |
) |
-27 |
% |
|
3,157,000 |
|
4,069,000 |
(912,000 |
) |
-22 |
% |
||||||||||||||
| Total operating expenses |
|
4,206,000 |
|
5,389,000 |
(1,183,000 |
) |
-22 |
% |
|
12,337,000 |
|
|
14,994,000 |
|
(2,657,000 |
) |
-18 |
% |
||||||||||||
| (LOSS) INCOME FROM OPERATIONS |
|
(2,477,000 |
) |
|
(4,710,000 |
) |
2,233,000 |
|
-47 |
% |
|
(9,600,000 |
) |
|
(13,572,000 |
) |
3,972,000 |
|
-29 |
% |
||||||||||
| Financing Costs |
|
(3,302,000 |
) |
|
(108,000 |
) |
(3,194,000 |
) |
2957 |
% |
|
(5,340,000 |
) |
|
(359,000 |
) |
(4,981,000 |
) |
1387 |
% |
||||||||||
| Interest Income |
|
- |
|
- |
|
n/a |
|
|
- |
|
|
- |
|
- |
|
n/a |
|
|||||||||||||
| Gain (loss) on sale of assets | - |
n/a |
|
- |
|
395,000 |
(395,000 |
) |
-100 |
% |
||||||||||||||||||||
| Gain / (Loss) from marketable securities |
|
(800,000 |
) |
(800,000 |
) |
n/a |
|
(284,000 |
) |
|
- |
(284,000 |
) |
n/a |
||||||||||||||||
| Other gain (loss) |
|
8,000 |
8,000 |
n/a |
|
8,000 |
|
14,000 |
(6,000 |
) |
-43 |
% |
||||||||||||||||||
| Loss on repricing of equity warrants | - |
n/a |
|
(342,000 |
) |
342,000 |
-100 |
% |
||||||||||||||||||||||
| Change in fair value of derivative liabilities |
|
- |
|
6,227,000 |
(6,227,000 |
) |
-100 |
% |
|
321,000 |
|
1,390,000 |
(1,069,000 |
) |
-77 |
% |
||||||||||||||
| (LOSS) INCOME BEFORE INCOME TAXES |
|
(6,571,000 |
) |
|
1,409,000 |
(7,980,000 |
) |
-566 |
% |
|
(14,895,000 |
) |
|
(12,474,000 |
) |
(2,421,000 |
) |
19 |
% |
|||||||||||
| Provision for income taxes |
|
- |
|
- |
|
- |
|
- |
||||||||||||||||||||||
| NET (LOSS) INCOME |
|
(6,571,000 |
) |
|
1,409,000 |
(7,980,000 |
) |
-566 |
% |
|
(14,895,000 |
) |
|
|
(12,474,000 |
) |
(2,421,000 |
) |
19 |
% |
||||||||||
| NET (LOSS) INCOME PER SHARE, BASIC AND DILUTED | $ |
(0.45 |
) |
$ |
(0.67 |
) |
0.22 |
|
-32 |
% |
$ |
(1.05 |
) |
$ |
(0.67 |
) |
(0.38 |
) |
57 |
% |
||||||||||
| Weighted average shares used in computing net (loss) income per share, basic and diluted |
|
14,479,519 |
|
12,933,585 |
1,545,934 |
|
12 |
% |
|
14,186,721 |
|
12,965,773 |
1,220,948 |
|
9 |
% |
||||||||||||||
| RECONCILIATION OF GAAP TO NON-GAAP FINANCIAL INFORMATION | ||||||||||||||||||||||||||||||
| (Unaudited) | ||||||||||||||||||||||||||||||
| In dollars | 2020 |
|
2019 |
|
$ CHG |
|
% CHG |
|
2020 |
|
2019 |
|
$ CHG |
|
% CHG |
|||||||||||||||
| Net income (loss) - GAAP |
|
(6,571,000 |
) |
|
1,409,000 |
(7,980,000 |
) |
-566 |
% |
|
(14,895,000 |
) |
|
(12,474,000 |
) |
(2,421,000 |
) |
19 |
% |
|||||||||||
| Adjustments: | ||||||||||||||||||||||||||||||
| Equity based compensation |
|
268,000 |
|
|
423,000 |
|
|
916,000 |
|
|
870,000 |
|
||||||||||||||||||
| Adjustments to derivative liabilities |
|
- |
|
|
(6,227,000 |
) |
|
(321,000 |
) |
|
(1,390,000 |
) |
||||||||||||||||||
| Interest expense and financing costs |
|
3,302,000 |
|
|
108,000 |
|
|
5,340,000 |
|
|
359,000 |
|
||||||||||||||||||
| Depreciation and amortization |
|
332,000 |
|
|
305,000 |
|
|
963,000 |
|
|
834,000 |
|
||||||||||||||||||
| Gain on Sale of Assets |
|
- |
|
|
(409,000 |
) |
||||||||||||||||||||||||
| Other income |
|
(8,000 |
) |
|
(4,000 |
) |
||||||||||||||||||||||||
| Gain / (Loss) from marketable securities |
|
800,000 |
|
|
- |
|
|
284,000 |
|
|||||||||||||||||||||
| Adjusted EBITDA - NON GAAP |
|
(1,877,000 |
) |
|
(3,982,000 |
) |
2,105,000 |
|
-53 |
% |
|
(7,717,000 |
) |
|
(12,210,000 |
) |
4,493,000 |
|
-37 |
% |
||||||||||
Balance Sheets (Unaudited) |
|||||||
| In dollars | 30-Sep-20 | 31-Dec-19 | |||||
| ASSETS | |||||||
| Current Assets | |||||||
| Cash | 2,446,000 |
32,000 |
|||||
| Accounts receivable, net | 1,260,000 |
805,000 |
|||||
| Prepaid expense | 273,000 |
715,000 |
|||||
| Securities held for sale | 4,800,000 |
- |
|||||
| Other current assets | 63,000 |
306,000 |
|||||
| Total current assets | 8,842,000 |
1,858,000 |
|||||
| Property and equipment, net | 134,000 |
191,000 |
|||||
| Goodwill | 23,348,000 |
15,645,000 |
|||||
| Intangible assets, net | 2,399,000 |
1,966,000 |
|||||
| Right-of-Use Asset | 390,000 |
456,000 |
|||||
| Other assets | 22,000 |
118,000 |
|||||
| Total Assets | 35,135,000 |
20,234,000 |
|||||
| LIABILITIES AND EQUITY | |||||||
| Current Liabilities | |||||||
| Accounts payable and accrued expenses | 2,415,000 |
2,442,000 |
|||||
| Derivative liabilities | - |
4,397,000 |
|||||
| Other current liabilities | 6,850,000 |
537,000 |
|||||
| Payroll protection loan - current portion | 548,000 |
- |
|||||
| OID convertible debentures - current portion | 3,683,000 |
- |
|||||
| Total Current Liabilities | 13,496,000 |
7,376,000 |
|||||
| Right-of-Use liability - long term | 282,000 |
352,000 |
|||||
| Payroll protection loan, less current portion | 578,000 |
- |
|||||
| OID convertible debentures, less current portion | 2,748,000 |
- |
|||||
| Deferred Tax Liability | 131,000 |
||||||
| Total Liabilities | 17,235,000 |
7,728,000 |
|||||
| Stockholders' equity | 17,900,000 |
12,506,000 |
|||||
| Total liabilities and equity | 35,135,000 |
20,234,000 |
|||||
| STATEMENT OF CASH FLOWS | |||||||||
| Nine months ended | |||||||||
| (Unaudited) | |||||||||
| In dollars | 30-Sep-20 |
30-Sep-19 |
|||||||
| CASH FLOWS FROM OPERATING ACTIVITIES | |||||||||
| Net Cash Used in Operating Activities | (9,888,000 |
) |
(12,555,000 |
) |
|||||
| CASH FLOWS FROM INVESTING ACTIVITIES | |||||||||
| Proceeds from the sale of marketable securities | 397,000 |
|
- |
|
|||||
| Proceeds from sale of SRAXmd, net | - |
|
307,000 |
|
|||||
| Purchase of property and equipment | - |
|
(66,000 |
) |
|||||
| Development of software | (870,000 |
) |
(892,000 |
) |
|||||
| Acquisition of LD Micro, net | (697,000 |
) |
|||||||
| Other assets | 13,000 |
|
(79,000 |
) |
|||||
| Net Cash Used in investing activities | (1,157,000 |
) |
(730,000 |
) |
|||||
| CASH FLOWS FROM FINANCING ACTIVITIES | |||||||||
| Net cash flows from debt activities | 13,459,000 |
|
- |
|
|||||
| Proceeds from the issuance of common stock units | - |
|
12,197,000 |
|
|||||
| Proceeds from issuance of common stock for warrants exercised | - |
|
1,146,000 |
|
|||||
| Net Cash provided by financing activities | 13,459,000 |
|
13,343,000 |
|
|||||
| Net increase /(decrease) in cash and cash equivalents | 2,414,000 |
|
58,000 |
|
|||||
| Cash and cash equivalents at beginning of period | 32,000 |
|
2,785,000 |
|
|||||
| Cash and cash equivalents at end of period | 2,446,000 |
|
2,843,000 |
||||||
View source version on businesswire.com: https://www.businesswire.com/news/home/20201116005477/en/
Bri Kelvin
[email protected]
Source: SRAX, Inc.