
Form 8-K PQ Group Holdings Inc. For: Nov 10

Exhibit 99.1 INVESTOR PRESENTATION November 2020 Investor MeetingsExhibit 99.1 INVESTOR PRESENTATION November 2020 Investor Meetings

LEGAL DISCUSSION Forward-Looking Statements Some of the information contained in this presentation, the conference call during which this presentation is reviewed and any discussions that follow constitutes “forward-looking statements”. Forward-looking statements can be identified by words such as “anticipates,” “intends,” “plans,” “seeks,” “believes,” “estimates,” “expects,” “projects” and similar references to future periods. Forward-looking statements are based on our current expectations and assumptions regarding our business, the economy and other future conditions. Because forward-looking statements relate to the future, they are subject to inherent uncertainties, risks and changes in circumstances that are difficult to predict. Examples of forward looking statements include, but are not limited to, statements regarding the sale of the Performance Materials business segment and the review of strategic alternatives for the Performance Chemicals business segment, including the intended use of proceeds therefrom, our future results of operations, financial condition, liquidity, prospects, growth, strategies, capital allocation programs, product and service offerings and end use demand trends, including the impact of the COVID-19 pandemic on such items, and financial 2020 outlook. Our actual results may differ materially from those contemplated by the forward-looking statements. We caution you, therefore, against relying on any of these forward-looking statements. They are neither statements of historical fact nor guarantees or assurances of future performance. Important factors that could cause actual results to differ materially from those in the forward-looking statements include, but are not limited to, our ability to close on the sale of the Performance Materials business segment on our anticipated timeline, or at all, our ability to identify a strategic alternative for the Performance Chemicals business segment and to execute on such alternative, regional, national or global political, economic, business, competitive, market and regulatory conditions, including the ongoing COVID-19 pandemic, tariffs, and trade disputes, currency exchange rates and other factors, including those described in the sections titled “Risk Factors” and “Management Discussion & Analysis of Financial Condition and Results of Operations” in our filings with the SEC, which are available on the SEC’s website at www.sec.gov. Any forward-looking statement made by us in this presentation, the conference call during which this presentation is reviewed and any discussions that follow speaks only as of the date on which it is made. Factors or events that could cause our actual results to differ may emerge from time to time, and it is not possible for us to predict all of them. We undertake no obligation to update any forward-looking statement, whether as a result of new information, future developments or otherwise, except as may be required by applicable law. Non-GAAP Financial Measures This presentation includes certain non-GAAP financial measures, including adjusted EBITDA, adjusted EBITDA margin and adjusted free cash flow, which are provided to assist in an understanding of our business and its performance. These non-GAAP financial measures should be considered only as supplemental to, and not as superior to, financial measures prepared in accordance with GAAP. Non-GAAP financial measures should be read only in conjunction with consolidated financials prepared in accordance with GAAP. Reconciliations of non-GAAP measures to the relevant GAAP measures are provided in the appendix of this presentation. The Company is not able to provide a reconciliation of the Company’s non-GAAP financial guidance to the corresponding GAAP measures without unreasonable effort because of the inherent difficulty in forecasting and quantifying certain amounts necessary for such a reconciliation such as certain non-cash, nonrecurring or other items that are included in net income and EBITDA as well as the related tax impacts of these items and asset dispositions / acquisitions and changes in foreign currency exchange rates that are included in cash flow, due to the uncertainty and variability of the nature and amount of these future charges and costs. Zeolyst Joint Venture Zeolyst International and Zeolyst C.V. (our 50% owned joint ventures that we refer to collectively as the “Zeolyst Joint Venture”), are accounted for as an equity method investment in accordance with GAAP. The presentation of the Zeolyst Joint Venture’s sales in this presentation represents 50% of the sales of the Zeolyst Joint Venture. We do not record sales by the Zeolyst Joint Venture as revenue and such sales are not consolidated within our results of operations. However, our adjusted EBITDA reflects our share of the earnings of the Zeolyst Joint Venture that have been recorded as equity in net income from affiliated companies in our consolidated statements of income for such periods and includes Zeolyst Joint Venture adjustments on a proportionate basis based on our 50% ownership interest. Accordingly, our adjusted EBITDA margins are calculated including 50% of the sales of the Zeolyst Joint Venture for the relevant periods in the denominator. 2LEGAL DISCUSSION Forward-Looking Statements Some of the information contained in this presentation, the conference call during which this presentation is reviewed and any discussions that follow constitutes “forward-looking statements”. Forward-looking statements can be identified by words such as “anticipates,” “intends,” “plans,” “seeks,” “believes,” “estimates,” “expects,” “projects” and similar references to future periods. Forward-looking statements are based on our current expectations and assumptions regarding our business, the economy and other future conditions. Because forward-looking statements relate to the future, they are subject to inherent uncertainties, risks and changes in circumstances that are difficult to predict. Examples of forward looking statements include, but are not limited to, statements regarding the sale of the Performance Materials business segment and the review of strategic alternatives for the Performance Chemicals business segment, including the intended use of proceeds therefrom, our future results of operations, financial condition, liquidity, prospects, growth, strategies, capital allocation programs, product and service offerings and end use demand trends, including the impact of the COVID-19 pandemic on such items, and financial 2020 outlook. Our actual results may differ materially from those contemplated by the forward-looking statements. We caution you, therefore, against relying on any of these forward-looking statements. They are neither statements of historical fact nor guarantees or assurances of future performance. Important factors that could cause actual results to differ materially from those in the forward-looking statements include, but are not limited to, our ability to close on the sale of the Performance Materials business segment on our anticipated timeline, or at all, our ability to identify a strategic alternative for the Performance Chemicals business segment and to execute on such alternative, regional, national or global political, economic, business, competitive, market and regulatory conditions, including the ongoing COVID-19 pandemic, tariffs, and trade disputes, currency exchange rates and other factors, including those described in the sections titled “Risk Factors” and “Management Discussion & Analysis of Financial Condition and Results of Operations” in our filings with the SEC, which are available on the SEC’s website at www.sec.gov. Any forward-looking statement made by us in this presentation, the conference call during which this presentation is reviewed and any discussions that follow speaks only as of the date on which it is made. Factors or events that could cause our actual results to differ may emerge from time to time, and it is not possible for us to predict all of them. We undertake no obligation to update any forward-looking statement, whether as a result of new information, future developments or otherwise, except as may be required by applicable law. Non-GAAP Financial Measures This presentation includes certain non-GAAP financial measures, including adjusted EBITDA, adjusted EBITDA margin and adjusted free cash flow, which are provided to assist in an understanding of our business and its performance. These non-GAAP financial measures should be considered only as supplemental to, and not as superior to, financial measures prepared in accordance with GAAP. Non-GAAP financial measures should be read only in conjunction with consolidated financials prepared in accordance with GAAP. Reconciliations of non-GAAP measures to the relevant GAAP measures are provided in the appendix of this presentation. The Company is not able to provide a reconciliation of the Company’s non-GAAP financial guidance to the corresponding GAAP measures without unreasonable effort because of the inherent difficulty in forecasting and quantifying certain amounts necessary for such a reconciliation such as certain non-cash, nonrecurring or other items that are included in net income and EBITDA as well as the related tax impacts of these items and asset dispositions / acquisitions and changes in foreign currency exchange rates that are included in cash flow, due to the uncertainty and variability of the nature and amount of these future charges and costs. Zeolyst Joint Venture Zeolyst International and Zeolyst C.V. (our 50% owned joint ventures that we refer to collectively as the “Zeolyst Joint Venture”), are accounted for as an equity method investment in accordance with GAAP. The presentation of the Zeolyst Joint Venture’s sales in this presentation represents 50% of the sales of the Zeolyst Joint Venture. We do not record sales by the Zeolyst Joint Venture as revenue and such sales are not consolidated within our results of operations. However, our adjusted EBITDA reflects our share of the earnings of the Zeolyst Joint Venture that have been recorded as equity in net income from affiliated companies in our consolidated statements of income for such periods and includes Zeolyst Joint Venture adjustments on a proportionate basis based on our 50% ownership interest. Accordingly, our adjusted EBITDA margins are calculated including 50% of the sales of the Zeolyst Joint Venture for the relevant periods in the denominator. 2

PQ: ACCELERATING TRANSFORMATION TO UNLOCK VALUE Strong Record of Operating/Commercial Execution 1. Premium Portfolio with Strategic Transformation Under Way 2. Innovating to Drive Sustainability Solutions 3. Strong Cash Generation and Expanded Capital Allocation 4. Multiple Metrics Point to PQ as Compelling Investment 5. 3PQ: ACCELERATING TRANSFORMATION TO UNLOCK VALUE Strong Record of Operating/Commercial Execution 1. Premium Portfolio with Strategic Transformation Under Way 2. Innovating to Drive Sustainability Solutions 3. Strong Cash Generation and Expanded Capital Allocation 4. Multiple Metrics Point to PQ as Compelling Investment 5. 3

PQ’S SIMPLER + STRONGER STRATEGY EVALUATION – 2018 SIMPLIFICATION – 2019 TRANSFORMATION – 2020 PATHWAY GOALS Delayered and reorganized into Enhance growth rate four distinct businesses Achieve higher and sustainable Optimized the performance and Adjusted EBITDA margins positioning of our businesses, including cash Maintain strong cash conversion Reduced capital intensity Balance debt reduction with return of cash to shareholders Continued active portfolio management 4 4PQ’S SIMPLER + STRONGER STRATEGY EVALUATION – 2018 SIMPLIFICATION – 2019 TRANSFORMATION – 2020 PATHWAY GOALS Delayered and reorganized into Enhance growth rate four distinct businesses Achieve higher and sustainable Optimized the performance and Adjusted EBITDA margins positioning of our businesses, including cash Maintain strong cash conversion Reduced capital intensity Balance debt reduction with return of cash to shareholders Continued active portfolio management 4 4

PORTFOLIO SHIFTS TO HIGHER GROWTH AND MARGINS TARGET PQ: Catalysts / Refining Services CURRENT PQ: Catalysts / Refining Services / 2017–2019 Performance Chemicals Financial Performance LEGACY PQ: Catalysts / Refining Services / Performance Chemicals / Performance Materials 7% SALES CAGR 100% 8% ADJUSTED EBITDA CAGR Organic 39% AVG ADJUSTED EBITDA MARGIN % of Sales SALES CAGR 3% 1 by End Use ADJUSTED EBITDA CAGR 3% 26% Fuels & Emission Controls AVG ADJUSTED EBITDA MARGIN 32% Packaging & 54% Engineered Plastics 11% Industrial & Process Chemicals 9% Natural Resources SALES CAGR 4% ADJUSTED EBITDA CAGR 3% (1) Based on 2019 sales, which includes proportionate 50% share of sales from Zeolyst Joint Venture AVG ADJUSTED EBITDA MARGIN 29% Note: 2017 to 2019 Financial Performance: Sales CAGR includes 50% interest in Zeolyst JV; Adjusted EBITDA CAGR excludes corporate expenses, includes 50% interest in Zeolyst JV; Adjusted EBITDA margin excludes corporate expenses, includes 50% interest in sales of Zeolyst JV See Appendix for Reconciliations of non-GAAP measures 5PORTFOLIO SHIFTS TO HIGHER GROWTH AND MARGINS TARGET PQ: Catalysts / Refining Services CURRENT PQ: Catalysts / Refining Services / 2017–2019 Performance Chemicals Financial Performance LEGACY PQ: Catalysts / Refining Services / Performance Chemicals / Performance Materials 7% SALES CAGR 100% 8% ADJUSTED EBITDA CAGR Organic 39% AVG ADJUSTED EBITDA MARGIN % of Sales SALES CAGR 3% 1 by End Use ADJUSTED EBITDA CAGR 3% 26% Fuels & Emission Controls AVG ADJUSTED EBITDA MARGIN 32% Packaging & 54% Engineered Plastics 11% Industrial & Process Chemicals 9% Natural Resources SALES CAGR 4% ADJUSTED EBITDA CAGR 3% (1) Based on 2019 sales, which includes proportionate 50% share of sales from Zeolyst Joint Venture AVG ADJUSTED EBITDA MARGIN 29% Note: 2017 to 2019 Financial Performance: Sales CAGR includes 50% interest in Zeolyst JV; Adjusted EBITDA CAGR excludes corporate expenses, includes 50% interest in Zeolyst JV; Adjusted EBITDA margin excludes corporate expenses, includes 50% interest in sales of Zeolyst JV See Appendix for Reconciliations of non-GAAP measures 5

CATALYSTS: ESSENTIAL FOR A SUSTAINABLE FUTURE Competitive Strengths Attractive Growth & Margins Growth Drivers Sales o PQ silica-based catalyst o ~80% of polyethylene technology improves capacity expansions specify strength-to-weight ratio of silica-based catalyst 170 HDPE and LLDPE technology 86 63 45 o Broader global adoption of 2009 2019 o R&D pipeline focused Silica Catalyst Zeolyst JV fuel emission standards on plastic recycling drive hydrocracking capacity Adj. EBITDA investments o Zeolyst JV zeolite-based Average technology reduces 2 Margin o Tightening vehicle emission 108 ~ 38% emissions from refineries standards for improved air 39 and vehicles quality 2009 2019 (1) Sales CAGR reflects the growth of combined sales (Silica Catalysts plus proportionate 50% share of sales from Zeolyst Joint venture) (2) Adjusted EBITDA margin calculation includes proportionate 50% share of sales from Zeolyst Joint venture 6CATALYSTS: ESSENTIAL FOR A SUSTAINABLE FUTURE Competitive Strengths Attractive Growth & Margins Growth Drivers Sales o PQ silica-based catalyst o ~80% of polyethylene technology improves capacity expansions specify strength-to-weight ratio of silica-based catalyst 170 HDPE and LLDPE technology 86 63 45 o Broader global adoption of 2009 2019 o R&D pipeline focused Silica Catalyst Zeolyst JV fuel emission standards on plastic recycling drive hydrocracking capacity Adj. EBITDA investments o Zeolyst JV zeolite-based Average technology reduces 2 Margin o Tightening vehicle emission 108 ~ 38% emissions from refineries standards for improved air 39 and vehicles quality 2009 2019 (1) Sales CAGR reflects the growth of combined sales (Silica Catalysts plus proportionate 50% share of sales from Zeolyst Joint venture) (2) Adjusted EBITDA margin calculation includes proportionate 50% share of sales from Zeolyst Joint venture 6

REFINING SERVICES: CRITICAL FOR SUSTAINABLE FUEL PRODUCTION Competitive Strengths Attractive Growth & Margins Growth Drivers Sales o Largest regeneration o Rising North American network for recycling of alkylate unit production for sulfuric acid catalyst in higher octane gasoline U.S. Gulf and West Coast 447 294 o Virgin acid demand from o 5 to 10 year contracts with a diverse set of growing 2009 2019 high cost pass-through industrial end uses Adj. EBITDA o Diversification of customer o Increasing opportunities Average 176 base with virgin acid sales Margin to further integrate with 97 into broader industrial ~ 32% refinery operations applications 2009 2019 7REFINING SERVICES: CRITICAL FOR SUSTAINABLE FUEL PRODUCTION Competitive Strengths Attractive Growth & Margins Growth Drivers Sales o Largest regeneration o Rising North American network for recycling of alkylate unit production for sulfuric acid catalyst in higher octane gasoline U.S. Gulf and West Coast 447 294 o Virgin acid demand from o 5 to 10 year contracts with a diverse set of growing 2009 2019 high cost pass-through industrial end uses Adj. EBITDA o Diversification of customer o Increasing opportunities Average 176 base with virgin acid sales Margin to further integrate with 97 into broader industrial ~ 32% refinery operations applications 2009 2019 7

“TARGET PQ” PORTFOLIO POSITIONED TO SERVE TWO KEY LONG-TERM SUSTAINABLE TRENDS ~80% of innovation projects within Target PQ have links to sustainability Trusted supply and technical support for customers Innovation and collaboration to help our customers define a sustainable future Operating and supply partner at every step of the journey REFINING SERVICES CATALYSTS Largest North America recycler of spentsulfuric Remove sulfur from diesel fuel for landand acid, avoiding 1.5 million tons of landfill or deep marine transportation well disposal annually Provide active component for > 90% reduction One of the largest consumers of refinery by- of NOx emissions from diesel engines product sulfur, converting for other applications Improve fuel economy by reducing friction World class low SO₂ emissions enabled by improved lubricants CIRCULAR PLASTICS ECONOMY Lightweighting, Strengthening & Recycling CLEAN ENERGY TRANSITION Evolving Fuels, Emission Reductions & Energy Storage Recyclability Efficient Energy Usage Emissions 8“TARGET PQ” PORTFOLIO POSITIONED TO SERVE TWO KEY LONG-TERM SUSTAINABLE TRENDS ~80% of innovation projects within Target PQ have links to sustainability Trusted supply and technical support for customers Innovation and collaboration to help our customers define a sustainable future Operating and supply partner at every step of the journey REFINING SERVICES CATALYSTS Largest North America recycler of spentsulfuric Remove sulfur from diesel fuel for landand acid, avoiding 1.5 million tons of landfill or deep marine transportation well disposal annually Provide active component for > 90% reduction One of the largest consumers of refinery by- of NOx emissions from diesel engines product sulfur, converting for other applications Improve fuel economy by reducing friction World class low SO₂ emissions enabled by improved lubricants CIRCULAR PLASTICS ECONOMY Lightweighting, Strengthening & Recycling CLEAN ENERGY TRANSITION Evolving Fuels, Emission Reductions & Energy Storage Recyclability Efficient Energy Usage Emissions 8

CAPITAL ALLOCATION PRIORITIES TO INCLUDE SPECIAL DIVIDENDS CONSISTENT TRANSACTION AND CASH ADJUSTED FREE CASH FLOW GENERATION PROVIDE USE SIGNIFICANT 2 DEBT REDUCTION… GENERATION … OF PROCEEDS FLEXIBILITY… ($ in millions) ($ in millions) 2,703 Expect to reduce debt 166 by ~$460 million 155 145 Targeting special 134 dividend of up to 1,956 $250 million, or $1.84 per share, subject to board 1,433 approval and declaration Will consider opportunistic dividends going forward 9/30/2017 9/30/2020 9/30/2020 2018 2019 2020 Pre-IPO Actual Pro Forma (1) Actual Actual Guidance Range (1) Pro forma gives effect to divestiture of Performance Materials and expected use of proceeds to reduce debt (2) See Appendix for Reconciliations of non-GAAP measures 9CAPITAL ALLOCATION PRIORITIES TO INCLUDE SPECIAL DIVIDENDS CONSISTENT TRANSACTION AND CASH ADJUSTED FREE CASH FLOW GENERATION PROVIDE USE SIGNIFICANT 2 DEBT REDUCTION… GENERATION … OF PROCEEDS FLEXIBILITY… ($ in millions) ($ in millions) 2,703 Expect to reduce debt 166 by ~$460 million 155 145 Targeting special 134 dividend of up to 1,956 $250 million, or $1.84 per share, subject to board 1,433 approval and declaration Will consider opportunistic dividends going forward 9/30/2017 9/30/2020 9/30/2020 2018 2019 2020 Pre-IPO Actual Pro Forma (1) Actual Actual Guidance Range (1) Pro forma gives effect to divestiture of Performance Materials and expected use of proceeds to reduce debt (2) See Appendix for Reconciliations of non-GAAP measures 9

PQ UNDERVALUED VS SPECIALTY CHEMICAL PEERS Cash Conversion Adj EBITDA Margin 1,2 1 ’19A ’19A 94.0% 30.7% 29.3% 85.7% 27.3% 73.1% Median: 71.2% 71.1% Median: 66.2% 22.7% 71.2% 21.2% 22.7% 14.9% PQ ASH ESI FUL GRA NGVT PQ ASH ESI FUL GRA NGVT FCF Yield Adj EBITDA Multiple 1,3 ’19A FCF / Market Cap TEV / ’21E EBITDA 10.4x 10.2x Median: 10.0x 8.5% 10.0x 8.2% 8.8x 8.7x 7.5x Median: 6.8% 6.6% 6.6% 4.9% 2.3% (4) (4) PQ ASH ESI FUL GRA NGVT PQ ASH ESI FUL GRA NGVT Source: Morgan Stanley, CapIQ consensus as of November 6, 2020 Notes: PQ and Peers are not adjusted for M&A (1) PQ includes 50% proportional share of Zeolyst Joint equity earnings (2) Cash Conversion defined as (Adj EBITDA – Capex) / Adj EBITDA (3) Free Cash Flow calculated as Cash Flow from Operations – Capex 10 (4) Excludes 40 North Management proposed acquisition announced on 11/9/20 for $60 per share which implies 5.0% FCF yield and 10.7x TEV/EBITDA multiple Valuation MetricsPQ UNDERVALUED VS SPECIALTY CHEMICAL PEERS Cash Conversion Adj EBITDA Margin 1,2 1 ’19A ’19A 94.0% 30.7% 29.3% 85.7% 27.3% 73.1% Median: 71.2% 71.1% Median: 66.2% 22.7% 71.2% 21.2% 22.7% 14.9% PQ ASH ESI FUL GRA NGVT PQ ASH ESI FUL GRA NGVT FCF Yield Adj EBITDA Multiple 1,3 ’19A FCF / Market Cap TEV / ’21E EBITDA 10.4x 10.2x Median: 10.0x 8.5% 10.0x 8.2% 8.8x 8.7x 7.5x Median: 6.8% 6.6% 6.6% 4.9% 2.3% (4) (4) PQ ASH ESI FUL GRA NGVT PQ ASH ESI FUL GRA NGVT Source: Morgan Stanley, CapIQ consensus as of November 6, 2020 Notes: PQ and Peers are not adjusted for M&A (1) PQ includes 50% proportional share of Zeolyst Joint equity earnings (2) Cash Conversion defined as (Adj EBITDA – Capex) / Adj EBITDA (3) Free Cash Flow calculated as Cash Flow from Operations – Capex 10 (4) Excludes 40 North Management proposed acquisition announced on 11/9/20 for $60 per share which implies 5.0% FCF yield and 10.7x TEV/EBITDA multiple Valuation Metrics

TRANSFORMING POTENTIAL, COMPELLING INVESTMENT Transforming portfolio to target KEY PRIORITIES higher margins and higher growth potential FOR PORTFOLIO TRANFORMATION: Favorable long-term secular demand drivers oUnlock value of Innovative culture and excellent customer businesses relationships/positioning oDrive higher Sustainable products and services for customer growth with solutions higher margins Track record of strong free cash flows oRedeploy capital to higher returns 11TRANSFORMING POTENTIAL, COMPELLING INVESTMENT Transforming portfolio to target KEY PRIORITIES higher margins and higher growth potential FOR PORTFOLIO TRANFORMATION: Favorable long-term secular demand drivers oUnlock value of Innovative culture and excellent customer businesses relationships/positioning oDrive higher Sustainable products and services for customer growth with solutions higher margins Track record of strong free cash flows oRedeploy capital to higher returns 11

SUPPLEMENTAL INFORMATION 12SUPPLEMENTAL INFORMATION 12

NEXT PORTFOLIO FOCUS: PERFORMANCE CHEMICALS PERFORMANCE CHEMICALS KEY Diverse Consumer Product and CUSTOMERS Industrial Product manufacturers COMPETITIVE STRENGTHS GROWTH DRIVERS o Technology leader in silica-based materials o $10 to $15 million Adjusted EBITDA annualized improvement (process and product application) from ongoing operational transformation by late 2021 o Largest global sodium silicates supplier, o Demand increase from industrial recovery at least 2x larger than nearest competitor in 2021/2022 o 50+ year customer relationships o Positioned to capture more high margin sales o M&A opportunities for adjacencies and vertical integration Simplifies the portfolio Allows capital to be allocated to higher growth businesses Sharpens focus on dynamic polymer and refining industries Note: Estimated Performance Chemicals tax basis of ~$400 million 13NEXT PORTFOLIO FOCUS: PERFORMANCE CHEMICALS PERFORMANCE CHEMICALS KEY Diverse Consumer Product and CUSTOMERS Industrial Product manufacturers COMPETITIVE STRENGTHS GROWTH DRIVERS o Technology leader in silica-based materials o $10 to $15 million Adjusted EBITDA annualized improvement (process and product application) from ongoing operational transformation by late 2021 o Largest global sodium silicates supplier, o Demand increase from industrial recovery at least 2x larger than nearest competitor in 2021/2022 o 50+ year customer relationships o Positioned to capture more high margin sales o M&A opportunities for adjacencies and vertical integration Simplifies the portfolio Allows capital to be allocated to higher growth businesses Sharpens focus on dynamic polymer and refining industries Note: Estimated Performance Chemicals tax basis of ~$400 million 13

2020 FINANCIAL GUIDANCE 2020 2020 2019 Outlook including From Continuing ($ in millions, Actual Performance Materials Operations except per share) 1 Sales 1,567.1 1,430 – 1,460 1,080 – 1,100 Adjusted EBITDA 474.3 410 – 425 330 – 345 2 3 3 Adjusted Free Cash Flow 166.2 145 – 155 95 – 105 Capital Expenditures 127.6 95 – 105 80 - 90 Maintained full year 2020 outlook on solid year to date results with margins of ~27% Introduced full year 2020 outlook for continuing operations: o Higher Adjusted EBITDA margin ~28% oPro forma leverage projected to be ~4x at December 31, 2020 Sale proceeds and cash generation for debt reduction and special dividend (1) GAAP sales only; Excludes proportionate 50% share of Zeolyst Joint Venture sales target of $120 to $130 million versus $170 million in 2019 (2) Adjusted free cash flow defined as net cash provided by operating activities less purchases of property, plant and equipment, adjusted for proceeds from sale of assets and net interest proceeds on swaps designated as net investment hedges (3) Excludes $18 million in cash proceeds from the sale of a non-core product line sale on July 1, 2020 in Performance Chemicals Note: Guidance as of Third Quarter Earnings call held on October 30, 2020 142020 FINANCIAL GUIDANCE 2020 2020 2019 Outlook including From Continuing ($ in millions, Actual Performance Materials Operations except per share) 1 Sales 1,567.1 1,430 – 1,460 1,080 – 1,100 Adjusted EBITDA 474.3 410 – 425 330 – 345 2 3 3 Adjusted Free Cash Flow 166.2 145 – 155 95 – 105 Capital Expenditures 127.6 95 – 105 80 - 90 Maintained full year 2020 outlook on solid year to date results with margins of ~27% Introduced full year 2020 outlook for continuing operations: o Higher Adjusted EBITDA margin ~28% oPro forma leverage projected to be ~4x at December 31, 2020 Sale proceeds and cash generation for debt reduction and special dividend (1) GAAP sales only; Excludes proportionate 50% share of Zeolyst Joint Venture sales target of $120 to $130 million versus $170 million in 2019 (2) Adjusted free cash flow defined as net cash provided by operating activities less purchases of property, plant and equipment, adjusted for proceeds from sale of assets and net interest proceeds on swaps designated as net investment hedges (3) Excludes $18 million in cash proceeds from the sale of a non-core product line sale on July 1, 2020 in Performance Chemicals Note: Guidance as of Third Quarter Earnings call held on October 30, 2020 14

ANNUAL SEGMENT SALES, ADJUSTED EBITDA AND MARGINS Year Ended For the Quarter Ended December 31, ($ in millions except %, unaudited) 2019 2018 2017 Sales: 447.1 455.6 398.4 Refining Services 85.7 72.1 75.3 Silica Catalysts 363.0 378.3 324.2 Performance Materials 685.1 717.3 687.6 Performance Chemicals (13.8) (15.1) (13.4) Eliminations 1,567.1 1,608.2 1,472.1 Total sales 170.3 156.7 143.8 Zeolyst joint venture sales Adjusted EBITDA: 175.6 176.5 154.2 Refining Services 107.8 81.1 89.4 Catalysts Performance Materials 76.7 72.5 69.7 154.3 170.9 170.5 Performance Chemicals 514.4 501.0 483.8 Total Segment Adjusted EBITDA (40.1) (37.0) (30.5) Corporate 474.3 464.0 453.3 Total Adjusted EBITDA Adjusted EBITDA Margin: 39.3% 38.7% 38.7% Refining Services 1 42.1% 35.4% 40.8% Catalysts 21.1% 19.2% 21.5% Performance Materials 23.8% 24.8% Performance Chemicals 22.5% 1 27.3% 26.3% 28.1% Total Adjusted EBITDA Margin (1) Adjusted EBITDA margin includes 50% interest of sales in Zeolyst JV 15ANNUAL SEGMENT SALES, ADJUSTED EBITDA AND MARGINS Year Ended For the Quarter Ended December 31, ($ in millions except %, unaudited) 2019 2018 2017 Sales: 447.1 455.6 398.4 Refining Services 85.7 72.1 75.3 Silica Catalysts 363.0 378.3 324.2 Performance Materials 685.1 717.3 687.6 Performance Chemicals (13.8) (15.1) (13.4) Eliminations 1,567.1 1,608.2 1,472.1 Total sales 170.3 156.7 143.8 Zeolyst joint venture sales Adjusted EBITDA: 175.6 176.5 154.2 Refining Services 107.8 81.1 89.4 Catalysts Performance Materials 76.7 72.5 69.7 154.3 170.9 170.5 Performance Chemicals 514.4 501.0 483.8 Total Segment Adjusted EBITDA (40.1) (37.0) (30.5) Corporate 474.3 464.0 453.3 Total Adjusted EBITDA Adjusted EBITDA Margin: 39.3% 38.7% 38.7% Refining Services 1 42.1% 35.4% 40.8% Catalysts 21.1% 19.2% 21.5% Performance Materials 23.8% 24.8% Performance Chemicals 22.5% 1 27.3% 26.3% 28.1% Total Adjusted EBITDA Margin (1) Adjusted EBITDA margin includes 50% interest of sales in Zeolyst JV 15

RECONCILIATION FOR ADJUSTED FREE CASH FLOW Full Year Full Year Full Year ($ in millions) 2019 2018 2017 Cash Flow from Operations before interest 401.9 377.5 364.5 and tax Less: Cash paid for taxes 17.4 23.8 29.2 1 Cash paid for interest 116.8 105.1 170.1 Cash Flow from Operations 267.7 248.6 165.2 Less: Purchases of property, plant and 127.6 131.7 140.5 2 equipment Free Cash Flow 140.1 116.9 24.7 Plus: Proceeds from sale of assets 17.6 12.4 - Plus: Net interest proceeds on currency 8.5 4.9 - swaps Adjusted Free Cash Flow 166.2 134.2 24.7 (1) Excludes net interest proceeds on currency swaps designated as net investment hedges (2) Excludes 50% interest of capital expenditures in the Zeolyst JV 16RECONCILIATION FOR ADJUSTED FREE CASH FLOW Full Year Full Year Full Year ($ in millions) 2019 2018 2017 Cash Flow from Operations before interest 401.9 377.5 364.5 and tax Less: Cash paid for taxes 17.4 23.8 29.2 1 Cash paid for interest 116.8 105.1 170.1 Cash Flow from Operations 267.7 248.6 165.2 Less: Purchases of property, plant and 127.6 131.7 140.5 2 equipment Free Cash Flow 140.1 116.9 24.7 Plus: Proceeds from sale of assets 17.6 12.4 - Plus: Net interest proceeds on currency 8.5 4.9 - swaps Adjusted Free Cash Flow 166.2 134.2 24.7 (1) Excludes net interest proceeds on currency swaps designated as net investment hedges (2) Excludes 50% interest of capital expenditures in the Zeolyst JV 16
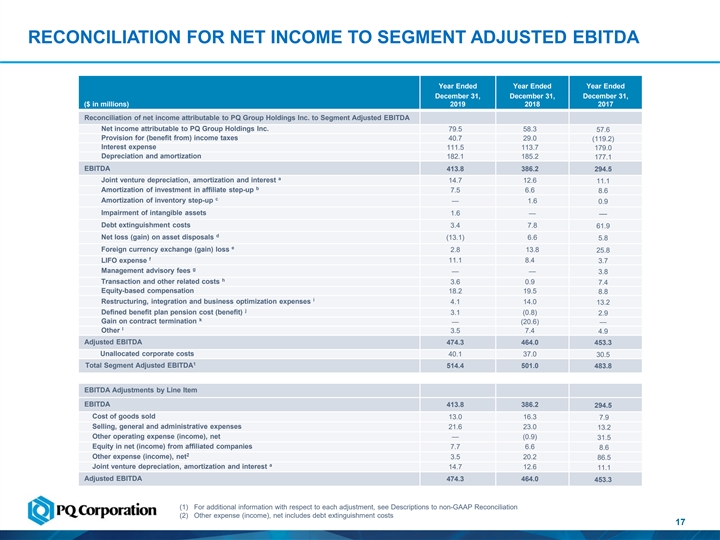
RECONCILIATION FOR NET INCOME TO SEGMENT ADJUSTED EBITDA Year Ended Year Ended Year Ended December 31, December 31, December 31, ($ in millions) 2019 2018 2017 Reconciliation of net income attributable to PQ Group Holdings Inc. to Segment Adjusted EBITDA Net income attributable to PQ Group Holdings Inc. 79.5 58.3 57.6 Provision for (benefit from) income taxes 40.7 29.0 (119.2) Interest expense 111.5 113.7 179.0 Depreciation and amortization 182.1 185.2 177.1 EBITDA 413.8 386.2 294.5 a Joint venture depreciation, amortization and interest 14.7 12.6 11.1 b Amortization of investment in affiliate step-up 7.5 6.6 8.6 c Amortization of inventory step-up — 1.6 0.9 Impairment of intangible assets 1.6 — — Debt extinguishment costs 3.4 7.8 61.9 d Net loss (gain) on asset disposals (13.1) 6.6 5.8 e Foreign currency exchange (gain) loss 2.8 13.8 25.8 f LIFO expense 11.1 8.4 3.7 g Management advisory fees — — 3.8 h Transaction and other related costs 3.6 0.9 7.4 Equity-based compensation 18.2 19.5 8.8 i Restructuring, integration and business optimization expenses 4.1 14.0 13.2 j Defined benefit plan pension cost (benefit) 3.1 (0.8) 2.9 k Gain on contract termination — (20.6) — l Other 3.5 7.4 4.9 Adjusted EBITDA 474.3 464.0 453.3 Unallocated corporate costs 40.1 37.0 30.5 1 Total Segment Adjusted EBITDA 514.4 501.0 483.8 EBITDA Adjustments by Line Item EBITDA 413.8 386.2 294.5 Cost of goods sold 13.0 16.3 7.9 Selling, general and administrative expenses 21.6 23.0 13.2 Other operating expense (income), net — (0.9) 31.5 Equity in net (income) from affiliated companies 7.7 6.6 8.6 2 Other expense (income), net 3.5 20.2 86.5 a Joint venture depreciation, amortization and interest 14.7 12.6 11.1 Adjusted EBITDA 474.3 464.0 453.3 (1) For additional information with respect to each adjustment, see Descriptions to non-GAAP Reconciliation (2) Other expense (income), net includes debt extinguishment costs 17RECONCILIATION FOR NET INCOME TO SEGMENT ADJUSTED EBITDA Year Ended Year Ended Year Ended December 31, December 31, December 31, ($ in millions) 2019 2018 2017 Reconciliation of net income attributable to PQ Group Holdings Inc. to Segment Adjusted EBITDA Net income attributable to PQ Group Holdings Inc. 79.5 58.3 57.6 Provision for (benefit from) income taxes 40.7 29.0 (119.2) Interest expense 111.5 113.7 179.0 Depreciation and amortization 182.1 185.2 177.1 EBITDA 413.8 386.2 294.5 a Joint venture depreciation, amortization and interest 14.7 12.6 11.1 b Amortization of investment in affiliate step-up 7.5 6.6 8.6 c Amortization of inventory step-up — 1.6 0.9 Impairment of intangible assets 1.6 — — Debt extinguishment costs 3.4 7.8 61.9 d Net loss (gain) on asset disposals (13.1) 6.6 5.8 e Foreign currency exchange (gain) loss 2.8 13.8 25.8 f LIFO expense 11.1 8.4 3.7 g Management advisory fees — — 3.8 h Transaction and other related costs 3.6 0.9 7.4 Equity-based compensation 18.2 19.5 8.8 i Restructuring, integration and business optimization expenses 4.1 14.0 13.2 j Defined benefit plan pension cost (benefit) 3.1 (0.8) 2.9 k Gain on contract termination — (20.6) — l Other 3.5 7.4 4.9 Adjusted EBITDA 474.3 464.0 453.3 Unallocated corporate costs 40.1 37.0 30.5 1 Total Segment Adjusted EBITDA 514.4 501.0 483.8 EBITDA Adjustments by Line Item EBITDA 413.8 386.2 294.5 Cost of goods sold 13.0 16.3 7.9 Selling, general and administrative expenses 21.6 23.0 13.2 Other operating expense (income), net — (0.9) 31.5 Equity in net (income) from affiliated companies 7.7 6.6 8.6 2 Other expense (income), net 3.5 20.2 86.5 a Joint venture depreciation, amortization and interest 14.7 12.6 11.1 Adjusted EBITDA 474.3 464.0 453.3 (1) For additional information with respect to each adjustment, see Descriptions to non-GAAP Reconciliation (2) Other expense (income), net includes debt extinguishment costs 17

DESCRIPTIONS TO NON-GAAP RECONCILIATION a) We use Adjusted EBITDA as a performance measure to evaluate our financial results. Because our Catalysts segment includes our 50% interest in the Zeolyst Joint Venture, we include an adjustment for our 50% proportionate share of depreciation, amortization and interest expense of the Zeolyst Joint Venture. b) Represents the amortization of the fair value adjustments associated with the equity affiliate investment in the Zeolyst Joint Venture as a result of the combination of the businesses of PQ Holdings Inc. and Eco Services Operations LLC in May 2016 (the “Business Combination”). We determined the fair value of the equity affiliate investment and the fair value step-up was then attributed to the underlying assets of the Zeolyst Joint Venture. Amortization is primarily related to the fair value adjustments associated with inventory, fixed assets and intangible assets, including customer relationships and technical know-how. c) As a result of the Sovitec acquisition and the Business Combination, there was a step-up in the fair value of inventory, which is amortized through cost of goods sold in the statements of income. d) When asset disposals occur, we remove the impact of net gain/loss of the disposed asset because such impact primarily reflects the non-cash write-off of long-lived assets no longer in use. During the year ended December 31, 2019, the net gain on asset disposals includes the gains related to the sale of a non-core product line and sale of property. e) Reflects the exclusion of the foreign currency transaction gains and losses in the statements of income primarily related to the non-permanent intercompany debt denominated in local currency translated to U.S. dollars and, during 2018 and 2017, the Euro-denominated term loan (which was settled as part of the February 2018 term loan refinancing). f) Represents non-cash adjustments to the Company’s LIFO reserves for certain inventories in the U.S. that are valued using the LIFO method, which we believe provides a means of comparison to other companies that may not use the same basis of accounting for inventories. g) Reflects consulting fees paid to CCMP and affiliates of INEOS for consulting services that include certain financial advisory and management services. These consulting agreements were terminated upon completion of our initial public offering (“IPO”) on October 3, 2017. h) Represents the costs related to several transactions that are completed, pending or abandoned and that we believe are not representative of our ongoing business operations. i) Includes the impact of restructuring, integration and business optimization expenses which are incremental costs that are not representative of our ongoing business operations. j) Represents adjustments for defined benefit pension plan costs in our statements of income. More than two-thirds of our defined benefit pension plan obligations are under defined benefit pension plans that are frozen, and the remaining obligations primarily relate to plans operated in certain of our non-U.S. locations that, pursuant to jurisdictional requirements, cannot be frozen. As such, we do not view such expenses as core to our ongoing business operations. k) Represents a non-cash gain on the write-off of the remaining liability under a contractual supply arrangement. As part of the acquisition by Eco Services Operations LLC of substantially all of the assets of Solvay USA Inc.’s sulfuric acid refining business unit on December 1, 2014, we recognized a liability as part of business combination accounting related to our obligation to serve a customer under a pre-existing unfavorable supply agreement. In December 2018, the customer who was party to the agreement closed its facility, and as a result, we were relieved from our obligation to continue to supply the customer on the below market contract. Because the fair value of the unfavorable contract liability was recognized as part of the application of business combination accounting, and since the write-off of the remaining liability was non-cash in nature, we believe this gain is a special item that is not representative of our ongoing business operations. l) Other costs consist of certain expenses that are not core to our ongoing business operations, including environmental remediation-related costs associated with the legacy operations of our business prior to the Business Combination, capital and franchise taxes, non-cash asset retirement obligation accretion and the initial implementation of procedures to comply with Section 404 of the Sarbanes-Oxley Act. Included in this line-item are rounding discrepancies that may arise from rounding from dollars (in thousands) to dollars (in millions). 18DESCRIPTIONS TO NON-GAAP RECONCILIATION a) We use Adjusted EBITDA as a performance measure to evaluate our financial results. Because our Catalysts segment includes our 50% interest in the Zeolyst Joint Venture, we include an adjustment for our 50% proportionate share of depreciation, amortization and interest expense of the Zeolyst Joint Venture. b) Represents the amortization of the fair value adjustments associated with the equity affiliate investment in the Zeolyst Joint Venture as a result of the combination of the businesses of PQ Holdings Inc. and Eco Services Operations LLC in May 2016 (the “Business Combination”). We determined the fair value of the equity affiliate investment and the fair value step-up was then attributed to the underlying assets of the Zeolyst Joint Venture. Amortization is primarily related to the fair value adjustments associated with inventory, fixed assets and intangible assets, including customer relationships and technical know-how. c) As a result of the Sovitec acquisition and the Business Combination, there was a step-up in the fair value of inventory, which is amortized through cost of goods sold in the statements of income. d) When asset disposals occur, we remove the impact of net gain/loss of the disposed asset because such impact primarily reflects the non-cash write-off of long-lived assets no longer in use. During the year ended December 31, 2019, the net gain on asset disposals includes the gains related to the sale of a non-core product line and sale of property. e) Reflects the exclusion of the foreign currency transaction gains and losses in the statements of income primarily related to the non-permanent intercompany debt denominated in local currency translated to U.S. dollars and, during 2018 and 2017, the Euro-denominated term loan (which was settled as part of the February 2018 term loan refinancing). f) Represents non-cash adjustments to the Company’s LIFO reserves for certain inventories in the U.S. that are valued using the LIFO method, which we believe provides a means of comparison to other companies that may not use the same basis of accounting for inventories. g) Reflects consulting fees paid to CCMP and affiliates of INEOS for consulting services that include certain financial advisory and management services. These consulting agreements were terminated upon completion of our initial public offering (“IPO”) on October 3, 2017. h) Represents the costs related to several transactions that are completed, pending or abandoned and that we believe are not representative of our ongoing business operations. i) Includes the impact of restructuring, integration and business optimization expenses which are incremental costs that are not representative of our ongoing business operations. j) Represents adjustments for defined benefit pension plan costs in our statements of income. More than two-thirds of our defined benefit pension plan obligations are under defined benefit pension plans that are frozen, and the remaining obligations primarily relate to plans operated in certain of our non-U.S. locations that, pursuant to jurisdictional requirements, cannot be frozen. As such, we do not view such expenses as core to our ongoing business operations. k) Represents a non-cash gain on the write-off of the remaining liability under a contractual supply arrangement. As part of the acquisition by Eco Services Operations LLC of substantially all of the assets of Solvay USA Inc.’s sulfuric acid refining business unit on December 1, 2014, we recognized a liability as part of business combination accounting related to our obligation to serve a customer under a pre-existing unfavorable supply agreement. In December 2018, the customer who was party to the agreement closed its facility, and as a result, we were relieved from our obligation to continue to supply the customer on the below market contract. Because the fair value of the unfavorable contract liability was recognized as part of the application of business combination accounting, and since the write-off of the remaining liability was non-cash in nature, we believe this gain is a special item that is not representative of our ongoing business operations. l) Other costs consist of certain expenses that are not core to our ongoing business operations, including environmental remediation-related costs associated with the legacy operations of our business prior to the Business Combination, capital and franchise taxes, non-cash asset retirement obligation accretion and the initial implementation of procedures to comply with Section 404 of the Sarbanes-Oxley Act. Included in this line-item are rounding discrepancies that may arise from rounding from dollars (in thousands) to dollars (in millions). 18

1919