Form 8-K SOUTH STATE Corp For: Oct 29
Exhibit 99.1

For Immediate ReleaseMedia Contact: Jackie Smith (803) 231-3486
South State Corporation Reports Third Quarter 2020 Results
And Declares Quarterly Cash Dividend
WINTER HAVEN, FL—October 29, 2020—South State Corporation (NASDAQ: SSB) today released its unaudited results of operations and other financial information for the three-month and nine-month period ended September 30, 2020.
The Company reported consolidated net income of $1.34 per diluted common share for the three months ended September 30, 2020, compared to net loss of ($1.96) per diluted common share for the three months ended June 30, 2020, and compared to $1.50 per diluted common share one year ago. Contributing to the net loss in the second quarter of 2020 was the initial provision for credit losses (“PCL”) recorded on acquired non-purchase credit deteriorated (“NonPCD”) loans and unfunded commitments (“UFC”) which totaled $119.1 million, pre-tax, and merger-related costs of $40.3 million, pre-tax related to the June 7, 2020 merger with CenterState Bank Corporation (“CSFL”).
Adjusted net income (non-GAAP) totaled $1.58 per diluted share for the three months ended September 30, 2020, compared to $0.89 per diluted share, in the second quarter of 2020, and compared to $1.49 per diluted share in the year ago period. Adjusted net income in the third quarter of 2020 removes $17.4 million of merger-related costs, after-tax; and in the second quarter of 2020 removed two primary adjustments: (1) the initial PCL on NonPCD loans and UFC of $92.2 million, after-tax, and (2) merger-related costs of $31.2 million, after-tax.
Highlights of the third quarter included:
| ● | Return on Average Equity of 8.3%. |
| ● | Return on Average Tangible Common Equity of 14.7% (Non-GAAP); Adjusted Return on Average Tangible Common Equity of 17.1% (Non-GAAP). |
| ● | Return on Average Assets (“ROAA”) of 1.00%, and Adjusted ROAA of 1.18% (Non-GAAP). |
| ● | Third quarter of 2020 Pre-Provision Net Revenue (“PPNR ”) was $170 million, or 1.79% PPNR ROAA. This compares to the second quarter of 2020, where on a combined historical basis (as if the companies had been merged for the full quarter, Non-GAAP), PPNR of $157 million, or 1.68% PPNR ROAA. The second quarter’s results only include the operations of CSFL for the final 23 days of the quarter. |
| ● | Book value per share of $64.34 increased by $0.99 per share from 2Q 2020. |
| ● | Tangible book value (“TBV”) per share of $39.83, up $1.50 from 2Q 2020 (Non-GAAP). |
| ● | Record quarterly revenue of $385 million (compared to actual prior period and combined historical basis). |
| ● | Net interest margin, declined by 2 basis points to 3.22% during 3Q 2020 from 2Q 2020. |
| ● | Significant allowance for credit losses and credit marks on the balance sheet representing 2.58% of total loans (excluding PPP loans). |
| ● | Net charge-offs of $594,000, or 0.01% annualized. |
| ● | As of 10/23/2020, loan deferrals totaled $452.4million, or 1.98% of the total loan portfolio, excluding PPP loans and held for sale loans. |
“After closing our merger late in the second quarter, we are pleased with our first full quarter of operations as a combined company”, said John C. Corbett, Chief Executive Officer. “Our fee businesses continue to perform well, leading us to another record quarter of revenue. While the current environment includes challenges and uncertainties, we look forward to the future with great optimism.”
Robert R. Hill, Jr., Executive Chairman added, “The CenterState and South State partnership is about the long-term but you can clearly see the progress being made in the short-term. Progress with technology, products, efficiency, and talent all have us uniquely positioned. We are off to a solid start.”
Loan / Deposit Growth
As of September 30, 2020, we have assisted customers with nearly 20,000 Paycheck Protection Program (“PPP”) loans and have an outstanding balance of $2.4 billion. We have recognized $8.5 million in deferred loan fees, net of costs in the income statement during the third quarter of 2020, and $15.9 million on a YTD basis. $53.3 million of net deferred fees remains to be recognized over the life of these loans. During the third quarter, loans (nonacquired and acquired) declined by $261.3 million, or 4.1% annualized. The third quarter decline in loans was centered in construction and development loans and single-family residential mortgage loans. Total deposits increased $12.7 million with core deposit growth totaling $310.6 million, or 4.8% annualized.
Quarterly Cash Dividend
The Company’s Board of Directors declared a common stock dividend of $0.47 per share, payable on November 20, 2020 to shareholders of record as of November 13, 2020.
Third Quarter 2020 Financial Performance
| | Three Months Ended | | | |||||||||||||||||
(Dollars in thousands, except per share data) | | Sept. 30, | | June 30, | | Mar. 31, | | Dec. 31, | | Sept. 30, | | Nine Months Ended | |||||||||
INCOME STATEMENT |
| 2020 |
| 2020 |
| 2020 |
| 2019 |
| 2019 |
| 2020 |
| 2019 | |||||||
Interest income | | | | | | | | | |||||||||||||
Loans, including fees (6) | | $ | 280,825 | $ | 167,707 | $ | 133,034 | $ | 132,615 | $ | 134,953 | $ | 581,566 | $ | 402,175 | ||||||
Investment securities, federal funds sold and securities | | | | | | | | | |||||||||||||
purchased under agreements to resell | | | 14,469 | | 12,857 | | 14,766 | | 14,839 | | 15,048 | | 42,092 | | 41,198 | ||||||
Total interest income | | | 295,294 | | 180,564 | | 147,800 | | 147,454 | | 150,001 | | 623,658 | | 443,373 | ||||||
Interest expense | | | | | | | | | |||||||||||||
Deposits | | | 15,154 | | 12,624 | | 14,437 | | 15,227 | | 16,655 | | 42,215 | | 50,693 | ||||||
Federal funds purchased, securities sold under agreements | | | | | | | | | |||||||||||||
to repurchase, and other borrowings | | | 9,792 | | 5,383 | | 5,350 | | 5,771 | | 5,973 | | 20,525 | | 14,861 | ||||||
Total interest expense | | | 24,946 | | 18,007 | | 19,787 | | 20,998 | | 22,628 | | 62,740 | | 65,554 | ||||||
Net interest income | | | 270,348 | | 162,557 | | 128,013 | | 126,456 | | 127,373 | | 560,918 | | 377,819 | ||||||
Provision for credit losses ("PCL") | | | 29,797 | | 151,474 | | 36,533 | | 3,557 | | 4,028 | | 217,804 | | 9,220 | ||||||
Net interest income after provision for loan losses | | | 240,551 | | 11,083 | | 91,480 | | 122,899 | | 123,345 | | 343,114 | | 368,599 | ||||||
Noninterest income | | | 114,790 | | 54,347 | | 44,132 | | 36,307 | | 37,582 | | 213,269 | | 107,258 | ||||||
Pre-tax operating expense | | | 215,225 | | 134,634 | | 103,118 | | 99,134 | | 96,364 | | 452,977 | | 291,158 | ||||||
Merger and/or branch consolid. expense | | | 21,662 | | 40,279 | | 4,129 | | 1,494 | | -- | | 66,070 | | 3,192 | ||||||
Federal Home Loan Bank advances prepayment fee | | | -- | | 199 | | -- | | -- | | -- | | 199 | | 134 | ||||||
Pension plan termination expense | | | -- | | -- | | -- | | -- | | -- | | -- | | 9,526 | ||||||
Total noninterest expense | | | 236,887 | | 175,112 | | 107,247 | | 100,628 | | 96,364 | | 519,246 | | 304,010 | ||||||
Income (loss) before provision for income taxes | | | 118,454 | | (109,682) | | 28,365 | | 58,578 | | 64,563 | | 37,137 | | 171,847 | ||||||
Provision for income taxes | | | 23,233 | | (24,747) | | 4,255 | | 9,487 | | 12,998 | | 2,741 | | 34,455 | ||||||
Net income (loss) | | $ | 95,221 | $ | (84,935) | $ | 24,110 | $ | 49,091 | $ | 51,565 | $ | 34,396 | $ | 137,392 | ||||||
| | | | | | | | ||||||||||||||
Adjusted net income (non-GAAP) (3) | | | | | | | | | |||||||||||||
Net income (loss) (GAAP) | | $ | 95,221 | $ | (84,935) | $ | 24,110 | $ | 49,091 | $ | 51,565 | $ | 34,396 | $ | 137,392 | ||||||
Securities gains, net of tax | | | (12) | | -- | | -- | | (20) | | (349) | | (12) | | (2,152) | ||||||
FHLB prepayment penalty | | | -- | | 154 | | -- | | -- | | -- | | 154 | | 107 | ||||||
Pension plan termination expense, net of tax | | | -- | | -- | | -- | | -- | | -- | | -- | | 7,641 | ||||||
Initial provision for credit losses - NonPCD loans and UFC | | | -- | | 92,212 | | -- | | -- | | -- | | 92,212 | | -- | ||||||
Merger and/or branch consolid. expense | | | 17,413 | | 31,191 | | 3,510 | | 1,252 | | — | | 52,114 | | 2,449 | ||||||
Adjusted net income (non-GAAP) | | $ | 112,622 | $ | 38,622 | $ | 27,620 | $ | 50,323 | $ | 51,216 | $ | 178,864 | $ | 145,437 | ||||||
| | | | | | | | ||||||||||||||
Basic earnings (loss) per common share | | $ | 1.34 | $ | (1.96) | $ | 0.72 | $ | 1.46 | $ | 1.51 | $ | 0.70 | $ | 3.94 | ||||||
Diluted earnings (loss) per common share | | $ | 1.34 | $ | (1.96) | $ | 0.71 | $ | 1.45 | $ | 1.50 | $ | 0.69 | $ | 3.92 | ||||||
Adjusted net income per common share - Basic (non-GAAP) (3) | | $ | 1.59 | $ | 0.89 | $ | 0.82 | $ | 1.49 | $ | 1.50 | $ | 3.63 | $ | 4.17 | ||||||
Adjusted net income per common share - Diluted (non-GAAP) (3) | | $ | 1.58 | $ | 0.89 | $ | 0.82 | $ | 1.48 | $ | 1.49 | $ | 3.60 | $ | 4.15 | ||||||
Dividends per common share | | $ | 0.47 | $ | 0.47 | $ | 0.47 | $ | 0.46 | $ | 0.43 | $ | 1.41 | $ | 1.21 | ||||||
Basic weighted-average common shares outstanding | | | 70,905,027 | | 43,317,736 | | 33,566,051 | | 33,677,851 | | 34,056,771 | | 49,330,267 | | 34,858,503 | ||||||
Diluted weighted-average common shares outstanding | | | 71,075,866 | | 43,317,736 | | 33,804,908 | | 33,964,216 | | 34,300,206 | | 49,635,882 | | 35,068,610 | ||||||
Adjusted diluted weighted-average common shares outstanding * | | | 71,075,866 | | 43,606,333 | | 33,804,908 | | 33,964,216 | | 34,300,206 | | 49,635,882 | | 35,068,610 | ||||||
Effective tax rate | | | 19.61% | | 22.56% | | 15.00% | | 16.20% | | 20.13% | | 7.38% | | 20.05% | ||||||
*Adjusted diluted weighted average common shares was calculated with the result of adjusted net income (non-GAAP).
The Company reported consolidated net income of $95.2 million, or $1.34 per diluted common share for the three-months ended September 30, 2020, an increase of $180.2 million, or $3.30 per diluted common share, from the second quarter of 2020. The net loss in the second quarter of 2020 was the result of the initial PCL recorded on the acquired NonPCD loans and the merger-related cost incurred from the merger with CSFL. Weighted-average diluted shares increased by 27.8 million shares, or 64.1%, compared to the second quarter of 2020, due primarily to the merger with CSFL in early June, in which the Company issued 37.3 million shares. These shares were outstanding all of the third quarter of 2020 compared to only 23 days in the second quarter of 2020. Net interest income increased by $107.8 million in the third quarter of 2020, compared to the second quarter of 2020, due to the full quarter impact of the merger with CSFL in the third quarter of 2020 compared to only 23 days in the second quarter of 2020. Interest income on acquired loans included $22.4 million of loan accretion. The PCL decreased by $121.7 million, due to the PCL on NonPCD loans and unfunded commitments associated with CSFL merger that were recognized in the second quarter of 2020. Noninterest income in was up $60.4 million compared to second quarter of 2020 to $114.8 million in the third quarter of 2020, due to the strong results from mortgage banking (primarily within the secondary market) and correspondent banking and capital markets income. Correspondent banking was added to the Company from the merger with CSFL and contributed $24.4 million in the third quarter of 2020 compared to $8.3 million in the month of June during the second quarter of 2020. Noninterest expense was higher in the third quarter of 2020 compared to the second quarter of 2020 by $61.8 million due primarily to the full quarter impact of the expenses of CSFL. Merger-related expense were lower by $18.6 million compared to the second quarter of 2020 when all professional services were incurred at legal close in early June of 2020. Adjusted noninterest expense was up approximately 59.9% over second quarter 2020, which relates directly to the addition of CSFL operating expense for all of the third quarter of 2020. The efficiency ratio (Non-GAAP) and adjusted efficiency ratio were 61.4% and 55.8% in 3Q 2020, respectively, compared to 80.5% and 61.9% in 2Q 2020, respectively.
Current Expected Credit Losses (“CECL”)
Effective January 1, 2020, the Company adopted ASU 2016-13 (“CECL”), which impacts the allowance for credit losses and the liability for UFC. Below is a table showing the roll forward of the ACL and UFC for the third quarter of 2020:
| | Allowance for Credit Losses ("ACL & UFC") | ||||||||||
| NonPCD ACL |
| PCD ACL |
| Total |
| UFC | |||||
Ending balance 6/30/2020 | $ | 280,301 | | $ | 154,307 | | $ | 434,608 | $ | 21,051 | ||
Measurement period adj - PCD loans from CSFL merger | | | | (1,542) | | | (1,542) | | ||||
Charge offs | | (1,897) | | | | | (1,897) | | ||||
Acquired charge offs | | (886) | | | (1,859) | | | (2,745) | | |||
Recoveries | | 1,220 | | | | | 1,220 | | ||||
Acquired recoveries | | 691 | | | 2,137 | | | 2,828 | | |||
Provision for credit losses | | 7,077 | | | 610 | | | 7,687 | | 22,110 | ||
Ending balance 9/30/2020 | $ | 286,506 | | $ | 153,653 | | $ | 440,159 | $ | 43,161 | ||
| | | | | | |||||||
Period end loans (includes PPP Loans) | $ | 22,094,095 | | $ | 3,143,720 | | $ | 25,237,815 | | N/A | ||
Reserve to Loans (includes PPP Loans) | | 1.30% | | | 4.89% | | | 1.74% | | N/A | ||
Period end loans (excludes PPP Loans) | $ | 19,742,374 | | $ | 3,143,720 | | $ | 22,886,094 | | N/A | ||
Reserve to Loans (excludes PPP Loans) | | 1.45% | | | 4.89% | | | 1.92% | | N/A | ||
Unfunded commitments (off balance sheet) * | | | | | | $ | 4,584,160 | |||||
Reserve to unfunded commitments (off balance sheet) | | | | | | | 0.94% | |||||
* | Unfunded commitments excludes unconditionally cancelable commitments and letters of credit. |
The ACL related to all loans totals $440.2 million compared to $434.6 million at June 30, 2020, and was recorded as a contra asset on its own line within the balance sheet, while the liability for UFC of $43.2 million was recorded on its own line in the liabilities section of the balance sheet. The total provision for credit losses recorded in the third quarter of 2020 was $29.8 million, including $22.1 million related to the liability for unfunded commitments (which was the result of a change in the methodology with the merger of CSFL and the Company). In the second quarter of 2020, (including the initial provision for credit losses related to acquired NonPCD loans and UFC from CSFL) the total provision for credit losses was $151.5 million.
Income Tax Expense
During the third quarter of 2020, our effective tax rate decreased to 19.61% from 22.56% in the second quarter of 2020 and from 20.13% in the third quarter of 2019. The primary reason for the decline relates to the fact that the Company was back in a pre-tax income position in 3Q 2020 compared to a pre-tax loss position in 2Q 2020, and the impact of the rate reducing items on the effective tax rate. The lower effective tax rate in 3Q 2020 compared to 3Q 2019 was mainly due to an increase in federal tax credits, as well as additional tax-exempt income resulting from the merger with CSFL. Lastly, an additional income tax benefit was recorded when legacy South State’s deferred taxes were revalued as a result of the merger. This was slightly offset by an increase in pre-tax income compared to the same period in 2019.
Balance Sheet and Capital
(dollars in thousands, except per share and share data) | | Ending Balance | |||||||||||||
| Sept. 30, |
| June 30, |
| Mar. 31, |
| Dec. 31, |
| Sept. 30, | ||||||
BALANCE SHEET | | 2020 | 2020 | 2020 | 2019 | 2019 | |||||||||
Assets | | | | | | | |||||||||
Cash and cash equivalents | | $ | 4,471,639 | $ | 4,363,708 | $ | 1,262,836 | $ | 688,704 | $ | 719,194 | ||||
Investment securities: | | | | | | | |||||||||
Securities available for sale, at fair value | | | 3,561,929 | | 3,137,718 | | 1,971,195 | | 1,956,047 | | 1,813,134 | ||||
Other investments | | | 185,199 | | 133,924 | | 62,994 | | 49,124 | | 49,124 | ||||
Total investment securities | | | 3,747,128 | | 3,271,642 | | 2,034,189 | | 2,005,171 | | 1,862,258 | ||||
Loans held for sale | | | 456,141 | | 603,275 | | 71,719 | | 59,363 | | 87,393 | ||||
Loans: | | | | | | | |||||||||
Acquired - PCD | | | 3,143,761 | | 3,323,754 | | 311,271 | | 356,782 | | 390,714 | ||||
Acquired - NonPCD | | | 10,557,968 | | 11,577,833 | | 1,632,700 | | 1,760,427 | | 1,965,603 | ||||
Non-acquired | | | 11,536,086 | | 10,597,560 | | 9,562,919 | | 9,252,831 | | 8,928,512 | ||||
Less allowance for loan losses | | | (440,159) | | (434,608) | | (144,785) | | (56,927) | | (54,937) | ||||
Loans, net | | | 24,797,656 | | 25,064,539 | | 11,362,105 | | 11,313,113 | | 11,229,892 | ||||
Bank property held for sale | | | 24,504 | | 25,541 | | 5,412 | | 5,425 | | 8,424 | ||||
Other real estate owned ("OREO") | | | 13,480 | | 18,016 | | 7,432 | | 6,539 | | 4,991 | ||||
Premises and equipment, net | | | 626,259 | | 627,943 | | 312,151 | | 317,321 | | 323,506 | ||||
Bank owned life insurance | | | 556,475 | | 556,807 | | 233,849 | | 234,567 | | 233,206 | ||||
Deferred tax asset | | | 107,500 | | 107,532 | | 46,365 | | 31,316 | | 27,844 | ||||
Mortgage servicing rights | | | 34,578 | | 25,441 | | 26,365 | | 30,525 | | 28,674 | ||||
Core deposit and other intangibles | | | 171,637 | | 170,911 | | 46,809 | | 49,816 | | 53,083 | ||||
Goodwill | | | 1,566,524 | | 1,603,383 | | 1,002,900 | | 1,002,900 | | 1,002,900 | ||||
Other assets | | | 1,245,845 | | 1,286,618 | | 230,779 | | 176,332 | | 170,717 | ||||
Total assets | | $ | 37,819,366 | $ | 37,725,356 | $ | 16,642,911 | $ | 15,921,092 | $ | 15,752,082 | ||||
| | | | | | ||||||||||
Liabilities and Shareholders’ Equity | | | | | | | |||||||||
Deposits: | | | | | | | |||||||||
Noninterest-bearing | | $ | 9,681,095 | $ | 9,915,700 | $ | 3,367,422 | $ | 3,245,306 | $ | 3,307,532 | ||||
Interest-bearing | | | 20,288,859 | | 20,041,585 | | 8,977,125 | | 8,931,790 | | 8,716,255 | ||||
Total deposits | | | 29,969,954 | | 29,957,285 | | 12,344,547 | | 12,177,096 | | 12,023,787 | ||||
Federal funds purchased and securities | | | | | | | |||||||||
sold under agreements to repurchase | | | 706,723 | | 720,479 | | 325,723 | | 298,741 | | 269,072 | ||||
Other borrowings | | | 1,089,637 | | 1,089,279 | | 1,316,100 | | 815,936 | | 815,771 | ||||
Reserve for unfunded commitments | | | 43,161 | | 21,051 | | 8,555 | | 335 | | 335 | ||||
Other liabilities | | | 1,446,478 | | 1,445,411 | | 326,943 | | 255,971 | | 292,161 | ||||
Total liabilities | | | 33,255,953 | | 33,233,506 | | 14,321,868 | | 13,548,079 | | 13,401,126 | ||||
| | | | | | ||||||||||
Shareholders’ equity: | | | | | | | |||||||||
Preferred stock - $.01 par value; authorized 10,000,000 shares | | | -- | | -- | | -- | | -- | | -- | ||||
Common stock - $2.50 par value; authorized 160,000,000 shares | | | 177,321 | | 177,268 | | 83,611 | | 84,361 | | 84,757 | ||||
Surplus | | | 3,764,482 | | 3,759,166 | | 1,584,322 | | 1,607,740 | | 1,617,004 | ||||
Retained earnings | | | 604,564 | | 542,677 | | 643,345 | | 679,895 | | 646,325 | ||||
Accumulated other comprehensive income | | | 17,046 | | 12,739 | | 9,765 | | 1,017 | | 2,870 | ||||
Total shareholders’ equity | | | 4,563,413 | | 4,491,850 | | 2,321,043 | | 2,373,013 | | 2,350,956 | ||||
Total liabilities and shareholders’ equity | | $ | 37,819,366 | $ | 37,725,356 | $ | 16,642,911 | $ | 15,921,092 | $ | 15,752,082 | ||||
| | | | | | ||||||||||
Common shares issued and outstanding | | | 70,928,304 | | 70,907,119 | | 33,444,236 | | 33,744,385 | | 33,902,726 | ||||
At September 30, 2020, the Company’s total assets were $37.8 billion, an increase of $94.0 million from June 30, 2020. Below are highlights of certain line items:
| 1. | Cash and cash equivalents increased by $107.9 million to $4.5 billion. |
| 2. | Investment securities portfolio increased by $476.0 million, and totaled $3.7 billion, representing 9.9% of total assets, an increase from 8.7% at June 30, 2020. |
| 3. | Total loans decreased by $261.3 million, with non-acquired loans increasing by $938.5 million and acquired loans decreasing by $1.2 billion. |
| 4. | Goodwill decreased by $36.9 million from measurement period adjustments related to fair value mark of loans (reduced loan discount) totaling $29.8 million, an intangible related to correspondent banking business acquired in the CSFL merger of $10.0 million, fair value adjustments to bank property of $6.0 million, and reduced deferred tax asset of $9.0 million |
| 5. | Non-interest bearing deposits decreased by $234.6 million. |
| 6. | Interest bearing deposits grew by $247.3 million. |
| 7. | Equity increased by $71.6 million during the third quarter from the following: (a) net income of $95.2 million, (b) other comprehensive income increasing by $4.3 million and (c) impact of equity awards increasing capital by $5.4 million, which were all partially offset by (d) dividends of $33.3 million. |
The Company’s book value per common share increased to $64.34 per share at September 30, 2020, compared to $63.35 per share at June 30, 2020 and decreased compared to $69.34 at September 30, 2019. TBV per common share increased by $1.50 per share to $39.83 at September 30, 2020, compared to $38.33 at June 30, 2020, and increased by $1.63 per share, or 4.28%, from $38.20 at September 30, 2019. Total tangible equity (capital) increased by $107.7 million in the third quarter of 2020.
The following table presents a summary of the loan portfolio by type (dollars in thousands):
| | Ending Balance | |||||||||||||
| | Sept. 30, | | June 30, | | March 31, | | Dec. 31, | | Sept. 30, | |||||
LOAN PORTFOLIO |
| 2020 |
| 2020 |
| 2020 |
| 2019 |
| 2019 | |||||
| | | | | | | | | | | |||||
Construction and land development | | $ | 1,840,111 | | $ | 1,999,062 | | $ | 1,105,308 | | $ | 1,016,692 | | $ | 1,024,627 |
Commercial non-owner occupied real estate | | | 5,936,372 | | | 6,021,317 | | | 2,371,371 | | | 2,322,590 | | | 2,356,335 |
Commercial owner occupied real estate | | | 4,846,020 | | | 4,762,520 | | | 2,177,738 | | | 2,158,701 | | | 2,093,795 |
Consumer owner occupied real estate | | | 4,311,186 | | | 4,421,247 | | | 2,665,405 | | | 2,704,405 | | | 2,757,424 |
Home equity loans | | | 1,347,798 | | | 1,378,406 | | | 758,482 | | | 758,020 | | | 773,363 |
Commercial and industrial | | | 5,419,120 | | | 5,341,363 | | | 1,418,421 | | | 1,386,303 | | | 1,261,527 |
Other income producing property | | | 629,497 | | | 650,237 | | | 327,696 | | | 346,554 | | | 361,879 |
Consumer non real estate | | | 900,171 | | | 916,623 | | | 674,791 | | | 662,883 | | | 654,422 |
Other | | | 7,540 | | | 8,372 | | | 7,678 | | | 13,892 | | | 1,457 |
Total loans | | $ | 25,237,815 | | $ | 25,499,147 | | $ | 11,506,890 | | $ | 11,370,040 | | $ | 11,284,829 |
The following table presents a summary of the deposit types (dollars in thousands):
| | Ending Balance | |||||||||||||
| | Sept. 30, | | June 30, | | March 31, | | Dec. 31, | | Sept. 30, | |||||
DEPOSITS |
| 2020 |
| 2020 |
| 2020 |
| 2019 |
| 2019 | |||||
| | | | | | | | | | | |||||
Type | | | | | | | | | | | | | | | |
Demand deposits | | $ | 9,681,095 | | $ | 9,915,700 | | $ | 3,367,422 | | $ | 3,245,306 | | $ | 3,307,532 |
Interest bearing deposits | | | 6,414,905 | | | 6,192,915 | | | 2,963,679 | | | 2,989,467 | | | 2,812,912 |
Savings | | | 2,618,877 | | | 2,503,514 | | | 1,337,730 | | | 1,309,896 | | | 1,317,705 |
Money market | | | 7,404,299 | | | 7,196,456 | | | 3,029,769 | | | 2,977,029 | | | 2,869,217 |
Time deposits | | | 3,850,778 | | | 4,148,700 | | | 1,645,947 | | | 1,655,398 | | | 1,716,421 |
| | | | | | | | | | | | | | | |
Total deposits | | $ | 29,969,954 | | $ | 29,957,285 | | $ | 12,344,547 | | $ | 12,177,096 | | $ | 12,023,787 |
| | | | | | | | | | | | | | | |
Core deposits (excludes CDs) | | | 26,119,176 | | | 25,808,585 | | | 10,698,600 | | | 10,521,698 | | | 10,307,366 |
Merger with CSFL
The merger with CSFL closed on June 7, 2020. The Company issued 37,271,069 shares using an exchange ratio of 0.3001. The total purchase price was $2.262 billion. The initial (preliminary) allocation of the purchase price to the fair value of assets and liabilities
acquired was completed as of June 30, 2020. Below is a table that reflects that initial allocation of the purchase price and additional measurement period adjustments recorded during the third quarter of 2020:
South State Corporation | | | | | | | | Fair Value of | ||||
CenterState Bank Corporation | | | | | | | | Net Assets | ||||
Merger Date of June 7, 2020 | | | | | | Measurement | | Acquired at | ||||
| | As Recorded | | Fair Value | | Period | | Date of | ||||
(Dollars in thousands) |
| by CSFL |
| Adjustments |
| Adjustments |
| Acquisition | ||||
Assets | | | | | | | | | | | | |
Cash and cash equivalents | | $ | 2,566,450 | | $ | -- | | $ | 2,566,450 | | | |
Investment securities | | | 1,188,403 | | | 5,507 | | | -- | | | 1,193,910 |
Loans held for sale | | | 453,578 | | | -- | | | 453,578 | | | |
Loans | | | 12,969,091 | | | (48,342) | | | 29,834 | | | 12,950,583 |
Premises and equipment | | | 324,396 | | | 2,392 | | | 5,999 | | | 332,787 |
Intangible assets | | | 1,294,211 | | | (1,163,349) | | | 10,000 | | | 140,862 |
Other real estate owned and repossessed assets | | | 10,849 | | | (791) | | | (49) | | | 10,009 |
Bank owned life insurance | | | 333,053 | | | -- | | | 333,053 | | | |
Deferred tax asset | | | 54,122 | | | (8,681) | | | (8,952) | | | 36,489 |
Other assets | | | 1,061,136 | | | (604) | | | 26 | | | 1,060,558 |
Total assets | | $ | 20,255,289 | | $ | (1,213,868) | | $ | 36,858 | | $ | 19,078,279 |
| | | | | | | | | | | | |
Liabilities | | | | | | | | | | | | |
Deposits: | | | | | | | | | | | | |
Noninterest-bearing | | $ | 5,291,443 | | $ | -- | | $ | -- | | $ | 5,291,443 |
Interest-bearing | | | 10,312,370 | | | 19,702 | | | -- | | | 10,332,072 |
Total deposits | | | 15,603,813 | | | 19,702 | | | -- | | | 15,623,515 |
Federal funds purchased and securities sold under agreements to repurchase | | | 401,546 | | | -- | | | -- | | | 401,546 |
Other borrowings | | | 278,900 | | | (7,401) | | | -- | | | 271,499 |
Other liabilities | | | 1,088,048 | | | (4,592) | | | -- | | | 1,083,456 |
Total liabilities | | | 17,372,307 | | | 7,709 | | | -- | | | 17,380,016 |
Net identifiable assets acquired over liabilities assumed | | | 2,882,982 | | | (1,221,577) | | | 36,858 | | | 1,698,263 |
Goodwill | | | | | | 600,483 | | | (36,858) | | | 563,625 |
Net assets acquired over liabilities assumed | | $ | 2,882,982 | | $ | (621,094) | | $ | -- | | $ | 2,261,888 |
| | | | | | | | | | | | |
Consideration: | | | | | | | | | | | | |
South State Corporation common shares issued | | | | | | | | | | | | 37,271,069 |
Purchase price per share of the Company’s common stock | | | | | | | | | | | $ | 60.27 |
Company common stock issued and cash exchanged for fractional shares | | | | | | | | | | | $ | 2,246,401 |
Stock Option Conversion | | | | | | | | | | | | 8,080 |
Restricted Stock Conversion | | | | | | | | | | | | 7,407 |
Fair value of total consideration transferred | | | | | | | | | | | $ | 2,261,888 |
The measurement period adjustments related to the merger between the Company and CSFL include the following:
| ● | Goodwill was reduced by $36.9 million with the measurement period adjustments recorded during the third quarter of 2020, resulting in total goodwill from the merger with CSFL of $563.6 million. |
| ● | Lower loan mark (discount) of $29.8 million from an updated loan valuation ($28.3 million) and revised lower loan marks on certain PCD loans ($1.5 million). |
| ● | The fair value adjustments for certain premises where updated appraisals were received and totaled $6.0 million. |
| ● | Identification of an intangible related to the correspondent banking business totaling $10.0 million. |
| ● | Deferred tax liability recorded for each of these adjustments totaling $9.0 million. |
In addition, with respect to the merger and conversion:
| ● | Merger cost incurred during the third quarter was as expected at $21.7 million, and included contract terminations, professional fees, and severance and support incentives to personnel. |
| ● | The merger integration, conversion, and cost savings identification process continues to be on schedule. |
Performance and Capital Ratios
|
| Three Months Ended |
| Nine Months Ended |
| |||||||||||||||
| | Sept. 30, | | June 30, | | Mar. 31, | | Dec. 31, | | Sept. 30, | | Sept. 30, | | Sept. 30, | | |||||
PERFORMANCE RATIOS | | 2020 | | 2020 | | 2020 | | 2019 | | 2019 | | 2020 | | 2019 | | |||||
Return on average assets (annualized) | | | 1.00 | % | | -1.49 | % | | 0.60 | % | | 1.23 | % | | 1.31 | % | 0.18 | % | 1.20 | % |
Adjusted return on average assets (annualized) (non-GAAP) (3) | | | 1.18 | % | | 0.68 | % | | 0.69 | % | | 1.26 | % | | 1.30 | % | 0.93 | % | 1.27 | % |
Return on average equity (annualized) | | | 8.31 | % | | -11.78 | % | | 4.15 | % | | 8.26 | % | | 8.70 | % | 1.41 | % | 7.76 | % |
Adjusted return on average equity (annualized) (non-GAAP) (3) | | | 9.83 | % | | 5.36 | % | | 4.75 | % | | 8.47 | % | | 8.64 | % | 7.31 | % | 8.22 | % |
Return on average tangible common equity (annualized) (non-GAAP) (5) | | | 14.66 | % | | -19.71 | % | | 8.35 | % | | 15.79 | % | | 16.62 | % | 3.51 | % | 14.88 | % |
Adjusted return on average tangible common equity (annualized) (non-GAAP) (3) (5) | | | 17.14 | % | | 10.23 | % | | 9.45 | % | | 16.17 | % | | 16.51 | % | 13.58 | % | 15.71 | % |
Efficiency ratio (tax equivalent) | | | 61.39 | % | | 80.52 | % | | 62.11 | % | | 61.64 | % | | 58.40 | % | 66.82 | % | 62.82 | % |
Adjusted efficiency ratio (non-GAAP) (7) | | | 55.78 | % | | 61.91 | % | | 59.72 | % | | 60.73 | % | | 58.40 | % | 58.29 | % | 60.19 | % |
Dividend payout ratio (2) | | | 35.01 | % | | N/A | | | 65.70 | % | | 31.62 | % | | 28.48 | % | 188.71 | % | 30.70 | % |
Book value per common share | | $ | 64.34 | | $ | 63.35 | | $ | 69.40 | | $ | 70.32 | | $ | 69.34 | | | | | |
Tangible common equity per common share (non-GAAP) (5) | | $ | 39.83 | | $ | 38.33 | | $ | 38.01 | | $ | 39.13 | | $ | 38.20 | | | | | |
| | | | | | | | | | | | | | | | | | | | |
CAPITAL RATIOS | | | | | | | | | | | | | | | | | | | | |
Equity-to-assets | | | 12.07 | % | | 11.91 | % | | 13.95 | % | | 14.90 | % | | 14.92 | % | | | | |
Tangible equity-to-tangible assets (non-GAAP) (5) | | | 7.83 | % | | 7.56 | % | | 8.15 | % | | 8.88 | % | | 8.81 | % | | | | |
Tier 1 common equity (4) * | | | 11.5 | % | | 10.7 | % | | 11.0 | % | | 11.3 | % | | 11.2 | % | | | | |
Tier 1 leverage (4) * | | | 8.1 | % | | 13.3 | % | | 9.5 | % | | 9.7 | % | | 9.7 | % | | | | |
Tier 1 risk-based capital (4) * | | | 11.5 | % | | 10.7 | % | | 12.0 | % | | 12.3 | % | | 12.2 | % | | | | |
Total risk-based capital (4) * | | | 13.9 | % | | 12.9 | % | | 12.7 | % | | 12.8 | % | | 12.7 | % | | | | |
| | | | | | | | | | | | | | | | | | | | |
OTHER DATA | | | | | | | | | | | | | | | | | | | | |
Number of branches | | | 305 | | | 305 | | | 155 | | | 155 | | | 157 | | | | | |
Number of employees (full-time equivalent basis) | | | 5,266 | | | 5,369 | | | 2,583 | | | 2,547 | | | 2,544 | | | | | |
*The regulatory capital ratios presented above include the assumption of the transitional method relative to the CAREs Act in relief of COVID-19 pandemic on the economy and financial institutions in the United States. The referenced relief allows a total five-year “phase in” of the CECL impact on capital and relief over the next two years for the impact on the allowance for credit losses resulting from COVID-19.
Asset Quality
| | | | | | | | | | | | | | | | |
|
| Ending Balance |
|
|
|
|
|
|
| |||||||
| | Sept. 30, | | June 30, | | Mar. 31, | | Dec. 31, | | Sept 30, | | |||||
(Dollars in thousands) | | 2020 | | 2020 | | 2020 | | 2019 | | 2019 | | |||||
NONPERFORMING ASSETS: | | | | | | | | | | | | | | | | |
Non-acquired | | | | | | | | | | | | | | | | |
Non-acquired nonperforming loans | | $ | 22,463 | | $ | 22,883 | | $ | 23,912 | | $ | 22,816 | | $ | 19,187 | |
Non-acquired OREO and other nonperforming assets | | | 825 | | | 1,689 | | | 941 | | | 1,011 | | | 1,464 | |
Total non-acquired nonperforming assets | | | 23,288 | | | 24,572 | | | 24,853 | | | 23,827 | | | 20,651 | |
Acquired | | | | | | | | | | | | | | | | |
Acquired nonperforming loans (2019 periods acquired non-credit impaired loans only) * | | | 89,974 | | | 100,399 | | | 32,791 | | | 11,114 | | | 9,596 | |
Acquired OREO and other nonperforming assets | | | 12,904 | | | 16,987 | | | 6,802 | | | 5,848 | | | 7,207 | |
Total acquired nonperforming assets | | | 102,878 | | | 117,386 | | | 39,593 | | | 16,962 | | | 16,803 | |
Total nonperforming assets * | | $ | 126,166 | | $ | 141,958 | | $ | 64,446 | | $ | 40,789 | | $ | 37,454 | |
| | | | | | | | | | | | | | | | |
|
| | Three Months Ended |
| | |
| | |
| | | | |||
| | | Sept. 30, | | June 30, | | Mar. 31, | | Dec. 31, | | Sept 30, | | ||||
| | | 2020 | | 2020 | | 2020 | | 2019 | | 2019 | | ||||
ASSET QUALITY RATIOS: | | | | | | | | | | | | | | | | |
Allowance for non-acquired loan losses as a | | | | | | | | | | | | | | | | |
percentage of non-acquired loans (1) | | | N/A | | | N/A | | | N/A | | | 0.62 | % | | 0.62 | % |
Allowance for credit losses as a percentage of loans | | | 1.74 | % | | 1.70 | % | | 1.26 | % | | N/A | | | N/A | |
Allowance for credit losses as a percentage of loans, excluding PPP loans | | | 1.92 | % | | 1.88 | % | | N/A | | | N/A | | | N/A | |
Allowance for non-acquired loan losses as a | | | | | | | | | | | | | | | | |
percentage of non-acquired nonperforming loans | | | N/A | | | N/A | | | N/A | | | 249.50 | % | | 286.32 | % |
Allowance for credit losses as a percentage of nonperforming loans * | | | 391.47 | % | | 352.53 | % | | 255.34 | % | | N/A | | | N/A | |
Net charge-offs on non-acquired loans as a percentage of average (annualized) (1) | | | N/A | | | N/A | | | N/A | | | 0.06 | % | | 0.05 | % |
Net charge-offs as a percentage of average loans (annualized) | | | 0.01 | % | | 0.00 | % | | 0.05 | % | | N/A | | | N/A | |
Net charge-offs on acquired loans as a percentage | | | | | | | | | | | | | | | | |
of average acquired loans (annualized) (1) | | | N/A | | | N/A | | | N/A | | | -0.01 | % | | 0.15 | % |
Total nonperforming assets as a percentage | | | | | | | | | | | | | | | | |
of total assets * | | | 0.33 | % | | 0.38 | % | | 0.39 | % | | 0.26 | % | | 0.24 | % |
Nonperforming loans as a percentage of period end loans * | | | 0.45 | % | | 0.48 | % | | 0.49 | % | | 0.30 | % | | 0.25 | % |
*Total nonperforming assets now include nonaccrual loans that are purchase credit deteriorated (“PCD loans”). In prior periods, these loans, which were called acquired credit impaired (“ACI”) loans, were excluded from nonperforming assets. The adoption of CECL resulted in the discontinuation of the pool-level accounting for ACI loans and replaced it with loan-level evaluation for PCD nonaccrual status. The Company’s nonperforming loans increased by $21.0 million in the first quarter of 2020 from these loans. The Company has not assumed or taken on any additional risk relative to these assets. With the merger with CSFL, the amount of acquired nonaccruals loans increased by approximately $69.9 million.
Total nonperforming assets decreased by $15.8 million to $126.2 million, representing 0.33% of total assets, a decrease of 5 basis points compared to June 30, 2020. The decrease was due primarily to the reduction in nonperforming assets acquired, both in loans ($10.4 million) and in OREO ($4.1 million). Non-acquired non-performing assets decreased by $1.3 million during the third quarter of 2020 to $23.3 million at September 30, 2020. The ACL as a percentage of total nonperforming loans was 391% at September 30, 2020, up from 353% of total nonperforming loans at June 30, 2020.
At September 30, 2020, the ACL was $440.2 million, or 1.74%, of period end loans. Additionally, unfunded commitments have a reserve of $43.2 million, or 0.94% of unfunded commitments (off balance sheet). The ACL was $434.6 million, or 1.70%, of period end loans at June 30, 2020. Net charge-offs totaled $594,000, or 0.01%, annualized of average total loans, in the third quarter of 2020 compared to $101,000, or 0.00%, annualized in the second quarter of 2020.
During the third quarter of 2020, the provision for credit losses totaled $29.8 million for the loan portfolio compared to $151.5 million for the provision for credit losses in the second quarter of 2020. The significant provision in the second quarter of 2020 was the result of the merger with CSFL and the initial provision for credit losses recorded on NonPCD loans acquired, the unfunded commitment liability related to CSFL, and the additional PCL related to non-acquired South State loans totaled $28.4 million. This initial PCL on NonPCD acquired loans and UFC totaled $119.1 million. The total provision for credit losses of $29.8 million recorded in the third
quarter of 2020 included $22.1 million related to the liability for unfunded commitments and $7.7 million from the expected lifetime losses of loans outstanding. Prior to the merger, each of CSFL and the Company ran separate CECL models. The CECL calculation at June 30, 2020 was the result of combining the results of the two models. During the third quarter, the Company consolidated into one CECL model. This change led to an increase in the reserve for unfunded commitments since the consolidated model used a differing methodology from that used for 2Q 2020.
Total OREO decreased during the third quarter of 2020 to $13.5 million, a $4.5 million decrease from the balance at June 30, 2020.
Net Interest Income and Margin
| | | | | | | | | | | | | | | | | | | | | | | | | |
| | Three Months Ended | | ||||||||||||||||||||||
| | September 30, 2020 | | June 30, 2020 | | September 30, 2019 | | ||||||||||||||||||
(Dollars in thousands) | | Average | | Income/ | | Yield/ | | Average | | Income/ | | Yield/ | | Average | | Income/ | | Yield/ | | ||||||
YIELD ANALYSIS |
| Balance |
| Expense |
| Rate |
| Balance |
| Expense |
| Rate |
| Balance |
| Expense |
| Rate | | ||||||
Interest-Earning Assets: | | | | | | | | | | | | | | | | | | | | | | | | | |
Federal funds sold, reverse repo, and time deposits | | $ | 4,406,376 | | $ | 1,215 | | 0.11 | % | $ | 2,033,910 | | $ | 432 | | 0.09 | % | $ | 491,627 | | $ | 2,676 | | 2.16 | % |
Investment securities (taxable) | | | 2,792,649 | | | 11,118 | | 1.58 | % | | 2,109,609 | | | 10,920 | | 2.08 | % | | 1,638,461 | | | 10,785 | | 2.61 | % |
Investment securities (tax-exempt) | | | 435,339 | | | 2,136 | | 1.95 | % | | 197,862 | | | 1,505 | | 3.06 | % | | 181,434 | | | 1,587 | | 3.47 | % |
Loans held for sale | | | 556,670 | | | 4,151 | | 2.97 | % | | 203,267 | | | 1,498 | | 2.96 | % | | 58,829 | | | 541 | | 3.65 | % |
Loans | | | 25,312,632 | | | 276,674 | | 4.35 | % | | 15,717,387 | | | 166,209 | | 4.25 | % | | 11,225,593 | | | 134,412 | | 4.75 | % |
Total interest-earning assets | | | 33,503,666 | | | 295,294 | | 3.51 | % | | 20,262,035 | | | 180,564 | | 3.58 | % | | 13,595,944 | | | 150,001 | | 4.38 | % |
Noninterest-earning assets | | | 4,361,551 | | | | | | | | 2,636,890 | | | | | | | | 2,014,172 | | | | | | |
Total Assets | | $ | 37,865,217 | | | | | | | $ | 22,898,925 | | | | | | | $ | 15,610,116 | | | | | | |
| | | | | | | | | | | | | | | | | | | | | | | | | |
Interest-Bearing Liabilities: | | | | | | | | | | | | | | | | | | | | | | | | | |
Transaction and money market accounts | | $ | 13,671,430 | | $ | 7,853 | | 0.23 | % | $ | 8,132,276 | | $ | 5,096 | | 0.25 | % | $ | 5,581,057 | | $ | 8,932 | | 0.63 | % |
Savings deposits | | | 2,570,500 | | | 584 | | 0.09 | % | | 1,699,377 | | | 336 | | 0.08 | % | | 1,323,377 | | | 1,027 | | 0.31 | % |
Certificates and other time deposits | | | 4,007,542 | | | 6,717 | | 0.67 | % | | 2,321,684 | | | 7,192 | | 1.25 | % | | 1,730,567 | | | 6,696 | | 1.54 | % |
Federal funds purchased and repurchase agreements | | | 710,369 | | | 509 | | 0.29 | % | | 415,304 | | | 391 | | 0.38 | % | | 272,900 | | | 612 | | 0.89 | % |
Other borrowings | | | 1,089,399 | | | 9,283 | | 3.39 | % | | 1,216,884 | | | 4,992 | | 1.65 | % | | 816,188 | | | 5,361 | | 2.61 | % |
Total interest-bearing liabilities | | | 22,049,240 | | | 24,946 | | 0.45 | % | | 13,785,525 | | | 18,007 | | 0.53 | % | | 9,724,089 | | | 22,628 | | 0.92 | % |
Noninterest-bearing liabilities | | | 11,259,916 | | | | | | | | 6,212,957 | | | | | | | | 3,534,873 | | | | | | |
Shareholders’ equity | | | 4,556,061 | | | | | | | | 2,900,443 | | | | | | | | 2,351,154 | | | | | | |
Total Non-IBL and shareholders’ equity | | | 15,815,977 | | | | | | | | 9,113,400 | | | | | | | | 5,886,027 | | | | | | |
Total liabilities and shareholders’ equity | | $ | 37,865,217 | | | | | | | $ | 22,898,925 | | | | | | | $ | 15,610,116 | | | | | | |
Net interest income and margin (NON-TAX EQUIV.) | | | | | $ | 270,348 | | 3.21 | % | | | | $ | 162,557 | | 3.23 | % | | | | $ | 127,373 | | 3.72 | % |
Net interest margin (TAX EQUIVALENT) | | | | | | | | 3.22 | % | | | | | | | 3.24 | % | | | | | | | 3.73 | % |
Total Deposit Cost of Funds | | | | | | | | 0.20 | % | | | | | | | 0.29 | % | | | | | | | 0.56 | % |
Overall Cost of Funds (including demand deposits) | | | | | | | | 0.31 | % | | | | | | | 0.37 | % | | | | | | | 0.69 | % |
The net interest margin (“NIM”) declined by 2 basis points to 3.22% at September 30, 2020, from 3.24% at June 30, 2020, and declined from 3.73% from September 30, 2019. These declines were the result of the current low interest rate environment from the COVID-19 pandemic and the stimulus from the CARES Act. The yield on the acquired loan portfolio declined to 4.76% compared 5.08% in the second quarter of 2020, while the non-acquired loan portfolio only declined 1 basis point to 3.83% from 3.84% in the second quarter of 2020. Deposit cost declined by 9 basis points to 20 basis points in the third quarter of 2020. Including the impact of noninterest bearing deposits, the Company’s overall cost of funds declined to 31 basis points for the third quarter of 2020 compared to 37 basis points in the second quarter of 2020, and decreased from 69 basis points in the year ago period. The average balances for each category and the totals increased significantly in the third quarter of 2020, due primarily from the full quarter impact of the CSFL merger compared to only 23 days included in the second quarter of 2020.
Acquired Loans and Loan Accretion
With the adoption of CECL, loan accretion, accretable yield, and the related discounts are now consistently accounted for within the balance sheet and income statement. Acquired loans reflected the following results in the third quarter of 2020:
| ● | Contractual interest income totaled $146.3 million, or 4.13% yield. |
| ● | Loan accretion totaled $22.4 million, compared to $10.1 million in the second quarter of 2020. The amount of accretion recognized in third quarter from the CSFL acquired loan portfolio totaled $14.7 million compared to $2.9 million in the second quarter which only included 23 days from the merger closing date. |
| ● | Including the loan accretion, total interest income was $168.8 million on acquired loans resulting in 4.76% yield during the third quarter of 2020, down from 5.08% in the second quarter of 2020. |
The table below reflects the remaining discount on acquired loans, which will be accreted into loan interest income over the contractual life of the loan and includes the discount recorded from the merger with CSFL, including a third quarter of 2020 measurement period adjustment primarily related to an updated loan valuation (dollars in thousands):
Unrecognized discount on acquired loans |
|
| |
Beginning balance, June 30, 2020 | | $ | 160,802 |
Measurement period adjustment of discount from the CSFL merger | | | (27,996) |
Loan accretion recognized in 3Q 2020 | | | (22,445) |
Ending balance, September 30, 2020 | | $ | 110,361 |
Noninterest Income and Expense
| | Three Months Ended | | Nine Months Ended | |||||||||||||||||
| | Sept. 30, | | June 30, | | Mar. 31, | | Dec. 31, | | Sept. 30, | | Sept. 30, | | Sept. 30, | |||||||
(Dollars in thousands) |
| 2020 |
| 2020 |
| 2020 |
| 2019 |
| 2019 |
| 2020 |
| 2019 | |||||||
Noninterest income: | | | | | | | | | | | | | | | |||||||
Fees on deposit accounts | | $ | 24,346 | | $ | 16,679 | | $ | 18,141 | | $ | 19,161 | | $ | 19,725 | | $ | 59,166 | | $ | 56,274 |
Mortgage banking income | | | 48,022 | | | 18,371 | | | 14,647 | | | 3,757 | | | 6,115 | | | 81,040 | | | 13,807 |
Trust and investment services income | | | 7,404 | | | 7,138 | | | 7,389 | | | 6,935 | | | 7,320 | | | 21,931 | | | 22,309 |
Securities gains, net | | | 15 | | | -- | | | -- | | | 24 | | | 437 | | | 15 | | | 2,687 |
Correspondent banking and capital market income | | | 26,432 | | | 10,067 | | | 493 | | | 1,357 | | | 690 | | | 36,992 | | | 1,536 |
Bank owned life insurance income | | | 4,127 | | | 1,381 | | | 2,530 | | | 1,361 | | | 1,498 | | | 8,038 | | | 4,399 |
Recoveries of fully charged off acquired loans | | | -- | | | -- | | | -- | | | 2,232 | | | 1,401 | | | -- | | | 4,615 |
Other | | | 4,444 | | | 711 | | | 932 | | | 1,480 | | | 396 | | | 6,087 | | | 1,631 |
Total noninterest income | | $ | 114,790 | | $ | 54,347 | | $ | 44,132 | | $ | 36,307 | | $ | 37,582 | | $ | 213,269 | | $ | 107,258 |
| | | | | | | | | | | | | | | | | | | | | |
Noninterest expense: | | | | | | | | | | | | | | | | | | | | | |
Salaries and employee benefits | | $ | 134,919 | | $ | 81,720 | | $ | 60,978 | | $ | 58,218 | | $ | 59,551 | | $ | 277,617 | | $ | 176,529 |
Pension plan termination expense | | | -- | | | -- | | | -- | | | -- | | | -- | | | -- | | | 9,526 |
Occupancy expense | | | 23,845 | | | 15,959 | | | 12,287 | | | 12,113 | | | 11,883 | | | 52,091 | | | 35,344 |
Information services expense | | | 18,855 | | | 12,155 | | | 9,306 | | | 8,919 | | | 8,878 | | | 40,316 | | | 26,558 |
FHLB prepayment penalty | | | -- | | | 199 | | | -- | | | -- | | | -- | | | 199 | | | 134 |
OREO expense and loan related | | | 1,146 | | | 1,107 | | | 587 | | | 1,013 | | | 597 | | | 2,840 | | | 2,229 |
Business development and staff related | | | 2,599 | | | 1,447 | | | 2,244 | | | 2,905 | | | 2,018 | | | 6,290 | | | 6,477 |
Amortization of intangibles | | | 9,560 | | | 4,665 | | | 3,007 | | | 3,267 | | | 3,268 | | | 17,232 | | | 9,817 |
Professional fees | | | 4,385 | | | 2,848 | | | 2,494 | | | 2,862 | | | 2,442 | | | 9,727 | | | 7,463 |
Supplies, printing and postage expense | | | 2,755 | | | 1,610 | | | 1,505 | | | 1,464 | | | 1,418 | | | 5,870 | | | 4,417 |
FDIC assessment and other regulatory charges | | | 2,849 | | | 2,403 | | | 2,058 | | | 1,327 | | | 228 | | | 7,310 | | | 3,218 |
Advertising and marketing | | | 1,203 | | | 531 | | | 814 | | | 1,491 | | | 1,052 | | | 2,548 | | | 2,818 |
Other operating expenses | | | 13,109 | | | 10,189 | | | 7,838 | | | 5,555 | | | 5,029 | | | 31,136 | | | 16,422 |
Branch consolid. or merger / convers related exp. | | | 21,662 | | | 40,279 | | | 4,129 | | | 1,494 | | | -- | | | 66,070 | | | 3,058 |
Merger and branding related expense | | | -- | | | -- | | | -- | | | -- | | | -- | | | -- | | | -- |
Total noninterest expense | | $ | 236,887 | | $ | 175,112 | | $ | 107,247 | | $ | 100,628 | | $ | 96,364 | | $ | 519,246 | | $ | 304,010 |
Noninterest income totaled $114.8 million for the third quarter of 2020 compared to $54.3 million in the second quarter of 2020, an increase of $60.4 million. This large increase within all categories was due to the inclusion of income for the full quarter from the merger with CSFL compared to only 23 days in the second quarter of 2020. The largest increases were $29.7 million in mortgage banking income and $16.4 million in correspondent banking and capital markets income. Mortgage banking income improved by $23.5 million from the gains within the secondary market, net of commissions; and from $6.2 million of income associated with the MSR, net of the hedge.
Compared to the third quarter of 2019, noninterest income increased by $77.2 million due to the impact of merger with CSFL. Correspondent banking and capital markets income discussed above improved by $25.7 million and mortgage banking income increased by $41.9 million. Secondary market mortgage income was up $39.9 million from the increase in the gain on sale of mortgage loans,
from both higher volume of loans and at higher margins. The other categories of noninterest income all increased, except for recoveries from acquired loans, which now flow through the allowance for credit losses, and resulted in a $1.4 million decrease.
Noninterest expense was $236.9 million in the third quarter of 2020, an increase of $61.8 million from $175.1 million in the second quarter of 2020. The increase was related to the full quarter impact of expense associated with the merger with CSFL (compared to only 23 days in 2Q 2020). Merger-related costs totaled $21.7 million for the quarter and was a decrease of $18.6 million from the second quarter of 2020. Adjusted noninterest expense totaled $215.2 million in 3Q 2020, which was $80.6 million higher than second quarter of 2020, and resulted in an adjusted efficiency ratio of 55.8% compared to 61.9%, in second quarter of 2020.
Compared to the third quarter of 2019, noninterest expense was higher by $140.5 million. The increase was due to the merger with CSFL in June 2020, and the inclusion of the combined company expenses for all of the third quarter of 2020. In addition, the third quarter of 2020 includes $21.7 million of additional merger-related cost. Adjusted noninterest expense (non-GAAP) increased $118.9 million, compared to the third quarter of 2019.
Conference Call
The Company will announce its third quarter 2020 earnings results in a news release after the market closes on October 29, 2020. At 10:30 a.m. Eastern Time on October 30, 2020, the Company will host a conference call to discuss its third quarter results. Callers wishing to participate may call toll-free by dialing 877-506-9272. Participants may also pre-register for the conference by navigating to https://dpregister.com/sreg/10148509/da2c128419. A dial in number and unique PIN will be provided upon completion of registration. Alternatively, individuals may listen to the live webcast of the presentation by visiting the link at the Company’s website at www.SouthStateBank.com. An audio replay of the live webcast is expected to be available by the evening of October 30, 2020 through the Investor Relations section of www.SouthStateBank.com.
***************
South State Corporation is a financial services company headquartered in Winter Haven, Florida. South State Bank, N.A., the company’s nationally chartered bank subsidiary, provides consumer, commercial, mortgage and wealth management solutions to more than one million customers throughout Florida, Alabama, Georgia, the Carolinas and Virginia. The bank also serves clients coast to coast through its correspondent banking division. Additional information is available at SouthStateBank.com.
Non-GAAP Measures
Statements included in this press release include non-GAAP measures and should be read along with the accompanying tables that provide a reconciliation of non-GAAP measures to GAAP measures. Management believes that these non-GAAP measures provide additional useful information, which allows readers to evaluate the ongoing performance of the Company. Non-GAAP measures should not be considered as an alternative to any measure of performance or financial condition as promulgated under GAAP, and investors should consider the company’s performance and financial condition as reported under GAAP and all other relevant information when assessing the performance or financial condition of the company. Non-GAAP measures have limitations as analytical tools, and investors should not consider them in isolation or as a substitute for analysis of the company’s results or financial condition as reported under GAAP.
Pre-provision net revenue (in thousands) | | Sept. 30, 2020 | | June 30, 2020 |
| ||
| | | | | | ||
Net income (loss) (GAAP) | | $ | 95,221 | | $ | (84,935) | |
PCL legacy SSB | | | 29,797 | | | 31,259 | |
PCL legacy CSB NonPCD and UFC - Day 1 | | | - | | | 119,079 | |
PCL legacy CSB for June | | | - | | | 1,136 | |
Tax provision (benefit) | | | 23,233 | | | (24,747) | |
Merger-related costs | | | 21,662 | | | 40,279 | |
Securities gain | | | (15) | | | - | |
FHLB advance prepayment cost | | | - | | | 199 | |
CSB pre-merger PPNR | | | - | | | 74,791 | |
| | | | | | | |
Pre-provision net revenue (PPNR) Non-GAAP | | $ | 169,898 | | $ | 157,061 | |
| | | | | | | |
SSB average asset balance (GAAP) | | $ | 37,865,217 | | $ | 22,898,925 | |
CSB average asset balance pre-merger | | | | | | 14,604,081 | |
Total average balance June 30, 2020 (Non-GAAP) | | | | | $ | 37,503,006 | |
| | | | | | | |
ROAA PPNR | | | 1.79 | % | | 1.68 | % |
| | | | | | | | | | | | | | | | | | | | | | |
| | Three Months Ended | | Nine Months Ended | | |||||||||||||||||
(Dollars in thousands, except per share data) | | Sept. 30, | | June 30, | | Mar. 31, | | Dec. 31, | | Sept. 30, | | Sept. 30, | | Sept. 30, | | |||||||
RECONCILIATION OF GAAP TO Non-GAAP |
| 2020 |
| 2020 |
| 2020 |
| 2019 |
| 2019 |
| 2020 |
| 2019 | | |||||||
Adjusted net income (non-GAAP) (3) | | | | | | | | | | | | | | | | | | | | | | |
Net income (loss) (GAAP) | | $ | 95,221 | | $ | (84,935) | | $ | 24,110 | | $ | 49,091 | | $ | 51,565 | | $ | 34,396 | | $ | 137,392 | |
Securities gains, net of tax | | | (12) | | | -- | | | -- | | | (20) | | | (349) | | | (12) | | | (2,152) | |
PCL - NonPCD loans & unfunded commitments | | | -- | | | 92,212 | | | -- | | | -- | | | -- | | | 92,212 | | | -- | |
Pension plan termination expense, net of tax | | | -- | | | -- | | | -- | | | -- | | | -- | | | -- | | | 7,641 | |
FHLB prepayment penalty, net of tax | | | -- | | | 154 | | | -- | | | -- | | | -- | | | 154 | | | 107 | |
Merger and branch consolidation/acq. expense, net of tax | | | 17,413 | | | 31,191 | | | 3,510 | | | 1,252 | | | -- | | | 52,114 | | | 2,449 | |
Adjusted net income (non-GAAP) | | $ | 112,622 | | $ | 38,622 | | $ | 27,620 | | $ | 50,323 | | $ | 51,216 | | $ | 178,864 | | $ | 145,437 | |
| | | | | | | | | | | | | | | | | | | | | | |
Adjusted net income per common share - Basic (3) | | | | | | | | | | | | | | | | | | | | | | |
Earnings (loss) per common share - Basic (GAAP) | | $ | 1.34 | | $ | (1.96) | | $ | 0.72 | | $ | 1.46 | | $ | 1.51 | | $ | 0.70 | | $ | 3.94 | |
Effect to adjust for securities gains | | | (0.00) | | | -- | | | -- | | | (0.01) | | | (0.01) | | | (0.00) | | | (0.06) | |
Effect to adjust for PCL - NonPCD loans & unfunded commitments | | | -- | | | 2.13 | | | -- | | | -- | | | -- | | | 1.87 | | | -- | |
Effect to adjust for pension plan termination expense, net of tax | | | -- | | | -- | | | -- | | | -- | | | -- | | | -- | | | 0.22 | |
Effect to adjust for FHLB prepayment penalty, net of tax | | | -- | | | 0.00 | | | -- | | | -- | | | -- | | | 0.00 | | | -- | |
Effect to adjust for merger & branch consol./acq expenses, net of tax | | | 0.25 | | | 0.72 | | | 0.10 | | | 0.04 | | | -- | | | 1.06 | | | 0.07 | |
Adjusted net income per common share - Basic (non-GAAP) | | $ | 1.59 | | $ | 0.89 | | $ | 0.82 | | $ | 1.49 | | $ | 1.50 | | $ | 3.63 | | $ | 4.17 | |
| | | | | | | | | | | | | | | | | | | | | | |
Adjusted net income per common share - Diluted (3) | | | | | | | | | | | | | | | | | | | | | | |
Earnings (loss) per common share - Diluted (GAAP) | | $ | 1.34 | | $ | (1.96) | | $ | 0.71 | | $ | 1.45 | | $ | 1.50 | | $ | 0.69 | | $ | 3.92 | |
Effect to adjust for securities gains | | | (0.00) | | | -- | | | -- | | | (0.01) | | | (0.01) | | | (0.00) | | | (0.06) | |
Effect to adjust for PCL - NonPCD loans & unfunded commitments | | | -- | | | 2.11 | | | -- | | | -- | | | -- | | | 1.86 | | | -- | |
Effect to adjust for pension plan termination expense, net of tax | | | -- | | | -- | | | -- | | | -- | | | -- | | | -- | | | 0.22 | |
Effect to adjust for FHLB prepayment penalty, net of tax | | | -- | | | 0.00 | | | -- | | | -- | | | -- | | | 0.00 | | | -- | |
Effect to adjust for merger & branch consol./acq expenses, net of tax | | | 0.24 | | | 0.72 | | | 0.11 | | | 0.04 | | | -- | | | 1.05 | | | 0.07 | |
Effect of adjusted weighted ave shares due to adjusted net income | | | -- | | | 0.02 | | | | | | | | | | | | -- | | | | |
Adjusted net income per common share - Diluted (non-GAAP) | | $ | 1.58 | | $ | 0.89 | | $ | 0.82 | | $ | 1.48 | | $ | 1.49 | | $ | 3.60 | | $ | 4.15 | |
| | | | | | | | | | | | | | | | | | | | | | |
Adjusted Return of Average Assets (3) | | | | | | | | | | | | | | | | | | | | | | |
Return on average assets (GAAP) | | | 1.00 | % | | -1.49 | % | | 0.60 | % | | 1.23 | % | | 1.31 | % | | 0.18 | % | | 1.20 | % |
Effect to adjust for securities gains | | | 0.00 | % | | 0.00 | % | | 0.00 | % | | 0.00 | % | | -0.01 | % | | 0.00 | % | | -0.02 | % |
Effect to adjust for PCL - NonPCD loans & unfunded commitments | | | 0.00 | % | | 1.62 | % | | 0.00 | % | | 0.00 | % | | 0.00 | % | | 0.48 | % | | 0.00 | % |
Effect to adjust for pension plan termination expense, net of tax | | | 0.00 | % | | 0.00 | % | | 0.00 | % | | 0.00 | % | | 0.00 | % | | 0.00 | % | | 0.07 | % |
Effect to adjust for FHLB prepayment penalty, net of tax | | | 0.00 | % | | 0.00 | % | | 0.00 | % | | 0.00 | % | | 0.00 | % | | 0.00 | % | | 0.00 | % |
Effect to adjust for merger & branch consol./acq expenses, net of tax | | | 0.18 | % | | 0.55 | % | | 0.09 | % | | 0.03 | % | | 0.00 | % | | 0.27 | % | | 0.02 | % |
Adjusted return on average assets (non-GAAP) | | | 1.18 | % | | 0.68 | % | | 0.69 | % | | 1.26 | % | | 1.30 | % | | 0.93 | % | | 1.27 | % |
| | | | | | | | | | | | | | | | | | | | | | |
Adjusted Return of Average Equity (3) | | | | | | | | | | | | | | | | | | | | | | |
Return on average equity (GAAP) | | | 8.31 | % | | -11.78 | % | | 4.15 | % | | 8.26 | % | | 8.70 | % | | 1.41 | % | | 7.76 | % |
Effect to adjust for securities gains | | | 0.00 | % | | 0.00 | % | | 0.00 | % | | 0.00 | % | | -0.06 | % | | 0.00 | % | | -0.12 | % |
Effect to adjust for PCL - NonPCD loans & unfunded commitments | | | 0.00 | % | | 12.79 | % | | 0.00 | % | | 0.00 | % | | 0.00 | % | | 3.77 | % | | 0.00 | % |
Effect to adjust for pension plan termination expense, net of tax | | | 0.00 | % | | 0.00 | % | | 0.00 | % | | 0.00 | % | | 0.00 | % | | 0.00 | % | | 0.43 | % |
Effect to adjust for FHLB prepayment penalty, net of tax | | | 0.00 | % | | 0.02 | % | | 0.00 | % | | 0.00 | % | | 0.00 | % | | 0.01 | % | | 0.01 | % |
Effect to adjust for merger & branch consol./acq expenses, net of tax | | | 1.52 | % | | 4.33 | % | | 0.60 | % | | 0.21 | % | | 0.00 | % | | 2.12 | % | | 0.14 | % |
Adjusted return on average equity (non-GAAP) | | | 9.83 | % | | 5.36 | % | | 4.75 | % | | 8.47 | % | | 8.64 | % | | 7.31 | % | | 8.22 | % |
Adjusted Return on Average Common Tangible Equity (3) (5) | | | | | | | | | | | | | | | | | | | | | | |
Return on average common equity (GAAP) | | | 8.31 | % | | -11.78 | % | | 4.15 | % | | 8.26 | % | | 8.70 | % | | 1.41 | % | | 7.76 | % |
Effect to adjust for securities gains | | | 0.00 | % | | 0.00 | % | | 0.00 | % | | 0.00 | % | | -0.06 | % | | 0.00 | % | | -0.12 | % |
Effect to adjust for PCL - NonPCD loans & unfunded commitments | | | 0.00 | % | | 12.79 | % | | 0.00 | % | | 0.00 | % | | 0.00 | % | | 3.77 | % | | 0.00 | % |
Effect to adjust for pension plan termination expense, net of tax | | | 0.00 | % | | 0.00 | % | | 0.00 | % | | 0.00 | % | | 0.00 | % | | 0.00 | % | | 0.43 | % |
Effect to adjust for FHLB prepayment penalty, net of tax | | | 0.00 | % | | 0.02 | % | | 0.00 | % | | 0.00 | % | | 0.00 | % | | 0.01 | % | | 0.01 | % |
Effect to adjust for merger & branch consol./acq expenses, net of tax | | | 1.52 | % | | 4.32 | % | | 0.60 | % | | 0.21 | % | | 0.00 | % | | 2.13 | % | | 0.14 | % |
Effect to adjust for intangible assets | | | 7.31 | % | | 4.88 | % | | 4.70 | % | | 7.70 | % | | 7.87 | % | | 6.26 | % | | 7.49 | % |
Adjusted return on average common tangible equity (non-GAAP) | | | 17.14 | % | | 10.23 | % | | 9.45 | % | | 16.17 | % | | 16.51 | % | | 13.58 | % | | 15.71 | % |
| | | | | | | | | | | | | | | | | | | | | | |
Adjusted efficiency ratio (5) | | | | | | | | | | | | | | | | | | | | | | |
Efficiency ratio | | | 61.39 | % | | 80.52 | % | | 62.11 | % | | 61.64 | % | | 58.40 | % | | | | | | |
Effect to adjust for merger and branch consolidation related expenses | | | -5.61 | % | | -18.61 | % | | -2.39 | % | | -0.91 | % | | 0.00 | % | | | | | | |
Adjusted efficiency ratio | | | 55.78 | % | | 61.91 | % | | 59.72 | % | | 60.73 | % | | 58.40 | % | | | | | | |
| | | | | | | | | | | | | | | | | | | | | | |
Tangible Book Value Per Common Share (5) | | | | | | | | | | | | | | | | | | | | | | |
Book value per common share (GAAP) | | $ | 64.34 | | $ | 63.35 | | $ | 69.40 | | $ | 70.32 | | $ | 69.34 | | | | | | | |
Effect to adjust for intangible assets | | | (24.51) | | | (25.02) | | | (31.39) | | | (31.19) | | | (31.14) | | | | | | | |
Tangible book value per common share (non-GAAP) | | $ | 39.83 | | $ | 38.33 | | $ | 38.01 | | $ | 39.13 | | $ | 38.20 | | | | | | | |
| | | | | | | | | | | | | | | | | | | | | | |
Tangible Equity-to-Tangible Assets (5) | | | | | | | | | | | | | | | | | | | | | | |
Equity-to-assets (GAAP) | | | 12.07 | % | | 11.91 | % | | 13.95 | % | | 14.90 | % | | 14.92 | % | | | | | | |
Effect to adjust for intangible assets | | | -4.24 | % | | -4.35 | % | | -5.80 | % | | -6.02 | % | | -6.11 | % | | | | | | |
Tangible equity-to-tangible assets (non-GAAP) | | | 7.83 | % | | 7.56 | % | | 8.15 | % | | 8.88 | % | | 8.81 | % | | | | | | |
Footnotes to tables:
| (1) | Loan data excludes mortgage loans held for sale. |
| (2) | The dividend payout ratio is calculated by dividing total dividends paid during the period by the total net income for the same period. |
| (3) | Adjusted earnings, adjusted return on average assets, and adjusted return on average equity are non-GAAP measures and exclude the after-tax effect of gains on acquisitions, gains or losses on sales of securities, and merger and branch consolidation related expense. Management believes that non-GAAP adjusted measures provide additional useful information that allows readers to evaluate the ongoing performance of the company. Non-GAAP measures should not be considered as an alternative to any measure of performance or financial condition as promulgated under GAAP, and investors should consider the company’s performance and financial condition as reported under GAAP and all other relevant information when assessing the performance or financial condition of the company. Non-GAAP measures have limitations as analytical tools, and investors should not consider them in isolation or as a substitute for analysis of the company’s results or financial condition as reported under GAAP. Adjusted earnings and the related adjusted return measures (non-GAAP) exclude the following from net income (GAAP) on an after-tax basis: (a) pre-tax merger and branch consolidation related expense of $21.7 million, $40.3 million, $4.1 million, and $1.5 million, for the quarters ended September 30, 2020, June 30, 2020, March 31, 2020, and December 31, 2019, respectively; (b) securities (losses) gains, net of $15,000, $24,000, and $437,000, for the quarters ended September 30, 2020, December 31, 2019, and September 30, 2019, respectively; and (c) FHLB prepayment penalty of $199,000 for the quarter ended June 30, 2020. |
| (4) | September 30, 2020 ratios are estimated and may be subject to change pending the final filing of the FR Y-9C; all other periods are presented as filed. |
| (5) | The tangible measures are non-GAAP measures and exclude the effect of period end or average balance of intangible assets. The tangible returns on equity and common equity measures also add back the after-tax amortization of intangibles to GAAP basis net income. Management believes that these non-GAAP tangible measures provide additional useful information, particularly since these measures are widely used by industry analysts for companies with prior merger and acquisition activities. Non-GAAP measures should not be considered as an alternative to any measure of performance or financial condition as promulgated under GAAP, and investors should consider the company’s performance and financial condition as reported under GAAP and all other relevant information when assessing the performance or financial condition of the company. Non-GAAP measures have limitations as analytical tools, and investors should not consider them in isolation or as a substitute for analysis of the company’s results or financial condition as reported under GAAP. The sections titled "Reconciliation of Non-GAAP to GAAP" provide tables that reconcile non-GAAP measures to GAAP. |
| (6) | Includes loan accretion (interest) income related to the discount on acquired loans of $22.4 million, $10.1 million, $10.9 million $7.4 million, and $8.1 million, respectively, during the five quarters above. |
| (7) | Adjusted efficiency ratio is calculated by taking the noninterest expense excluding branch consolidation cost and merger cost, pension plan termination and the FHLB prepayment penalty divided by net interest income and noninterest income excluding securities gains (losses). |
Cautionary Statement Regarding Forward Looking Statements
Statements included in this communication, which are not historical in nature are intended to be, and are hereby identified as, forward looking statements for purposes of the safe harbor provided by Section 27A of the Securities Act of 1933 and Section 21E of the Securities Exchange Act of 1934. Forward looking statements are based on, among other things, management’s beliefs, assumptions, current expectations, estimates and projections about the financial services industry, the economy and South State. Words and phrases such as “may,” “approximately,” “continue,” “should,” “expects,” “projects,” “anticipates,” “is likely,” “look ahead,” “look forward,” “believes,” “will,” “intends,” “estimates,” “strategy,” “plan,” “could,” “potential,” “possible” and variations of such words and similar expressions are intended to identify such forward-looking statements. South State cautions readers that forward looking statements are subject to certain risks, uncertainties and assumptions that are difficult to predict with regard to, among other things, timing, extent, likelihood and degree of occurrence, which could cause actual results to differ materially from anticipated results. Such risks, uncertainties and assumptions, include, among others, the following: (1) economic downturn risk, potentially resulting in deterioration in the credit markets, greater than expected noninterest expenses, excessive loan losses and other negative consequences, which risks could be exacerbated by potential negative economic developments resulting from federal spending cuts and/or one or more federal budget-related impasses or actions; (2) controls and procedures risk, including the potential failure or circumvention of our controls and procedures or failure to comply with regulations related to controls and procedures; (3) potential deterioration in real estate values; (4) the impact of competition with other financial institutions, including pricing pressures (including those resulting from the CARES Act) and the resulting impact, including as a result of compression to net interest margin; (5) credit risks associated with an obligor’s failure to meet the terms of any contract with the bank or otherwise fail to perform as agreed under the terms of any loan-related document; (6) interest risk involving the effect of a change in interest rates on the bank’s earnings, the market value of the bank’s loan and securities portfolios, and the market value of South State’s equity; (7) liquidity risk affecting the bank’s ability to meet its obligations when they come due; (8) risks associated with an anticipated increase in South State’s investment securities portfolio, including risks associated with acquiring and holding investment securities or potentially determining that the amount of investment securities South State desires to acquire are not available on terms acceptable to South State; (9) price risk focusing on changes in market factors that may affect the value of traded instruments in “mark-to-market” portfolios; (10) transaction risk arising from problems with service or product delivery; (11) compliance risk involving risk to earnings or capital resulting from violations of or nonconformance with laws, rules, regulations, prescribed practices, or ethical standards; (12) regulatory change risk resulting from new laws, rules, regulations, accounting principles, proscribed practices or ethical standards, including, without limitation, the possibility that regulatory agencies may require higher levels of capital above the current regulatory-mandated minimums and including the impact of the recently enacted CARES Act, the Consumer Financial Protection Bureau rules and regulations, and the possibility of changes in accounting standards, policies, principles and practices, including changes in accounting principles relating to loan loss recognition (CECL); (13) strategic risk resulting from adverse business decisions or improper implementation of business decisions; (14) reputation risk that adversely affects earnings or capital arising from negative public opinion; (15) terrorist activities risk that results in loss of consumer confidence and economic disruptions; (16) cybersecurity risk related to the dependence of South State on internal computer systems and the technology of outside service providers, as well as the potential impacts of third party security breaches, subjects each company to potential business disruptions or financial losses resulting from deliberate attacks or unintentional events; (17) greater than expected noninterest expenses; (18) noninterest income risk resulting from the effect of regulations that prohibit financial institutions from charging consumer fees for paying overdrafts on ATM and one-time debit card transactions, unless the consumer consents or opts‑in to the overdraft service for those types of transactions; (19) excessive loan losses; (20) failure to realize synergies and other financial benefits from, and to limit liabilities associated with, the merger with CSFL within the expected time frame, and ownership dilution risk associated with potential acquisitions in which South State’s stock may be issued as consideration for an acquired company; (21) potential deposit attrition, higher than expected costs, customer loss and business disruption associated with the merger with CSFL integration, including, without limitation, and potential difficulties in maintaining relationships with key personnel; (22) the risks of fluctuations in market prices for South State common stock that may or may not reflect economic condition or performance of South State; (23) the payment of dividends on South State common stock is subject to regulatory supervision as well as the discretion of the board of directors of South State, South State’s performance and other factors; (24) operational, technological, cultural, regulatory, legal, credit and other risks associated with the exploration, consummation and integration of potential future acquisition, whether involving stock or cash consideration; (25) major catastrophes such as earthquakes, floods or other natural or human disasters, including infectious disease outbreaks, including the recent outbreak of the COVID-19 coronavirus, and the related disruption to local, regional and global economic activity and financial markets, and the impact that any of the foregoing may have on South State and its customers and other constituencies; and (26) other risks related to the merger of South State and CSFL including, among others, (i) the risk that the cost savings and any revenue synergies from the merger may not be fully realized or may take longer than anticipated to be realized, (ii) the risk that the integration of each party’s operations will be materially delayed or will be more costly or difficult than expected or that the parties are otherwise unable to successfully integrate each party’s businesses into the other’s businesses, (iii) the amount of the costs, fees, expenses and charges related to the merger, (iv) reputational risk and the reaction of each company’s customers, suppliers, employees or other business partners to the merger, and (27) other factors that may affect future results of South State and CenterState, as disclosed in South State’s Annual Report on Form 10-K, as amended, Quarterly Reports on Form 10-Q, and Current Reports on Form 8-K, and CenterState’s Annual Report on Form 10-K, Quarterly Reports on Form 10-Q, and Current Reports on Form 8-K, in each case filed by South State or CenterState, as applicable, with the U.S. Securities and Exchange Commission (“SEC”) and available on the SEC’s website at http://www.sec.gov, any of which could cause actual results to differ materially from future results expressed, implied or otherwise anticipated by such forward-looking statements.
All forward-looking statements speak only as of the date they are made and are based on information available at that time. South State does not undertake any obligation to update or otherwise revise any forward-looking statements, whether as a result of new information, future events, or otherwise, except as required by federal securities laws. As forward-looking statements involve significant risks and uncertainties, caution should be exercised against placing undue reliance on such statements.
Exhibit 99.2
| Earnings Call 3Q 2020 Friday, October 30, 2020 Exhibit 99.2 |

| 2 Disclaimer Statements included in this communication, whic h are not historical in nature are intended to be, and are hereby identif ied as, forward looking statements for purposes of the safe harbor prov ided by Section 27A of the Securities Act of 1933 and Section 21E of the S ecurities Exchange Act of 1934. Forward looking statements are based on, among other things, management’s beliefs, assum ptions, current expectations, estimates and projections about the financial services industry, the economy and South State. Words and phrases such as “may,” “approximately,” “continue,” “should,” “expects,” “proj ects,” “anticipates,” “is likely,” “look ahead,” “look forward,” “believ es,” “will,” “intends, ” “estimates, ” “strategy,” “plan,” “c ould,” “potential,” “possible” and variations of such words and similar expressions are intended to identify such forward- looking statements. South S tate cautions readers that forward looking statements are subject to certain risks, uncertainties and assumptions that are difficult to predict w ith regard to, among other things, tim ing, extent, likelihood and degree of occurrence, which c ould cause actual results to differ materially from anticipated results. Such risks, uncertainties and assumptions, include, among others, the following:(1) economic downturn risk, potentially resulting in deterioration in the credit markets, greater than expected noninterest expenses, excessiv e loan losses and other negative consequences, w hich risks could be exacerbated by potential negativ e economic developments resulting from federal spending cuts and/or one or more federal budget-related impasses or actions;(2) controls and procedures risk, including the potential failure or circumvention of our controls and procedures orfailure to comply with regulations related to controls and procedures;(3) potential deterioration in real estate values;(4) the impact of competition with other financial institutions, including pricing pressures (including those resulting from the CARES Act) and the resulting impact, including as a result of compression to net interest margin;(5) credit risks associated with an obligor’s failure to meet the terms of any contract w ith the bank or otherwise fail to perform as agreed under the terms of any loan-related document;(6) interest risk involv ing the effect of a change in interest rates on the bank’s earnings, the market value of the bank’s loan and securities portf olios, and the market value of South State’s equity;(7) liquidity risk affecting the bank’s ability to meet its obligations when they come due;(8) risks assoc iated w ith an anticipated increase in South S tate’s investm ent securities portfolio, including risks associated w ith acquiring and holding investment securities or potentially determining that the amount of investment securities South State desires to ac quire are not av ailable on terms acceptable to South State;(9) price risk focusing on changes in market factors that may aff ect the value of traded instruments in “mark- to-market” portfolios;(10) transaction risk arising from problems with service or produc t deliv ery;(11) compliance risk involving risk to earnings or capital resulting from violations of or nonconformance with laws, rules, regulations, prescribed practices, or ethical standards;(12) regulatory change risk resulting from new law s, rules, regulations, accounting principles, proscribed practic es or ethical standards, including, without limitation, the possibility that regulatory agencies may require higher lev els of capital above the current regulatory-mandated minimums and including the impact of the recently enacted CARES Act, the C onsumer Financial Protection Bureau rules and regulations, and the possibility of changes in accounting standards, policies, principles and practices, including changes in accounting principles relating to loan loss rec ognition (CECL);(13) strategic risk resulting from adv erse business decisions or improper implementation of business decisions;(14) reputation risk that adversely affects earnings orcapital arising from negativ e public opinion; (15) terrorist activities risk that results in loss of consumer c onfidence and economic disruptions;(16) cy bersecurity risk related to the dependenc e of South S tate on internal computer systems and the technology of outside service providers, asw ell as the potential impacts of third party security breac hes, subj ects each c ompany to potential business disruptions orfinancial losses resulting from deliberate attacks or unintentional events;(17) greater than expected noninterest expenses;(18) noninterest inc ome risk resulting from the effect of regulations that prohibit financial institutions from charging consumer fees for paying ov erdrafts on ATM and one-time debit card transactions, unless the consum er consents or opts-in to the overdraft service for those ty pes of transactions;(19) excessive loan losses;(20) failure torealize synergies and other financial benefits from, and to lim it liabilities associated w ith, the merger with CSFL w ithin the expected time frame, and ownership dilution risk associated w ith potential acquisitions inw hich South State’s stock may be issued as consideration for an acquired company;(21) potential deposit attrition, higher than expec ted costs, custom er loss and business disruption associated w ith the merger w ith CSFL integration, including, without limitation, and potential difficulties in maintaining relationships with key personnel;(22) the risks of fluctuations in market prices for South S tate common stock that may or may not reflect economic condition or performance of South State;(23) the payment of div idends on South State c ommon stock is subject to regulatory supervision as well as the discretion of the board of directors of South State, South State’s performance and other factors;(24) operational, technological, cultural, regulatory, legal, credit and other risks associated w ith the exploration, consummation and integration of potential future acquisition, whether involving stock or cash consideration;(25) maj or catastrophes such as earthquakes, floods or other natural or human disasters, including infectious disease outbreaks, including the recent outbreak of the COVID-19coronavirus, and the related disruption to local, regional and global economic activity and financial markets, and the impact that any of the foregoing may have on South State and its customers and other constituencies; and (26) other risks related to the merger of South State and CSFL including, among others, (i) the risk that the cost savings and any revenue synergies from the merger may not be fully realiz ed or may take longer than anticipated to be realized, (ii) the risk that the integration of each party’s operations will bematerially delayed or will be more c ostly or difficult than expected or that the parties are otherwise unable to successfully integrate each party’s businesses into the other’s businesses, ( iii) the amount of the costs, fees, expenses and charges related to the merger, (iv) reputational risk and the reaction of each company's c ustom ers, suppliers, employees or other business partners to the merger, and (27) other factors that may affect f uture results of South State and CenterState, as disclosed in S outh S tate’ s Annual Report on Form 10-K, as amended, Quarterly Reports on Form 10-Q, and Current Reports on Form 8-K, and CenterS tate’s Annual Report on Form 10-K, Quarterly Reports on Form 10-Q, and Current Reports on Form 8-K, in eac h case filed by South State or CenterState, as applicable, with the U.S. Sec urities and Exchange C ommission (“SEC”) and available on the SEC’s website at http://w ww.sec.gov, any of which could cause actual results to differ materially from future results expressed, implied or otherwise anticipated by such forward-looking statements. All forward-looking statements speak only as of the date they are made and are based on inf ormation available at that tim e. South State does not undertake any obligation to update or otherwise revise any forward- looking statements, whether as a result of new information, future events, or otherw ise, except as required by federal securities laws. As forward-looking statements inv olve significant risks and uncertainties, caution should be exercised against placing undue reliance on such statements. The com bined historical information referred to in this presentation asthe “Combined Business Basis” is presented based on the reported GAAP results of the Company and CenterState f or the applicable periods without adjustment. The Combined Business Basis financial information included in this release has not been prepared in accordance with Article 11 of Regulation S-X, and therefore does not reflect any of the pro forma adjustments that would be required thereby. All Combined Business Basis f inancial information should be reviewed in connection the historical inf ormation of the C ompany and C enterState, as applicable, inc luded in the Appendix to this presentation. |
| 3 South State Corporation Winter Haven Tampa Orlando Charleston Atlanta Charlotte Richmond SSB (305) –$38B in assets –$25B in loans –$30B in deposits –$4.1B market cap Overview of Franchise(1) (1) Financial metrics as of September 30, 2020; market cap as of October 28, 2020 |
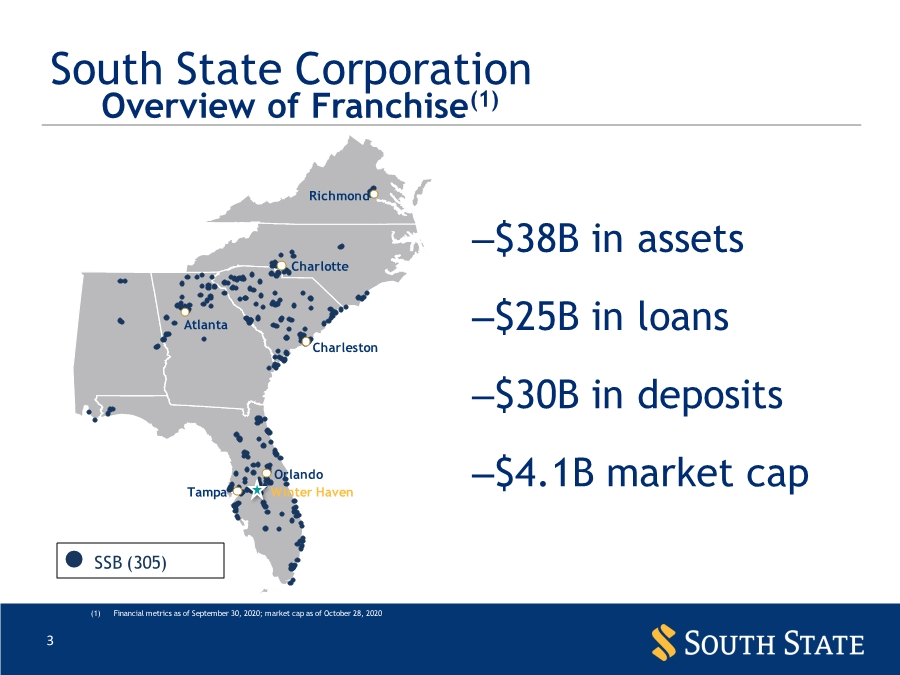
| 4 How We Operate the Company Soundness Profitability Growth |
| 5 Quarterly Highlights • Returns – Adjusted & reported diluted Earnings per Share (“EPS”)(1) of $1.58 and $1.34, respectively – 17.1% adjusted Return on Average Tangible Common Equity (“ROATCE”)(1) – 1.79% PPNR ROAA(2); Strong Pre-Provision Net Revenue (“PPNR”)(2) of $170 million – Tangible Book Value per Share (“TBVPS”)(1) of $39.83, up $1.50 from 2Q 2020 • Performance – Record revenue of $385 million – Net Interest Margin (“NIM”, tax equivalent)(1) of 3.22%, down 2 bps from 2Q 2020 – Record noninterest income of $115 million driven by increase in mortgage banking income – Adjusted efficiency ratio(1) of 55.8% compared to 61.9% in 2Q 2020 • Balance Sheet/Credit – Strong allowance for credit losses (2.11% including reserve for unfunded commitments) and loss absorption capacity (2.58%)(3) – Strong capital levels, with CET1 of 11.5% and Total Risk-Based capital ratio of 13.9% – Minimal credit losses, with 0.01% net charge-offs – Loan deferrals of $452 million, or 1.98% of the total loan portfolio(4) as of October 23, 2020 • 1.03% on full payment deferral, 0.95% paying interest (1) The tangible measures are non-GAAP measures and exclude the effect of period end or average balance of intangible assets. The tangible returns on equity and common equity measures also add back the after-tax amortization of intangibles to GAAP basis net income; Tax equivalent NIM and adjusted efficiency ratio are also non-GAAP financial measures; Adjusted Efficiency Ratio excludes the impact of merger-related expenses, securities gains or losses and FHLB Advances prepayment penalty - See reconciliation of GAAP to Non-GAAP measures in Appendix (2) Adjusted PPNR and PPNR ROAA are Non-GAAP financial measure that exclude the impact of merger-related expenses and securities gains or losses - See reconciliation of GAAP to Non-GAAP measures in Appendix (3) Percentages exclude PPP loans and loan held for sale; loss absorption capacity Includes mark on CSFL loans and prior SSB acquisitions (4) Excludes loans held for sale and PPP loans |
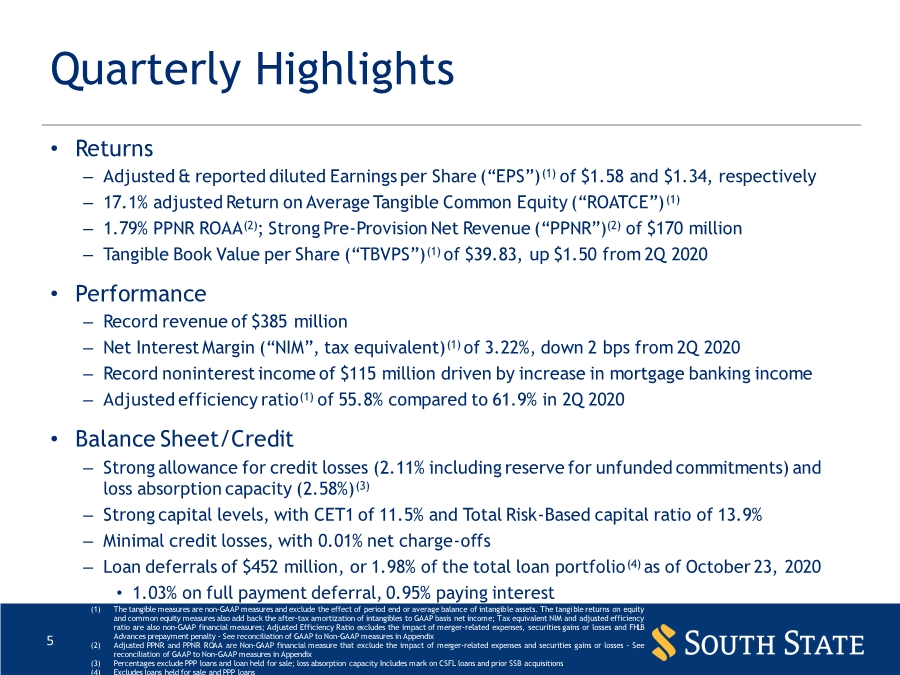
| 6 Current & Historical (combined business basis) Pre-Provision Net Revenue (“PPNR”)(1) Dollars in millions (1) Adjusted PPNR is a Non-GAAP financial measure that excludes the impact of branch consolidation, merger-related expenses, securities gains or losses, FHLB Advances prepayment penalty ($199 thousand) and pension plan termination expenses - See reconciliation of GAAP to Non-GAAP measures in Appendix * The c ombined historical informa tion referred to in thi s presenta tion as the “Combined Business Ba sis” presented is ba sed on the reported GAAP results of the Company and CenterSta te for the applica ble periods without adjustments a nd the inform ation included in this relea se has not been prepa red in ac cordance with Articl e 11 of Regula tion S-X, and therefore does not refl ect any of the pro forma adjustm ents that would be required thereby . All Combined Business Ba sis fina ncial inform ation sho uld be reviewed in connection the historical information of the Compa ny and CenterState, as applicable, included in the Appendix to this presentation. $162 $159 $158 $157 $170 $- $50 $100 $150 $200 3Q19* 4Q19* 1Q20* 2Q20* 3Q20 $ in millions |
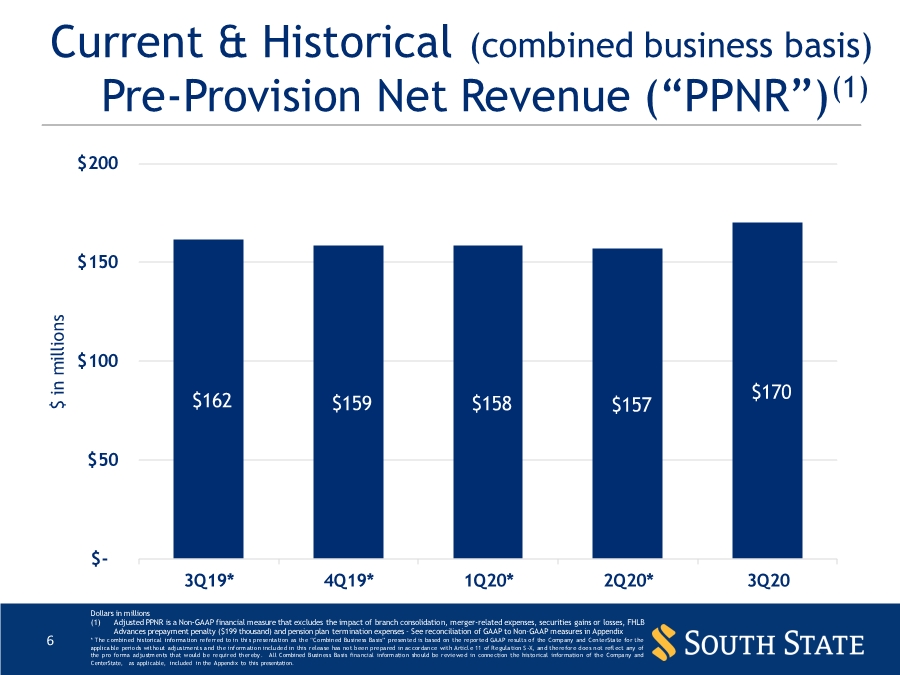
| 7 Tangible Book Value per Share(1) $38.20 $39.13 $38.01 $38.33 $39.83 3Q19 4Q19 1Q20 2Q20 3Q20 (1) The tangible measures are non-GAAP measures and exclude the effect of period end or average balance of intangible assets - See reconciliation of GAAP to Non- GAAP measures in Appendix |
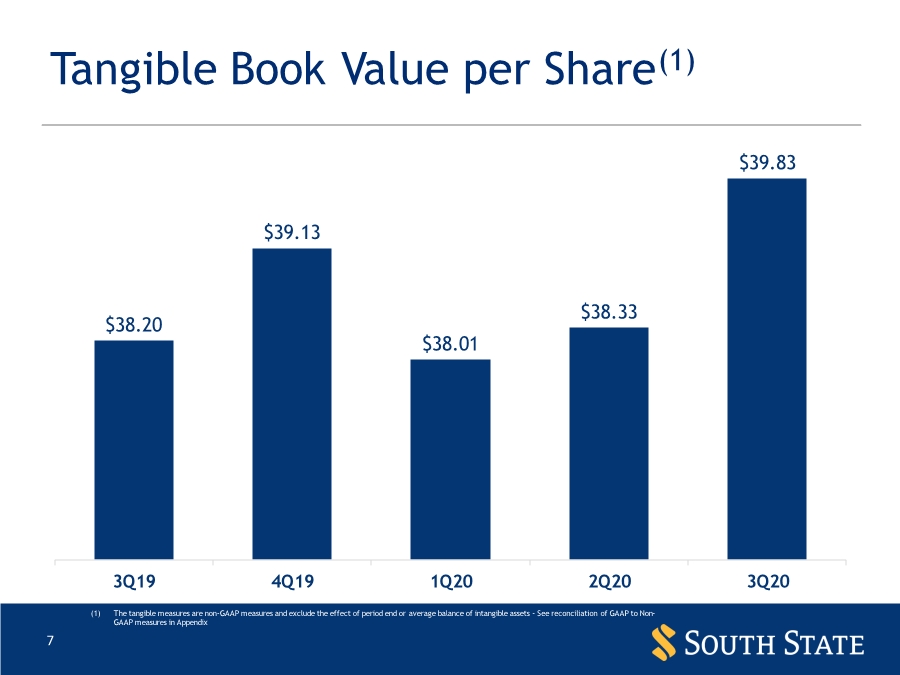
| 8 Loss Absorption Capacity – September 30,2020 Dollars in millions (1) Excludes PPP loans and loan held for sale (2) Includes mark on CSFL loans and prior SSB acquisitions 3Q20 % of Total Loans (1) Allowance for Credit Losses (“ACL”) Non-PCD ACL $286.5 PCD ACL 153.7 Total ACL $440.2 1.92% Reserve for Unfunded Commitments Reserve for unfunded commitments $43.2 0.19% Total ACL plus Reserve for Unfunded Commitments $483.3 2.11% Unrecognized Discount – Acquired Loans(2) $110.4 0.48% Total Loss Absorption Capacity $593.7 2.58% Total Loans Held for Investment(1) $22,886 |
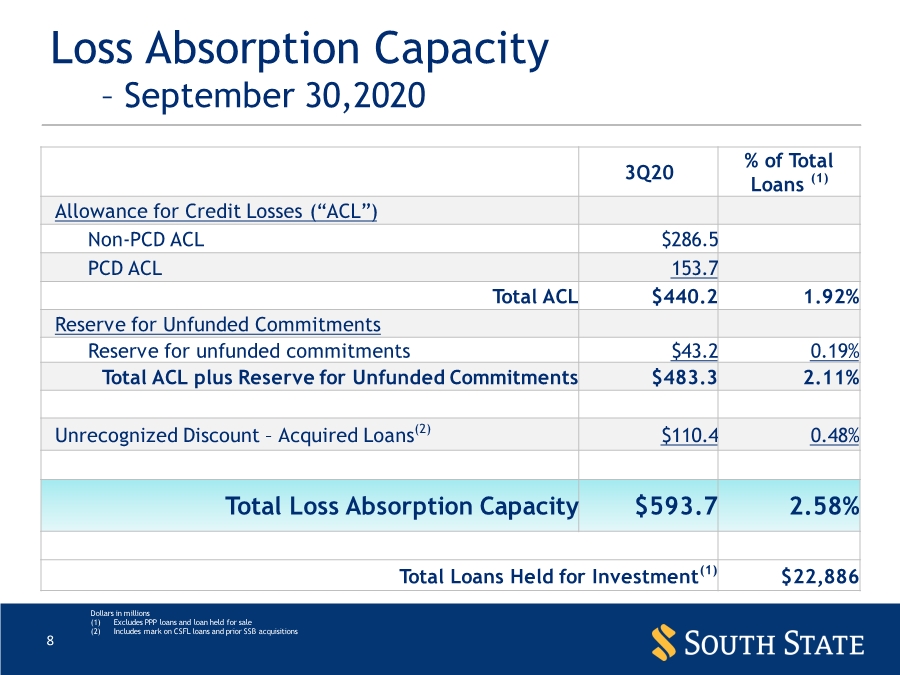
| 9 Asset Quality (combined business basis) Dollars in millions, unless otherwise noted (1) Excludes loans held for sale and PPP loans ** Booked deferrals as of October 23, 2020 * The com bined historical informa tion referred to in this presentation as the “Com bined Business Basis” presented is based on the reported GAAP results of the Compa ny a nd CenterS tate for the applica ble periods without adjustments a nd the inform ation included in this relea se has not been prepa red in ac cordance with Articl e 11 of Regula tion S-X, and therefore does not refl ect any of the pro forma adjustm ents that would be required thereby . All Combined Business Ba sis fina ncial inform ation sho uld be reviewed in connection the historical information of the Compa ny and CenterState, as applicable, included in the Appendix to this presentation. 0.07% 0.10% 0.05% 0.01% 0.01% 0.00% 0.03% 0.06% 0.09% 0.12% 0.15% 3Q19* 4Q19* 1Q20* 2Q20* 3Q20 Net Charge Off to Loans 2.27% 2.18% 2.06% 2.13% 3.37% 1.14% 1.17% 1.10% 1.23% 2.08% 1.13% 1.01% 0.96% 0.94% 1.29% 0.0% 1.0% 2.0% 3.0% 4.0% 5.0% 3Q19* 4Q19* 1Q20* 2Q20 3Q20 Criticized & Classified Asset Trends Combined Special Mention / Assets Substandard / Assets $4,107 $2,538 $1,305 $930 $452 17% 10% 6% 4% 2% 0% 5% 10% 15% 20% $- $1,000 $2,000 $3,000 $4,000 $5,000 $6,000 Jun-20 Jul-20 Aug-20 Sep-20 Oct-20** $ in millions Loan Deferrals(1) Total Active Deferrals % of Total Loans* 0.25% 0.26% 0.44% 0.38% 0.33% 0.00% 0.20% 0.40% 0.60% 0.80% 1.00% 3Q19* 4Q19* 1Q20* 2Q20 3Q20 Non Accruals & OREO/OAO to Assets |
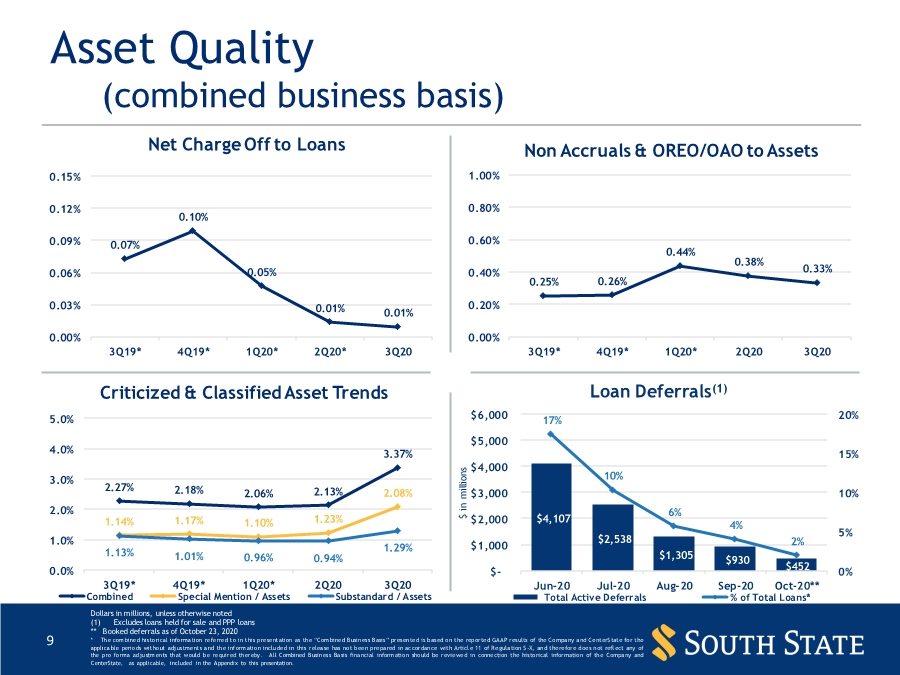
| 10 Capital Ratios (1) Preliminary * The tangible measures are non-GAAP measures and exclude the effect of period end balance of intangible assets - See reconciliation of GAAP to Non-GAAP measures in Appendix 2Q20 3Q20(1) Tangible Common Equity* 7.6% 7.8% Tier 1 Leverage 13.3% 8.1% Tier 1 Common Equity 10.7% 11.5% Tier 1 Risk-Based Capital 10.7% 11.5% Total Risk-Based Capital 12.9% 13.9% Bank CRE Concentration Ratio 253% 236% Bank CDL Concentration Ratio 61% 54% |
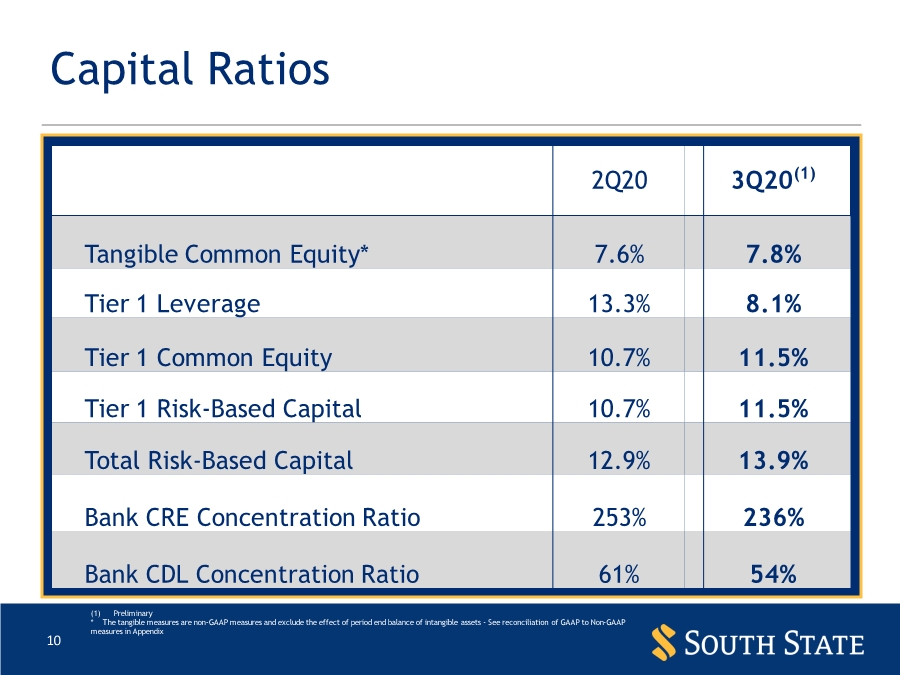
| 11 Merger-Related Expenses/Deal Costs(1) • System conversion scheduled for 2Q 2021 • Cost save realization process on track • Estimated $205 million total spend; $102.5 million remaining Dollars in thousands, unless otherwise noted (1) Only includes SSB/CSFL merger-related expenses (2) Merger-related expense occurred pre-merger CSFL(2) SSB Total MRE 1Q20 $ 3,076 $ 4,114 $ 7,190 4/1-6/7 33,526 33,526 2Q20 40,229 40,229 3Q20 21,574 21,574 YTD $ 36,602 $ 65,917 $ 102,519 |
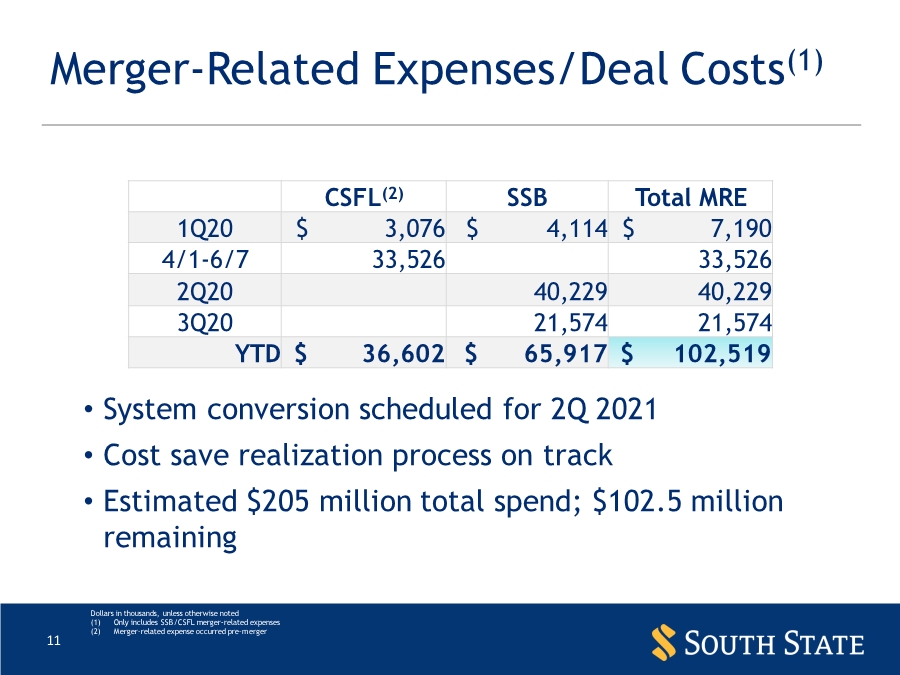
| Financial Highlights - Reported |

| 13 2Q20 3Q20 GAAP Net Income (Loss) $(84.9) $95.2 EPS (Diluted) $(1.96) $1.34 Return on Average Assets (1.49)% 1.00% Non-GAAP* Return on Average Tangible Common Equity (19.71)% 14.66% Non-GAAP, Adjusted* Net Income $38.6 $112.6 EPS (Diluted) $0.89 $1.58 Return on Average Assets 0.68% 1.18% Return on Average Tangible Common Equity 10.23% 17.14% Cash dividend per common share $0.47 $0.47 Highlights – Linked Quarter Dollars in millions, except per share data * The tangible measures are non-GAAP measures and exclude the effect of period end or average balance of intangible assets. The tangible returns on equity and common equity measures also add back the after-tax amortization of intangibles to GAAP basis net income; other adjusted figures presented are also Non-GAAP financial measures that exclude the impact of merger-related expenses, provision for credit losses for Non-PCD loans and unfunded commitments and FHLB prepayment penalty - See reconciliation of GAAP to Non-GAAP measures in Appendix |
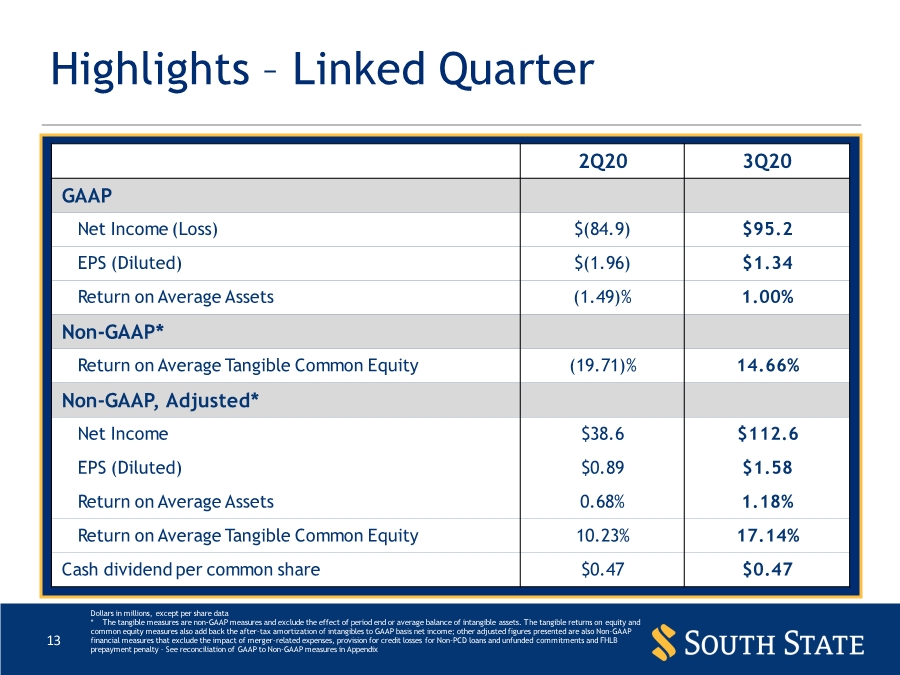
| 14 Net Interest Margin Dollars in millions * Tax equivalent Tax equivalent NIM is Non-GAAP financial measures - See reconciliation of GAAP to Non-GAAP measures in Appendix 3.73% 3.64% 3.68% 3.24% 3.22% $127.4 $126.5 $128.0 $162.6 $270.3 0.00% 1.00% 2.00% 3.00% 4.00% 5.00% 6.00% 7.00% 8.00% 9.00% 10.00% $- $10.0 $20.0 $30.0 $40.0 $50.0 $60.0 $70.0 $80.0 $90.0 $100.0 $110.0 $120.0 $130.0 $140.0 $150.0 $160.0 $170.0 $180.0 $190.0 $200.0 $210.0 $220.0 $230.0 $240.0 $250.0 $260.0 $270.0 $280.0 $290.0 $300.0 3Q19 4Q19 1Q20 2Q20 3Q20 Net Interest Margin* Net Interest Income |
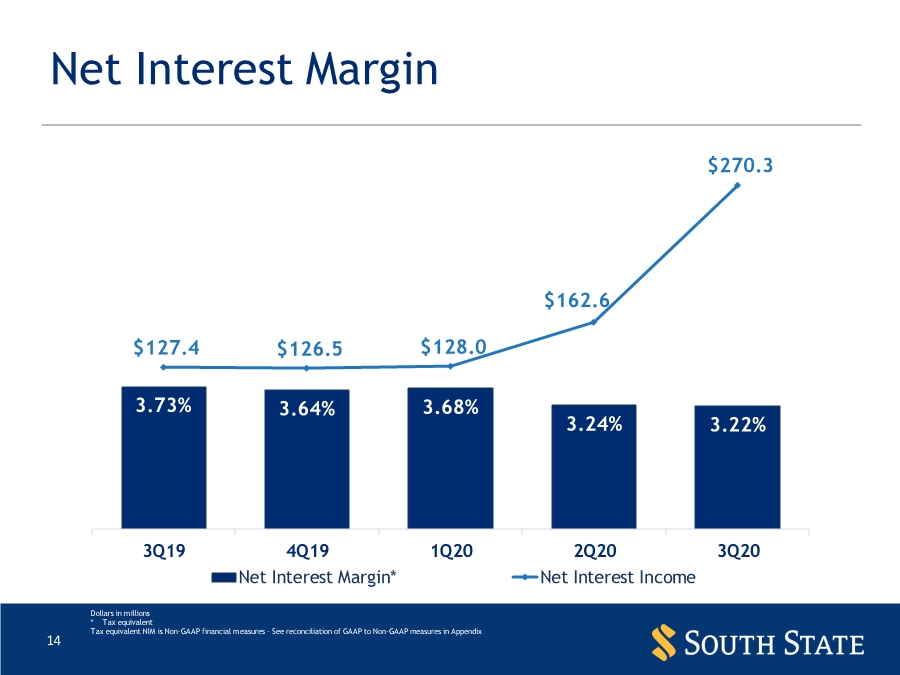
| 15 Correspondent Banking Division • Provides capital markets hedging (ARC), fixed income sales, international, clearing and other services to financial institutions • Recently announced expansion of Correspondent Banking Division with the agreement to acquire Duncan Williams, Inc. (terms not disclosed) - Broker Dealer founded in 1969 - Adds approximately 250 financial institution clients - Retention agreements with sales team representing 85% of revenues 695 Client Banks $- $5 $10 $15 $20 $25 $30 $35 3Q19 4Q19 1Q20 2Q20 3Q20 $ in millions Correspondent Revenue Breakout ARC Revenues FI Revenues Operational Revenues |
| 16 Mortgage Banking Division • Quarter-to-Date Production: 5,263 loans / $1.574 billion in volume • Secondary vs Portfolio – Secondary Gain on Sale Margin: 4.05% • Purchase vs Refinance • Pipeline as of September 30, 2020: 3,140 units / $993 million 3Q20 QTD Secondary $1.141 Billion / 70% of QTD volume Portfolio $433 Million / 30% of QTD volume 3Q20 QTD Purchase $951 Million / 60% of QTD volume Refinance $624 Million / 40% of QTD volume |
| Combined Business Basis Performance |

| 18 (1) Noninterest income and total revenue are adjusted by securities gains or losses; Tax equivalent NIM, efficiency ratio and adjusted efficiency ratio are Non- GAAP financial measures; Adjusted Efficiency Ratio excludes the impact of branch consolidation, merger-related expenses, securities gains or losses, FHLB Advances prepayment penalty, pension plan termination expenses and amortization expense on intangible assets (legacy CSFL only) – See Current & Historical Efficiency Ratio and Net Interest Margin in Appendix * The c ombined historical i nforma tion referred to in this presentation asthe “Combined Business Ba sis” presented is based on the repo rted GAAP results of the Com pa ny a nd CenterS tate for the applica ble periods without adjustm ents a nd the informa tion included in this relea se has not been prepa red in accordanc e with Article 11 of Regula tion S-X, a nd therefore does not reflec t a ny of the pro forma a djustm ents that would be required thereby. All Combined Business Ba sis fi nancial informa tion should be reviewed in connection the historical information of the Com pany and CenterState, as applicable, included in the Appendix to this presentation. 61% 58% 60% 80% 61% 55% 56% 57% 58% 56% 0% 15% 30% 45% 60% 75% 90% 3Q19* 4Q19* 1Q20* 2Q20* 3Q20 Efficiency Ratio Efficiency Ratio Adjusted Efficiency Ratio 3.96% 3.94% 3.94% 3.38% 3.22% 1.0% 1.5% 2.0% 2.5% 3.0% 3.5% 4.0% 4.5% $200 $220 $240 $260 $280 $300 3Q19* 4Q19* 1Q20* 2Q20* 3Q20 $ in millions Net Interest Margin NIM ($) NIM (%) Current & Historical 5-Qtr Performance(1) (combined business basis) 77% 77% 74% 72% 70% 23% 23% 26% 28% 30% $368M $371M $381M $383M $385M 0.65% 0.0% 0.5% 1.0% 1.5% 2.0% 2.5% 3.0% 0% 20% 40% 60% 80% 100% 120% 3Q19* 4Q19* 1Q20* 2Q20* 3Q20 Total Revenue ($MM) Revenue Composition NIM / Revenue Noninterest Income / Revenue Avg. 10-year UST $86 $87 $100 $108 $115 1.04% 1.04% 1.19% 1.16% 1.21% $0 $20 $40 $60 $80 $100 $120 $140 3Q19* 4Q19* 1Q20* 2Q20* 3Q20 0.7% 0.8% 0.9% 1.0% 1.1% 1.2% 1.3% $ in millions Noninterest Income Noninterest Income Noninterest Income / Avg Assets |
| 19 Dollars in billions (1) Excludes loans held for sale * The c ombined historic al informa tion referred to in this presentation asthe “Combined Business Ba sis” presented is based on the repo rted GAAP resul ts of the Company and CenterSta te for the applica ble periods without adjustm ents a nd the i nforma tion incl uded in this relea se ha s not been prepa red in acc ordanc e wi th Article 11 of Regul ation S-X, and therefore does not refl ect any of the pro forma a djustments that would be required thereby. All Combi ned Business Basis financial informa tion should be reviewed in c onnec tion the historic al informa tion of the Compa ny a nd CenterState, as applicable, included in the Appendix to this presentation. Current & Historical Trend (combined business basis) $3.8 $4.1 $4.4 $3.3 $3.7 $0.7 $0.7 $1.0 $4.0 $4.1 11.6% 12.4% 12.4% 8.7% 9.9% $0 $2 $4 $6 $8 $10 3Q19* 4Q19* 1Q20* 2Q20* 3Q20 0% 2% 4% 6% 8% 10% 12% 14% $ in billions Investments & Fed Funds Investments Fed Funds & Other Investments / Assets $0.4 $0.3 $1.0 $0.8 $0.6 $1.0 $0.9 $1.2 $0.7 $0.7 4.1% 3.5% 6.2% 4.0% 3.4% $0.0 $0.5 $1.0 $1.5 $2.0 $2.5 3Q19* 4Q19* 1Q20* 2Q20* 3Q20 0% 1% 2% 3% 4% 5% 6% 7% $ in billions Wholesale Funding Brokered Deposits FHLB Wholesale Funding / Assets $23.2 $23.4 $23.5 $23.2 $22.9 $2.3 $2.3 $23.2B $23.4B $23.5B $25.5B $25.2B $0 $5 $10 $15 $20 $25 $30 3Q19* 4Q19* 1Q20* 2Q20* 3Q20 $ in billions Loans HFI (1) Total Loans PPP $7.3 $7.4 $7.3 $9.9 $9.7 $4.4 $4.5 $4.6 $6.5 $6.7 $9.3 $9.5 $9.6 $9.7 $10.0 $4.1 $4.0 $3.9 $3.9 $3.6 $25.2B $25.4B $25.4B $30.0B $30.0B $0 $5 $10 $15 $20 $25 $30 $35 3Q19* 4Q19* 1Q20* 2Q20* 3Q20 $ in billions Deposits DDA NOW MMA & Savings CDs |
| 20 Branch Optimization 305 Branches 9/30/2020 20 Branches Consolidated or Sold 285 Branches 2020 YE 85 Branches Average Size $40M 420 Branches Acquired Plus 12 DeNovo Branches 212 Branches Consolidated or Sold 305 Branches Average Size $99M ~145% growth in deposits per branch 85 432 212 305 2009 …..………………...……………………………. September 2020 Announced 4th Quarter 2020 Activity |
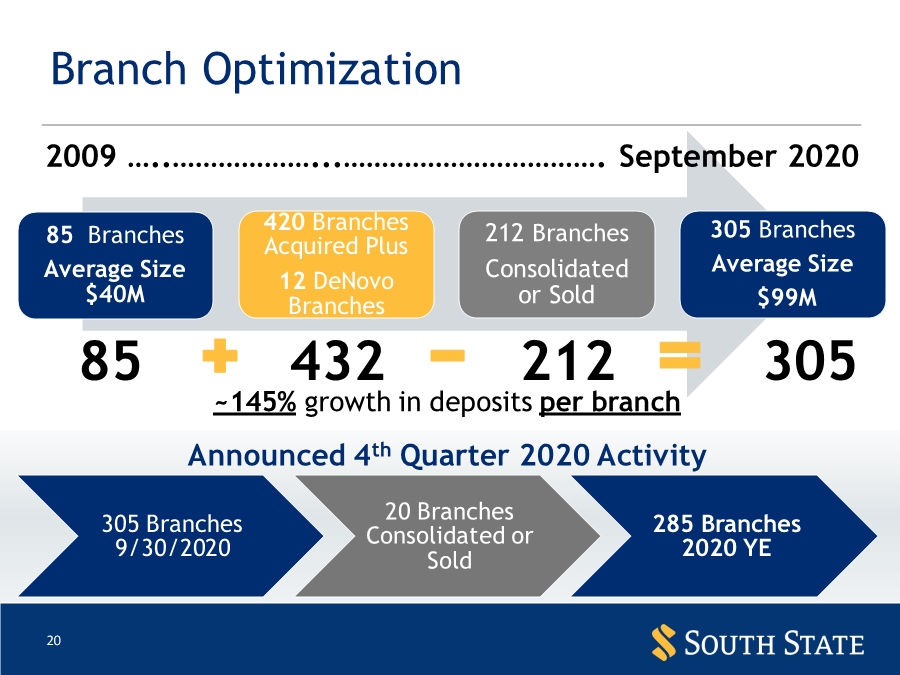
| Appendix |

| 22 Loans – Industry Exposures(1) Selected Industries (% of total loan portfolio) Lodging $973 4.2% Restaurants $497 2.2% Retail CRE $2,183 9.5% Dollars in millions, unless otherwise noted (1) Excludes loans held for sale and PPP loans Total Portfolio $22.9 Billion Commercial 56% Mortgage 21% Consumer 23% |
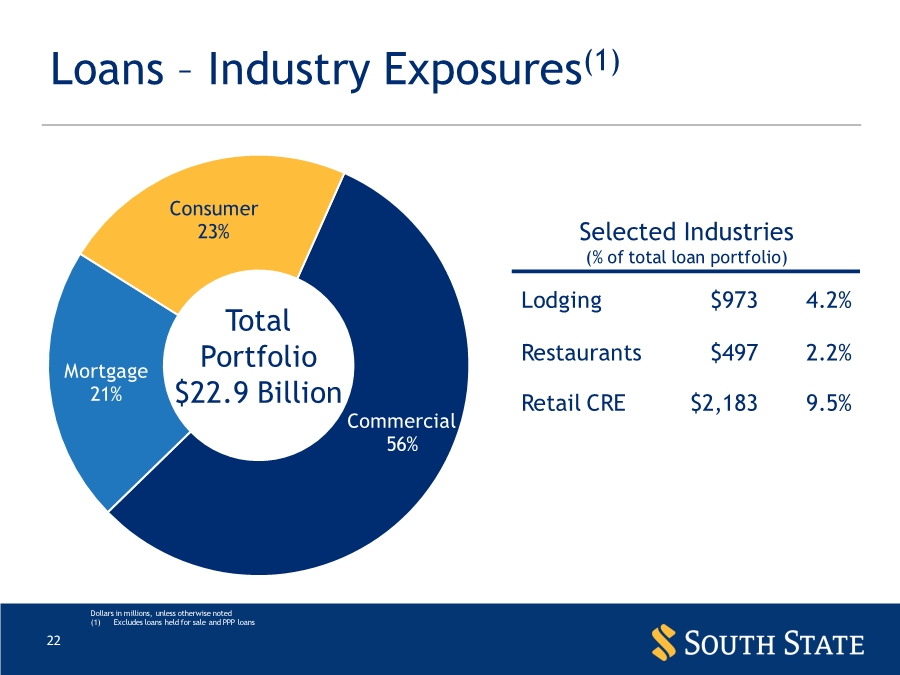
| 23 Lodging Portfolio • 55% weighted average loan to value • Lodging is $973 million or 4.2% of loan portfolio(1) • 12% of portfolio under deferral(2) • Top 3 MSA’s: Charleston, Greenville, Charlotte Dollars in millions (1) Loan portfolio excluding loans held for sale and PPP loans (2) Booked deferrals as of 10/23/20 Hilton $269 Marriott $252 Destination/ Resort $146 IHG $99 Choice $65 Wyndham $41 Hyatt $35 Other national brands $66 |
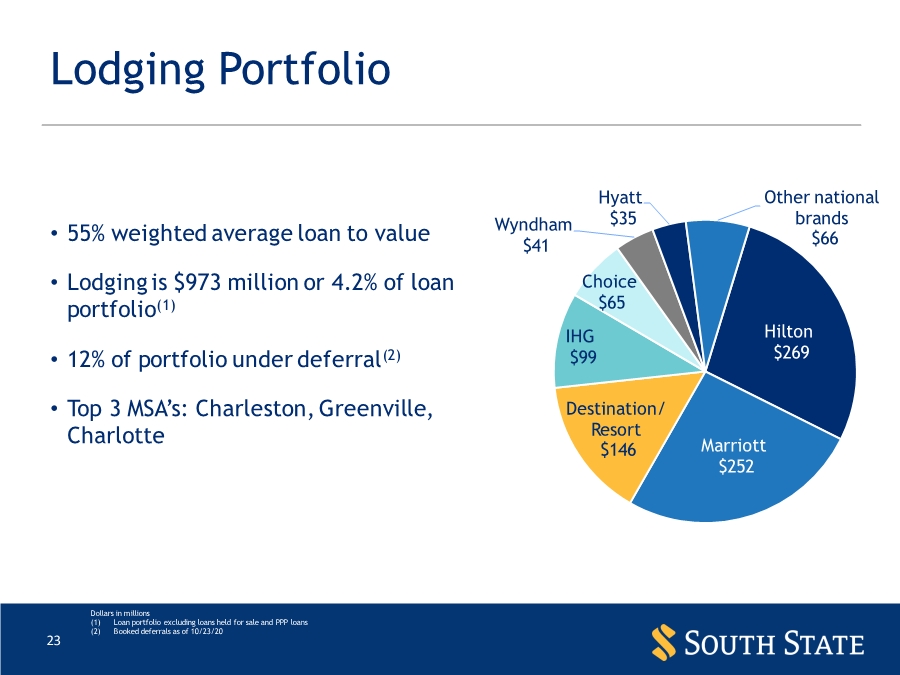
| 24 Restaurant Portfolio • 55% weighted average loan to value • Restaurant is $497 million or 2.2% of loan portfolio(1) • 2% of portfolio under deferral(2) • Top 3 MSA’s: Atlanta, Charleston, Jacksonville Dollars in millions (1) Loan portfolio excluding loans held for sale and PPP loans (2) Booked deferrals as of 10/23/20 Owner Occupied Real Estate $276 Non-Owner Occupied Real Estate $153 CDL $8 Non-RE Secured $60 |
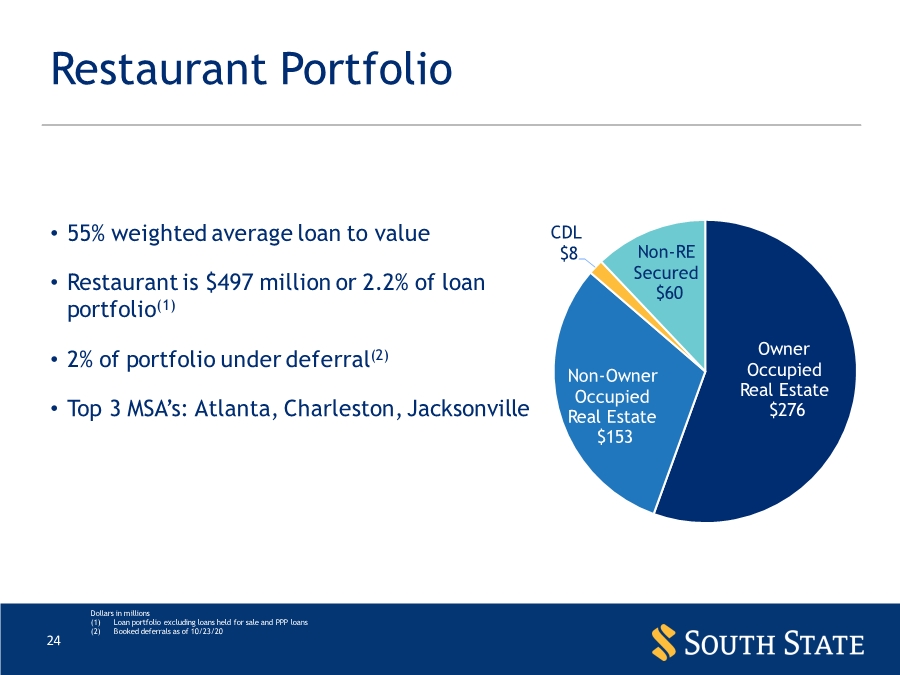
| 25 Retail CRE Portfolio • 57% weighted average loan to value • Retail CRE is $2.2 billion or 9.5% of loan portfolio(1) • 4% of portfolio under deferral(2) • Top 3 MSA’s: Miami, Orlando, Tampa Dollars in millions (1) Loan portfolio excluding loans held for sale and PPP loans (2) Booked deferrals as of 10/23/20 Non-Owner Occupied Real Estate $1,736 Owner Occupied Real Estate $401 CDL $46 |
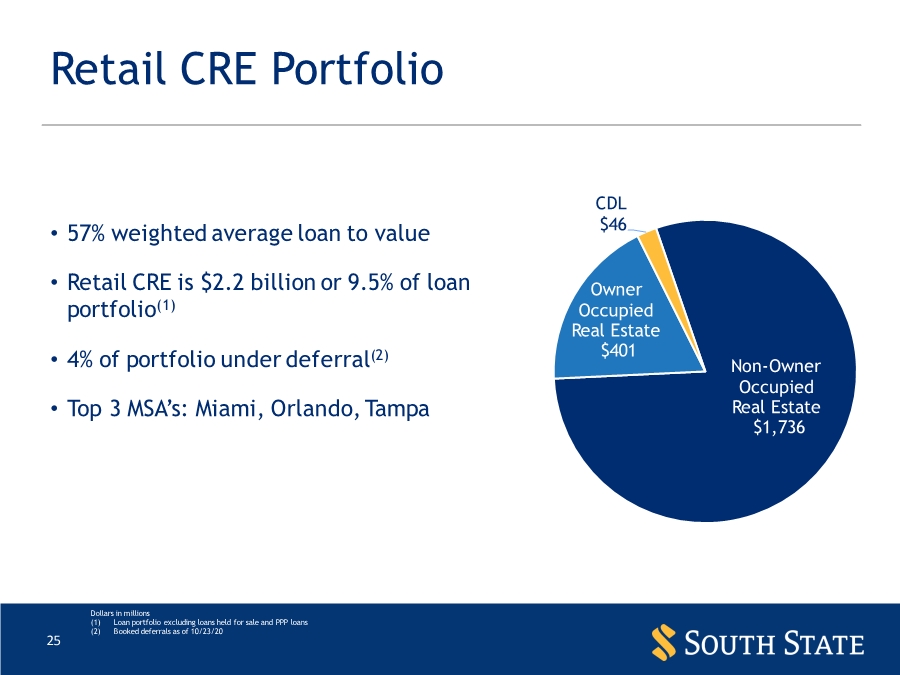
| 26 Current & Historical PPNR, Adjusted (Unaudited) Dollars in thousands (1) Through June 7, 2020 (2) Does not include purchase accounting adjustments The combined historical information referred to in this presentation as the “Combined Company Basis” presented is based on the reported GAAP results of the Company and CenterState for the applicable periods without adjustments and the information included in this release has not been prepared in accordance with Article 11 of Regulation S-X, and therefore does not reflect any of the pro forma adjustments that would be required thereby. Combined Business Basis Sep. 30, 2019 Dec. 31, 2019 M ar. 31, 2020 Jun. 30, 2020 Sep. 30, 2020 SSB CSFL Com bined (2) SSB CSFL Com bined (2) SSB CSFL Com bined (2) SSB CSFL (1) Com bined SSB Net inter est income (GAAP) $ 127,373 $ 154,947 $ 282,320 $ 126,456 $ 157,925 $ 284,381 $ 128,013 $ 153,353 $ 281,366 $ 162,557 $111,624 $ 274,181 $ 270,348 Plus: Noninter est income 37,582 48,488 86,070 36,307 50,329 86,636 44,132 55,790 99,922 54,347 94,271 148,618 114,790 Less: Gain (loss) on sale of secur ities 437 - 437 24 (13) 11 ---- 40,276 40,276 15 Total r evenue, adjusted (non-GAAP) $ 164,518 $ 203,435 $ 367,953 $ 162,739 $ 208,267 $ 371,006 $ 172,145 $ 209,143 $ 381,288 $ 216,904 $165,619 $ 382,523 $ 385,123 Less: Noninter est ex pense 96,364 127,036 223,400 100,628 113,409 214,037 107,247 122,772 230,019 175,112 132,703 307,815 236,887 PPNR (Non-GAAP) $ 68,154 $ 76,399 $ 144,553 $ 62,111 $ 94,858 $ 156,969 $ 64,898 $ 86,371 $ 151,269 $ 41,792 $ 32,916 $ 74,708 $ 148,236 Plus: Non-recurring item adjustments - 16,994 16,994 1,494 159 1,653 4,129 3,051 7,180 40,478 41,875 82,353 21,662 Non-recurring items - 16,994 16,994 1,494 159 1,653 4,129 3,051 7,180 40,478 41,875 82,353 21,662 PPNR, A djusted (Non-GAAP) $ 68,154 $ 93,393 $ 161,547 $ 63,605 $ 95,017 $ 158,622 $ 69,027 $ 89,422 $ 158,449 $ 82,270 $74,791 $ 157,061 $ 169,898 |
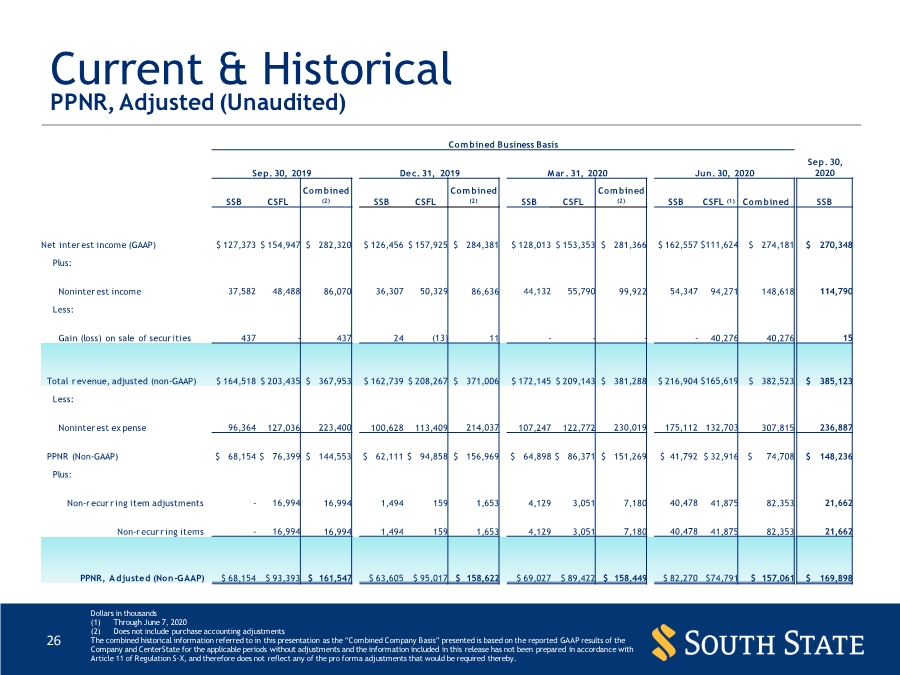
| 27 Current & Historical Efficiency Ratios & Net Interest Margin (Unaudited) Dollars in thousands (1) Through June 7, 2020 (2) Does not include purchase accounting adjustments (3) Legacy CSFL also adjusted noninterest expense by intangible assets’ amortization expenses for the adjusted efficiency ratios, which were approximately $4.4, $4.2, $4.6, $4.5 and $2.9 million for 2Q 19, 3Q 19, 4Q 19, 1Q 20 and 2Q 20 (through June 7), respectively The combined historical information referred to in this presentation as the “Combined Company Basis” presented is based on the reported GAAP results of the Company and CenterState for the applicable periods without adjustments and the information included in this release has not been prepared in accordance with Article 11 of Regulation S-X, and therefore does not reflect any of the pro forma adjustments that would be required thereby. Combined Business Basis Sep. 30, 2019 Dec. 31, 2019 Mar. 31, 2020 Jun. 30, 2020 Sep. 30, 2020 SSB CSFL Combined (2) SSB CSFL Combined (2) SSB CSFL Combined (2) SSB CSFL (1) Combined SSB Noninterest expense (GAAP) $ 96,364 $ 127,036 $ 223,400 $ 100,628 $ 113,409 $ 214,037 $ 107,247 $ 122,772 $ 230,019 $ 175,112 $ 132,703 $ 307,815 $ 236,887 Net interest income (GAAP) $ 127,373 $ 154,947 $ 282,320 $ 126,456 $ 157,925 $ 284,381 $ 128,013 $ 153,353 $ 281,366 $ 162,557 $ 111,624 $ 274,181 $ 270,348 Tax Equivalent ("TE") adjustments 496 491 987 503 564 1,067 530 685 1,215 579 495 1,074 734 Net interest income, TE (non-GAAP) $ 127,869 $ 155,438 $ 283,307 $ 126,959 $ 158,489 $ 285,448 $ 128,543 $ 154,038 $ 282,581 $ 163,136 $ 112,119 $ 275,255 $ 271,082 Noninterest income (GAAP) $ 37,582 $ 48,488 $ 86,070 $ 36,307 $ 50,329 $ 86,636 $ 44,132 $ 55,790 $ 99,922 $ 54,347 $ 94,271 $ 148,618 $ 114,790 Less: Gain (loss) on sale of securities 437 - 437 24 (13) 11 ---- 40,276 40,276 15 Adjusted noninterest income (non-GAAP) $ 37,145 $ 48,488 $ 85,633 $ 36,283 $ 50,342 $ 86,625 $ 44,132 $ 55,790 $ 99,922 $ 54,347 $ 53,995 $ 108,342 $ 114,775 Efficiency Ratio (Non-GAAP) 58% 62% 61% 62% 54% 58% 62% 59% 60% 81% 80% 80% 61% Noninterest expense (GAAP) $ 96,364 $ 127,036 $ 223,400 $ 100,628 $ 113,409 $ 214,037 $ 107,247 $ 122,772 $ 230,019 $ 175,112 $ 132,703 $ 307,815 $ 236,887 Less Adjustments: Non-recurring items(3) - 21,223 21,223 1,494 4,711 6,205 4,129 7,586 11,715 40,478 44,761 85,239 21,662 Adjusted noninterest expense (non-GAAP) $ 96,364 $ 105,813 $ 202,177 $ 99,134 $ 108,698 $ 207,832 $ 103,118 $ 115,186 $ 218,304 $ 134,634 $ 87,942 $ 222,576 $ 215,225 Adjusted Efficiency Ratio (Non-GAAP) 58% 52% 55% 61% 52% 56% 60% 55% 57% 62% 53% 58% 56% Interest-earning Assets $13,595,944 $14,702,264 $28,298,208 $13,834,211 $14,779,757 $28,613,968 $14,042,524 $14,873,007 $28,915,531 $20,347,350 $12,414,262 $32,761,612 $33,503,666 Net interest income, TE (non-GAAP) 127,869 155,438 283,307 126,959 158,489 285,448 128,543 154,038 282,581 163,136 112,119 275,255 271,082 Net Interest Margin (Non-GAAP) 3.96% 3.94% 3.94% 3.38% 3.22% |
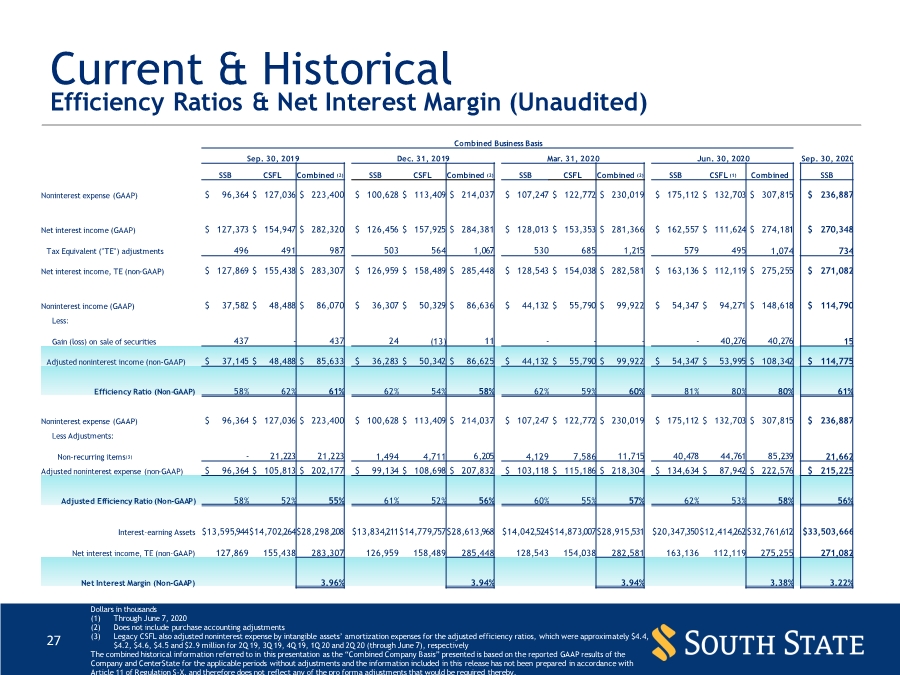
| 28 Non-GAAP Reconciliations Tangible Book Value per Share & Tangible Common Equity (“TCE”) Ratio Dollars in thousands, except for per share data Tangible Book Value per Share 3Q19 4Q19 1Q20 2Q20 3Q20 Shareholders' common equity (excludes preferred stock) $ 2,350,956 $ 2,373,013 $ 2,321,043 $ 4,491,850 $ 4,563,413 Less: Intangible assets 1,055,983 1,052,716 1,049,709 1,774,294 1,738,161 Tangible shareholders' common equity (excludes preferred stock) $ 1,294,973 $ 1,320,297 $ 1,271,334 $ 2,717,556 $ 2,825,252 Common shares issued and outstanding 33,902,726 33,744,385 33,444,236 70,907,119 70,928,304 Tangible Book Value per Common Share (Non-GAAP) $ 38.20 $ 39.13 $ 38.01 $ 38.33 $ 39.83 Tangible Common Equity ("TCE") Ratio 2Q20 3Q20 Shareholders' equity (GAAP) $ 4,491,850 $ 4,563,413 Less: Intangible assets 1,774,294 1,738,161 Tangible common equity (non-GAAP) $ 2,717,556 $ 2,825,252 Total assets (GAAP) 37,725,356 37,819,366 Less: Intangible assets 1,774,294 1,738,161 Tangible asset (non-GAAP) $ 35,951,062 $ 36,081,205 TCE Ratio (Non-GAAP) 7.6% 7.8% |
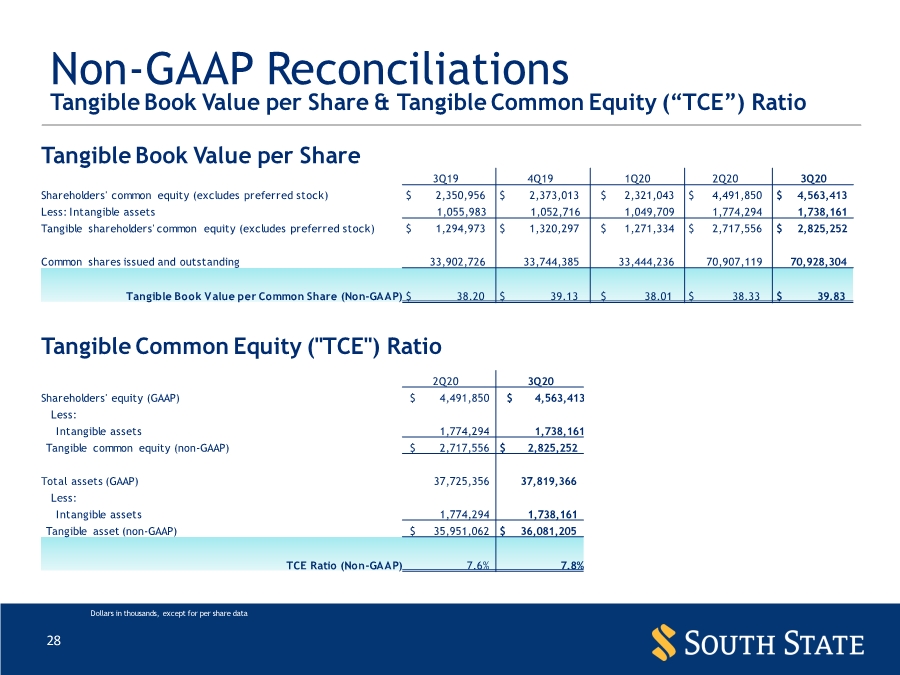
| 29 Non-GAAP Reconciliations Return on Average Tangible Common Equity & PPNR Return on Average Assets Dollars in thousands The tangible measures are non-GAAP measures and exclude the effect of period end or average balance of intangible assets; the tangible returns on equity and common equity measures also add back the after-tax amortization of intangibles to GAAP basis net income. Return on Average Tangible Equity 2Q20 3Q20 Net income (loss) (GAAP) $ (84,935) $ 95,221 Plus: Amortization of intangibles 4,665 9,560 Effective tax rate, excluding DTA write-off 23% 20% Amortization of intangibles, net of tax 3,612 7,685 Net income plus after-tax amortization of intangibles (non-GAAP) $ (81,323) $ 102,906 Average shareholders' common equity, excluding preferred stock $ 2,900,443 $ 4,556,061 Less: Average intangible assets 1,240,650 1,763,255 Average tangible common equity $ 1,659,793 $ 2,792,806 Return on Average Tangible Common Equity (Non-GAAP) (19.71%) 14.66% PPNR (adjusted) Return on Average Assets 3Q20 PPNR, Adjusted (Non-GAAP) $ 169,898 Average assets 37,865,217 PPNR ROAA 1.79% |
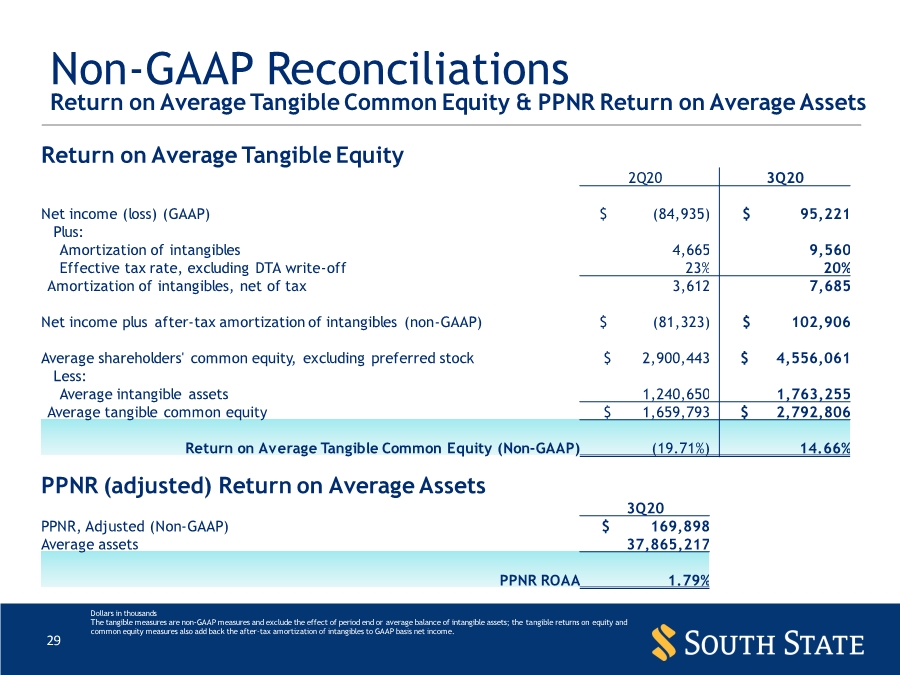
| 30 Non-GAAP Reconciliations Adjusted Net Income (Loss) & Adjusted Earnings Per Share (“EPS”) Dollars in thousands, except for per share data Adjusted Net Income (Loss) 2Q20 3Q20 Net income (loss) (GAAP) $ (84,935) $ 95,221 Plus: Securities gain, net of tax -(12) Merger and branch consolidation related expense, net of tax 31,191 17,413 Provision for credit losses - Non-PCD loans & UFC 92,212 - FHLB prepayment penalty 154 - Adjusted Net Income (Non-GAAP) $ 38,622 $ 112,622 Adjusted EPS 2Q20 3Q20 Adjusted diluted weighted-average common shares 43,606 71,086 Net income (loss) (GAAP) $ (84,935) $ 95,221 Plus: Securities gain, net of tax -(12) Merger and branch consolidation related expense, net of tax 31,191 17,413 Provision for credit losses - Non-PCD loans & unfunded commitments 92,212 - FHLB prepayment penalty 154 - Adjusted net income (non-GAAP) $ 38,622 $ 112,622 Adjusted EPS, Diluted (Non-GAAP) $ 0.89 $ 1.58 |
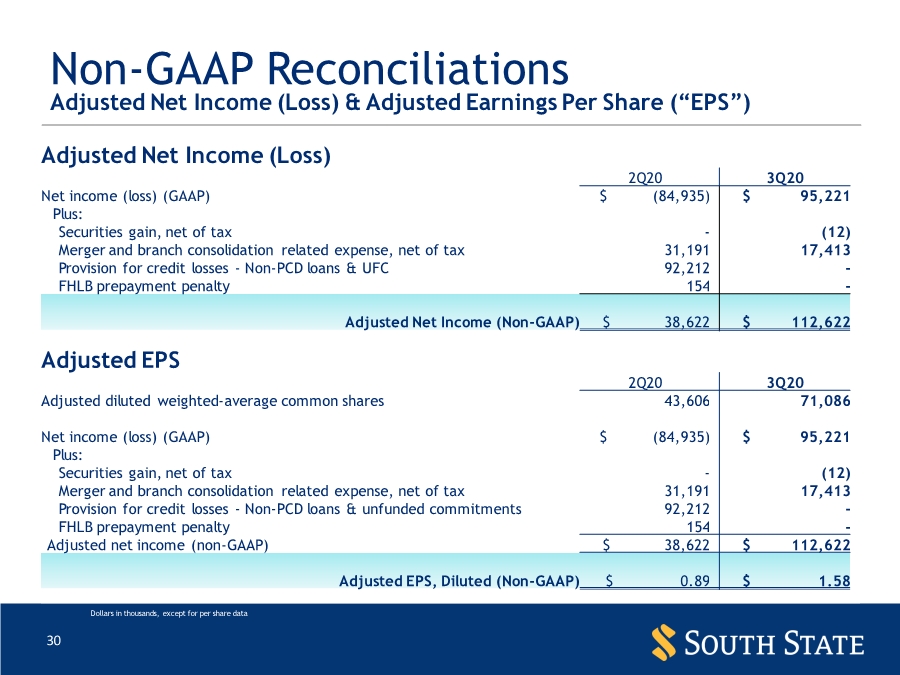
| 31 Non-GAAP Reconciliations Adjusted Return on Average Assets & Average Tangible Common Equity Dollars in thousands The tangible measures are non-GAAP measures and exclude the effect of period end or average balance of intangible assets; the tangible returns on equity and common equity measures also add back the after-tax amortization of intangibles to GAAP basis net income. Adjusted Return on Average Assets 2Q20 3Q20 Adjusted net income (non-GAAP) $ 38,622 $ 112,622 Total average assets 22,898,925 37,865,217 Adjusted Return on Average Assets (Non-GAAP) 0.68% 1.18% Adjusted Return on Average Tangible Common Equity 2Q20 3Q20 Net operating earnings (non-GAAP) $ 38,622 $ 112,622 Plus: Amortization of intangibles, net of tax 3,612 7,685 Net operating earnings plus after-tax amortization of intangibles (non-GAAP) $ 42,235 $ 120,307 Average tangible common equity $ 1,659,793 $ 2,792,806 Adjusted Return on Average Tangible Common Equity (Non-GAAP) 10.23% 17.14% |
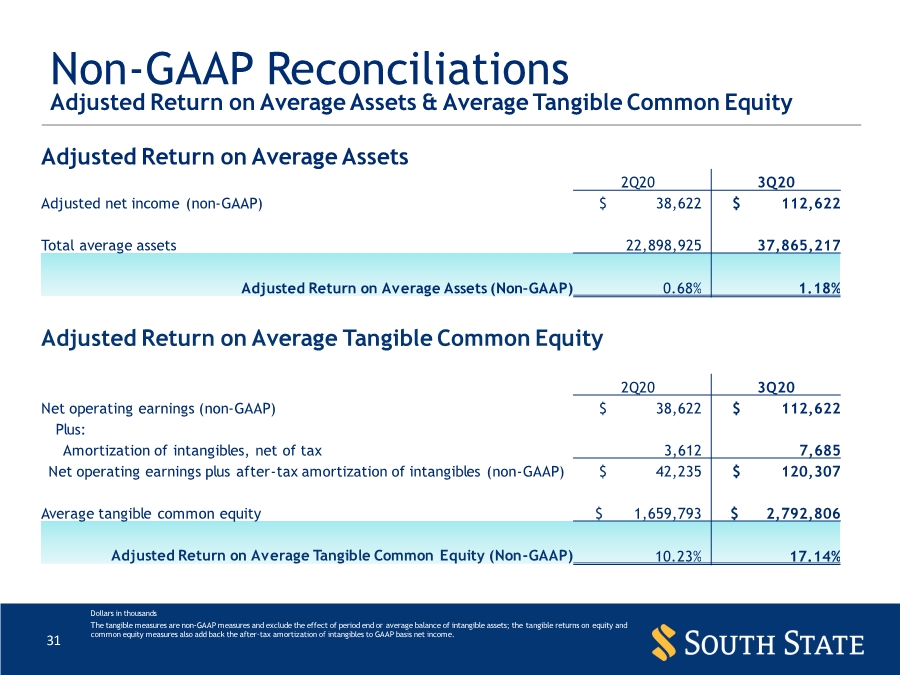
| 32 Non-GAAP Reconciliations Net Interest Margin, Tax Equivalent & Adjusted Efficiency Ratios Dollars in thousands Net Interest Margin - Tax Equivalent (Non-GAAP) 3Q19 4Q19 1Q20 2Q20 3Q20 Net interest income (GAAP) $ 127,373 $ 126,456 $ 128,013 $ 162,557 $ 270,348 Tax equivalent adjustments 496 503 530 579 734 Net interest income (tax equivalent) (Non-GAAP) $ 127,869 $ 126,959 $ 128,543 $ 163,136 $ 271,082 Average earning assets $ 13,595,944 $ 13,834,211 $ 14,042,524 $ 20,262,035 $ 33,503,666 Net Interest Margin - Tax Equivalent (Non-GAAP) 3.73% 3.64% 3.68% 3.24% 3.22% Adjusted Efficiency Ratios (Non-GAAP) 2Q20 3Q20 Noninterest expense (GAAP) $ 175,112 $ 236,887 Noninterest income (GAAP) 54,347 114,790 Less: Securities gains losses - 15 Adjusted noninterest income (non-GAAP) $ 54,347 $ 114,775 Net interest income (GAAP) $ 162,557 $ 270,348 Plus: SCBT T/E adjustment 579 734 Tax equivalent net interest income (non-GAAP) $ 163,136 $ 271,082 Efficiency Ratio (Tax Equivalent) (Non-GAAP) 80.52% 61.39% Noninterest expense (GAAP) $ 175,112 $ 236,887 Less: FHLB prepayment penalty 199 - Merger related expenses 40,279 21,662 Adjusted noninterest expense (non-GAAP) $ 134,634 $ 215,225 Adjusted Efficiency Ratio (Non-GAAP) 61.91% 55.78% |
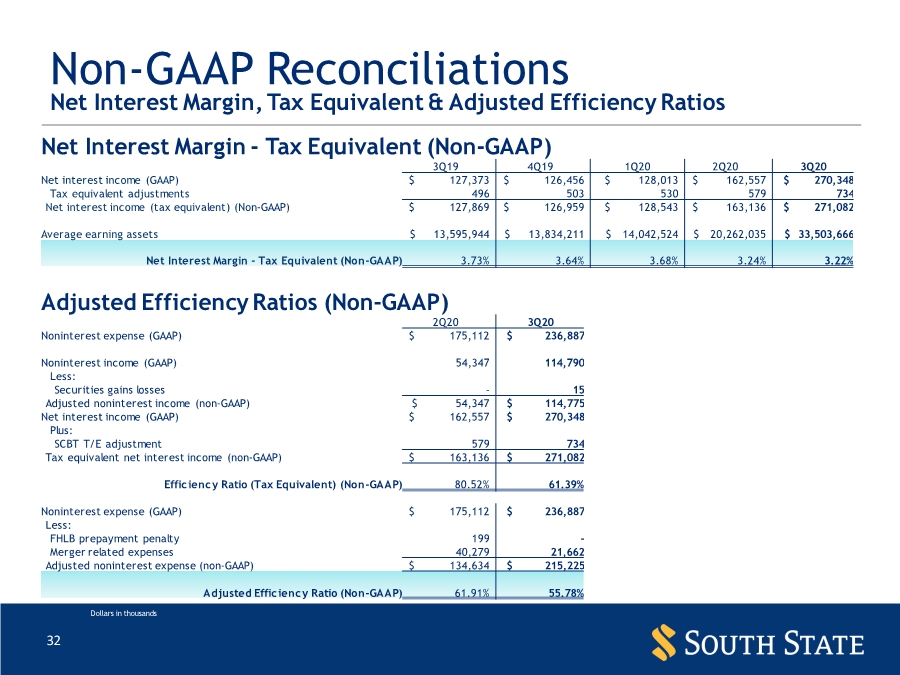
|