
Form 8-K WASHINGTON REAL ESTATE For: Oct 29

| FOR IMMEDIATE RELEASE | ||||||||
| CONTACT: | 1775 Eye Street, NW, Suite 1000 | |||||||
| Amy Hopkins | Washington, DC 20006 | |||||||
| Vice President, Investor Relations | Tel 202-774-3253 | |||||||
| E-Mail: ahopkins@washreit.com | Fax 301-984-9610 | |||||||
| www.washreit.com | ||||||||
| October 29, 2020 | ||||||||
| WASHREIT ANNOUNCES THIRD QUARTER 2020 RESULTS | ||||||||
Washington Real Estate Investment Trust (“WashREIT” or the “Company”) (NYSE: WRE), a leading owner and operator of multifamily and commercial properties in the Washington, DC area, reported financial and operating results today for the quarter ended September 30, 2020:
Financial Results
•Net loss attributable to controlling interests was $1.0 million, or $0.01 per diluted share
•NAREIT FFO(1) was $29.5 million, or $0.36 per diluted share
•Core FFO(1) was $0.36 per diluted share
Operational Highlights
•Net Operating Income (NOI)(2) was $44.6 million
•Same-store(3) NOI declined 4.9% and cash NOI declined 4.1% compared to the third quarter of 2019 due primarily to lower commercial parking income and higher credit loss related to COVID-19
•Cash collection rates improved from the second quarter of 2020
•Total credit losses related to COVID-19 of $0.8 million improved slightly from the second quarter of 2020
•Multifamily occupancy at quarter end excluding Trove increased 30 basis points compared to the second quarter of 2020, Office ending occupancy declined 20 basis points, and Other(5) ending occupancy increased 280 basis points compared to the second quarter of 2020
•Multifamily new and renewal lease rates(4) for suburban properties increased approximately 1.1% on a blended basis while urban property lease rates declined 2.9% on a blended basis. Total new and renewal lease rates declined 1.7% on a blended basis during the quarter.
Financing Activity
•Executed a $350 million 10-year 3.44% Green Bond, the closing and funding of which is expected to occur no later than December 29, 2020. The Company intends to allocate the net proceeds from the offering to finance or refinance recently completed and future green building and energy efficiency, sustainable water and wastewater management and renewable energy projects (“Eligible Green Projects”). Pending allocation to such Eligible Green Projects, WashREIT expects to repay $300 million of existing term loans with the balance to pay down amounts due under the revolving credit facility. Following the closing and funding of the Green Bond and the repayment of the term loans, the Company will have no debt maturing until the fourth quarter of 2022.
Washington Real Estate Investment Trust
Page 2 of 13
Liquidity Position
•Available liquidity of approximately $520 million as of September 30 consisting of the remaining capacity under the Company's $700 million revolving credit facility and cash on hand
•The Company has no secured debt and believes that it has the ability to access the capital markets if needed
Cash Collections
Multifamily
•Collected 99% of cash rent and 99% of contractual rent due during the third quarter
•Deferred $60 thousand of rent due from multifamily residents, net,(6) year-to-date
Commercial
•Collected 97% of cash rent and 99% of contractual rent due from office tenants during the third quarter
•Deferred $1.4 million of rent due from office tenants, net, year-to-date
•Collected 88% of cash rent and 95% of contractual rent due from retail tenants during the third quarter
•Deferred $1.0 million of rent due from retail tenants, net, year-to-date
“Our portfolio has demonstrated strong, stable credit performance and the Washington Metro continues to experience lower unemployment than most other major metropolitan areas and the U.S. overall," said Paul T. McDermott, President and CEO of WashREIT. "Our multifamily collections are consistently above national averages and our suburban expansion through the Assembly Portfolio acquisition is proving to be a prudent allocation of capital. Our office portfolio is well positioned with a weighted average lease maturity of over five years, strong and stable rent collection rates, no exposure to co-working tenants and limited near-term lease expirations. While our operating environment has changed drastically over the past seven months and remains challenging, we have swiftly adjusted to the new demands of today’s market and remain well positioned to bolster our long-term strategic growth plans once conditions improve."
Third Quarter Operating Results
The Company's overall portfolio NOI from continuing operations was $44.6 million for the quarter ended September 30, 2020 compared to $49.6 million in the corresponding prior year period. The decrease was primarily driven by the impact of net transaction activity during 2019 and 2020, and lower parking income and higher credit losses as a result of COVID-19.
Same-Store Portfolio by Sector:
▪Multifamily Same-Store NOI - Same-store NOI and cash NOI decreased by 3.8% compared to the corresponding prior year quarter driven by lower average occupancy and lower move-in and other fees due to COVID-19. Lease rates declined 1.7% on a blended basis year-over-year, comprised of 1.1% of blended lease rate growth for our suburban properties and an average lease rate decline of 2.9% on a blended basis for our urban properties. At quarter end, our same-store portfolio was 94.0% occupied and our total operating portfolio, which includes all of our multifamily properties except Trove, was 94.6% occupied and 96.5% leased.(7)
▪Office Same-Store NOI - Same-store NOI decreased by 4.9% and cash NOI decreased by 3.7% compared to the corresponding prior year period, primarily due to lower parking income, known move-outs and an increase in bad debt expenses related to COVID-19. Same-store average occupancy(8) increased 10 basis points sequentially but declined 280 basis points year-over-year due to expected lease expirations. The office portfolio was 86.6% occupied and 87.8% leased at quarter end.
Washington Real Estate Investment Trust
Page 3 of 13
▪Other Same-Store NOI - Same-store NOI and cash NOI decreased by $0.3 million compared to the prior year period driven, in part, by approximately $0.2 million of credit losses related to COVID-19. The Other portfolio was 86.8% occupied and 88.8% leased at quarter end.
Leasing Activity
During the third quarter, WashREIT signed commercial leases totaling 73,000 square feet, including 25,000 square feet of new leases and 48,000 square feet of renewal leases, as follows (all dollar amounts are on a per square foot basis).
| Square Feet | Weighted Average Term (in years) | Weighted Average Free Rent Period (in months) | Weighted Average Rental Rates | Weighted Average Rental Rate % Increase | Tenant Improvements | Leasing Commissions | |||||||||||||||||
| New: | |||||||||||||||||||||||
| Office | 19,000 | 5.3 | 6.2 | $45.74 | 10.0% | $46.73 | $11.99 | ||||||||||||||||
| Retail | 6,000 | 12.1 | 5.2 | 18.87 | —% | 27.87 | 1.47 | ||||||||||||||||
| Total | 25,000 | 6.9 | 6.1 | 39.41 | 8.8% | 42.29 | 9.51 | ||||||||||||||||
| Renewal: | |||||||||||||||||||||||
| Office | 40,000 | 7.2 | 6.9 | $39.15 | 17.6% | $22.84 | $5.19 | ||||||||||||||||
| Retail | 8,000 | 1.8 | 5.4 | 41.27 | 16.4% | — | — | ||||||||||||||||
| Total | 48,000 | 6.3 | 6.7 | 39.49 | 17.4% | 19.18 | 4.36 | ||||||||||||||||
2020 Guidance
On April 22, 2020, the Company withdrew its 2020 Core FFO guidance, originally provided in its February 13, 2020 Earnings Release, in light of uncertainty surrounding the COVID-19 pandemic and the related impact on the Company's business. The Company is reinstating its full-year 2020 guidance, including in light of the benefit of two additional quarters of actual results. Notwithstanding this improved visibility, uncertainty remains as to the risk and magnitude of COVID-19 resurgence, as well as the economic consequences of the pandemic.
| Full Year 2020 | |||||
| Core FFO per diluted share | $1.44 - $1.46 | ||||
| Same-Store NOI | |||||
| Multifamily | $59.25 million - $59.75 million | ||||
| Office | $81.5 million - $82.0 million | ||||
| Other NOI | $11.5 million - $12.0 million | ||||
| Non Same-Store Multifamily NOI | $26.75 million - $27.25 million | ||||
| Corporate Expenses | |||||
| G&A and Leasing Expenses | $23.5 million - $24.0 million | ||||
| Interest Expense | $37.5 million - $37.75 million | ||||
| Development Expenditures | $30.0 million - $35.0 million | ||||
The non same-store multifamily properties in 2020 consist of the Assembly Portfolio, Cascade at Landmark, and Trove multifamily development. John Marshall II is the only non same-store office property in 2020.
WashREIT's 2020 Core FFO guidance is based on a number of factors, many of which are outside the Company's control and all of which are subject to change. WashREIT may change the guidance provided during the year as actual and anticipated results vary from these assumptions, but WashREIT undertakes no obligation to do so.
Washington Real Estate Investment Trust
Page 4 of 13
2020 Guidance Reconciliation Table
A reconciliation of projected net loss attributable to the controlling interests per diluted share to projected Core FFO per diluted share for the year ending December 31, 2020, reflecting the dispositions assumptions above, is as follows:
| Low | High | |||||||
Net income attributable to the controlling interests per diluted share(a) | $ | (0.02) | $ | — | ||||
Real estate depreciation and amortization(b) | 1.46 | 1.46 | ||||||
| NAREIT FFO per diluted share | 1.44 | 1.46 | ||||||
| Core adjustments | — | — | ||||||
| Core FFO per diluted share | $ | 1.44 | $ | 1.46 | ||||
(a) Excludes gains or losses on sale of real estate
(b) Includes impact from planned disposition during the year
Dividends
On October 5, 2020, WashREIT paid a quarterly dividend of $0.30 per share.
WashREIT announced today that its Board of Trustees has declared a quarterly dividend of $0.30 per share to be paid on January 6, 2021 to shareholders of record on December 23, 2020.
Conference Call Information
The Conference Call for Third Quarter 2020 Earnings is scheduled for Friday, October 30, 2020 at 11:00 A.M. Eastern Time. Conference Call access information is as follows:
USA Toll Free Number: 1-877-407-9205
International Toll Number: 1-201-689-8054
The instant replay of the Conference Call will be available until November 13, 2020 at 11:00 P.M. Eastern Time. Instant replay access information is as follows:
USA Toll Free Number: 1-877-481-4010
International Toll Number: 1-919-882-2331
Conference ID: 56872
The live on-demand webcast of the Conference Call will be available on the Investor section of WashREIT's website at www.washreit.com. Online playback of the webcast will be available following the Conference Call.
About WashREIT
WashREIT owns and operates uniquely positioned real estate assets in the Washington Metro area. Backed by decades of experience, expertise and ambition, we create value by transforming insights into strategy and strategy into action. As of October 29, 2020, the Company's portfolio of 45 properties includes approximately 3.7 million square feet of commercial space and 6,863 multifamily apartment units. These 45 properties consist of 22 multifamily properties,15 office properties, and 8 retail centers. Our shares trade on the NYSE. With a track record of driving returns and delivering satisfaction, we are a trusted authority in one of the nation's most competitive real estate markets.
Note: WashREIT's press releases and supplemental financial information are available on the Company website at www.washreit.com or by contacting Investor Relations at (202) 774-3200.
Certain statements in our earnings release and on our conference call are "forward-looking statements" within the meaning of the Private Securities Litigation Reform Act of 1995. Forward-looking statements relate to expectations,
Washington Real Estate Investment Trust
Page 5 of 13
beliefs, projections, future plans and strategies, anticipated events or trends and similar expressions concerning matters that are not historical facts. In some cases, you can identify forward looking statements by the use of forward-looking terminology such as “may,” “will,” “should,” “expects,” “intends,” “plans,” “anticipates,” “believes,” “estimates,” “predicts,” or “potential” or the negative of these words and phrases or similar words or phrases which are predictions of or indicate future events or trends and which do not relate solely to historical matters. Such statements involve known and unknown risks, uncertainties, and other factors which may cause the actual results, performance, or achievements of WashREIT to be materially different from future results, performance or achievements expressed or implied by such forward-looking statements. Currently, one of the most significant factors is the adverse effect of the COVID-19 virus and ensuing economic turmoil on the financial condition, results of operations, cash flows and performance of WashREIT, particularly the impact of our ability to collect rent on schedule or at all, our ability to lease or release our commercial spaces, and increased credit losses, on the performance of our tenants generally, and on the global economy and financial markets. The extent to which COVID-19 impacts WashREIT and its tenants will depend on future developments, which are highly uncertain and cannot be predicted with confidence, including the scope, severity and duration of the pandemic, the actions taken to contain the pandemic or mitigate its impact, and the direct and indirect economic effects of the pandemic and containment measures, among others. Moreover, investors are cautioned to interpret many of the risks identified in the risk factors discussed in our Annual Report on Form 10-K for the year ended December 31, 2019, as amended by Amendment No. 1 to the Annual Report on Form 10-K, filed on March 6, 2020, and our Quarterly Report on Form 10-Q for the quarter ended March 31, 2020, filed on April 27, 2020, as being heightened as a result of the ongoing and numerous adverse impacts of COVID-19. Additional factors which may cause the actual results, performance, or achievements of WashREIT to be materially different from future results, performance or achievements expressed or implied by such forward-looking statements include, but are not limited to the risks associated with the closing and funding of our recent notes offering, the ownership of real estate in general and our real estate assets in particular; the economic health of the greater Washington metro region; the risk of failure to enter into/and or complete contemplated acquisitions and dispositions at all, within the price ranges anticipated and on the terms and timing anticipated; changes in the composition of our portfolio; fluctuations in interest rates; reductions in or actual or threatened changes to the timing of federal government spending; the risks related to use of third-party providers and joint venture partners; the ability to control our operating expenses; the economic health of our tenants; the supply of competing properties; shifts away from brick and mortar stores to e-commerce; the availability and terms of financing and capital and the general volatility of securities markets; compliance with applicable laws, including those concerning the environment and access by persons with disabilities; terrorist attacks or actions and/or cyber-attacks; weather conditions, natural disasters and pandemics; ability to maintain key personnel; failure to qualify and maintain our qualification as a REIT and the risks of changes in laws affecting REITs; and other risks and uncertainties detailed from time to time in our filings with the SEC, including our 2019 Form 10-K, as amended by Amendment No. 1 to the Annual Report on Form 10-K, filed on March 6, 2020, and subsequent Quarterly Reports on Form 10-Q. While forward-looking statements reflect our good faith beliefs, they are not guarantees of future performance. We undertake no obligation to update our forward-looking statements or risk factors to reflect new information, future events, or otherwise.
This Earnings Release also includes certain forward-looking non-GAAP information. Due to the high variability and difficulty in making accurate forecasts and projections of some of the information excluded from these estimates, together with some of the excluded information not being ascertainable or accessible, the Company is unable to quantify certain amounts that would be required to be included in the most directly comparable GAAP financial measures without unreasonable efforts
(1) NAREIT Funds From Operations (“FFO”) is defined by the National Association of Real Estate Investment Trusts, Inc. (“NAREIT”) in its NAREIT FFO White Paper - 2018 Restatement as net income (computed in accordance with GAAP) excluding gains (or losses) associated with sales of properties, impairments of depreciable real estate, and real estate depreciation and amortization. We consider NAREIT FFO to be a standard supplemental measure for equity real estate investment trusts (“REITs”) because it facilitates an understanding of the operating performance of our properties without giving effect to real estate depreciation and amortization, which historically assumes that the value of real estate assets diminishes predictably over time. Since real estate values have instead historically risen or fallen with market conditions, we believe that NAREIT FFO more accurately provides investors an indication of our ability to incur and service debt, make capital expenditures and fund other needs. Our NAREIT FFO may not be comparable to FFO reported by other REITs. These other REITs may not define the term in accordance with the current NAREIT definition or may interpret the current NAREIT definition differently. NAREIT FFO is a non-GAAP measure.
Core Funds From Operations (“Core FFO”) is calculated by adjusting FFO for the following items (which we believe are not indicative of the performance of WashREIT's operating portfolio and affect the comparative measurement of WashREIT's operating performance over time): (1) gains or losses on extinguishment of debt, (2) expenses related to acquisition and structuring activities, (3) executive transition costs, severance expenses and other expenses related to corporate restructuring and related to executive retirements or resignations, (4) property impairments,
Washington Real Estate Investment Trust
Page 6 of 13
casualty gains, and gains or losses on sale not already excluded from FFO, as appropriate, and (5) relocation expense. These items can vary greatly from period to period, depending upon the volume of our acquisition activity and debt retirements, among other factors. We believe that by excluding these items, Core FFO serves as a useful, supplementary measure of WashREIT's ability to incur and service debt and to distribute dividends to its shareholders. Core FFO is a non-GAAP and non-standardized measure and may be calculated differently by other REITs.
(2) Net Operating Income (“NOI”), defined as real estate rental revenue less real estate expenses, is a non-GAAP measure. NOI is calculated as net income, less non-real estate revenue and the results of discontinued operations (including the gain or loss on sale, if any), plus interest expense, depreciation and amortization, lease origination expenses, general and administrative expenses, real estate impairment and gain or loss on extinguishment of debt. We also present NOI on a cash basis ("cash NOI") which is calculated as NOI less the impact of straight-lining of rent and amortization of market intangibles. We believe that NOI and cash NOI are useful performance measures because, when compared across periods, they reflect the impact on operations of trends in occupancy rates, rental rates and operating costs on an unleveraged basis, providing perspective not immediately apparent from net income. NOI and cash NOI excludes certain components from net income in order to provide results more closely related to a property’s results of operations. For example, interest expense is not necessarily linked to the operating performance of a real estate asset. In addition, depreciation and amortization, because of historical cost accounting and useful life estimates, may distort operating performance at the property level. As a result of the foregoing, we provide each of NOI and cash NOI as a supplement to net income, calculated in accordance with GAAP. Neither represents net income or income from continuing operations, in either case calculated in accordance with GAAP. As such, NOI and cash NOI should not be considered alternatives to these measures as an indication of our operating performance.
(3) For purposes of evaluating comparative operating performance, we categorize our properties as “same-store”, “non-same-store” or discontinued operations. Same-store properties include properties that were owned for the entirety of the year being compared, and exclude properties under redevelopment or development and properties acquired, sold or classified as held for sale during the year being compared. We define development properties as those for which we have planned or ongoing major construction activities on existing or acquired land pursuant to an authorized development plan. We consider a property's development activities to be complete when the property is ready for its intended use. The property is categorized as same-store when it has been ready for its intended use for the entirety of the year being compared. We define redevelopment properties as those for which have planned or ongoing significant development and construction activities on existing or acquired buildings pursuant to an authorized plan, which has an impact on current operating results, occupancy and the ability to lease space with the intended result of a higher economic return on the property. We categorize a redevelopment property as same-store when redevelopment activities have been complete for the majority of each year being compared.
(4) Lease rate growth is defined as the average percentage change in effective rent (net of concessions) for a new or renewed lease compared to the prior lease based on the move-in date. The blended rate represents the weighted average of new and renewal lease rate growth achieved.
(5) Consists of retail centers not classified as discontinued operations: Takoma Park, Westminster, Concord Centre, Chevy Chase Metro Plaza, 800 S. Washington Street, Randolph Shopping Center, Montrose Shopping Center and Spring Valley Village. Pursuant to our Strategic Capital Allocation Plan, and following completion of the above described dispositions of our retail assets, we no longer report “Retail” as a separate operating segment.
(6) Represents total outstanding deferred rent net of the amount that has been repaid
(7) Ending Occupancy is calculated as occupied square footage or multifamily units as a percentage of total square footage of multifamily units, respectively, as of the last day of that period.
(8) Average Occupancy is based on monthly occupied net rentable square footage or monthly occupied multifamily units as a percentage of total net rentable square footage or total multifamily units, respectively.
(9) Funds Available for Distribution (“FAD”) is a non-GAAP measure. It is calculated by subtracting from FFO (1) recurring expenditures, tenant improvements and leasing costs, that are capitalized and amortized and are necessary to maintain our properties and revenue stream (excluding items contemplated prior to acquisition or associated with development / redevelopment of a property) and (2) straight line rents, then adding (3) non-real estate depreciation and amortization, (4) non-cash fair value interest expense and (5) amortization of restricted share compensation, then adding or subtracting the (6) amortization of lease intangibles, (7) real estate impairment and (8) non-cash gain/loss on extinguishment of debt, as appropriate. FAD is included herein, because we consider it to be a performance measure of a REIT’s ability to incur and service debt and to distribute dividends to its shareholders. FAD is a non-GAAP and non-standardized measure, and may be calculated differently by other REITs.
Washington Real Estate Investment Trust
Page 7 of 13
Ending Occupancy (i) Levels by Same-Store Properties (ii) and All Properties | |||||||||||||||||||||||
| Ending Occupancy | |||||||||||||||||||||||
| Same-Store Properties | All Properties | ||||||||||||||||||||||
| 3rd QTR | 3rd QTR | 3rd QTR | 3rd QTR | ||||||||||||||||||||
| Segment | 2020 | 2019 | 2020 | 2019 | |||||||||||||||||||
Multifamily (iiii) | 94.0 | % | 95.1 | % | 94.6 | % | 95.0 | % | |||||||||||||||
| Office | 86.6 | % | 88.7 | % | 86.6 | % | 90.3 | % | |||||||||||||||
Other (iii) | 86.8 | % | 89.0 | % | 86.8 | % | 89.0 | % | |||||||||||||||
Overall Portfolio (iiii) | 90.3 | % | 91.9 | % | 91.6 | % | 93.0 | % | |||||||||||||||
(i) Ending occupancy is calculated as occupied square footage as a percentage of total square footage as of the last day of that period, except for the row labeled "Multifamily," on which ending occupancy is calculated as occupied units as a percentage of total available units as of the last day of that period. The occupied square footage for office and other properties includes short-term lease agreements.
(ii) Same-store properties include properties that were owned for the entirety of the years being compared, and exclude properties under redevelopment or development and properties acquired, sold or classified as held for sale during the years being compared. We define development properties as those for which we have planned or are ongoing major construction activities on existing or acquired land pursuant to an authorized development plan. We consider a property's development activities to be complete when the property is ready for its intended use. The property is categorized as same-store when it has been ready for its intended use for the entirety of the years being compared. We define redevelopment properties as those for which we have planned or are ongoing significant development and construction activities on existing or acquired buildings pursuant to an authorized plan, which has an impact on current operating results, occupancy and the ability to lease space with the intended result of a higher economic return on the property. We categorize a redevelopment property as same-store when redevelopment activities have been complete for the majority of each year being compared. For Q3 2020 and Q3 2019, same-store properties exclude:
Acquisitions:
Multifamily - Assembly Alexandria, Assembly Manassas, Assembly Dulles, Assembly Leesburg, Assembly Herndon, Assembly Germantown, Assembly Watkins Mill and Cascade at Landmark
Development:
Multifamily - Trove
Sold properties:
Office - Quantico Corporate Center, 1776 G Street and John Marshall II
Discontinued Operations:
Retail - Wheaton Park, Bradlee Shopping Center, Shoppes at Foxchase, Gateway Overlook, Olney Village Center, Frederick County Square, Centre at Hagerstown and Frederick Crossing
(iii) Same-Store Other consists of retail properties not classified as discontinued operations: Takoma Park, Westminster, Concord Centre, Chevy Chase Metro Plaza, 800 S. Washington Street, Randolph Shopping Center, Montrose Shopping Center and Spring Valley Village.
(iiii) Ending occupancy excludes the addition of the total rentable units at Trove, which began to lease-up in the first quarter of 2020. Including Trove, multifamily ending occupancy was 90.5% and overall portfolio ending occupancy was 89.5% as of September 30, 2020.
Washington Real Estate Investment Trust
Page 8 of 13
| WASHINGTON REAL ESTATE INVESTMENT TRUST AND SUBSIDIARIES | |||||||||||||||||||||||
| FINANCIAL HIGHLIGHTS | |||||||||||||||||||||||
| (In thousands, except per share data) | |||||||||||||||||||||||
| (Unaudited) | |||||||||||||||||||||||
| Three Months Ended September 30, | Nine Months Ended September 30, | ||||||||||||||||||||||
| OPERATING RESULTS | 2020 | 2019 | 2020 | 2019 | |||||||||||||||||||
| Revenue | |||||||||||||||||||||||
| Real estate rental revenue | $ | 73,227 | $ | 80,259 | $ | 222,889 | $ | 228,513 | |||||||||||||||
| Expenses | |||||||||||||||||||||||
| Real estate expenses | 28,672 | 30,692 | 84,196 | 84,969 | |||||||||||||||||||
| Depreciation and amortization | 30,470 | 37,340 | 89,789 | 97,441 | |||||||||||||||||||
| General and administrative expenses | 6,330 | 6,461 | 17,963 | 19,803 | |||||||||||||||||||
| Real estate impairment | — | — | — | 8,374 | |||||||||||||||||||
| 65,472 | 74,493 | 191,948 | 210,587 | ||||||||||||||||||||
| Loss on sale of real estate | — | — | (7,539) | (1,046) | |||||||||||||||||||
| Real estate operating income | 7,755 | 5,766 | 23,402 | 16,880 | |||||||||||||||||||
| Other (expense) income: | |||||||||||||||||||||||
| Interest expense | (8,711) | (14,198) | (28,307) | (41,946) | |||||||||||||||||||
| Gain on extinguishment of debt | — | — | 262 | — | |||||||||||||||||||
| (8,711) | (14,198) | (28,045) | (41,946) | ||||||||||||||||||||
| Loss from continuing operations | (956) | (8,432) | (4,643) | (25,066) | |||||||||||||||||||
| Discontinued operations: | |||||||||||||||||||||||
| Income from operations of properties sold or held for sale | — | 2,942 | — | 16,158 | |||||||||||||||||||
| Gain on sale of real estate | — | 339,024 | — | 339,024 | |||||||||||||||||||
| Loss on extinguishment of debt | — | (764) | — | (764) | |||||||||||||||||||
| Income from discontinued operations | — | 341,202 | — | 354,418 | |||||||||||||||||||
| Net (loss) income | (956) | 332,770 | (4,643) | 329,352 | |||||||||||||||||||
| Less: Net income attributable to noncontrolling interests in subsidiaries | — | — | — | — | |||||||||||||||||||
| Net (loss) income attributable to the controlling interests | $ | (956) | $ | 332,770 | $ | (4,643) | $ | 329,352 | |||||||||||||||
| Loss from continuing operations | $ | (956) | $ | (8,432) | $ | (4,643) | $ | (25,066) | |||||||||||||||
| Depreciation and amortization | 30,470 | 37,340 | 89,789 | 97,441 | |||||||||||||||||||
| Real estate impairment | — | — | — | 8,374 | |||||||||||||||||||
| Loss on sale of depreciable real estate | — | — | 7,539 | 1,046 | |||||||||||||||||||
| Funds from continuing operations | $ | 29,514 | $ | 28,908 | $ | 92,685 | $ | 81,795 | |||||||||||||||
| Income from discontinued operations | — | 341,202 | — | 354,418 | |||||||||||||||||||
| Discontinued operations real estate depreciation and amortization | — | 59 | — | 4,926 | |||||||||||||||||||
| Gain on sale of real estate | — | (339,024) | — | (339,024) | |||||||||||||||||||
| Funds from discontinued operations | — | 2,237 | — | 20,320 | |||||||||||||||||||
NAREIT funds from operations (1) | $ | 29,514 | $ | 31,145 | $ | 92,685 | $ | 102,115 | |||||||||||||||
| Non-cash gain on extinguishment of debt | — | (244) | (1,177) | $ | (244) | ||||||||||||||||||
| Tenant improvements and incentives | (4,013) | (3,196) | (6,962) | (9,041) | |||||||||||||||||||
| External and internal leasing commissions capitalized | (1,081) | (1,243) | (2,407) | (3,671) | |||||||||||||||||||
| Recurring capital improvements | (1,068) | (1,034) | (2,880) | (2,401) | |||||||||||||||||||
| Straight-line rents, net | (522) | (713) | (1,840) | (2,503) | |||||||||||||||||||
| Non-cash fair value interest expense | — | (179) | (59) | (600) | |||||||||||||||||||
| Non-real estate depreciation & amortization of debt costs | 956 | 1,654 | 2,808 | 3,975 | |||||||||||||||||||
| Amortization of lease intangibles, net | 464 | 528 | 1,465 | 1,679 | |||||||||||||||||||
| Amortization and expensing of restricted share and unit compensation | 2,479 | 1,737 | 5,901 | 6,264 | |||||||||||||||||||
| Funds available for distribution | $ | 26,729 | $ | 28,455 | $ | 87,534 | $ | 95,573 | |||||||||||||||
Washington Real Estate Investment Trust
Page 9 of 13
| Three Months Ended September 30, | Nine Months Ended September 30, | |||||||||||||||||||||||||
| Per share data: | 2020 | 2019 | 2020 | 2019 | ||||||||||||||||||||||
| Loss from continuing operations | (Basic) | $ | (0.01) | $ | (0.10) | $ | (0.06) | $ | (0.31) | |||||||||||||||||
| (Diluted) | $ | (0.01) | $ | (0.10) | $ | (0.06) | $ | (0.31) | ||||||||||||||||||
| Net (loss) income attributable to the controlling interests | (Basic) | $ | (0.01) | $ | 4.14 | $ | (0.06) | $ | 4.10 | |||||||||||||||||
| (Diluted) | $ | (0.01) | $ | 4.14 | $ | (0.06) | $ | 4.10 | ||||||||||||||||||
| NAREIT FFO | (Basic) | $ | 0.36 | $ | 0.39 | $ | 1.12 | $ | 1.27 | |||||||||||||||||
| (Diluted) | $ | 0.36 | $ | 0.39 | $ | 1.12 | $ | 1.27 | ||||||||||||||||||
| Dividends paid | $ | 0.30 | $ | 0.30 | $ | 0.90 | $ | 0.90 | ||||||||||||||||||
| Weighted average shares outstanding - basic | 82,186 | 79,981 | 82,142 | 79,933 | ||||||||||||||||||||||
| Weighted average shares outstanding - diluted | 82,186 | 79,981 | 82,142 | 79,933 | ||||||||||||||||||||||
| Weighted average shares outstanding - diluted (for NAREIT FFO) | 82,357 | 80,040 | 82,322 | 80,006 | ||||||||||||||||||||||
Washington Real Estate Investment Trust
Page 10 of 13
| WASHINGTON REAL ESTATE INVESTMENT TRUST AND SUBSIDIARIES | |||||||||||
| CONSOLIDATED BALANCE SHEETS | |||||||||||
| (In thousands, except per share data) | |||||||||||
| September 30, 2020 | |||||||||||
| (unaudited) | December 31, 2019 | ||||||||||
| Assets | |||||||||||
| Land | $ | 574,025 | $ | 566,807 | |||||||
| Income producing property | 2,497,017 | 2,392,415 | |||||||||
| 3,071,042 | 2,959,222 | ||||||||||
| Accumulated depreciation and amortization | (772,482) | (693,610) | |||||||||
| Net income producing property | 2,298,560 | 2,265,612 | |||||||||
| Properties under development or held for future development | 77,481 | 124,193 | |||||||||
| Total real estate held for investment, net | 2,376,041 | 2,389,805 | |||||||||
| Investment in real estate held for sale, net | — | 57,028 | |||||||||
| Cash and cash equivalents | 3,814 | 12,939 | |||||||||
| Restricted cash | 615 | 1,812 | |||||||||
| Rents and other receivables | 67,628 | 65,259 | |||||||||
| Prepaid expenses and other assets | 84,174 | 95,149 | |||||||||
| Other assets related to properties held for sale | — | 6,336 | |||||||||
| Total assets | $ | 2,532,272 | $ | 2,628,328 | |||||||
| Liabilities | |||||||||||
| Notes payable, net | $ | 897,443 | $ | 996,722 | |||||||
| Mortgage notes payable, net | — | 47,074 | |||||||||
| Line of credit | 186,000 | 56,000 | |||||||||
| Accounts payable and other liabilities | 99,388 | 71,136 | |||||||||
| Dividend payable | 24,767 | 24,668 | |||||||||
| Advance rents | 6,979 | 9,353 | |||||||||
| Tenant security deposits | 10,580 | 10,595 | |||||||||
| Other liabilities related to properties held for sale | — | 718 | |||||||||
| Total liabilities | 1,225,157 | 1,216,266 | |||||||||
| Equity | |||||||||||
| Shareholders' equity | |||||||||||
| Preferred shares; $0.01 par value; 10,000 shares authorized; no shares issued or outstanding | — | — | |||||||||
| Shares of beneficial interest, $0.01 par value; 100,000 shares authorized; 82,351 and 82,099 shares issued and outstanding, as of September 30, 2020 and December 31, 2019, respectively | 824 | 821 | |||||||||
| Additional paid-in capital | 1,601,160 | 1,592,487 | |||||||||
| Distributions in excess of net income | (262,435) | (183,405) | |||||||||
| Accumulated other comprehensive (loss) income | (32,759) | 1,823 | |||||||||
| Total shareholders' equity | 1,306,790 | 1,411,726 | |||||||||
| Noncontrolling interests in subsidiaries | 325 | 336 | |||||||||
| Total equity | 1,307,115 | 1,412,062 | |||||||||
| Total liabilities and equity | $ | 2,532,272 | $ | 2,628,328 | |||||||
Washington Real Estate Investment Trust
Page 11 of 13
| The following tables contain reconciliations of net income to same-store net operating income for the periods presented (in thousands): | |||||||||||||||||||||||
| Three months ended September 30, 2020 | Multifamily | Office | Corporate and other | Total | |||||||||||||||||||
Same-store net operating income (3) | $ | 14,461 | $ | 20,237 | $ | 3,040 | $ | 37,738 | |||||||||||||||
Add: Net operating income from non-same-store properties (3) | 6,817 | — | — | 6,817 | |||||||||||||||||||
Total net operating income (2) | $ | 21,278 | $ | 20,237 | $ | 3,040 | $ | 44,555 | |||||||||||||||
| Deduct: | |||||||||||||||||||||||
| Interest expense | (8,711) | ||||||||||||||||||||||
| Depreciation and amortization | (30,470) | ||||||||||||||||||||||
| General and administrative expenses | (6,330) | ||||||||||||||||||||||
| Net loss | (956) | ||||||||||||||||||||||
| Less: Net income attributable to noncontrolling interests in subsidiaries | — | ||||||||||||||||||||||
| Net loss attributable to the controlling interests | $ | (956) | |||||||||||||||||||||
| Three months ended September 30, 2019 | Multifamily | Office | Corporate and other | Total | |||||||||||||||||||
Same-store net operating income (3) | $ | 15,033 | $ | 21,285 | $ | 3,347 | $ | 39,665 | |||||||||||||||
Add: Net operating income from non-same-store properties (3) | 6,525 | 3,377 | — | 9,902 | |||||||||||||||||||
Total net operating income (2) | $ | 21,558 | $ | 24,662 | $ | 3,347 | $ | 49,567 | |||||||||||||||
| Deduct: | |||||||||||||||||||||||
| Interest expense | (14,198) | ||||||||||||||||||||||
| Depreciation and amortization | (37,340) | ||||||||||||||||||||||
| General and administrative expenses | (6,461) | ||||||||||||||||||||||
| Loss from continuing operations | (8,432) | ||||||||||||||||||||||
| Discontinued operations: | |||||||||||||||||||||||
| Income from operations of properties sold or held for sale | 2,942 | ||||||||||||||||||||||
| Gain on sale of real estate | 339,024 | ||||||||||||||||||||||
| Loss on extinguishment of debt | (764) | ||||||||||||||||||||||
| Net income | 332,770 | ||||||||||||||||||||||
| Less: Net income attributable to noncontrolling interests in subsidiaries | — | ||||||||||||||||||||||
| Net income attributable to the controlling interests | $ | 332,770 | |||||||||||||||||||||
Washington Real Estate Investment Trust
Page 12 of 13
| The following tables contain reconciliations of net income to same-store net operating income for the periods presented (in thousands): | |||||||||||||||||||||||
| Nine months ended September 30, 2020 | Multifamily | Office | Corporate and Other | Total | |||||||||||||||||||
Same-store net operating income(3) | $ | 45,705 | $ | 62,655 | $ | 8,907 | $ | 117,267 | |||||||||||||||
Add: Net operating income from non-same-store properties(3) | 20,094 | 1,332 | — | 21,426 | |||||||||||||||||||
Total net operating income(2) | $ | 65,799 | $ | 63,987 | $ | 8,907 | $ | 138,693 | |||||||||||||||
| Add/(deduct): | |||||||||||||||||||||||
| Interest expense | (28,307) | ||||||||||||||||||||||
| Depreciation and amortization | (89,789) | ||||||||||||||||||||||
| General and administrative expenses | (17,963) | ||||||||||||||||||||||
| Gain on extinguishment of debt | 262 | ||||||||||||||||||||||
| Loss on sale of real estate | (7,539) | ||||||||||||||||||||||
| Net loss | (4,643) | ||||||||||||||||||||||
| Less: Net income attributable to noncontrolling interests in subsidiaries | — | ||||||||||||||||||||||
| Net loss attributable to the controlling interests | $ | (4,643) | |||||||||||||||||||||
| Nine months ended September 30, 2019 | Multifamily | Office | Corporate and Other | Total | |||||||||||||||||||
Same-store net operating income(3) | $ | 45,153 | $ | 66,284 | $ | 10,233 | $ | 121,670 | |||||||||||||||
Add: Net operating income from non-same-store properties(3) | 9,931 | 11,943 | — | 21,874 | |||||||||||||||||||
Total net operating income(2) | $ | 55,084 | $ | 78,227 | $ | 10,233 | $ | 143,544 | |||||||||||||||
| Deduct: | |||||||||||||||||||||||
| Interest expense | (41,946) | ||||||||||||||||||||||
| Depreciation and amortization | (97,441) | ||||||||||||||||||||||
| General and administrative expenses | (19,803) | ||||||||||||||||||||||
| Real estate impairment | (8,374) | ||||||||||||||||||||||
| Loss on sale of real estate | (1,046) | ||||||||||||||||||||||
| Loss from continuing operations | (25,066) | ||||||||||||||||||||||
| Discontinued operations: | |||||||||||||||||||||||
| Income from operations of properties sold or held for sale | 16,158 | ||||||||||||||||||||||
| Gain on sale of real estate | 339,024 | ||||||||||||||||||||||
| Loss on extinguishment of debt | (764) | ||||||||||||||||||||||
| Net income | 329,352 | ||||||||||||||||||||||
| Less: Net income attributable to noncontrolling interests in subsidiaries | — | ||||||||||||||||||||||
| Net income attributable to the controlling interests | $ | 329,352 | |||||||||||||||||||||
Washington Real Estate Investment Trust
Page 13 of 13
| The following table contains a reconciliation of net income attributable to the controlling interests to core funds from operations for the periods presented (in thousands, except per share data): | |||||||||||||||||||||||||||||
| Three Months Ended September 30, | Nine Months Ended September 30, | ||||||||||||||||||||||||||||
| 2020 | 2019 | 2020 | 2019 | ||||||||||||||||||||||||||
| Net (loss) income | $ | (956) | $ | 332,770 | $ | (4,643) | $ | 329,352 | |||||||||||||||||||||
| Add: | |||||||||||||||||||||||||||||
| Real estate depreciation and amortization | 30,470 | 37,340 | 89,789 | 97,441 | |||||||||||||||||||||||||
| Loss on sale of depreciable real estate | — | — | 7,539 | 1,046 | |||||||||||||||||||||||||
| Real estate impairment | — | — | — | 8,374 | |||||||||||||||||||||||||
| Discontinued operations: | |||||||||||||||||||||||||||||
| Gain on sale of real estate | — | (339,024) | — | (339,024) | |||||||||||||||||||||||||
| Real estate depreciation and amortization | — | 59 | — | 4,926 | |||||||||||||||||||||||||
NAREIT funds from operations (1) | 29,514 | 31,145 | 92,685 | 102,115 | |||||||||||||||||||||||||
| Add/(deduct): | |||||||||||||||||||||||||||||
| Restructuring expenses | — | 653 | — | 2,749 | |||||||||||||||||||||||||
| Loss (gain) on extinguishment of debt | — | 764 | (262) | 764 | |||||||||||||||||||||||||
Core funds from operations (1) | $ | 29,514 | $ | 32,562 | $ | 92,423 | $ | 105,628 | |||||||||||||||||||||
| Three Months Ended September 30, | Nine Months Ended September 30, | ||||||||||||||||||||||||||||
| Per share data: | 2020 | 2019 | 2020 | 2019 | |||||||||||||||||||||||||
| NAREIT FFO | (Basic) | $ | 0.36 | $ | 0.39 | $ | 1.12 | $ | 1.27 | ||||||||||||||||||||
| (Diluted) | $ | 0.36 | $ | 0.39 | $ | 1.12 | $ | 1.27 | |||||||||||||||||||||
| Core FFO | (Basic) | $ | 0.36 | $ | 0.41 | $ | 1.12 | $ | 1.32 | ||||||||||||||||||||
| (Diluted) | $ | 0.36 | $ | 0.41 | $ | 1.12 | $ | 1.32 | |||||||||||||||||||||
| Weighted average shares outstanding - basic | 82,186 | 79,981 | 82,142 | 79,933 | |||||||||||||||||||||||||
| Weighted average shares outstanding - diluted (for NAREIT and Core FFO) | 82,357 | 80,040 | 82,322 | 80,006 | |||||||||||||||||||||||||
| Supplemental Financial and Operating Data Table of Contents | ||||||||
| September 30, 2020 | ||||||||
| Schedule | Page | |||||||
| Key Financial Data | ||||||||
| Capital Analysis | ||||||||
| Portfolio Analysis | ||||||||
| Growth and Strategy | ||||||||
Acquisition and Disposition Summary | ||||||||
| Tenant Analysis | ||||||||
| Appendix | ||||||||
Consolidated Statements of Operations (In thousands, except per share data) (Unaudited) | ||
| Nine Months Ended | Three Months Ended | ||||||||||||||||||||||||||||||||||||||||
| OPERATING RESULTS | 9/30/2020 | 9/30/2019 | 9/30/2020 | 6/30/2020 | 3/31/2020 | 12/31/2019 | 9/30/2019 | ||||||||||||||||||||||||||||||||||
| Real estate rental revenue | $ | 222,889 | $ | 228,513 | $ | 73,227 | $ | 72,870 | $ | 76,792 | $ | 80,667 | $ | 80,259 | |||||||||||||||||||||||||||
| Real estate expenses | (84,196) | (84,969) | (28,672) | (26,885) | (28,639) | (30,611) | (30,692) | ||||||||||||||||||||||||||||||||||
| 138,693 | 143,544 | 44,555 | 45,985 | 48,153 | 50,056 | 49,567 | |||||||||||||||||||||||||||||||||||
| Real estate depreciation and amortization | (89,789) | (97,441) | (30,470) | (29,599) | (29,720) | (38,812) | (37,340) | ||||||||||||||||||||||||||||||||||
| Income from real estate | 48,904 | 46,103 | 14,085 | 16,386 | 18,433 | 11,244 | 12,227 | ||||||||||||||||||||||||||||||||||
| Interest expense | (28,307) | (41,946) | (8,711) | (8,751) | (10,845) | (11,788) | (14,198) | ||||||||||||||||||||||||||||||||||
| (Loss) gain on sale of real estate | (7,539) | (1,046) | — | (7,539) | — | 61,007 | — | ||||||||||||||||||||||||||||||||||
| Gain (loss) on extinguishment of debt | 262 | — | — | (206) | 468 | — | — | ||||||||||||||||||||||||||||||||||
| Real estate impairment | — | (8,374) | — | — | — | — | — | ||||||||||||||||||||||||||||||||||
| General and administrative expenses | (17,963) | (19,803) | (6,330) | (5,296) | (6,337) | (6,265) | (6,461) | ||||||||||||||||||||||||||||||||||
| (Loss) income from continuing operations | (4,643) | (25,066) | (956) | (5,406) | 1,719 | 54,198 | (8,432) | ||||||||||||||||||||||||||||||||||
| Discontinued operations: | |||||||||||||||||||||||||||||||||||||||||
| Income from properties classified as discontinued operations | — | 16,158 | — | — | — | — | 2,942 | ||||||||||||||||||||||||||||||||||
| Gain on sale of real estate | — | 339,024 | — | — | — | — | 339,024 | ||||||||||||||||||||||||||||||||||
| Loss on extinguishment of debt | — | (764) | — | — | — | — | (764) | ||||||||||||||||||||||||||||||||||
| Income from discontinued operations | — | 354,418 | — | — | — | — | 341,202 | ||||||||||||||||||||||||||||||||||
| Net (loss) income | (4,643) | 329,352 | (956) | (5,406) | 1,719 | 54,198 | 332,770 | ||||||||||||||||||||||||||||||||||
| Less: Net income attributable to noncontrolling interests in subsidiaries | — | — | — | — | — | — | — | ||||||||||||||||||||||||||||||||||
| Net (loss) income attributable to the controlling interests | $ | (4,643) | $ | 329,352 | $ | (956) | $ | (5,406) | $ | 1,719 | $ | 54,198 | $ | 332,770 | |||||||||||||||||||||||||||
| Per Share Data: | |||||||||||||||||||||||||||||||||||||||||
| Net (loss) income attributable to the controlling interests | $ | (0.06) | $ | 4.10 | $ | (0.01) | $ | (0.07) | $ | 0.02 | $ | 0.66 | $ | 4.14 | |||||||||||||||||||||||||||
| Fully diluted weighted average shares outstanding | 82,142 | 79,933 | 82,186 | 82,153 | 82,287 | 81,313 | 79,981 | ||||||||||||||||||||||||||||||||||
| Percentage of Revenues: | |||||||||||||||||||||||||||||||||||||||||
| Real estate expenses | 37.8 | % | 37.2 | % | 39.2 | % | 36.9 | % | 37.3 | % | 37.9 | % | 38.2 | % | |||||||||||||||||||||||||||
| General and administrative expenses | 8.1 | % | 8.7 | % | 8.6 | % | 7.3 | % | 8.3 | % | 7.8 | % | 8.1 | % | |||||||||||||||||||||||||||
| Ratios: | |||||||||||||||||||||||||||||||||||||||||
| Adjusted EBITDA / Interest expense (includes discontinued operations) | 4.3 | x | 3.5 | x | 4.4 | x | 4.7 | x | 3.9 | x | 3.8 | x | 3.3 | x | |||||||||||||||||||||||||||
| Net (loss) income attributable to the controlling interests / Real estate rental revenue | (2.1) | % | 144.1 | % | (1.3) | % | (7.4) | % | 2.2 | % | 67.2 | % | 414.6 | % | |||||||||||||||||||||||||||
4
Consolidated Balance Sheets (In thousands, except per share data) (Unaudited) | ||
| 9/30/2020 | 6/30/2020 | 3/31/2020 | 12/31/2019 | 9/30/2019 | |||||||||||||||||||||||||
| Assets | |||||||||||||||||||||||||||||
| Land | $ | 574,025 | $ | 574,025 | $ | 574,025 | $ | 566,807 | $ | 611,797 | |||||||||||||||||||
| Income producing property | 2,497,017 | 2,467,629 | 2,444,525 | 2,392,415 | 2,486,966 | ||||||||||||||||||||||||
| 3,071,042 | 3,041,654 | 3,018,550 | 2,959,222 | 3,098,763 | |||||||||||||||||||||||||
| Accumulated depreciation and amortization | (772,482) | (745,692) | (719,446) | (693,610) | (724,433) | ||||||||||||||||||||||||
| Net income producing property | 2,298,560 | 2,295,962 | 2,299,104 | 2,265,612 | 2,374,330 | ||||||||||||||||||||||||
| Properties under development or held for future development | 77,481 | 89,166 | 89,791 | 124,193 | 110,572 | ||||||||||||||||||||||||
| Total real estate held for investment, net | 2,376,041 | 2,385,128 | 2,388,895 | 2,389,805 | 2,484,902 | ||||||||||||||||||||||||
| Investment in real estate held for sale, net | — | — | 57,028 | 57,028 | — | ||||||||||||||||||||||||
| Cash and cash equivalents | 3,814 | 7,971 | 20,601 | 12,939 | 12,931 | ||||||||||||||||||||||||
| Restricted cash | 615 | 630 | 634 | 1,812 | 1,578 | ||||||||||||||||||||||||
| Rents and other receivables | 67,628 | 67,026 | 64,617 | 65,259 | 69,414 | ||||||||||||||||||||||||
| Prepaid expenses and other assets | 84,174 | 81,967 | 84,722 | 95,149 | 106,251 | ||||||||||||||||||||||||
| Other assets related to properties sold or held for sale | — | — | 6,123 | 6,336 | — | ||||||||||||||||||||||||
| Total assets | $ | 2,532,272 | $ | 2,542,722 | $ | 2,622,620 | $ | 2,628,328 | $ | 2,675,076 | |||||||||||||||||||
| Liabilities | |||||||||||||||||||||||||||||
| Notes payable, net | $ | 897,443 | $ | 897,060 | $ | 997,075 | $ | 996,722 | $ | 996,455 | |||||||||||||||||||
| Mortgage notes payable, net | — | — | — | 47,074 | 47,319 | ||||||||||||||||||||||||
| Line of credit | 186,000 | 181,000 | 148,000 | 56,000 | 211,000 | ||||||||||||||||||||||||
| Accounts payable and other liabilities | 99,388 | 93,192 | 98,966 | 71,136 | 75,735 | ||||||||||||||||||||||||
| Dividend payable | 24,767 | 24,760 | — | 24,668 | — | ||||||||||||||||||||||||
| Advance rents | 6,979 | 7,375 | 8,681 | 9,353 | 9,475 | ||||||||||||||||||||||||
| Tenant security deposits | 10,580 | 10,769 | 10,875 | 10,595 | 10,849 | ||||||||||||||||||||||||
| Other liabilities related to properties sold or held for sale | — | — | 875 | 718 | — | ||||||||||||||||||||||||
| Total liabilities | 1,225,157 | 1,214,156 | 1,264,472 | 1,216,266 | 1,350,833 | ||||||||||||||||||||||||
| Equity | |||||||||||||||||||||||||||||
| Preferred shares; $0.01 par value; 10,000 shares authorized | — | — | — | — | — | ||||||||||||||||||||||||
| Shares of beneficial interest, $0.01 par value; 100,000 shares authorized | 824 | 823 | 823 | 821 | 803 | ||||||||||||||||||||||||
| Additional paid-in capital | 1,601,160 | 1,598,620 | 1,596,242 | 1,592,487 | 1,539,734 | ||||||||||||||||||||||||
| Distributions in excess of net income | (262,435) | (236,673) | (206,506) | (183,405) | (212,978) | ||||||||||||||||||||||||
| Accumulated other comprehensive (loss) income | (32,759) | (34,533) | (32,744) | 1,823 | (3,659) | ||||||||||||||||||||||||
| Total shareholders' equity | 1,306,790 | 1,328,237 | 1,357,815 | 1,411,726 | 1,323,900 | ||||||||||||||||||||||||
| Noncontrolling interests in subsidiaries | 325 | 329 | 333 | 336 | 343 | ||||||||||||||||||||||||
| Total equity | 1,307,115 | 1,328,566 | 1,358,148 | 1,412,062 | 1,324,243 | ||||||||||||||||||||||||
| Total liabilities and equity | $ | 2,532,272 | $ | 2,542,722 | $ | 2,622,620 | $ | 2,628,328 | $ | 2,675,076 | |||||||||||||||||||
5
Funds from Operations (In thousands, except per share data) (Unaudited) | ||
| Nine Months Ended | Three Months Ended | ||||||||||||||||||||||||||||||||||||||||
| 9/30/2020 | 9/30/2019 | 9/30/2020 | 6/30/2020 | 3/31/2020 | 12/31/2019 | 9/30/2019 | |||||||||||||||||||||||||||||||||||
Funds from operations (FFO) (1) | |||||||||||||||||||||||||||||||||||||||||
| Net (loss) income | $ | (4,643) | $ | 329,352 | $ | (956) | $ | (5,406) | $ | 1,719 | $ | 54,198 | $ | 332,770 | |||||||||||||||||||||||||||
| Real estate depreciation and amortization | 89,789 | 97,441 | 30,470 | 29,599 | 29,720 | 38,812 | 37,340 | ||||||||||||||||||||||||||||||||||
| Loss (gain) on sale of depreciable real estate | 7,539 | 1,046 | — | 7,539 | — | (61,007) | — | ||||||||||||||||||||||||||||||||||
| Real estate impairment | — | 8,374 | — | — | — | — | — | ||||||||||||||||||||||||||||||||||
| Discontinued operations: | |||||||||||||||||||||||||||||||||||||||||
| Gain on sale of depreciable real estate | — | (339,024) | — | — | — | — | (339,024) | ||||||||||||||||||||||||||||||||||
| Real estate depreciation and amortization | — | 4,926 | — | — | — | — | 59 | ||||||||||||||||||||||||||||||||||
| NAREIT funds from operations (FFO) | 92,685 | 102,115 | 29,514 | 31,732 | 31,439 | 32,003 | 31,145 | ||||||||||||||||||||||||||||||||||
| (Gain) loss on extinguishment of debt | (262) | 764 | — | 206 | (468) | — | 764 | ||||||||||||||||||||||||||||||||||
Restructuring expenses (2) | — | 2,749 | — | — | — | 270 | 653 | ||||||||||||||||||||||||||||||||||
Core FFO (1) | $ | 92,423 | $ | 105,628 | $ | 29,514 | $ | 31,938 | $ | 30,971 | $ | 32,273 | $ | 32,562 | |||||||||||||||||||||||||||
Allocation to participating securities (3) | (453) | (396) | (151) | (151) | (151) | (81) | (129) | ||||||||||||||||||||||||||||||||||
| NAREIT FFO per share - basic | $ | 1.12 | $ | 1.27 | $ | 0.36 | $ | 0.38 | $ | 0.38 | $ | 0.39 | $ | 0.39 | |||||||||||||||||||||||||||
| NAREIT FFO per share - fully diluted | $ | 1.12 | $ | 1.27 | $ | 0.36 | $ | 0.38 | $ | 0.38 | $ | 0.39 | $ | 0.39 | |||||||||||||||||||||||||||
| Core FFO per share - fully diluted | $ | 1.12 | $ | 1.32 | $ | 0.36 | $ | 0.39 | $ | 0.37 | $ | 0.40 | $ | 0.41 | |||||||||||||||||||||||||||
| Common dividend per share | $ | 0.90 | $ | 0.90 | $ | 0.30 | $ | 0.30 | $ | 0.30 | $ | 0.30 | $ | 0.30 | |||||||||||||||||||||||||||
| Average shares - basic | 82,142 | 79,933 | 82,186 | 82,153 | 82,086 | 81,220 | 79,981 | ||||||||||||||||||||||||||||||||||
| Average shares - fully diluted (for NAREIT FFO and Core FFO) | 82,322 | 80,006 | 82,357 | 82,323 | 82,287 | 81,313 | 80,040 | ||||||||||||||||||||||||||||||||||
______________________________ | |||||||||||||||||||||||||||||||||||||||||
(1) See "Supplemental Definitions" on page 36 of this supplemental for the definitions of NAREIT FFO and Core FFO. | |||||||||||||||||||||||||||||||||||||||||
(2) Restructuring expenses include severance, accelerated share-based compensation and other expenses related to a restructuring of WashREIT personnel. | |||||||||||||||||||||||||||||||||||||||||
(3) Adjustment to the numerators for FFO and Core FFO per share calculations when applying the two-class method for calculating EPS. | |||||||||||||||||||||||||||||||||||||||||
6
Funds Available for Distribution (In thousands, except per share data) (Unaudited) | ||
| Nine Months Ended | Three Months Ended | ||||||||||||||||||||||||||||||||||||||||
| 9/30/2020 | 9/30/2019 | 9/30/2020 | 6/30/2020 | 3/31/2020 | 12/31/2019 | 9/30/2019 | |||||||||||||||||||||||||||||||||||
Funds available for distribution (FAD) (1) | |||||||||||||||||||||||||||||||||||||||||
| NAREIT FFO | $ | 92,685 | $ | 102,115 | $ | 29,514 | $ | 31,732 | $ | 31,439 | $ | 32,003 | $ | 31,145 | |||||||||||||||||||||||||||
| Non-cash (gain) loss on extinguishment of debt | (1,177) | (244) | — | 204 | (1,381) | — | (244) | ||||||||||||||||||||||||||||||||||
| Tenant improvements and incentives | (6,962) | (9,041) | (4,013) | (1,877) | (1,072) | (6,857) | (3,196) | ||||||||||||||||||||||||||||||||||
| External and internal leasing commissions capitalized | (2,407) | (3,671) | (1,081) | (797) | (529) | (2,700) | (1,243) | ||||||||||||||||||||||||||||||||||
| Recurring capital improvements | (2,880) | (2,401) | (1,068) | (824) | (988) | (4,345) | (1,034) | ||||||||||||||||||||||||||||||||||
| Straight-line rent, net | (1,840) | (2,503) | (522) | (655) | (663) | (763) | (713) | ||||||||||||||||||||||||||||||||||
| Non-cash fair value interest expense | (59) | (600) | — | — | (59) | (178) | (179) | ||||||||||||||||||||||||||||||||||
| Non-real estate depreciation and amortization of debt costs | 2,808 | 3,975 | 956 | 910 | 942 | 1,030 | 1,654 | ||||||||||||||||||||||||||||||||||
| Amortization of lease intangibles, net | 1,465 | 1,679 | 464 | 544 | 457 | 504 | 528 | ||||||||||||||||||||||||||||||||||
| Amortization and expensing of restricted share and unit compensation | 5,901 | 6,264 | 2,479 | 1,644 | 1,778 | 1,479 | 1,737 | ||||||||||||||||||||||||||||||||||
| FAD | 87,534 | 95,573 | 26,729 | 30,881 | 29,924 | 20,173 | 28,455 | ||||||||||||||||||||||||||||||||||
| Cash loss on extinguishment of debt | 915 | 1,008 | — | 2 | 913 | — | 1,008 | ||||||||||||||||||||||||||||||||||
| Restructuring expenses (excluding accelerated share-based compensation) | — | 1,552 | — | — | — | 270 | 436 | ||||||||||||||||||||||||||||||||||
Core FAD (1) | $ | 88,449 | $ | 98,133 | $ | 26,729 | $ | 30,883 | $ | 30,837 | $ | 20,443 | $ | 29,899 | |||||||||||||||||||||||||||
______________________________ | |||||||||||||||||||||||||||||||||||||||||
(1) See "Supplemental Definitions" on page 36 of this supplemental for the definitions of FAD and Core FAD. | |||||||||||||||||||||||||||||||||||||||||
7
Adjusted Earnings Before Interest, Taxes, Depreciation and Amortization (EBITDA) (In thousands) (Unaudited) | ||
| Nine Months Ended | Three Months Ended | ||||||||||||||||||||||||||||||||||||||||
| 9/30/2020 | 9/30/2019 | 9/30/2020 | 6/30/2020 | 3/31/2020 | 12/31/2019 | 9/30/2019 | |||||||||||||||||||||||||||||||||||
Adjusted EBITDA (1) | |||||||||||||||||||||||||||||||||||||||||
| Net (loss) income | $ | (4,643) | $ | 329,352 | $ | (956) | $ | (5,406) | $ | 1,719 | $ | 54,198 | $ | 332,770 | |||||||||||||||||||||||||||
| Add: | |||||||||||||||||||||||||||||||||||||||||
| Interest expense | 28,307 | 42,259 | 8,711 | 8,751 | 10,845 | 11,788 | 14,228 | ||||||||||||||||||||||||||||||||||
| Real estate depreciation and amortization | 89,789 | 102,367 | 30,470 | 29,599 | 29,720 | 38,812 | 37,399 | ||||||||||||||||||||||||||||||||||
| Real estate impairment | — | 8,374 | — | — | — | — | — | ||||||||||||||||||||||||||||||||||
| Non-real estate depreciation | 713 | 743 | 234 | 241 | 238 | 276 | 250 | ||||||||||||||||||||||||||||||||||
| Restructuring expenses | — | 2,749 | — | — | — | 270 | 653 | ||||||||||||||||||||||||||||||||||
| Less: | |||||||||||||||||||||||||||||||||||||||||
| Loss (gain) on sale of depreciable real estate | 7,539 | (337,978) | — | 7,539 | — | (61,007) | (339,024) | ||||||||||||||||||||||||||||||||||
| (Gain) loss on extinguishment of debt | (262) | 764 | — | 206 | (468) | — | 764 | ||||||||||||||||||||||||||||||||||
| Adjusted EBITDA | $ | 121,443 | $ | 148,630 | $ | 38,459 | $ | 40,930 | $ | 42,054 | $ | 44,337 | $ | 47,040 | |||||||||||||||||||||||||||
______________________________ | |||||||||||||||||||||||||||||||||||||||||
(1) Adjusted EBITDA is earnings before interest expense, taxes, depreciation, amortization, gain/loss on sale of real estate, casualty gain/loss, real estate impairment, gain/loss on extinguishment of debt, restructuring expenses (which include severance, accelerated share-based compensation and other expenses related to a restructuring of corporate personnel), acquisition expenses and gain from non-disposal activities. We consider Adjusted EBITDA to be an appropriate supplemental performance measure because it permits investors to view income from operations without the effect of depreciation, and the cost of debt or non-operating gains and losses. Adjusted EBITDA is a non-GAAP measure. | |||||||||||||||||||||||||||||||||||||||||
8
Long Term Debt Analysis ($'s in thousands) | ||
| 9/30/2020 | 6/30/2020 | 3/31/2020 | 12/31/2019 | 9/30/2019 | |||||||||||||||||||||||||
| Balances Outstanding | |||||||||||||||||||||||||||||
| Secured | |||||||||||||||||||||||||||||
Mortgage note payable, net (1) | $ | — | $ | — | $ | — | $ | 47,074 | $ | 47,319 | |||||||||||||||||||
| Unsecured | |||||||||||||||||||||||||||||
| Fixed rate bonds | 348,522 | 348,375 | 598,028 | 597,781 | 597,618 | ||||||||||||||||||||||||
| Term loans | 548,921 | 548,685 | 399,047 | 398,941 | 398,837 | ||||||||||||||||||||||||
| Credit facility | 186,000 | 181,000 | 148,000 | 56,000 | 211,000 | ||||||||||||||||||||||||
| Unsecured total | 1,083,443 | 1,078,060 | 1,145,075 | 1,052,722 | 1,207,455 | ||||||||||||||||||||||||
| Total | $ | 1,083,443 | $ | 1,078,060 | $ | 1,145,075 | $ | 1,099,796 | $ | 1,254,774 | |||||||||||||||||||
| Weighted Average Interest Rates | |||||||||||||||||||||||||||||
| Secured | |||||||||||||||||||||||||||||
Mortgage note payable, net (1) | — | % | — | % | — | % | 3.8 | % | 3.8 | % | |||||||||||||||||||
| Unsecured | |||||||||||||||||||||||||||||
| Fixed rate bonds | 4.5 | % | 4.5 | % | 4.7 | % | 4.7 | % | 4.7 | % | |||||||||||||||||||
Term loans (2) | 2.6 | % | 2.6 | % | 2.8 | % | 2.8 | % | 2.8 | % | |||||||||||||||||||
| Credit facility | 1.1 | % | 1.2 | % | 1.8 | % | 2.7 | % | 3.1 | % | |||||||||||||||||||
| Unsecured total | 3.0 | % | 3.0 | % | 3.7 | % | 3.9 | % | 3.8 | % | |||||||||||||||||||
| Weighted Average | 3.0 | % | 3.0 | % | 3.7 | % | 3.9 | % | 3.8 | % | |||||||||||||||||||
______________________________ | |||||||||||||||||||||||||||||
(1) In January 2020, WashREIT prepaid the existing mortgage note associated with Yale West, resulting in a gain on extinguishment of debt of $0.5 million. | |||||||||||||||||||||||||||||
(2) WashREIT entered into interest rate swaps to effectively fix the floating interest rates on $400.0 million of its total $550.0 million aggregate principal of its term loans outstanding as of September 30, 2020 (see page 10 of this Supplemental). | |||||||||||||||||||||||||||||
Note: The current debt balances outstanding are shown net of discounts, premiums and unamortized debt costs (see page 10 of this Supplemental). | |||||||||||||||||||||||||||||
9
Long Term Debt Maturities (in thousands, except average interest rates) | ||
| September 30, 2020 | ||
| Future Maturities of Debt | ||||||||||||||||||||||||||
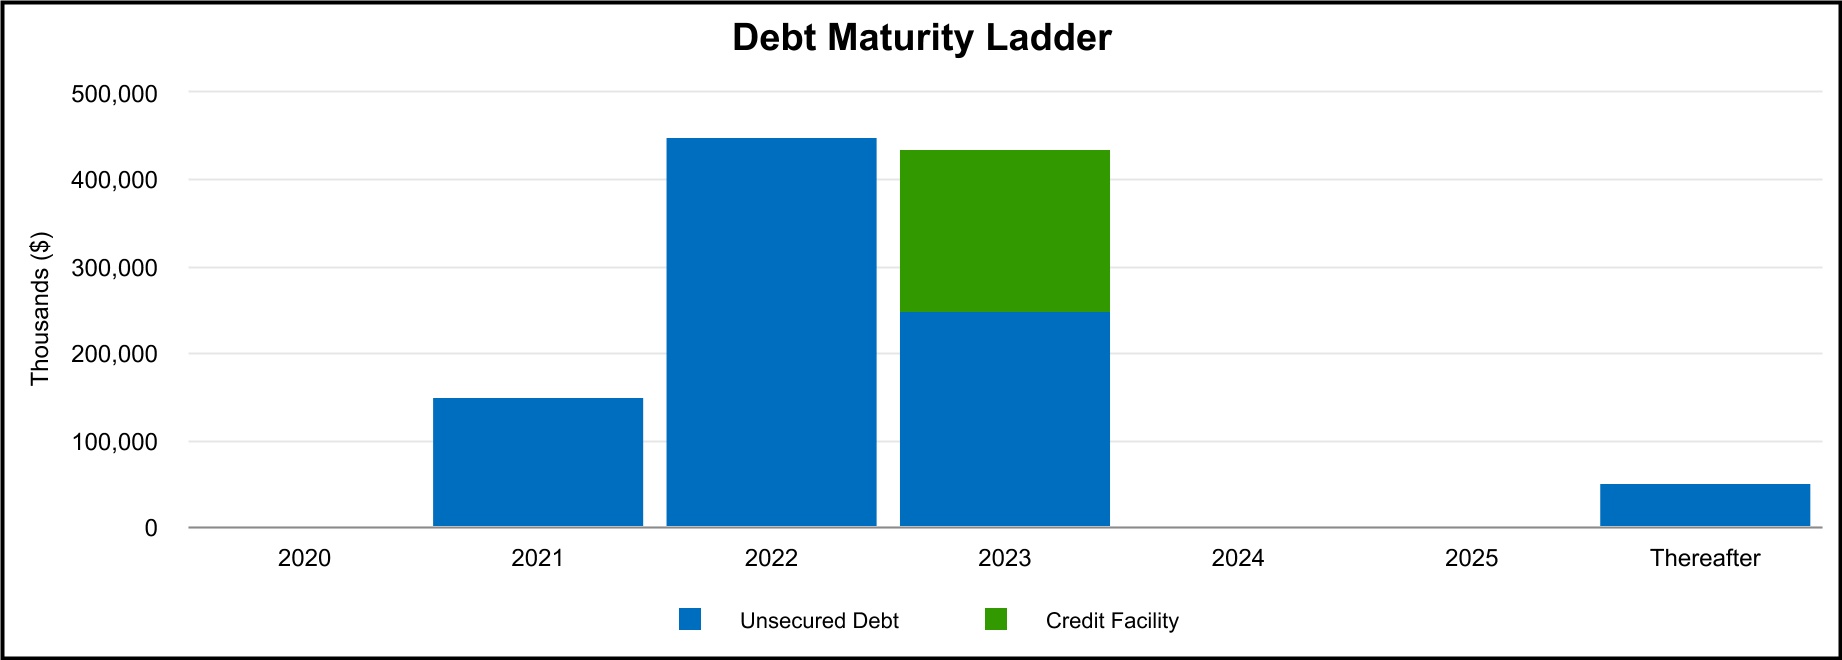
| Year | Unsecured Debt | Credit Facility | Total Debt | Avg Interest Rate | ||||||||||||||||||||||
| 2020 | $ | — | $ | — | $ | — | —% | |||||||||||||||||||
| 2021 | 150,000 | (1) | — | 150,000 | 2.7% | |||||||||||||||||||||
| 2022 | 450,000 | (2) | — | 450,000 | 3.3% | |||||||||||||||||||||
| 2023 | 250,000 | (3) | 186,000 | (4) | 436,000 | 2.1% | ||||||||||||||||||||
| 2024 | — | — | — | —% | ||||||||||||||||||||||
| 2025 | — | — | — | —% | ||||||||||||||||||||||
| Thereafter | 50,000 | — | 50,000 | 7.4% | ||||||||||||||||||||||
| Scheduled principal payments | $ | 900,000 | $ | 186,000 | $ | 1,086,000 | 3.0% | |||||||||||||||||||
| Net discounts/premiums | (504) | — | (504) | |||||||||||||||||||||||
| Loan costs, net of amortization | (2,053) | — | (2,053) | |||||||||||||||||||||||
| Total maturities | $ | 897,443 | $ | 186,000 | $ | 1,083,443 | 3.0% | |||||||||||||||||||
Weighted average maturity = 2.2 years
______________________________
(1) WashREIT entered into interest rate swaps to effectively fix a LIBOR plus 110 basis points floating interest rate to a 2.72% all-in fixed interest rate through the term loan maturity of March 2021.
(2) Maturity date for a $150.0 million term loan of May 2022 assumes election of extension option for an additional one-year period.
(3) WashREIT entered into interest rate swaps to effectively fix a LIBOR plus 110 basis points floating interest rate to a 2.31% all-in fixed interest rate for $150.0 million portion of the term loan. For the remaining $100.0 million portion of the term loan, WashREIT entered into interest rate swaps to effectively fix a LIBOR plus 100 basis points floating interest rate to a 3.71% all-in fixed interest rate. The interest rates are fixed through the term loan maturity of July 2023. The 2018 Term Loan has an all-in fixed interest rate of 2.87%.
(4) Maturity date for credit facility of March 2023 assumes election of extension option for two additional 6-month periods.
10
Long Term Debt Maturities - Pro Forma (in thousands, except average interest rates) | ||
| December 31, 2020 | ||
| Future Maturities of Debt | ||||||||||||||||||||||||||
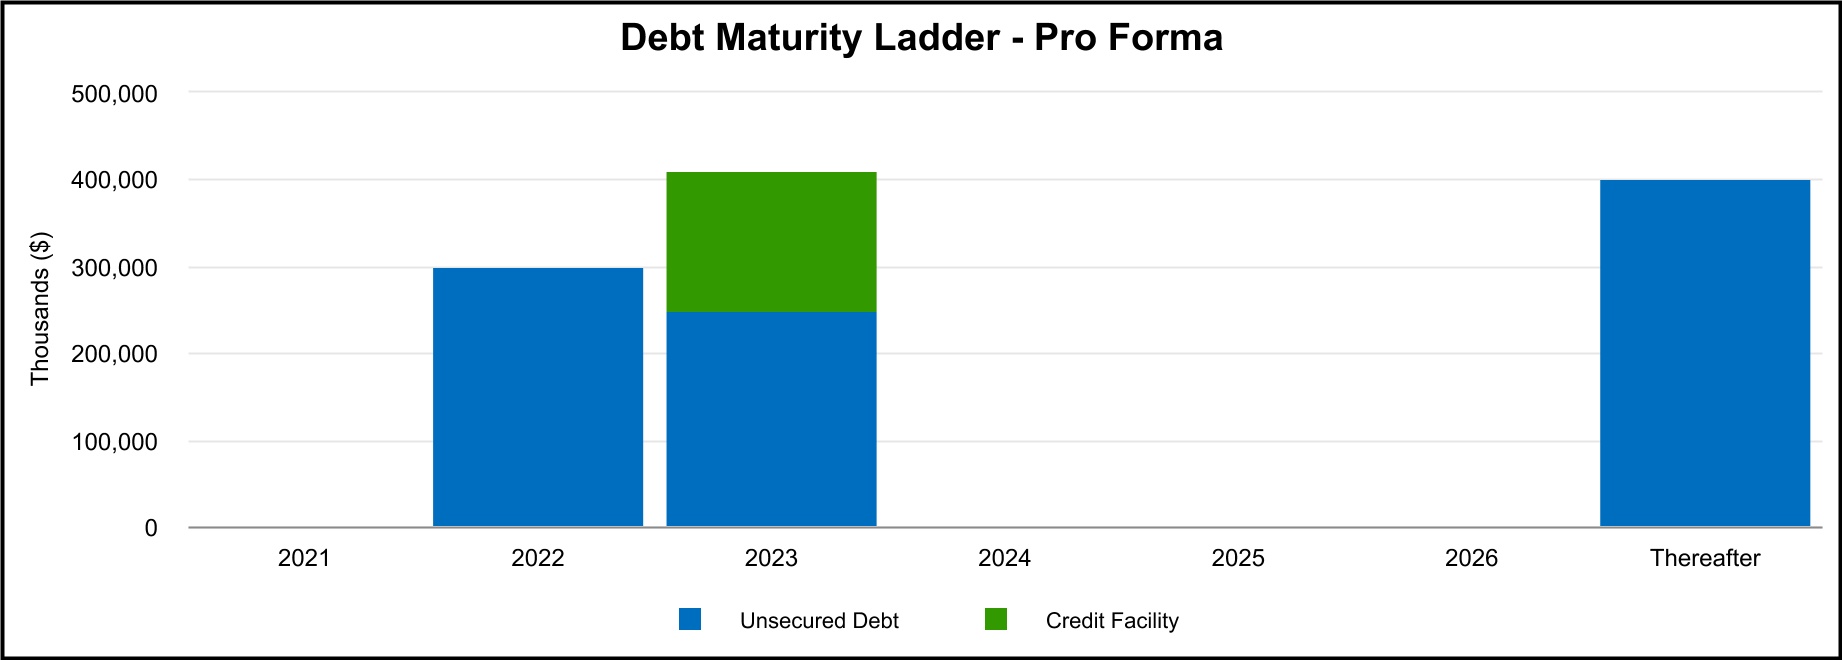
| Year | Unsecured Debt | Credit Facility | Total Debt | Avg Interest Rate | ||||||||||||||||||||||
| 2021 | $ | — | $ | — | $ | — | —% | |||||||||||||||||||
| 2022 | 300,000 | — | 300,000 | 4.0% | ||||||||||||||||||||||
| 2023 | 250,000 | 159,000 | (2) | 409,000 | 2.2% | |||||||||||||||||||||
| 2024 | — | — | — | —% | ||||||||||||||||||||||
| 2025 | — | — | — | —% | ||||||||||||||||||||||
| 2026 | — | — | — | —% | ||||||||||||||||||||||
Thereafter (1) | 400,000 | — | 400,000 | 4.5% | ||||||||||||||||||||||
| Scheduled principal payments | $ | 950,000 | $ | 159,000 | $ | 1,109,000 | 3.5% | |||||||||||||||||||
Weighted average maturity = 4.9 years
______________________________
(1) The table above considers the closing and funding of the $350 million 10-year 3.44% Green Bonds which is expected to occur no later than December 29, 2020. The Green Bonds have an all-in fixed interest rate of 4.09%. Following the closing and funding of the Green Bonds, WashREIT expects to repay $300 million of existing term loans maturing in 2021 and 2022 with the balance to pay down amounts due under the revolving credit facility and will have no debt maturing until the fourth quarter of 2022.
(2) The remaining proceeds used to pay down amounts due under the revolving credit facility balance are net of swap settlement fees and expenses.
11
Debt Covenant Compliance | ||
| Unsecured Public Debt Covenants | Unsecured Private Debt Covenants | ||||||||||||||||||||||||||||||||||
| Notes Payable | Line of Credit and Term Loans | Notes Payable | |||||||||||||||||||||||||||||||||
| Quarter Ended September 30, 2020 | Covenant | Quarter Ended September 30, 2020 | Covenant | Quarter Ended September 30, 2020 | Covenant | ||||||||||||||||||||||||||||||
% of Total Indebtedness to Total Assets(1) | 40.9 | % | ≤ 65.0% | N/A | N/A | N/A | N/A | ||||||||||||||||||||||||||||
| Ratio of Income Available for Debt Service to Annual Debt Service | 3.8 | ≥ 1.5 | N/A | N/A | N/A | N/A | |||||||||||||||||||||||||||||
% of Secured Indebtedness to Total Assets(1) | — | % | ≤ 40.0% | N/A | N/A | N/A | N/A | ||||||||||||||||||||||||||||
Ratio of Total Unencumbered Assets(2) to Total Unsecured Indebtedness | 2.4 | ≥ 1.5 | N/A | N/A | N/A | N/A | |||||||||||||||||||||||||||||
% of Net Consolidated Total Indebtedness to Consolidated Total Asset Value(3) | N/A | N/A | 33.9 | % | ≤ 60.0% | 33.9 | % | ≤ 60.0% | |||||||||||||||||||||||||||
Ratio of Consolidated Adjusted EBITDA(4) to Consolidated Fixed Charges(5) | N/A | N/A | 4.48 | ≥ 1.50 | 4.48 | ≥ 1.50 | |||||||||||||||||||||||||||||
% of Consolidated Secured Indebtedness to Consolidated Total Asset Value(3) | N/A | N/A | — | % | ≤ 40.0% | — | % | ≤ 40.0% | |||||||||||||||||||||||||||
% of Consolidated Unsecured Indebtedness to Unencumbered Pool Value(6) | N/A | N/A | 33.9 | % | ≤ 60.0% | 33.9 | % | ≤ 60.0% | |||||||||||||||||||||||||||
| Ratio of Unencumbered Adjusted Net Operating Income to Consolidated Unsecured Interest Expense | N/A | N/A | 5.23 | ≥ 1.75 | 5.23 | ≥ 1.75 | |||||||||||||||||||||||||||||
______________________________ | |||||||||||||||||||||||||||||||||||
(1) Total Assets is calculated by applying a capitalization rate of 7.50% to the EBITDA(4) from the last four consecutive quarters, excluding EBITDA from acquired, disposed, and non-stabilized development properties. | |||||||||||||||||||||||||||||||||||
(2) Total Unencumbered Assets is calculated by applying a capitalization rate of 7.50% to the EBITDA(4) from unencumbered properties from the last four consecutive quarters, excluding EBITDA from acquired, disposed, and non-stabilized development properties. | |||||||||||||||||||||||||||||||||||
(3) Consolidated Total Asset Value is the sum of unrestricted cash plus the quotient of applying a capitalization rate to the annualized NOI from the most recently ended quarter for each asset class, excluding NOI from disposed properties, acquisitions during the past 6 quarters, development, major redevelopment and low occupancy properties. To this amount, we add the purchase price of acquisitions during the past 6 quarters plus values for development, major redevelopment and low occupancy properties. | |||||||||||||||||||||||||||||||||||
(4) Consolidated Adjusted EBITDA is defined as earnings before noncontrolling interests, depreciation, amortization, interest expense, income tax expense, acquisition costs, extraordinary, unusual or nonrecurring transactions including sale of assets, impairment, gains and losses on extinguishment of debt and other non-cash charges. | |||||||||||||||||||||||||||||||||||
(5) Consolidated Fixed Charges consist of interest expense excluding capitalized interest and amortization of deferred financing costs, principal payments and preferred dividends, if any. | |||||||||||||||||||||||||||||||||||
(6) Unencumbered Pool Value is the sum of unrestricted cash plus the quotient of applying a capitalization rate to the annualized NOI from unencumbered properties from the most recently ended quarter for each asset class excluding NOI from disposed properties, acquisitions during the past 6 quarters, development, major redevelopment and low occupancy properties. To this we add the purchase price of unencumbered acquisitions during the past 6 quarters and values for unencumbered development, major redevelopment and low occupancy properties. | |||||||||||||||||||||||||||||||||||
12
Capital Analysis (In thousands, except per share amounts) | ||
| Three Months Ended | |||||||||||||||||||||||||||||||||||||||||
| 9/30/2020 | 6/30/2020 | 3/31/2020 | 12/31/2019 | 9/30/2019 | |||||||||||||||||||||||||||||||||||||
| Market Data | |||||||||||||||||||||||||||||||||||||||||
| Shares Outstanding | 82,351 | 82,327 | 82,315 | 82,099 | 80,292 | ||||||||||||||||||||||||||||||||||||
| Market Price per Share | $ | 20.13 | $ | 22.20 | $ | 23.87 | $ | 29.18 | $ | 27.36 | |||||||||||||||||||||||||||||||
| Equity Market Capitalization | $ | 1,657,726 | $ | 1,827,659 | $ | 1,964,859 | $ | 2,395,649 | $ | 2,196,789 | |||||||||||||||||||||||||||||||
| Total Debt | $ | 1,083,443 | $ | 1,078,060 | $ | 1,145,075 | $ | 1,099,796 | $ | 1,254,774 | |||||||||||||||||||||||||||||||
| Total Market Capitalization | $ | 2,741,169 | $ | 2,905,719 | $ | 3,109,934 | $ | 3,495,445 | $ | 3,451,563 | |||||||||||||||||||||||||||||||
| Total Debt to Market Capitalization | 0.40 | :1 | 0.37 | :1 | 0.37 | :1 | 0.31 | :1 | 0.36 | :1 | |||||||||||||||||||||||||||||||
Earnings to Fixed Charges(1) | 0.8x | 0.4x | 1.1x | 5.2x | 0.4x | ||||||||||||||||||||||||||||||||||||
Debt Service Coverage Ratio(2) | 4.4x | 4.7x | 3.9x | 3.7x | 3.2x | ||||||||||||||||||||||||||||||||||||
| Dividend Data | Nine Months Ended | Three Months Ended | |||||||||||||||||||||||||||||||||||||||
| 9/30/2020 | 9/30/2019 | 9/30/2020 | 6/30/2020 | 3/31/2020 | 12/31/2019 | 9/30/2019 | |||||||||||||||||||||||||||||||||||
| Total Dividends Declared | $ | 74,387 | $ | 72,339 | $ | 24,806 | $ | 24,761 | $ | 24,820 | $ | 24,625 | $ | 24,087 | |||||||||||||||||||||||||||
| Common Dividend Declared per Share | $ | 0.90 | $ | 0.90 | $ | 0.30 | $ | 0.30 | $ | 0.30 | $ | 0.30 | $ | 0.30 | |||||||||||||||||||||||||||
| Payout Ratio (Core FFO basis) | 80.4 | % | 68.2 | % | 83.3 | % | 76.9 | % | 81.1 | % | 75.0 | % | 73.2 | % | |||||||||||||||||||||||||||
| Payout Ratio (Core FAD basis) | 84.1 | % | 73.8 | % | |||||||||||||||||||||||||||||||||||||
______________________________ | |||||||||||||||||||||||||||||||||||||||||
(1) The ratio of earnings to fixed charges is computed by dividing earnings by fixed charges. For this purpose, earnings consist of income from continuing operations attributable to the controlling interests plus fixed charges, less capitalized interest. Fixed charges consist of interest expense, including amortized costs of debt issuance, plus interest costs capitalized. The earnings to fixed charges ratio includes (loss) gain on sale of real estate of ($7.5 million) and $61.0 million for the three months ended June 30, 2020 and December 31, 2019, respectively. | |||||||||||||||||||||||||||||||||||||||||
(2) Debt service coverage ratio is computed by dividing Adjusted EBITDA (see page 8) by interest expense and principal amortization. | |||||||||||||||||||||||||||||||||||||||||
13
Same-Store Portfolio Net Operating Income (NOI) Growth 2020 vs. 2019 | ||
| Nine Months Ended September 30, | Three Months Ended September 30, | ||||||||||||||||||||||||||||||||||
| 2020 | 2019 | % Change | 2020 | 2019 | % Change | ||||||||||||||||||||||||||||||
| Cash Basis: | |||||||||||||||||||||||||||||||||||
| Multifamily | $ | 45,721 | $ | 45,164 | 1.2 | % | $ | 14,465 | $ | 15,037 | (3.8) | % | |||||||||||||||||||||||
| Office | 62,325 | 65,290 | (4.5) | % | 20,243 | 21,016 | (3.7) | % | |||||||||||||||||||||||||||
Other (2) | 8,612 | 9,716 | (11.4) | % | 2,924 | 3,193 | (8.4) | % | |||||||||||||||||||||||||||
Overall Same-Store Portfolio (1) | $ | 116,658 | $ | 120,170 | (2.9) | % | $ | 37,632 | $ | 39,246 | (4.1) | % | |||||||||||||||||||||||
| GAAP Basis: | |||||||||||||||||||||||||||||||||||
| Multifamily | $ | 45,705 | $ | 45,153 | 1.2 | % | $ | 14,461 | $ | 15,033 | (3.8) | % | |||||||||||||||||||||||
| Office | 62,655 | 66,284 | (5.5) | % | 20,237 | 21,285 | (4.9) | % | |||||||||||||||||||||||||||
Other (2) | 8,907 | 10,233 | (13.0) | % | 3,040 | 3,347 | (9.2) | % | |||||||||||||||||||||||||||
Overall Same-Store Portfolio (1) | $ | 117,267 | $ | 121,670 | (3.6) | % | $ | 37,738 | $ | 39,665 | (4.9) | % | |||||||||||||||||||||||
______________________________ | ||
(1) Non same-store properties were: | ||
| Acquisitions: | ||
| Multifamily - Assembly Alexandria, Assembly Manassas, Assembly Dulles, Assembly Leesburg, Assembly Herndon, Assembly Germantown, Assembly Watkins Mill and Cascade at Landmark | ||
| Development: | ||
| Multifamily - Trove | ||
| Sold properties: | ||
| Office - Quantico Corporate Center, 1776 G Street and John Marshall II | ||
| Discontinued operations: | ||
| Retail - Wheaton Park, Bradlee Shopping Center, Shoppes at Foxchase, Gateway Overlook, Olney Village Center, Frederick County Square, Centre at Hagerstown and Frederick Crossing | ||
(2) Consists of retail centers not classified as discontinued operations: Takoma Park, Westminster, Concord Centre, Chevy Chase Metro Plaza, 800 S. Washington Street, Randolph Shopping Center, Montrose Shopping Center and Spring Valley Village. | ||
14
Same-Store Portfolio Net Operating Income (NOI) Detail (In thousands) | ||
| Three Months Ended September 30, 2020 | |||||||||||||||||||||||
| Multifamily | Office | Corporate and Other (1) | Total | ||||||||||||||||||||
| Real estate rental revenue | |||||||||||||||||||||||
| Same-store portfolio | $ | 24,240 | $ | 32,579 | $ | 4,382 | $ | 61,201 | |||||||||||||||
Non same-store (1) | 12,026 | — | — | 12,026 | |||||||||||||||||||
| Total | 36,266 | 32,579 | 4,382 | 73,227 | |||||||||||||||||||
| Real estate expenses | |||||||||||||||||||||||
| Same-store portfolio | 9,779 | 12,342 | 1,342 | 23,463 | |||||||||||||||||||
Non same-store (1) | 5,209 | — | — | 5,209 | |||||||||||||||||||
| Total | 14,988 | 12,342 | 1,342 | 28,672 | |||||||||||||||||||
| Net Operating Income (NOI) | |||||||||||||||||||||||
| Same-store portfolio | 14,461 | 20,237 | 3,040 | 37,738 | |||||||||||||||||||
Non same-store (1) | 6,817 | — | — | 6,817 | |||||||||||||||||||
| Total | $ | 21,278 | $ | 20,237 | $ | 3,040 | $ | 44,555 | |||||||||||||||
| Same-store portfolio NOI (from above) | $ | 14,461 | $ | 20,237 | $ | 3,040 | $ | 37,738 | |||||||||||||||
| Straight-line revenue, net for same-store properties | 3 | (518) | (6) | (521) | |||||||||||||||||||
| Amortization of acquired lease assets (liabilities) for same-store properties | 1 | 42 | (127) | (84) | |||||||||||||||||||
| Amortization of lease intangibles for same-store properties | — | 482 | 17 | 499 | |||||||||||||||||||
| Same-store portfolio cash NOI | $ | 14,465 | $ | 20,243 | $ | 2,924 | $ | 37,632 | |||||||||||||||
| Reconciliation of NOI to net income | |||||||||||||||||||||||
| Total NOI | $ | 21,278 | $ | 20,237 | $ | 3,040 | $ | 44,555 | |||||||||||||||
| Depreciation and amortization | (14,602) | (14,307) | (1,561) | (30,470) | |||||||||||||||||||
| General and administrative expenses | — | — | (6,330) | (6,330) | |||||||||||||||||||
| Interest expense | — | — | (8,711) | (8,711) | |||||||||||||||||||
| Net income (loss) | 6,676 | 5,930 | (13,562) | (956) | |||||||||||||||||||
| Net income attributable to noncontrolling interests | — | — | — | — | |||||||||||||||||||
| Net income (loss) attributable to the controlling interests | $ | 6,676 | $ | 5,930 | $ | (13,562) | $ | (956) | |||||||||||||||
______________________________ | |||||||||||||||||||||||
(1) For a list of non-same-store and other properties, see page 14 of this Supplemental. | |||||||||||||||||||||||
15
Same-Store Portfolio Net Operating Income (NOI) Detail (In thousands) | ||
| Three Months Ended June 30, 2020 | |||||||||||||||||||||||
| Multifamily | Office | Corporate and Other (1) | Total | ||||||||||||||||||||
| Real estate rental revenue | |||||||||||||||||||||||
| Same-store portfolio | $ | 24,548 | $ | 32,532 | $ | 3,918 | $ | 60,998 | |||||||||||||||
Non same-store (1) | 11,490 | 382 | — | 11,872 | |||||||||||||||||||
| Total | 36,038 | 32,914 | 3,918 | 72,870 | |||||||||||||||||||
| Real estate expenses | |||||||||||||||||||||||
| Same-store portfolio | 9,181 | 11,361 | 1,258 | 21,800 | |||||||||||||||||||
Non same-store (1) | 4,929 | 156 | — | 5,085 | |||||||||||||||||||
| Total | 14,110 | 11,517 | 1,258 | 26,885 | |||||||||||||||||||
| Net Operating Income (NOI) | |||||||||||||||||||||||
| Same-store portfolio | 15,367 | 21,171 | 2,660 | 39,198 | |||||||||||||||||||
Non same-store (1) | 6,561 | 226 | — | 6,787 | |||||||||||||||||||
| Total | $ | 21,928 | $ | 21,397 | $ | 2,660 | $ | 45,985 | |||||||||||||||
| Same-store portfolio NOI (from above) | $ | 15,367 | $ | 21,171 | $ | 2,660 | $ | 39,198 | |||||||||||||||
| Straight-line revenue, net for same-store properties | 5 | (673) | 22 | (646) | |||||||||||||||||||
| Amortization of acquired lease assets (liabilities) for same-store properties | 1 | 42 | (126) | (83) | |||||||||||||||||||
| Amortization of lease intangibles for same-store properties | — | 531 | 17 | 548 | |||||||||||||||||||
| Same-store portfolio cash NOI | $ | 15,373 | $ | 21,071 | $ | 2,573 | $ | 39,017 | |||||||||||||||
| Reconciliation of NOI to net income | |||||||||||||||||||||||
| Total NOI | $ | 21,928 | $ | 21,397 | $ | 2,660 | $ | 45,985 | |||||||||||||||
| Depreciation and amortization | (14,058) | (14,176) | (1,365) | (29,599) | |||||||||||||||||||
| General and administrative expenses | — | — | (5,296) | (5,296) | |||||||||||||||||||
| Interest expense | — | — | (8,751) | (8,751) | |||||||||||||||||||
| Loss on sale of real estate | — | — | (7,539) | (7,539) | |||||||||||||||||||
| Loss on extinguishment of debt | — | — | (206) | (206) | |||||||||||||||||||
| Net income (loss) | 7,870 | 7,221 | (20,497) | (5,406) | |||||||||||||||||||
| Net income attributable to noncontrolling interests | — | — | — | — | |||||||||||||||||||
| Net income (loss) attributable to controlling interests | $ | 7,870 | $ | 7,221 | $ | (20,497) | $ | (5,406) | |||||||||||||||
______________________________ | |||||||||||||||||||||||
(1) For a list of non-same-store, discontinued operations and other properties, see page 14 of this Supplemental. | |||||||||||||||||||||||
16
Same-Store Portfolio Net Operating Income (NOI) Detail (In thousands) | ||
| Three Months Ended September 30, 2019 | |||||||||||||||||||||||
| Multifamily | Office | Corporate and Other (1) | Total | ||||||||||||||||||||
| Real estate rental revenue | |||||||||||||||||||||||
| Same-store portfolio | $ | 24,763 | $ | 34,437 | $ | 4,659 | $ | 63,859 | |||||||||||||||
Non same-store (1) | 11,027 | 5,373 | — | 16,400 | |||||||||||||||||||
| Total | 35,790 | 39,810 | 4,659 | 80,259 | |||||||||||||||||||
| Real estate expenses | |||||||||||||||||||||||
| Same-store portfolio | 9,730 | 13,152 | 1,312 | 24,194 | |||||||||||||||||||
Non same-store (1) | 4,502 | 1,996 | — | 6,498 | |||||||||||||||||||
| Total | 14,232 | 15,148 | 1,312 | 30,692 | |||||||||||||||||||
| Net Operating Income (NOI) | |||||||||||||||||||||||
| Same-store portfolio | 15,033 | 21,285 | 3,347 | 39,665 | |||||||||||||||||||
Non same-store (1) | 6,525 | 3,377 | — | 9,902 | |||||||||||||||||||
| Total | $ | 21,558 | $ | 24,662 | $ | 3,347 | $ | 49,567 | |||||||||||||||
| Same-store portfolio NOI (from above) | $ | 15,033 | $ | 21,285 | $ | 3,347 | $ | 39,665 | |||||||||||||||
| Straight-line revenue, net for same-store properties | 3 | (710) | (38) | (745) | |||||||||||||||||||
| Amortization of acquired lease assets (liabilities) for same-store properties | 1 | (117) | (127) | (243) | |||||||||||||||||||
| Amortization of lease intangibles for same-store properties | — | 558 | 11 | 569 | |||||||||||||||||||
| Same-store portfolio cash NOI | $ | 15,037 | $ | 21,016 | $ | 3,193 | $ | 39,246 | |||||||||||||||
| Reconciliation of NOI to net income | |||||||||||||||||||||||
| Total NOI | $ | 21,558 | $ | 24,662 | $ | 3,347 | $ | 49,567 | |||||||||||||||
Depreciation and amortization (2) | (19,721) | (16,269) | (1,350) | (37,340) | |||||||||||||||||||
| General and administrative expenses | — | — | (6,461) | (6,461) | |||||||||||||||||||
| Interest expense | (518) | — | (13,680) | (14,198) | |||||||||||||||||||
| Income (loss) from continuing operations | 1,319 | 8,393 | (18,144) | (8,432) | |||||||||||||||||||
| Discontinued operations: | |||||||||||||||||||||||
Income from operations of properties classified as discontinued operations (1) | — | — | 2,942 | 2,942 | |||||||||||||||||||
| Gain on sale of real estate | — | — | 339,024 | 339,024 | |||||||||||||||||||
| Loss on extinguishment of debt | — | — | (764) | (764) | |||||||||||||||||||
| Net income | 1,319 | 8,393 | 323,058 | 332,770 | |||||||||||||||||||
| Net income attributable to noncontrolling interests | — | — | — | — | |||||||||||||||||||
| Net income attributable to the controlling interests | $ | 1,319 | $ | 8,393 | $ | 323,058 | $ | 332,770 | |||||||||||||||
______________________________ | |||||||||||||||||||||||
(1) For a list of non-same-store, discontinued operations and other properties, see page 14 of this Supplemental. | |||||||||||||||||||||||
(2) Depreciation and amortization includes $6.8 million amortization of intangible lease assets at the Assembly Portfolio, which have a weighted average useful life of seven months. | |||||||||||||||||||||||
17
Same-Store Portfolio Net Operating Income (NOI) Detail (In thousands) | |||||
| Nine Months Ended September 30, 2020 | |||||||||||||||||||||||
| Multifamily | Office | Corporate and Other (1) | Total | ||||||||||||||||||||
| Real estate rental revenue | |||||||||||||||||||||||
| Same-store portfolio | $ | 73,892 | $ | 98,992 | $ | 12,844 | $ | 185,728 | |||||||||||||||
Non same-store (1) | 34,990 | 2,171 | — | 37,161 | |||||||||||||||||||
| Total | 108,882 | 101,163 | 12,844 | 222,889 | |||||||||||||||||||
| Real estate expenses | |||||||||||||||||||||||
| Same-store portfolio | 28,187 | 36,337 | 3,937 | 68,461 | |||||||||||||||||||
Non same-store (1) | 14,896 | 839 | — | 15,735 | |||||||||||||||||||
| Total | 43,083 | 37,176 | 3,937 | 84,196 | |||||||||||||||||||
| Net Operating Income (NOI) | |||||||||||||||||||||||
| Same-store portfolio | 45,705 | 62,655 | 8,907 | 117,267 | |||||||||||||||||||
Non same-store (1) | 20,094 | 1,332 | — | 21,426 | |||||||||||||||||||
| Total | $ | 65,799 | $ | 63,987 | $ | 8,907 | $ | 138,693 | |||||||||||||||
| Same-store portfolio NOI (from above) | $ | 45,705 | $ | 62,655 | $ | 8,907 | $ | 117,267 | |||||||||||||||
| Straight-line revenue, net for same-store properties | 13 | (1,845) | 34 | (1,798) | |||||||||||||||||||
| Amortization of acquired lease assets (liabilities) for same-store properties | 3 | 54 | (380) | (323) | |||||||||||||||||||
| Amortization of lease intangibles for same-store properties | — | 1,461 | 51 | 1,512 | |||||||||||||||||||
| Same-store portfolio cash NOI | $ | 45,721 | $ | 62,325 | $ | 8,612 | $ | 116,658 | |||||||||||||||
| Reconciliation of NOI to net income | |||||||||||||||||||||||
| Total NOI | $ | 65,799 | $ | 63,987 | $ | 8,907 | $ | 138,693 | |||||||||||||||
| Depreciation and amortization | (42,621) | (42,837) | (4,331) | (89,789) | |||||||||||||||||||
| General and administrative | — | — | (17,963) | (17,963) | |||||||||||||||||||
| Interest expense | (172) | — | (28,135) | (28,307) | |||||||||||||||||||
| Loss on sale of real estate | — | — | (7,539) | (7,539) | |||||||||||||||||||
| Gain on extinguishment of debt | — | — | 262 | 262 | |||||||||||||||||||
| Net income (loss) | 23,006 | 21,150 | (48,799) | (4,643) | |||||||||||||||||||
| Net income attributable to noncontrolling interests | — | — | — | — | |||||||||||||||||||
| Net income (loss) attributable to the controlling interests | $ | 23,006 | $ | 21,150 | $ | (48,799) | $ | (4,643) | |||||||||||||||
______________________________ | |||||||||||||||||||||||
(1) For a list of non-same-store, discontinued operations and other properties, see page 14 of this Supplemental. | |||||||||||||||||||||||
18
Same-Store Portfolio Net Operating Income (NOI) Detail (In thousands) | |||||
| Nine Months Ended September 30, 2019 | |||||||||||||||||||||||
| Multifamily | Office | Corporate and Other (1) | Total | ||||||||||||||||||||
| Real estate rental revenue | |||||||||||||||||||||||
| Same-store portfolio | 73,532 | $ | 105,188 | $ | 14,337 | $ | 193,057 | ||||||||||||||||
Non same-store (1) | 16,480 | 18,976 | — | 35,456 | |||||||||||||||||||
| Total | 90,012 | 124,164 | 14,337 | 228,513 | |||||||||||||||||||
| Real estate expenses | |||||||||||||||||||||||
| Same-store portfolio | 28,379 | 38,904 | 4,104 | 71,387 | |||||||||||||||||||
Non same-store (1) | 6,549 | 7,033 | — | 13,582 | |||||||||||||||||||
| Total | 34,928 | 45,937 | 4,104 | 84,969 | |||||||||||||||||||
| Net Operating Income (NOI) | |||||||||||||||||||||||
| Same-store portfolio | 45,153 | 66,284 | 10,233 | 121,670 | |||||||||||||||||||
Non same-store (1) | 9,931 | 11,943 | — | 21,874 | |||||||||||||||||||
| Total | $ | 55,084 | $ | 78,227 | $ | 10,233 | $ | 143,544 | |||||||||||||||
| Same-store portfolio NOI (from above) | $ | 45,153 | $ | 66,284 | $ | 10,233 | $ | 121,670 | |||||||||||||||
| Straight-line revenue, net for same-store properties | 8 | (2,413) | (153) | (2,558) | |||||||||||||||||||
| Amortization of acquired lease assets (liabilities) for same-store properties | 3 | (298) | (397) | (692) | |||||||||||||||||||
| Amortization of lease intangibles for same-store properties | — | 1,717 | 33 | 1,750 | |||||||||||||||||||
| Same-store portfolio cash NOI | $ | 45,164 | $ | 65,290 | $ | 9,716 | $ | 120,170 | |||||||||||||||
| Reconciliation of NOI to net income | |||||||||||||||||||||||
| Total NOI | $ | 55,084 | $ | 78,227 | $ | 10,233 | $ | 143,544 | |||||||||||||||
Depreciation and amortization (2) | (43,283) | (49,947) | (4,211) | (97,441) | |||||||||||||||||||
| General and administrative | — | — | (19,803) | (19,803) | |||||||||||||||||||
| Interest expense | (1,558) | — | (40,388) | (41,946) | |||||||||||||||||||
| Loss on sale of real estate | — | — | (1,046) | (1,046) | |||||||||||||||||||
| Real estate impairment | — | — | (8,374) | (8,374) | |||||||||||||||||||
| Income (loss) from continuing operations | 10,243 | 28,280 | (63,589) | (25,066) | |||||||||||||||||||
| Discontinued operations: | |||||||||||||||||||||||
Income from operations of properties classified as discontinued operations (1) | — | — | 16,158 | 16,158 | |||||||||||||||||||
| Gain on sale of real estate | 339,024 | 339,024 | |||||||||||||||||||||
| Loss on extinguishment of debt | — | — | (764) | (764) | |||||||||||||||||||
| Net income | 10,243 | 28,280 | 290,829 | 329,352 | |||||||||||||||||||
| Net income attributable to noncontrolling interests | — | — | — | — | |||||||||||||||||||
| Net income attributable to the controlling interests | $ | 10,243 | $ | 28,280 | $ | 290,829 | $ | 329,352 | |||||||||||||||
______________________________ | |||||||||||||||||||||||
(1) For a list of non-same-store, discontinued operations and other properties, see page 14 of this Supplemental. | |||||||||||||||||||||||
(2) Depreciation and amortization includes $11.0 million amortization of intangible lease assets at the Assembly Portfolio, which have a weighted average useful life of seven months. | |||||||||||||||||||||||
19
Net Operating Income (NOI) by Region | ||
| Percentage of NOI | |||||||||||||||||
| Q3 2020 | YTD 2020 | ||||||||||||||||
| DC | |||||||||||||||||
| Multifamily | 6.3 | % | 6.7 | % | |||||||||||||
| Office | 21.7 | % | 21.6 | % | |||||||||||||
| Other | 2.4 | % | 2.2 | % | |||||||||||||
| 30.4 | % | 30.5 | % | ||||||||||||||
| Maryland | |||||||||||||||||
| Multifamily | 4.1 | % | 4.0 | % | |||||||||||||
| Other | 3.1 | % | 2.7 | % | |||||||||||||
| 7.2 | % | 6.7 | % | ||||||||||||||
| Virginia | |||||||||||||||||
| Multifamily | 37.3 | % | 36.8 | % | |||||||||||||
| Office | 23.7 | % | 24.5 | % | |||||||||||||
| Other | 1.4 | % | 1.5 | % | |||||||||||||
| 62.4 | % | 62.8 | % | ||||||||||||||
| Total Portfolio | 100.0 | % | 100.0 | % | |||||||||||||
20
Net Operating Income (NOI) - Multifamily (Dollars In thousands) | |||||
| Apartment Units as of 9/30/2020 | Nine Months Ended | Three Months Ended | |||||||||||||||||||||||||||||||||||||||||||||
| 9/30/2020 | 9/30/2019 | 09/30/2020 | 6/30/2020 | 3/31/2020 | 12/31/2019 | 9/30/2019 | |||||||||||||||||||||||||||||||||||||||||
| Rental and other property revenues | |||||||||||||||||||||||||||||||||||||||||||||||
Same-store (1) | 4,268 | $ | 73,892 | $ | 73,532 | $ | 24,240 | $ | 24,548 | $ | 25,104 | $ | 24,923 | $ | 24,763 | ||||||||||||||||||||||||||||||||
| Non same-store | |||||||||||||||||||||||||||||||||||||||||||||||
Acquisitions (2) | 2,390 | 34,294 | 16,467 | 11,581 | 11,276 | 11,437 | 11,174 | 11,014 | |||||||||||||||||||||||||||||||||||||||
Development (3) | 401 | 696 | 13 | 445 | 214 | 37 | 22 | 13 | |||||||||||||||||||||||||||||||||||||||
| Total rental and other property revenues | 7,059 | 108,882 | 90,012 | 36,266 | 36,038 | 36,578 | 36,119 | 35,790 | |||||||||||||||||||||||||||||||||||||||
| Property operating expenses | |||||||||||||||||||||||||||||||||||||||||||||||
| Same-store | 28,187 | 28,379 | 9,779 | 9,181 | 9,227 | 9,438 | 9,730 | ||||||||||||||||||||||||||||||||||||||||
| Non same-store | |||||||||||||||||||||||||||||||||||||||||||||||
| Acquisitions | 13,889 | 6,524 | 4,753 | 4,625 | 4,511 | 4,717 | 4,477 | ||||||||||||||||||||||||||||||||||||||||
| Development | 1,007 | 25 | 456 | 304 | 247 | 52 | 25 | ||||||||||||||||||||||||||||||||||||||||
| Total property operating expenses | 43,083 | 34,928 | 14,988 | 14,110 | 13,985 | 14,207 | 14,232 | ||||||||||||||||||||||||||||||||||||||||
| Net Operating Income (NOI) | |||||||||||||||||||||||||||||||||||||||||||||||
| Same-store | 45,705 | 45,153 | 14,461 | 15,367 | 15,877 | 15,485 | 15,033 | ||||||||||||||||||||||||||||||||||||||||
| Non same-store | |||||||||||||||||||||||||||||||||||||||||||||||
| Acquisitions | 20,405 | 9,943 | 6,828 | 6,651 | 6,926 | 6,457 | 6,537 | ||||||||||||||||||||||||||||||||||||||||
| Development | (311) | (12) | (11) | (90) | (210) | (30) | (12) | ||||||||||||||||||||||||||||||||||||||||
| Total NOI | $ | 65,799 | $ | 55,084 | $ | 21,278 | $ | 21,928 | $ | 22,593 | $ | 21,912 | $ | 21,558 | |||||||||||||||||||||||||||||||||
| Same-store metrics | |||||||||||||||||||||||||||||||||||||||||||||||
Retention (4) | 56 | % | 55 | % | 55 | % | 59 | % | 55 | % | 55 | % | 56 | % | |||||||||||||||||||||||||||||||||
______________________________
(1) Includes properties that were owned for the entirety of the years being compared, and exclude properties under redevelopment or development and properties acquired, sold or classified as held for sale during the years being compared.
(2) Includes properties that were acquired within the years being compared. The property is categorized as same-store when it has been ready for its intended use for the entirety of the years being compared.
(3) Include development properties as those for which we have planned or ongoing major construction activities on existing or acquired land pursuant to an authorized development plan. We consider a property's development activities to be complete when the property is ready for its intended use. The property is categorized as same-store when it has been ready for its intended use for the entirety of the years being compared. As of September 30, 2020, 205 of the 401 units in development were delivered.
(4) Represents the percentage of Same-store property leases renewed that were set to expire in the period presented.
21
Same-Store Operating Results - Multifamily (Dollars in thousands, except Average Effective Monthly Rent per Unit) | |||||
| Rental and Other Property Revenue | Property Operating Expenses | Net Operating Income | Average Occupancy | Average Effective Monthly Rent per Unit | ||||||||||||||||||||||||||||||||||||||||||||||||||||||||||||||||||||||||||||||||||||||||||||||
| Quarter-to-Date Comparison | Apt Units | Q3 2020 | Q3 2019 | % Change | Q3 2020 | Q3 2019 | % Change | Q3 2020 | Q3 2019 | % Change | Q3 2020 | Q3 2019 | % Change | Q3 2020 | Q3 2019 | % Change | ||||||||||||||||||||||||||||||||||||||||||||||||||||||||||||||||||||||||||||||||||
| Total/Weighted Average | 4,268 | $ | 24,240 | $ | 24,763 | (2.1) | % | $ | 9,779 | $ | 9,730 | 0.5 | % | $ | 14,461 | $ | 15,033 | (3.8) | % | 93.5 | % | 95.0 | % | (1.6) | % | $ | 1,800 | $ | 1,807 | (0.4) | % | |||||||||||||||||||||||||||||||||||||||||||||||||||||||||||||||||||
| Rental and Other Property Revenue | Property Operating Expenses | Net Operating Income | Average Occupancy | Average Effective Monthly Rent per Unit | ||||||||||||||||||||||||||||||||||||||||||||||||||||||||||||||||||||||||||||||||||||||||||||||
| Sequential Comparison | Apt Units | Q3 2020 | Q2 2020 | % Change | Q3 2020 | Q2 2020 | % Change | Q3 2020 | Q2 2020 | % Change | Q3 2020 | Q2 2020 | % Change | Q3 2020 | Q2 2020 | % Change | ||||||||||||||||||||||||||||||||||||||||||||||||||||||||||||||||||||||||||||||||||
| Total/Weighted Average | 4,268 | $ | 24,240 | $ | 24,548 | (1.3) | % | $ | 9,779 | $ | 9,181 | 6.5 | % | $ | 14,461 | $ | 15,367 | (5.9) | % | 93.5 | % | 94.2 | % | (0.7) | % | $ | 1,800 | $ | 1,831 | (1.7) | % | |||||||||||||||||||||||||||||||||||||||||||||||||||||||||||||||||||
| Rental and Other Property Revenue | Property Operating Expenses | Net Operating Income | Average Occupancy | Average Effective Monthly Rent per Unit | ||||||||||||||||||||||||||||||||||||||||||||||||||||||||||||||||||||||||||||||||||||||||||||||
| Year-to-Date Comparison | Apt Units | YTD 2020 | YTD 2019 | % Change | YTD 2020 | YTD 2019 | % Change | YTD 2020 | YTD 2019 | % Change | YTD 2020 | YTD 2019 | % Change | YTD 2020 | YTD 2019 | % Change | ||||||||||||||||||||||||||||||||||||||||||||||||||||||||||||||||||||||||||||||||||
| Total/Weighted Average | 4,268 | $ | 73,892 | $ | 73,532 | 0.5 | % | $ | 28,187 | $ | 28,379 | (0.7) | % | $ | 45,705 | $ | 45,153 | 1.2 | % | 94.4 | % | 97.3 | % | (3.0) | % | $ | 1,821 | $ | 1,787 | 1.9 | % | |||||||||||||||||||||||||||||||||||||||||||||||||||||||||||||||||||
22
Same-Store Operating Expenses - Multifamily (In thousands) | |||||
| Quarter-to-Date Comparison | Q3 2020 | Q3 2019 | $ Change | % Change | % of Q3 2020 Total | ||||||||||||||||||||||||
Controllable (1) | $ | 4,847 | $ | 5,021 | $ | (174) | (3.5) | % | 49.6 | % | |||||||||||||||||||
Non-Controllable (2) | 4,932 | 4,709 | 223 | 4.7 | % | 50.4 | % | ||||||||||||||||||||||
| Total same-store operating expenses | $ | 9,779 | $ | 9,730 | $ | 49 | 0.5 | % | 100.0 | % | |||||||||||||||||||
| Sequential Comparison | Q3 2020 | Q2 2020 | $ Change | % Change | % of Q3 2020 Total | ||||||||||||||||||||||||
| Controllable | $ | 4,847 | $ | 4,618 | $ | 229 | 5.0 | % | 49.6 | % | |||||||||||||||||||
| Non-Controllable | 4,932 | 4,563 | 369 | 8.1 | % | 50.4 | % | ||||||||||||||||||||||
| Total same-store operating expenses | $ | 9,779 | $ | 9,181 | $ | 598 | 6.5 | % | 100.0 | % | |||||||||||||||||||
| Year-to-Date Comparison | YTD 2020 | YTD 2019 | $ Change | % Change | % of YTD 2020 Total | ||||||||||||||||||||||||
| Controllable | $ | 13,795 | $ | 14,157 | (362) | (2.6) | % | 48.9 | % | ||||||||||||||||||||
| Non-Controllable | 14,392 | 14,222 | 170 | 1.2 | % | 51.1 | % | ||||||||||||||||||||||
| Total same-store operating expenses | $ | 28,187 | $ | 28,379 | $ | (192) | (0.7) | % | 100.0 | % | |||||||||||||||||||
______________________________ | ||
(1) Controllable operating expenses consist of: | ||
| Payroll, Repairs & Maintenance, Marketing, Administrative and other | ||
(2) Non-Controllable operating expenses consist of: | ||
| Third-party Fees, Utilities, Insurance, and Real Estate Taxes | ||
23
Same-Store Portfolio and Overall Average Occupancy Levels by Sector | ||
Average Occupancy - Same-Store Properties(1) (2) | ||||||||||||||||||||||||||||||||
| Sector | 09/30/2020 | 6/30/2020 | 3/31/2020 | 12/31/2019 | 9/30/2019 | |||||||||||||||||||||||||||
| Multifamily | 93.5 | % | 94.2 | % | 95.6 | % | 94.9 | % | 95.0 | % | ||||||||||||||||||||||
| Office | 86.5 | % | 86.4 | % | 87.2 | % | 88.2 | % | 89.3 | % | ||||||||||||||||||||||
Other (3) | 85.8 | % | 87.2 | % | 91.0 | % | 89.6 | % | 88.9 | % | ||||||||||||||||||||||
| Overall Portfolio | 90.0 | % | 90.4 | % | 91.7 | % | 91.6 | % | 92.1 | % | ||||||||||||||||||||||
Average Occupancy - All Properties (2) | ||||||||||||||||||||||||||||||||
| Sector | 9/30/2020 | 6/30/2020 | 3/31/2020 | 12/31/2019 | 9/30/2019 | |||||||||||||||||||||||||||
Multifamily (4) | 94.3 | % | 94.5 | % | 95.4 | % | 94.8 | % | 95.0 | % | ||||||||||||||||||||||
| Office | 86.5 | % | 86.8 | % | 88.1 | % | 89.5 | % | 90.8 | % | ||||||||||||||||||||||
Other (3) and discontinued operations | 85.8 | % | 87.2 | % | 91.0 | % | 89.6 | % | 89.5 | % | ||||||||||||||||||||||
Overall Portfolio (4), (5) | 91.3 | % | 91.5 | % | 92.7 | % | 92.6 | % | 92.5 | % | ||||||||||||||||||||||
______________________________ | ||
(1) Non same-store properties were: | ||
| Acquisitions: | ||
| Multifamily - Assembly Alexandria, Assembly Manassas, Assembly Dulles, Assembly Leesburg, Assembly Herndon, Assembly Germantown, Assembly Watkins Mill and Cascade at Landmark | ||
| Development: | ||
| Multifamily - Trove | ||
| Sold properties: | ||
| Office - Quantico Corporate Center, 1776 G Street and John Marshall II | ||
| Discontinued operations: | ||
| Retail - Wheaton Park, Bradlee Shopping Center, Shoppes at Foxchase, Gateway Overlook, Olney Village Center, Frederick County Square, Centre at Hagerstown and Frederick Crossing | ||
(2) Average occupancy is based on monthly occupied net rentable square footage as a percentage of total net rentable square footage, except for the rows labeled "Multifamily," on which average occupancy is based on average monthly occupied units as a percentage of total units. The square footage for multifamily properties only includes residential space. The occupied square footage for office and other properties includes short-term lease agreements. | ||
(3) Consists of retail centers not classified as discontinued operations: Takoma Park, Westminster, Concord Centre, Chevy Chase Metro Plaza, 800 S. Washington Street, Randolph Shopping Center, Montrose Shopping Center and Spring Valley Village. | ||
(4) Average occupancy excludes the addition of the total rentable units at Trove, which began to lease-up in the first quarter of 2020. Including Trove, multifamily average occupancy was 89.9%, 89.5%, and 90.0% and overall portfolio average occupancy was 89.1%, 89.0% and 90.0% for each of the quarters ended September 30, 2020, June 30, 2020 and March 31, 2020, respectively. | ||
(5) Average occupancy based on monthly occupied net rentable square footage excludes the Assembly Portfolio and Cascade at Landmark for the 2019 periods. | ||
24
Same-Store Portfolio and Overall Ending Occupancy Levels by Sector | ||
Ending Occupancy - Same-Store Properties (1) (2) | ||||||||||||||||||||||||||||||||
| Sector | 9/30/2020 | 6/30/2020 | 3/31/2020 | 12/31/2019 | 9/30/2019 | |||||||||||||||||||||||||||
| Multifamily | 94.0 | % | 93.8 | % | 95.3 | % | 95.0 | % | 95.1 | % | ||||||||||||||||||||||
| Office | 86.6 | % | 86.8 | % | 87.2 | % | 88.8 | % | 88.7 | % | ||||||||||||||||||||||
Other (3) | 86.8 | % | 84.0 | % | 91.1 | % | 90.9 | % | 89.0 | % | ||||||||||||||||||||||
| Overall Portfolio | 90.3 | % | 90.0 | % | 91.6 | % | 92.0 | % | 91.9 | % | ||||||||||||||||||||||
Ending Occupancy - All Properties (2) | ||||||||||||||||||||||||||||||||
| Sector | 9/30/2020 | 6/30/2020 | 3/31/2020 | 12/31/2019 | 9/30/2019 | |||||||||||||||||||||||||||
Multifamily (4) | 94.6 | % | 94.3 | % | 95.1 | % | 94.9 | % | 95.0 | % | ||||||||||||||||||||||
| Office | 86.6 | % | 86.8 | % | 88.1 | % | 89.6 | % | 90.3 | % | ||||||||||||||||||||||
Other (3) | 86.8 | % | 84.0 | % | 91.1 | % | 90.9 | % | 89.0 | % | ||||||||||||||||||||||
Overall Portfolio (4) | 91.6 | % | 91.7 | % | 92.5 | % | 92.8 | % | 93.0 | % | ||||||||||||||||||||||
______________________________ | ||
(1) Non same-store properties were: | ||
| Acquisitions: | ||
| Multifamily - Assembly Alexandria, Assembly Manassas, Assembly Dulles, Assembly Leesburg, Assembly Herndon, Assembly Germantown, Assembly Watkins Mill and Cascade at Landmark | ||
| Development: | ||
| Multifamily - Trove | ||
| Sold properties: | ||
| Office - Quantico Corporate Center, 1776 G Street and John Marshall II | ||
(2) Ending occupancy is calculated as occupied square footage as a percentage of total square footage as of the last day of that period, except for the rows labeled "Multifamily," on which ending occupancy is calculated as occupied units as a percentage of total available units as of the last day of that period. The occupied square footage for office and other properties includes short-term lease agreements. | ||
(3) Consists of retail centers not classified as discontinued operations: Takoma Park, Westminster, Concord Centre, Chevy Chase Metro Plaza, 800 S. Washington Street, Randolph Shopping Center, Montrose Shopping Center and Spring Valley Village. | ||
(4) Ending occupancy excludes the addition of the total rentable units at Trove, which began to lease-up in the first quarter of 2020. Including Trove, multifamily ending occupancy was 90.5%, 89.8%, and 89.9% and overall portfolio ending occupancy was 89.5%, 89.4% and 89.9% as of September 30, 2020, June 30, 2020 and March 31, 2020, respectively. | ||
25
Acquisition and Disposition Summary | ||
| Dispositions | |||||||||||||||||||||||||||||||||||
| Location | Disposition Date | Property Type | Square Feet | Contract Sales Price (in thousands) | GAAP Loss on Sale (in thousands) | ||||||||||||||||||||||||||||||
| John Marshall II | Tysons, VA | April 21, 2020 | Office | 223,000 | $ | 57,000 | $ | (6,855) | |||||||||||||||||||||||||||
| 223,000 | $ | 57,000 | $ | (6,855) | |||||||||||||||||||||||||||||||
26
Development Summary | ||
| September 30, 2020 | ||
| Development | ||||||||||||||||||||||||||
| Property and Location | Total Rentable Square Feet or # of Units | Anticipated Total Cash Cost (1) (in thousands) | Cash Cost to Date (1) (in thousands) | Initial Occupancy | ||||||||||||||||||||||
| Trove (Wellington land parcel), Arlington, VA | 401 units | $ | 123,000 | $ | 113,816 | Phase I - first quarter 2020 (2) | ||||||||||||||||||||
Phase II - fourth quarter 2020 (2) | ||||||||||||||||||||||||||
______________________________
(1) Represents anticipated/actual cash expenditures and excludes allocations of capitalized corporate overhead costs and interest.
(2) This development project has two phases: Phase I consists of 205 units and a ten-level garage. In February 2020, leasing commenced with the first deliveries of Phase I units and the completion of the ten-level garage. Phase II consists of 196 units, with delivery of units anticipated to commence in the fourth quarter of 2020.
27
Commercial Leasing Summary - New Leases | ||
| 3rd Quarter 2020 | 2nd Quarter 2020 | 1st Quarter 2020 | 4th Quarter 2019 | 3rd Quarter 2019 | |||||||||||||||||||||||||||||||||||||||||||||||||||||||
| Gross Leasing Square Footage | |||||||||||||||||||||||||||||||||||||||||||||||||||||||||||
| Office Buildings | 19,159 | 19,795 | 45,976 | 46,286 | 35,364 | ||||||||||||||||||||||||||||||||||||||||||||||||||||||
| Retail Centers | 5,900 | 420 | 15,392 | 8,466 | 4,624 | ||||||||||||||||||||||||||||||||||||||||||||||||||||||
| Total | 25,059 | 20,215 | 61,368 | 54,752 | 39,988 | ||||||||||||||||||||||||||||||||||||||||||||||||||||||
| Weighted Average Term (years) | |||||||||||||||||||||||||||||||||||||||||||||||||||||||||||
| Office Buildings | 5.3 | 8.3 | 4.4 | 7.8 | 9.0 | ||||||||||||||||||||||||||||||||||||||||||||||||||||||
| Retail Centers | 12.1 | 5.0 | 5.5 | 14.9 | 3.8 | ||||||||||||||||||||||||||||||||||||||||||||||||||||||
| Total | 6.9 | 8.3 | 4.7 | 8.9 | 9.2 | ||||||||||||||||||||||||||||||||||||||||||||||||||||||
| Weighted Average Free Rent Period (months) | |||||||||||||||||||||||||||||||||||||||||||||||||||||||||||
| Office Buildings | 6.2 | 7.3 | 1.1 | 6.9 | 9.4 | ||||||||||||||||||||||||||||||||||||||||||||||||||||||
| Retail Centers | 5.2 | — | 1.1 | 6.4 | 3.0 | ||||||||||||||||||||||||||||||||||||||||||||||||||||||
| Total | 6.1 | 7.3 | 1.1 | 6.8 | 8.8 | ||||||||||||||||||||||||||||||||||||||||||||||||||||||
| Rental Rate Increases: | GAAP | CASH | GAAP | CASH | GAAP | CASH | GAAP | CASH | GAAP | CASH | |||||||||||||||||||||||||||||||||||||||||||||||||
| Rate on expiring leases | |||||||||||||||||||||||||||||||||||||||||||||||||||||||||||
| Office Buildings | $ | 41.57 | $ | 44.81 | $ | 54.47 | $ | 50.74 | $ | 43.39 | $ | 43.12 | $ | 43.09 | $ | 43.81 | $ | 42.68 | $ | 43.70 | |||||||||||||||||||||||||||||||||||||||
| Retail Centers | 18.87 | 16.11 | 15.93 | 15.00 | 17.96 | 17.90 | 60.79 | 50.44 | 40.59 | 38.41 | |||||||||||||||||||||||||||||||||||||||||||||||||
| Total | $ | 36.23 | $ | 38.06 | $ | 53.67 | $ | 50.00 | $ | 37.01 | $ | 36.80 | $ | 45.83 | $ | 44.83 | $ | 42.44 | $ | 43.09 | |||||||||||||||||||||||||||||||||||||||
| Rate on new leases | |||||||||||||||||||||||||||||||||||||||||||||||||||||||||||
| Office Buildings | $ | 45.74 | $ | 43.06 | $ | 54.89 | $ | 49.55 | $ | 47.20 | $ | 45.37 | $ | 57.63 | $ | 52.52 | $ | 52.20 | $ | 47.09 | |||||||||||||||||||||||||||||||||||||||
| Retail Centers | 18.87 | 16.10 | 15.93 | 15.00 | 21.31 | 19.36 | 61.86 | 51.03 | 40.59 | 38.41 | |||||||||||||||||||||||||||||||||||||||||||||||||
| Total | $ | 39.41 | $ | 36.72 | $ | 54.08 | $ | 48.83 | $ | 40.71 | $ | 38.85 | $ | 58.28 | $ | 52.29 | $ | 50.86 | $ | 46.09 | |||||||||||||||||||||||||||||||||||||||
| Percentage Increase | |||||||||||||||||||||||||||||||||||||||||||||||||||||||||||
| Office Buildings | 10.0 | % | (3.9) | % | 0.8 | % | (2.3) | % | 8.8 | % | 5.2 | % | 33.7 | % | 19.9 | % | 22.3 | % | 7.8 | % | |||||||||||||||||||||||||||||||||||||||
| Retail Centers | — | % | (0.1) | % | — | % | — | % | 18.7 | % | 8.2 | % | 1.8 | % | 1.2 | % | — | % | — | % | |||||||||||||||||||||||||||||||||||||||
| Total | 8.8 | % | (3.5) | % | 0.8 | % | (2.3) | % | 10.0 | % | 5.6 | % | 27.2 | % | 16.6 | % | 19.8 | % | 7.0 | % | |||||||||||||||||||||||||||||||||||||||
| Total Dollars | $ per Sq Ft | Total Dollars | $ per Sq Ft | Total Dollars | $ per Sq Ft | Total Dollars | $ per Sq Ft | Total Dollars | $ per Sq Ft | ||||||||||||||||||||||||||||||||||||||||||||||||||
| Tenant Improvements | |||||||||||||||||||||||||||||||||||||||||||||||||||||||||||
| Office Buildings | $ | 895,267 | $ | 46.73 | $ | 1,667,073 | $ | 84.22 | $ | 480,677 | $ | 10.45 | $ | 3,234,510 | $ | 69.88 | $ | 2,545,774 | $ | 71.99 | |||||||||||||||||||||||||||||||||||||||
| Retail Centers | 164,406 | 27.87 | 3,000 | 7.14 | 9,000 | 0.58 | 1,075,385 | 127.02 | — | — | |||||||||||||||||||||||||||||||||||||||||||||||||
| Subtotal | $ | 1,059,673 | $ | 42.29 | $ | 1,670,073 | $ | 82.62 | $ | 489,677 | $ | 7.98 | $ | 4,309,895 | $ | 78.71 | $ | 2,545,774 | $ | 63.66 | |||||||||||||||||||||||||||||||||||||||
| Leasing Commissions | |||||||||||||||||||||||||||||||||||||||||||||||||||||||||||
| Office Buildings | $ | 229,690 | $ | 11.99 | $ | 464,719 | $ | 23.48 | $ | 240,732 | $ | 5.24 | $ | 1,172,922 | $ | 25.34 | $ | 944,177 | $ | 26.70 | |||||||||||||||||||||||||||||||||||||||
| Retail Centers | 8,665 | 1.47 | 1,338 | 3.19 | 95,055 | 6.18 | 360,543 | 42.59 | 31,238 | 6.76 | |||||||||||||||||||||||||||||||||||||||||||||||||
| Subtotal | $ | 238,355 | $ | 9.51 | $ | 466,057 | $ | 23.06 | $ | 335,787 | $ | 5.47 | $ | 1,533,465 | $ | 28.01 | $ | 975,415 | $ | 24.39 | |||||||||||||||||||||||||||||||||||||||
| Tenant Improvements and Leasing Commissions | |||||||||||||||||||||||||||||||||||||||||||||||||||||||||||
| Office Buildings | $ | 1,124,957 | $ | 58.72 | $ | 2,131,792 | $ | 107.70 | $ | 721,409 | $ | 15.69 | $ | 4,407,432 | $ | 95.22 | $ | 3,489,951 | $ | 98.69 | |||||||||||||||||||||||||||||||||||||||
| Retail Centers | 173,071 | 29.34 | 4,338 | 10.33 | 104,055 | 6.76 | 1,435,928 | 169.61 | 31,238 | 6.76 | |||||||||||||||||||||||||||||||||||||||||||||||||
| Total | $ | 1,298,028 | $ | 51.80 | $ | 2,136,130 | $ | 105.68 | $ | 825,464 | $ | 13.45 | $ | 5,843,360 | $ | 106.72 | $ | 3,521,189 | $ | 88.05 | |||||||||||||||||||||||||||||||||||||||
______________________________
Note: This table excludes short-term lease agreements and activity at properties sold during the quarter. The cost of landlord build-out on Space+ leases that are excluded from Tenant Improvements in the table above totaled $0.2 million and $1.3 million for leases executed in Q3 2020 and YTD 2020, respectively.
28
Commercial Leasing Summary - Renewal Leases | ||
| 3rd Quarter 2020 | 2nd Quarter 2020 | 1st Quarter 2020 | 4th Quarter 2019 | 3rd Quarter 2019 | |||||||||||||||||||||||||||||||||||||||||||||||||||||||
| Gross Leasing Square Footage | |||||||||||||||||||||||||||||||||||||||||||||||||||||||||||
| Office Buildings | 39,955 | 15,359 | 42,574 | 56,811 | 15,936 | ||||||||||||||||||||||||||||||||||||||||||||||||||||||
| Retail Centers | 7,635 | — | 19,350 | 8,193 | 11,145 | ||||||||||||||||||||||||||||||||||||||||||||||||||||||
| Total | 47,590 | 15,359 | 61,924 | 65,004 | 27,081 | ||||||||||||||||||||||||||||||||||||||||||||||||||||||
| Weighted Average Term (years) | |||||||||||||||||||||||||||||||||||||||||||||||||||||||||||
| Office Buildings | 7.2 | 1.7 | 3.7 | 8.7 | 3.9 | ||||||||||||||||||||||||||||||||||||||||||||||||||||||
| Retail Centers | 1.8 | — | 7.1 | 5.0 | 7.8 | ||||||||||||||||||||||||||||||||||||||||||||||||||||||
| Total | 6.3 | 1.7 | 4.8 | 8.2 | 5.5 | ||||||||||||||||||||||||||||||||||||||||||||||||||||||
| Weighted Average Free Rent Period (months) | |||||||||||||||||||||||||||||||||||||||||||||||||||||||||||
| Office Buildings | 6.9 | 4.5 | 1.2 | 6.5 | 1.5 | ||||||||||||||||||||||||||||||||||||||||||||||||||||||
| Retail Centers | 5.4 | — | 0.1 | 1.1 | — | ||||||||||||||||||||||||||||||||||||||||||||||||||||||
| Total | 6.7 | 4.5 | 1.0 | 5.8 | 0.9 | ||||||||||||||||||||||||||||||||||||||||||||||||||||||
| Rental Rate Increases: | GAAP | CASH | GAAP | CASH | GAAP | CASH | GAAP | CASH | GAAP | CASH | |||||||||||||||||||||||||||||||||||||||||||||||||
| Rate on expiring leases | |||||||||||||||||||||||||||||||||||||||||||||||||||||||||||
| Office Buildings | $ | 33.30 | $ | 35.00 | $ | 43.93 | $ | 50.65 | $ | 43.46 | $ | 44.70 | $ | 37.12 | $ | 37.67 | $ | 44.38 | $ | 46.25 | |||||||||||||||||||||||||||||||||||||||
| Retail Centers | 35.45 | 39.62 | — | — | 19.88 | 20.96 | 36.13 | 38.30 | 31.30 | 32.75 | |||||||||||||||||||||||||||||||||||||||||||||||||
| Total | $ | 33.65 | $ | 35.74 | $ | 43.93 | $ | 50.65 | $ | 36.09 | $ | 37.28 | $ | 37.00 | $ | 37.75 | $ | 39.00 | $ | 40.70 | |||||||||||||||||||||||||||||||||||||||
| Rate on new leases | |||||||||||||||||||||||||||||||||||||||||||||||||||||||||||
| Office Buildings | $ | 39.15 | $ | 36.18 | $ | 52.44 | $ | 51.62 | $ | 46.39 | $ | 45.00 | $ | 47.03 | $ | 42.21 | $ | 51.27 | $ | 49.29 | |||||||||||||||||||||||||||||||||||||||
| Retail Centers | 41.27 | 40.92 | — | — | 21.73 | 20.64 | 39.33 | 38.06 | 42.24 | 40.38 | |||||||||||||||||||||||||||||||||||||||||||||||||
| Total | $ | 39.49 | $ | 36.94 | $ | 52.44 | $ | 51.62 | $ | 38.69 | $ | 37.39 | $ | 46.06 | $ | 41.69 | $ | 47.55 | $ | 45.62 | |||||||||||||||||||||||||||||||||||||||
| Percentage Increase | |||||||||||||||||||||||||||||||||||||||||||||||||||||||||||
| Office Buildings | 17.6 | % | 3.4 | % | 19.4 | % | 1.9 | % | 6.7 | % | 0.7 | % | 26.7 | % | 12.1 | % | 15.5 | % | 6.6 | % | |||||||||||||||||||||||||||||||||||||||
| Retail Centers | 16.4 | % | 3.3 | % | — | % | — | % | 9.3 | % | (1.5) | % | 8.9 | % | (0.6) | % | 35.0 | % | 23.3 | % | |||||||||||||||||||||||||||||||||||||||
| Total | 17.4 | % | 3.4 | % | 19.4 | % | 1.9 | % | 7.2 | % | 0.3 | % | 24.5 | % | 10.4 | % | 21.9 | % | 12.1 | % | |||||||||||||||||||||||||||||||||||||||
| Total Dollars | $ per Sq Ft | Total Dollars | $ per Sq Ft | Total Dollars | $ per Sq Ft | Total Dollars | $ per Sq Ft | Total Dollars | $ per Sq Ft | ||||||||||||||||||||||||||||||||||||||||||||||||||
| Tenant Improvements | |||||||||||||||||||||||||||||||||||||||||||||||||||||||||||
| Office Buildings | $ | 912,553 | $ | 22.84 | $ | — | $ | — | $ | 79,005 | $ | 1.86 | $ | 2,101,721 | $ | 36.99 | $ | 23,882 | $ | 1.50 | |||||||||||||||||||||||||||||||||||||||
| Retail Centers | — | — | — | — | 125,447 | 6.48 | — | — | — | — | |||||||||||||||||||||||||||||||||||||||||||||||||
| Subtotal | $ | 912,553 | $ | 19.18 | $ | — | $ | — | $ | 204,452 | $ | 3.30 | $ | 2,101,721 | $ | 32.33 | $ | 23,882 | $ | 0.88 | |||||||||||||||||||||||||||||||||||||||
| Leasing Commissions | |||||||||||||||||||||||||||||||||||||||||||||||||||||||||||
| Office Buildings | $ | 207,400 | $ | 5.19 | $ | 41,780 | $ | 2.72 | $ | 209,309 | $ | 4.92 | $ | 1,144,764 | $ | 20.15 | $ | 101,139 | $ | 6.35 | |||||||||||||||||||||||||||||||||||||||
| Retail Centers | — | — | — | — | 34,498 | 1.78 | 20,099 | 2.45 | 34,664 | 3.11 | |||||||||||||||||||||||||||||||||||||||||||||||||
| Subtotal | $ | 207,400 | $ | 4.36 | $ | 41,780 | $ | 2.72 | $ | 243,807 | $ | 3.94 | $ | 1,164,863 | $ | 17.92 | $ | 135,803 | $ | 5.01 | |||||||||||||||||||||||||||||||||||||||
| Tenant Improvements and Leasing Commissions | |||||||||||||||||||||||||||||||||||||||||||||||||||||||||||
| Office Buildings | $ | 1,119,953 | $ | 28.03 | $ | 41,780 | $ | 2.72 | $ | 288,314 | $ | 6.78 | $ | 3,246,485 | $ | 57.14 | $ | 125,021 | $ | 7.85 | |||||||||||||||||||||||||||||||||||||||
| Retail Centers | — | — | — | — | 159,945 | 8.26 | 20,099 | 2.45 | 34,664 | 3.11 | |||||||||||||||||||||||||||||||||||||||||||||||||
| Total | $ | 1,119,953 | $ | 23.54 | $ | 41,780 | $ | 2.72 | $ | 448,259 | $ | 7.24 | $ | 3,266,584 | $ | 50.25 | $ | 159,685 | $ | 5.89 | |||||||||||||||||||||||||||||||||||||||
______________________________
Note: This table excludes short-term lease agreements and activity at properties sold during the quarter.
29
10 Largest Tenants - Based on Annualized Commercial Income | ||
| September 30, 2020 | ||
| Tenant | Number of Buildings | Weighted Average Remaining Lease Term in Months | Percentage of Aggregate Portfolio Annualized Commercial Income | Aggregate Rentable Square Feet | Percentage of Aggregate Occupied Square Feet | ||||||||||||||||||||||||
| Atlantic Media, Inc. | 1 | 85 | 5.5 | % | 134,084 | 4.1 | % | ||||||||||||||||||||||
| Capital One, N.A. | 3 | 19 | 4.2 | % | 143,090 | 4.4 | % | ||||||||||||||||||||||
| EIG Management Company, LLC | 1 | 204 | 2.2 | % | 51,358 | 1.6 | % | ||||||||||||||||||||||
| B. Riley Financial | 1 | 27 | 2.2 | % | 54,540 | 1.7 | % | ||||||||||||||||||||||
| Epstein, Becker & Green, P.C. | 1 | 99 | 2.1 | % | 55,318 | 1.7 | % | ||||||||||||||||||||||
| Hughes Hubbard & Reed LLP | 1 | 149 | 2.0 | % | 47,788 | 1.5 | % | ||||||||||||||||||||||
| Morgan Stanley Smith Barney Financing | 1 | 120 | 1.8 | % | 42,316 | 1.3 | % | ||||||||||||||||||||||
| Promontory Interfinancial Network, LLC | 1 | 74 | 1.7 | % | 36,867 | 1.1 | % | ||||||||||||||||||||||
| Raytheon BBN Technologies Corporation | 1 | 30 | 1.6 | % | 43,277 | 1.3 | % | ||||||||||||||||||||||
| Graham Holdings Company | 1 | 50 | 1.6 | % | 33,815 | 1.0 | % | ||||||||||||||||||||||
| Total/Weighted Average | 77 | 24.9 | % | 642,453 | 19.7 | % | |||||||||||||||||||||||
______________________________
Note: This table excludes short-term lease agreements.
30
| Industry Diversification - Office | ||
| September 30, 2020 | ||
| Industry Classification (NAICS) | Annualized Base Rental Revenue | Percentage of Aggregate Annualized Rent | Aggregate Rentable Square Feet | Percentage of Aggregate Square Feet | |||||||||||||||||||
| Office: | |||||||||||||||||||||||
| Professional, Scientific, and Technical Services | $ | 31,107,025 | 24.75 | % | 705,013 | 27.41 | % | ||||||||||||||||
| Finance and Insurance | 25,316,702 | 20.14 | % | 471,326 | 18.32 | % | |||||||||||||||||
| Other Services (except Public Administration) | 19,978,011 | 15.89 | % | 398,857 | 15.51 | % | |||||||||||||||||
| Information | 14,418,496 | 11.47 | % | 273,456 | 10.63 | % | |||||||||||||||||
| Legal Services | 11,830,282 | 9.41 | % | 222,482 | 8.65 | % | |||||||||||||||||
| Health Care and Social Assistance | 7,393,040 | 5.88 | % | 186,903 | 7.27 | % | |||||||||||||||||
| Public Administration | 3,678,907 | 2.93 | % | 47,956 | 1.86 | % | |||||||||||||||||
| Real Estate, Rental and Leasing | 3,242,375 | 2.58 | % | 72,952 | 2.84 | % | |||||||||||||||||
| Miscellaneous: | |||||||||||||||||||||||
| Retail Trade | 3,139,768 | 2.50 | % | 53,448 | 2.08 | % | |||||||||||||||||
| Accommodation and Food Services | 1,731,310 | 1.38 | % | 45,521 | 1.77 | % | |||||||||||||||||
| Other | 3,856,156 | 3.07 | % | 94,488 | 3.66 | % | |||||||||||||||||
| Total | $ | 125,692,072 | 100.00 | % | 2,572,402 | 100.00 | % | ||||||||||||||||
______________________________ | |||||||||||||||||||||||
| Note: Federal government tenants comprise 2.5% of annualized base rental revenue. | |||||||||||||||||||||||

31
Lease Expirations | ||
| September 30, 2020 | ||
| Year | Number of Leases | Rentable Square Feet | Percent of Rentable Square Feet | Annualized Rent (1) | Average Rental Rate | Percent of Annualized Rent (1) | ||||||||||||||||||||||||||||||||
| Office: | ||||||||||||||||||||||||||||||||||||||
| 2020 | 12 | 56,866 | 2.22 | % | $ | 3,005,133 | $ | 52.85 | 2.13 | % | ||||||||||||||||||||||||||||
| 2021 | 54 | 227,232 | 8.88 | % | 9,144,786 | 40.24 | 6.49 | % | ||||||||||||||||||||||||||||||
| 2022 | 44 | 372,864 | 14.57 | % | 18,602,269 | 49.89 | 13.19 | % | ||||||||||||||||||||||||||||||
| 2023 | 61 | 343,814 | 13.43 | % | 17,146,024 | 49.87 | 12.16 | % | ||||||||||||||||||||||||||||||
| 2024 | 54 | 294,382 | 11.50 | % | 15,799,644 | 53.67 | 11.20 | % | ||||||||||||||||||||||||||||||
| 2025 and thereafter | 150 | 1,264,782 | 49.40 | % | 77,313,748 | 61.13 | 54.83 | % | ||||||||||||||||||||||||||||||
| 375 | 2,559,940 | 100.00 | % | $ | 141,011,604 | 55.08 | 100.00 | % | ||||||||||||||||||||||||||||||
| Other: | ||||||||||||||||||||||||||||||||||||||
| 2020 | 3 | 11,658 | 1.99 | % | $ | 168,777 | $ | 14.48 | 1.14 | % | ||||||||||||||||||||||||||||
| 2021 | 10 | 62,807 | 10.73 | % | 1,396,583 | 22.24 | 9.45 | % | ||||||||||||||||||||||||||||||
| 2022 | 14 | 92,934 | 15.87 | % | 1,961,465 | 21.11 | 13.27 | % | ||||||||||||||||||||||||||||||
| 2023 | 18 | 65,858 | 11.25 | % | 1,644,596 | 24.97 | 11.13 | % | ||||||||||||||||||||||||||||||
| 2024 | 14 | 130,534 | 22.29 | % | 3,009,903 | 23.06 | 20.37 | % | ||||||||||||||||||||||||||||||
| 2025 and thereafter | 38 | 221,800 | 37.87 | % | 6,595,682 | 29.74 | 44.64 | % | ||||||||||||||||||||||||||||||
| 97 | 585,591 | 100.00 | % | $ | 14,777,006 | 25.23 | 100.00 | % | ||||||||||||||||||||||||||||||
| Total: | ||||||||||||||||||||||||||||||||||||||
| 2020 | 15 | 68,524 | 2.18 | % | $ | 3,173,910 | $ | 46.32 | 2.04 | % | ||||||||||||||||||||||||||||
| 2021 | 64 | 290,039 | 9.22 | % | 10,541,369 | 36.34 | 6.77 | % | ||||||||||||||||||||||||||||||
| 2022 | 58 | 465,798 | 14.81 | % | 20,563,734 | 44.15 | 13.20 | % | ||||||||||||||||||||||||||||||
| 2023 | 79 | 409,672 | 13.02 | % | 18,790,620 | 45.87 | 12.06 | % | ||||||||||||||||||||||||||||||
| 2024 | 68 | 424,916 | 13.51 | % | 18,809,547 | 44.27 | 12.07 | % | ||||||||||||||||||||||||||||||
| 2025 and thereafter | 188 | 1,486,582 | 47.26 | % | 83,909,430 | 56.44 | 53.86 | % | ||||||||||||||||||||||||||||||
| 472 | 3,145,531 | 100.00 | % | $ | 155,788,610 | 49.53 | 100.00 | % | ||||||||||||||||||||||||||||||
______________________________ | ||||||||||||||||||||||||||||||||||||||
| Note: This table excludes short-term temporary license agreements and office space managed by WashREIT. | ||||||||||||||||||||||||||||||||||||||
(1) Annualized Rent is equal to the rental rate effective at lease expiration (cash basis) multiplied by 12. | ||||||||||||||||||||||||||||||||||||||
32
Schedule of Properties | ||
| September 30, 2020 | ||
| PROPERTIES | LOCATION | YEAR ACQUIRED | YEAR CONSTRUCTED | # OF UNITS | NET RENTABLE SQUARE FEET | LEASED % (1) | ENDING OCCUPANCY (1) | |||||||||||||||||||||||||||||||||||||
| Multifamily Buildings / # units | ||||||||||||||||||||||||||||||||||||||||||||
| Clayborne | Alexandria, VA | 2008 | 2008 | 74 | 60,000 | 98.6 | % | 98.6 | % | |||||||||||||||||||||||||||||||||||
| Riverside Apartments | Alexandria, VA | 2016 | 1971 | 1,222 | 1,001,000 | 96.3 | % | 93.6 | % | |||||||||||||||||||||||||||||||||||
| Assembly Alexandria | Alexandria, VA | 2019 | 1990 | 532 | 437,000 | 98.3 | % | 96.4 | % | |||||||||||||||||||||||||||||||||||
| Cascade at Landmark | Alexandria, VA | 2019 | 1988 | 277 | 273,000 | 96.4 | % | 93.5 | % | |||||||||||||||||||||||||||||||||||
| Park Adams | Arlington, VA | 1969 | 1959 | 200 | 173,000 | 97.0 | % | 94.0 | % | |||||||||||||||||||||||||||||||||||
| Bennett Park | Arlington, VA | 2007 | 2007 | 224 | 215,000 | 97.8 | % | 96.9 | % | |||||||||||||||||||||||||||||||||||
| The Maxwell | Arlington, VA | 2011 | 2014 | 163 | 116,000 | 99.4 | % | 97.5 | % | |||||||||||||||||||||||||||||||||||
| The Paramount | Arlington, VA | 2013 | 1984 | 135 | 141,000 | 97.8 | % | 94.1 | % | |||||||||||||||||||||||||||||||||||
| The Wellington | Arlington, VA | 2015 | 1960 | 711 | 600,000 | 96.5 | % | 93.7 | % | |||||||||||||||||||||||||||||||||||
| Roosevelt Towers | Falls Church, VA | 1965 | 1964 | 191 | 170,000 | 96.9 | % | 94.2 | % | |||||||||||||||||||||||||||||||||||
| The Ashby at McLean | McLean, VA | 1996 | 1982 | 256 | 274,000 | 96.9 | % | 95.7 | % | |||||||||||||||||||||||||||||||||||
| Assembly Dulles | Herndon, VA | 2019 | 2000 | 328 | 361,000 | 96.6 | % | 96.0 | % | |||||||||||||||||||||||||||||||||||
| Assembly Herndon | Herndon, VA | 2019 | 1991 | 283 | 221,000 | 95.8 | % | 94.7 | % | |||||||||||||||||||||||||||||||||||
| Assembly Manassas | Manassas, VA | 2019 | 1986 | 408 | 390,000 | 97.1 | % | 95.8 | % | |||||||||||||||||||||||||||||||||||
| Assembly Leesburg | Leesburg, VA | 2019 | 1986 | 134 | 124,000 | 95.5 | % | 95.5 | % | |||||||||||||||||||||||||||||||||||
| Bethesda Hill Apartments | Bethesda, MD | 1997 | 1986 | 195 | 225,000 | 99.0 | % | 95.9 | % | |||||||||||||||||||||||||||||||||||
| Assembly Germantown | Germantown, MD | 2019 | 1990 | 218 | 211,000 | 97.7 | % | 97.2 | % | |||||||||||||||||||||||||||||||||||
| Assembly Watkins Mill | Gaithersburg, MD | 2019 | 1975 | 210 | 193,000 | 96.7 | % | 95.2 | % | |||||||||||||||||||||||||||||||||||
| 3801 Connecticut Avenue | Washington, DC | 1963 | 1951 | 307 | 178,000 | 93.5 | % | 91.2 | % | |||||||||||||||||||||||||||||||||||
| Kenmore Apartments | Washington, DC | 2008 | 1948 | 374 | 268,000 | 92.2 | % | 90.6 | % | |||||||||||||||||||||||||||||||||||
| Yale West | Washington, DC | 2014 | 2011 | 216 | 173,000 | 95.4 | % | 94.9 | % | |||||||||||||||||||||||||||||||||||
| Subtotal Stabilized Properties | 6,658 | 5,804,000 | 96.5 | % | 94.6 | % | ||||||||||||||||||||||||||||||||||||||
Trove (2) | Arlington, VA | 2015 | 2020 | 401 | 293,000 | 26.4 | % | 22.7 | % | |||||||||||||||||||||||||||||||||||
| Subtotal All Properties | 7,059 | 6,097,000 | ||||||||||||||||||||||||||||||||||||||||||
______________________________ | ||||||||||||||||||||||||||||||||||||||||||||
(1) Leased percentage and ending occupancy calculations are based on units for multifamily buildings.
(2) This development project consists of 401 units with 205 units delivered in 2020. See page 27 for further information.
33
Schedule of Properties (continued) | ||
| September 30, 2020 | ||
| PROPERTIES | LOCATION | YEAR ACQUIRED | YEAR CONSTRUCTED | NET RENTABLE SQUARE FEET | LEASED % (1) | ENDING OCCUPANCY (1) | ||||||||||||||||||||||||||||||||
| Office Buildings | ||||||||||||||||||||||||||||||||||||||
| 515 King Street | Alexandria, VA | 1992 | 1966 | 75,000 | 81.5 | % | 81.5 | % | ||||||||||||||||||||||||||||||
| Courthouse Square | Alexandria, VA | 2000 | 1979 | 121,000 | 80.0 | % | 80.0 | % | ||||||||||||||||||||||||||||||
| 1600 Wilson Boulevard | Arlington, VA | 1997 | 1973 | 171,000 | 88.5 | % | 88.5 | % | ||||||||||||||||||||||||||||||
| Fairgate at Ballston | Arlington, VA | 2012 | 1988 | 144,000 | 86.3 | % | 86.3 | % | ||||||||||||||||||||||||||||||
| Arlington Tower | Arlington, VA | 2018 | 1980/2014 | 390,000 | 92.4 | % | 90.4 | % | ||||||||||||||||||||||||||||||
| Monument II | Herndon, VA | 2007 | 2000 | 207,000 | 96.3 | % | 92.2 | % | ||||||||||||||||||||||||||||||
| Silverline Center | Tysons, VA | 1997 | 1972/1986/1999/2015 | 550,000 | 82.8 | % | 81.0 | % | ||||||||||||||||||||||||||||||
| 1901 Pennsylvania Avenue | Washington, DC | 1977 | 1960 | 101,000 | 86.4 | % | 82.0 | % | ||||||||||||||||||||||||||||||
| 1220 19th Street | Washington, DC | 1995 | 1976 | 103,000 | 85.5 | % | 79.4 | % | ||||||||||||||||||||||||||||||
| 2000 M Street | Washington, DC | 2007 | 1971 | 233,000 | 84.6 | % | 84.6 | % | ||||||||||||||||||||||||||||||
| 1140 Connecticut Avenue | Washington, DC | 2011 | 1966 | 184,000 | 88.6 | % | 88.2 | % | ||||||||||||||||||||||||||||||
| 1227 25th Street | Washington, DC | 2011 | 1988 | 135,000 | 89.6 | % | 89.6 | % | ||||||||||||||||||||||||||||||
| Army Navy Building | Washington, DC | 2014 | 1912/1987/2017 | 108,000 | 100.0 | % | 100.0 | % | ||||||||||||||||||||||||||||||
| 1775 Eye Street, NW | Washington, DC | 2014 | 1964 | 189,000 | 86.6 | % | 86.6 | % | ||||||||||||||||||||||||||||||
| Watergate 600 | Washington, DC | 2017 | 1972/1997 | 294,000 | 89.2 | % | 89.1 | % | ||||||||||||||||||||||||||||||
| Subtotal | 3,005,000 | 87.8 | % | 86.6 | % | |||||||||||||||||||||||||||||||||
______________________________ | ||||||||||||||||||||||||||||||||||||||
(1) The leased and occupied square footage for office and retail properties includes short-term lease agreements.
34
Schedule of Properties (continued) | ||
| September 30, 2020 | ||
| PROPERTIES | LOCATION | YEAR ACQUIRED | YEAR CONSTRUCTED | NET RENTABLE SQUARE FEET | LEASED % (1) | ENDING OCCUPANCY (1) | ||||||||||||||||||||||||||||||||
| Retail Centers | ||||||||||||||||||||||||||||||||||||||
| 800 S. Washington Street | Alexandria, VA | 1998/2003 | 1955/1959 | 46,000 | 95.1 | % | 90.7 | % | ||||||||||||||||||||||||||||||
| Concord Centre | Springfield, VA | 1973 | 1960 | 75,000 | 89.5 | % | 87.0 | % | ||||||||||||||||||||||||||||||
| Randolph Shopping Center | Rockville, MD | 2006 | 1972 | 83,000 | 91.4 | % | 86.6 | % | ||||||||||||||||||||||||||||||
| Montrose Shopping Center | Rockville, MD | 2006 | 1970 | 149,000 | 74.4 | % | 74.4 | % | ||||||||||||||||||||||||||||||
| Takoma Park | Takoma Park, MD | 1963 | 1962 | 51,000 | 100.0 | % | 100.0 | % | ||||||||||||||||||||||||||||||
| Westminster | Westminster, MD | 1972 | 1969 | 150,000 | 94.2 | % | 94.2 | % | ||||||||||||||||||||||||||||||
| Chevy Chase Metro Plaza | Washington, DC | 1985 | 1975 | 49,000 | 83.0 | % | 83.0 | % | ||||||||||||||||||||||||||||||
| Spring Valley Village | Washington, DC | 2014 | 1941/1950/2018 | 94,000 | 93.8 | % | 87.6 | % | ||||||||||||||||||||||||||||||
| Subtotal | 697,000 | 88.8 | % | 86.8 | % | |||||||||||||||||||||||||||||||||
| TOTAL PORTFOLIO | 9,799,000 | |||||||||||||||||||||||||||||||||||||
______________________________ | ||||||||||||||||||||||||||||||||||||||
(1) The leased and occupied square footage for office and retail properties includes short-term lease agreements.
35
Supplemental Definitions | ||
| September 30, 2020 | ||
Adjusted EBITDA (a non-GAAP measure) is earnings before interest expense, taxes, depreciation, amortization, gain/loss on sale of real estate, casualty gain/loss, real estate impairment, gain/loss on extinguishment of debt, restructuring expenses (which include severance, accelerated share-based compensation and other expenses related to a restructuring of corporate personnel), acquisition expenses and gain from non-disposal activities. | ||
Annualized base rent ("ABR") is calculated as monthly base rent (cash basis) per the lease, as of the reporting period, multiplied by 12. | ||
Average Effective Rent per Unit represents the average of gross rent amounts, divided by the average occupancy (in units) for the period presented. | ||
Average occupancy is based on monthly occupied net rentable square footage as a percentage of total net rentable square footage, except for the rows labeled "Multifamily (calculated on a unit basis)," on which average occupancy is based on average monthly occupied units as a percentage of total units. The square footage for multifamily properties only includes residential space. The occupied square footage for office and retail properties includes temporary lease agreements. | ||
Debt service coverage ratio is computed by dividing earnings attributable to the controlling interest before interest expense, taxes, depreciation, amortization, real estate impairment, gain on sale of real estate, gain/loss on extinguishment of debt, severance expense, relocation expense, acquisition and structuring expenses and gain/loss from non-disposal activities by interest expense (including interest expense from discontinued operations) and principal amortization. | ||
Debt to total market capitalization is total debt divided by the sum of total debt plus the market value of shares outstanding at the end of the period. | ||
Earnings to fixed charges ratio is computed by dividing earnings attributable to the controlling interest by fixed charges. For this purpose, earnings consist of income from continuing operations (or net income if there are no discontinued operations) plus fixed charges, less capitalized interest. Fixed charges consist of interest expense (excluding interest expense from discontinued operations), including amortized costs of debt issuance, plus interest costs capitalized. | ||
Ending Occupancy is calculated as occupied square footage as a percentage of total square footage as of the last day of that period, except Multifamily, on which ending occupancy is calculated as occupied units as a percentage of total available units as of the last day of that period. | ||
NAREIT Funds from operations ("NAREIT FFO") is defined by 2018 National Association of Real Estate Investment Trusts, Inc. (“NAREIT”) FFO White Paper Restatement, as net income (computed in accordance with generally accepted accounting principles (“GAAP”)) excluding gains (or losses) associated with the sale of property, impairment of depreciable real estate and real estate depreciation and amortization. We consider NAREIT FFO to be a standard supplemental measure for equity real estate investment trusts (“REITs”) because it facilitates an understanding of the operating performance of our properties without giving effect to real estate depreciation and amortization, which historically assumes that the value of real estate assets diminishes predictably over time. Since real estate values have instead historically risen or fallen with market conditions, we believe that NAREIT FFO more accurately provides investors an indication of our ability to incur and service debt, make capital expenditures and fund other needs. Our FFO may not be comparable to FFO reported by other real estate investment trusts. These other REITs may not define the term in accordance with the current NAREIT definition or may interpret the current NAREIT definition differently. NAREIT FFO is a non-GAAP measure. | ||
Core Funds From Operations ("Core FFO") is calculated by adjusting NAREIT FFO for the following items (which we believe are not indicative of the performance of Washington REIT’s operating portfolio and affect the comparative measurement of Washington REIT’s operating performance over time): (1) gains or losses on extinguishment of debt, (2) expenses related to acquisition and structuring activities, (3) executive transition costs, severance expenses and other expenses related to corporate restructuring and executive retirements or resignations, (4) property impairments, casualty gains and losses, and gains or losses on sale not already excluded from NAREIT FFO, as appropriate, and (5) relocation expense. These items can vary greatly from period to period, depending upon the volume of our acquisition activity and debt retirements, among other factors. We believe that by excluding these items, Core FFO serves as a useful, supplementary measure of Washington REIT’s ability to incur and service debt, and distribute dividends to its shareholders. Core FFO is a non-GAAP and non-standardized measure, and may be calculated differently by other REITs. | ||
Funds Available for Distribution ("FAD") is calculated by subtracting from NAREIT FFO (1) recurring expenditures, tenant improvements and leasing costs that are capitalized and amortized and are necessary to maintain our properties and revenue stream (excluding items contemplated prior to acquisition or associated with development / redevelopment of a property) and (2) straight line rents, then adding (3) non-real estate depreciation and amortization, (4) non-cash fair value interest expense and (5) amortization of restricted share compensation, then adding or subtracting the (6) amortization of lease intangibles, (7) real estate impairment and (8) non-cash gain/loss on extinguishment of debt, as appropriate. FAD is included herein because we consider it to be a performance measure of a REIT’s ability to incur and service debt and to distribute dividends to its shareholders. FAD is a non-GAAP and non-standardized measure and may be calculated differently by other REITs. | ||
Core Funds Available for Distribution ("Core FAD") is calculated by adjusting FAD for the following items (which we believe are not indicative of the performance of Washington REIT’s operating portfolio and affect the comparative measurement of Washington REIT’s operating performance over time): (1) gains or losses on extinguishment of debt, (2) costs related to the acquisition of properties, (3) non-share-based executive transition costs, severance expenses and other expenses related to corporate restructuring and executive retirements or resignations, (4) property impairments, casualty gains and losses, and gains or losses on sale not already excluded from FAD, as appropriate, and (5) relocation expense. These items can vary greatly from period to period, depending upon the volume of our acquisition activity and debt retirements, among other factors. We believe that by excluding these items, Core FAD serves as a useful, supplementary performance measure of Washington REIT’s ability to incur and service debt, and distribute dividends to its shareholders. Core FAD is a non-GAAP and non-standardized measure, and may be calculated differently by other REITs. | ||
36
Net Operating Income (“NOI”) is a non-GAAP measure defined as real estate rental revenue less real estate expenses. NOI is calculated as net income, less non-real estate revenue and the results of discontinued operations (including the gain or loss on sale, if any), plus interest expense, depreciation and amortization, general and administrative expenses, acquisition costs, real estate impairment, casualty gains and losses, and gain or loss on extinguishment of debt. We also present NOI on a cash basis ("Cash NOI") which is calculated as NOI less the impact of straightlining of rent and amortization of market intangibles. We provide each of NOI and cash NOI as a supplement to net income calculated in accordance with GAAP. As such, neither should be considered an alternative to net income as an indication of our operating performance. They are the primary performance measures we use to assess the results of our operations at the property level. | ||
Recurring capital expenditures represent non-accretive building improvements and leasing costs required to maintain current revenues. Recurring capital expenditures do not include acquisition capital that was taken into consideration when underwriting the purchase of a building or which are incurred to bring a building up to "operating standard." | ||
Rent increases on renewals and rollovers are calculated as the difference, weighted by square feet, of the net ABR due the first month after a term commencement date and the net ABR due the last month prior to the termination date of the former tenant's term. Beginning in Q4 2018, in cases where the space has been remeasured in accordance with criteria set by the Building Owners and Managers Association ("BOMA"), the square feet former tenant's space is adjusted to be equivalent to the square feet of the new/renewing tenant's space. | ||
Same-store portfolio properties include properties that were owned for the entirety of the years being compared, and exclude properties under redevelopment or development and properties acquired, sold or classified as held for sale during the years being compared. We define development properties as those for which we have planned or ongoing major construction activities on existing or acquired land pursuant to an authorized development plan. We consider a property's development activities to be complete when the property is ready for its intended use. The property is categorized as same-store when it has been ready for its intended use for the entirety of the years being compared. We define redevelopment properties as those for which have planned or ongoing significant development and construction activities on existing or acquired buildings pursuant to an authorized plan, which has an impact on current operating results, occupancy and the ability to lease space with the intended result of a higher economic return on the property. We categorize a redevelopment property as same-store when redevelopment activities have been complete for the majority of each year being compared. | ||
Same-store portfolio NOI growth is the change in the NOI of the same-store portfolio properties from the prior reporting period to the current reporting period. | ||
Short-term leases are commercial leases with a term of less than 12 months. | ||
| Certain statements in our earnings release and on our conference call are "forward-looking statements" within the meaning of the Private Securities Litigation Reform Act of 1995. Forward-looking statements relate to expectations, beliefs, projections, future plans and strategies, anticipated events or trends and similar expressions concerning matters that are not historical facts. In some cases, you can identify forward looking statements by the use of forward-looking terminology such as “may,” “will,” “should,” “expects,” “intends,” “plans,” “anticipates,” “believes,” “estimates,” “predicts,” or “potential” or the negative of these words and phrases or similar words or phrases which are predictions of or indicate future events or trends and which do not relate solely to historical matters. Such statements involve known and unknown risks, uncertainties, and other factors which may cause the actual results, performance, or achievements of WashREIT to be materially different from future results, performance or achievements expressed or implied by such forward-looking statements. Currently, one of the most significant factors is the adverse effect of the COVID-19 virus and ensuing economic turmoil on the financial condition, results of operations, cash flows and performance of WashREIT, particularly the impact of our ability to collect rent on schedule or at all, our ability to lease or release our commercial spaces, and increased credit losses, on the performance of our tenants generally, and on the global economy and financial markets. The extent to which COVID-19 impacts WashREIT and its tenants will depend on future developments, which are highly uncertain and cannot be predicted with confidence, including the scope, severity and duration of the pandemic, the actions taken to contain the pandemic or mitigate its impact, and the direct and indirect economic effects of the pandemic and containment measures, among others. Moreover, investors are cautioned to interpret many of the risks identified in the risk factors discussed in our Annual Report on Form 10-K for the year ended December 31, 2019, as amended by Amendment No. 1 to the Annual Report on Form 10-K, filed on March 6, 2020, and our Quarterly Report on Form 10-Q for the quarter ended March 31, 2020, filed on April 27, 2020, as being heightened as a result of the ongoing and numerous adverse impacts of COVID-19. Additional factors which may cause the actual results, performance, or achievements of WashREIT to be materially different from future results, performance or achievements expressed or implied by such forward-looking statements include, but are not limited to the risks associated with the closing and funding of our recent notes offering, the ownership of real estate in general and our real estate assets in particular; the economic health of the greater Washington metro region; the risk of failure to enter into/and or complete contemplated acquisitions and dispositions at all, within the price ranges anticipated and on the terms and timing anticipated; changes in the composition of our portfolio; fluctuations in interest rates; reductions in or actual or threatened changes to the timing of federal government spending; the risks related to use of third-party providers and joint venture partners; the ability to control our operating expenses; the economic health of our tenants; the supply of competing properties; shifts away from brick and mortar stores to e-commerce; the availability and terms of financing and capital and the general volatility of securities markets; compliance with applicable laws, including those concerning the environment and access by persons with disabilities; terrorist attacks or actions and/or cyber-attacks; weather conditions, natural disasters and pandemics; ability to maintain key personnel; failure to qualify and maintain our qualification as a REIT and the risks of changes in laws affecting REITs; and other risks and uncertainties detailed from time to time in our filings with the SEC, including our 2019 Form 10-K, as amended by Amendment No. 1 to the Annual Report on Form 10-K, filed on March 6, 2020, and subsequent Quarterly Reports on Form 10-Q. While forward-looking statements reflect our good faith beliefs, they are not guarantees of future performance. We undertake no obligation to update our forward-looking statements or risk factors to reflect new information, future events, or otherwise. | ||
37