
Nutanix Reports Fourth Quarter and Fiscal 2020 Financial Results
-- Makes Strong Progress on Subscription Transition with 88% of Billings from Subscriptions and Record 83% Non-GAAP Gross Margin
-- Delivers Solid ACV Billings of $140 Million, up 13% YoY
-- Announces Investment of $750 Million in Convertible Notes from Bain Capital Private Equity
-- Announces Dheeraj Pandey’s CEO Succession Plan
SAN JOSE, Calif.--(BUSINESS WIRE)-- Nutanix, Inc. (NASDAQ: NTNX), a leader in enterprise cloud computing, today announced financial results for its fourth quarter and fiscal year ended July 31, 2020.
This press release features multimedia. View the full release here: https://www.businesswire.com/news/home/20200827005684/en/
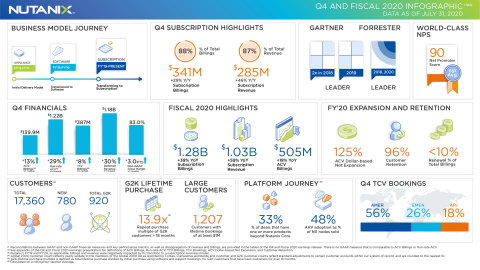
Nutanix Q4 and FY2020 Earnings Infographic (Graphic: Nutanix)
Q4 Fiscal 2020 Financial Highlights
- Revenue: $327.9 million, up 9% year-over-year from $299.9 million in the fourth quarter of fiscal 20191
- Billings: $388.5 million, up 5% year-over-year from $371.7 million in the fourth quarter of fiscal 20191
- Software and Support (TCV)2 Revenue: $326.5 million, up 14% year-over-year from $286.9 million in the fourth quarter of fiscal 2019
- Software and Support (TCV)2 Billings: $387.1 million, up 8% year-over-year from $358.7 million in the fourth quarter of fiscal 2019
- Annual Contract Value (ACV)3 Billings: $139.9 million, up 13% year-over-year from $123.6 million in the fourth quarter of fiscal 2019
- Run-rate (Book of Business) Annual Contract Value (ACV)4: $1.22 billion, up 29% year-over-year from $944.4 million as of the fourth quarter of fiscal 2019
- Gross Margin: GAAP gross margin of 79.6%, up from 77.0% in the fourth quarter of fiscal 2019; Non-GAAP gross margin of 83.0%, up from 80.0% in the fourth quarter of fiscal 2019
- Net Loss: GAAP net loss of $185.3 million, compared to a GAAP net loss of $194.3 million in the fourth quarter of fiscal 2019; Non-GAAP net loss of $79.0 million, compared to a non-GAAP net loss of $105.8 million in the fourth quarter of fiscal 2019
- Net Loss Per Share: GAAP net loss per share of $0.93, compared to a GAAP net loss per share of $1.04 in the fourth quarter of fiscal 2019; Non-GAAP net loss per share of $0.39, compared to a non-GAAP net loss per share of $0.57 in the fourth quarter of fiscal 2019
- Cash and Short-term Investments: $719.8 million, down from $908.8 million in the fourth quarter of fiscal 2019
- Deferred Revenue: $1.18 billion, up 30% from the fourth quarter of fiscal 2019
- Operating Cash Flow: Generation of $3.6 million, compared to use of $9.7 million in the fourth quarter of fiscal 2019
- Free Cash Flow: Use of $13.8 million, compared to use of $33.3 million in the fourth quarter of fiscal 2019
Fiscal 2020 Financial Highlights
- Revenue: $1.31 billion, up 6% year-over-year from $1.24 billion in fiscal 20191
- Billings: $1.58 billion, up 4% year-over-year from $1.51 billion in fiscal 20191
- Software and Support (TCV)2 Revenue: $1.28 billion, up 14% year-over-year from $1.13 billion in fiscal 2019
- Software and Support (TCV)2 Billings: $1.56 billion up 10% year-over-year from $1.41 billion in fiscal 2019
- Annual Contract Value (ACV)3 Billings: $505.2 million, up 18% year-over-year from $428.6 million in fiscal 2019
- Run-rate (Book of Business) Annual Contract Value (ACV)4: $1.22 billion, up 29% year-over-year from $944.4 million as of fiscal 2019
- Gross Margin: GAAP gross margin of 78.1%, up from 75.4% in fiscal 2019; Non-GAAP gross margin of 81.3%, up from 78.1% in fiscal 2019
- Net Loss: GAAP net loss of $872.9 million, compared to a GAAP net loss of $621.2 million in fiscal 2019; Non-GAAP net loss of $465.8 million, compared to a non-GAAP net loss of $272.9 million in fiscal 2019
- Net Loss Per Share: GAAP net loss per share of $4.48, compared to a GAAP net loss per share of $3.43 in fiscal 2019; Non-GAAP net loss per share of $2.39, compared to a non-GAAP net loss per share of $1.51 in fiscal 2019
- Operating Cash Flow: Use of $159.9 million, compared to generation of $42.2 million in fiscal 2019
- Free Cash Flow: Use of $249.4 million, compared to use of $76.3 million in fiscal 2019
Reconciliations between GAAP and non-GAAP financial measures and key performance measures are provided in the tables of this press release.
“I am thrilled to report strong results to close the year, a performance all the more impressive given the uncertainty of the global market environment we are facing today,” said Dheeraj Pandey, Chairman, Co-Founder and CEO of Nutanix. “We have demonstrated growth in the midst of a pandemic and have now generated $1.6 billion in annual billings. In addition, the $750 million investment from Bain Capital Private Equity validates the market opportunity in front of us and positions us well with enhanced financial flexibility and resources to further scale, gain share and remain at the forefront of innovation in our industry. The strategic value of IT is clear as customers increasingly value our software and solutions in a rapidly changing work environment. Our biggest product news of the quarter was launching our solution on bare metal with AWS, creating a new type of HCI: hybrid cloud infrastructure.”
“We entered the fourth quarter with a continued focus on managing expenses and cash usage, handily outperforming all key consensus metrics, while progressing on our business model transformation,” said Duston Williams, CFO of Nutanix. “We achieved these objectives, and in doing so, delivered all-time highs across a number of key financial and operating metrics, including ACV billings and gross margin. We also made significant progress on our transformation to a subscription-based business model, with 88% of billings for the quarter coming from subscription. With our shift to subscription nearly complete, the guidance metrics we provide will change accordingly to reflect our business growth, namely focusing on ACV.”
Recent Company Highlights
- Announces Dheeraj Pandey’s Intent to Retire from the Nutanix Management Team: In a separate release issued today, the Company announced that Dheeraj Pandey, the Company’s Chairman and CEO, plans to retire from the Nutanix management team upon the selection and appointment of Nutanix’s next CEO. Pandey will remain Chairman and CEO while a formal search is conducted by the Board of Directors.
- Announces $750 Million Investment from Bain Capital Private Equity and New Board Members: In a separate release issued today, the Company announced that Bain Capital Private Equity will make an investment of $750 million in convertible notes. Nutanix plans to use the investment to support the Company’s growth initiatives. In connection with the investment, David Humphrey and Max de Groen, Managing Directors of Bain Capital, will join the Nutanix Board of Directors following and subject to the close of this transaction, which is expected to occur in late September. Separately, Nutanix also added Virginia Gambale to its Board of Directors in June. Gambale is an experienced board member, technology advisor and investor with deep experience in financial and business services.
- Expanded Customer Base: Nutanix ended the fourth quarter of fiscal 2020 with 17,360 end-customers. Fourth quarter customer wins included the following Global 2000 companies: AIB Group, Cadence Design Systems, Dongfeng Renault, MayBank Singapore, QBE Insurance, and more.
- Launched Nutanix Hybrid Cloud Infrastructure on Amazon Web Services: The Company released Nutanix Clusters on AWS extending the simplicity and ease of use of its software to the public cloud, beginning with AWS. This solution delivers a single software stack across clouds, addressing key technical and operational challenges of the hybrid and multicloud era.
- Reached 88 Percent of Billings from Subscription: Nutanix continued its transition to a subscription-based business model, with subscription billings up 29% year-over-year to $341 million, representing 88% of total billings, and subscription revenue up 46% year-over-year to $285 million, representing 87% of total revenue.
- Recognized as a Leader: Nutanix was named a Leader in The Forrester Wave™: Hyperconverged Infrastructure, Q3 2020 report, published by Forrester Research, Inc. Nutanix believes this is consistent with additional independent market research, all of which conclude that Nutanix software is an undisputed leader in the fast-growing HCI market.
- Reached Significant Customer Milestone for Nutanix Files: Nutanix Files, the Company's scale-out file storage solution, reached the significant milestone of 2,500 customers, including nearly 180 Global 2,000 companies. Nutanix Files, Objects and Volumes deliver the industry’s only software-defined, end-to-end storage solutions, delivered on a single platform, through a common management environment covering file, object and block storage needs.
- Strengthened Nutanix’s Desktop as a Service Solution: The Company added several new capabilities to its Desktop as a Service (DaaS) solution, Xi Frame, including enhanced onboarding for on-premises desktop workloads on Nutanix AHV, expanded support for user profile management, the ability to convert Windows Apps into Progressive Web Apps (PWA), and increased regional support to 69 regions across Microsoft Azure, GCP and AWS.
- Delivered Solutions to Manage Cloud Infrastructure from Anywhere: Nutanix launched new solutions that allow IT teams to deploy, upgrade and troubleshoot their cloud infrastructure while working from anywhere. These solutions are delivered via Nutanix Foundation Central, Insights and Lifecycle Manager - all of which are available as part of Nutanix software at no additional cost to customers.
- Will Host Virtual .NEXT User Conference September 8-11: The Company’s marquee user event has been completely reinvented to suit an online, interactive format for global participants. It will include visionary keynotes participants have come to expect, as well as hands-on technology sessions and the ability for attendees to interact with each other and Nutanix experts. Registration is free at the .NEXT Digital Experience website, which also includes up-to-date information on speakers, sessions and topics.
Q1 Fiscal 2021 Financial Outlook
In conjunction with its move to a subscription-based business model, the Company is shifting its guidance to Annual Contract Value (ACV) billings instead of Total Contract Value (TCV) billings and revenue. Management will resume providing quarterly guidance with Q1 Fiscal 2021 during its earnings conference call today in order to provide context to this shift.
Supplementary materials to this press release, including the company’s fourth quarter and fiscal year 2020 earnings presentation, can be found at https://ir.nutanix.com/company/financial.
Webcast and Conference Call Information
Today at 5:30 p.m. Eastern Time/2:30 p.m. Pacific Time, Nutanix executives will host a conference call previously scheduled for September 1, 2020 to discuss the Company’s fourth quarter and fiscal year 2020 financial results. To listen to the call via telephone, dial 1-833-227-5841 in the United States or 1-647-689-4068 from outside the United States. The conference ID is 4679381. This call will be webcast live and available to all interested parties on our Investor Relations website at ir.nutanix.com. Shortly after the conclusion of the conference call, a replay of the audio webcast will be available on the Nutanix Investor Relations website. A telephonic replay will be available for one week by calling 1-800-585-8367 or 1-416-621-4642, and entering the conference ID 4679381.
Definitions
1Reflects total billings/revenue compression from the Company’s ongoing transition to subscription and the significant reduction of hardware billings/revenue.
2Total Contract Value, or TCV, for any given period is defined as the total software and support revenue or total software and support billings, as applicable, during such period, which excludes revenue and billings associated with pass-through hardware sales during the period.
3Annual Contract Value, or ACV, is defined as the total annualized value of a contract, excluding amounts related to professional services. The total annualized value for a contract is calculated by dividing the total value of the contract by the number of years in the term of such contract, using, where applicable, an assumed term of five years for contracts that do not have a specified term. ACV Billings for any given period is defined as the sum of the ACV for all contracts billed during the given period.
4Run-rate ACV at the end of any period, is the sum of ACV for all contracts that are in effect as of the end of that period. For the purposes of this calculation, we assume that the contract term begins on the date a contract is booked, irrespective of the periods in which the Company would recognize revenue for such contract.
Non-GAAP Financial Measures and Other Key Performance Measures
To supplement our consolidated financial statements, which are prepared and presented in accordance with GAAP, we use the following non-GAAP financial and other key performance measures: billings, non-GAAP gross margin, non-GAAP operating expenses, non-GAAP net loss, non-GAAP net loss per share, free cash flow, software and support revenue (or TCV revenue), subscription revenue, software and support billings (or TCV billings), subscription billings, Annual Contract Value billings (or ACV billings), Run-rate Annual Contract Value (or Run-rate ACV), and professional services billings. In computing these non-GAAP financial measures and key performance measures, we exclude certain items such as stock-based compensation and the related income tax impact, costs associated with our acquisitions (such as amortization of acquired intangible assets, income tax-related impact, and other acquisition-related costs), impairment of operating lease-related assets, amortization of debt discount and issuance costs, other non-recurring transactions and the related tax impact, and the revenue and billings associated with pass-through hardware sales. Billings is a performance measure which we believe provides useful information to investors because it represents the amounts under binding purchase orders received by us during a given period that have been billed, and we calculate billings by adding the change in deferred revenue between the start and end of the period to total revenue recognized in the same period. Non-GAAP gross margin, non-GAAP operating expenses, non-GAAP net loss, and non-GAAP net loss per share are financial measures which we believe provide useful information to investors because they provide meaningful supplemental information regarding our performance and liquidity by excluding certain expenses and expenditures such as stock-based compensation expense that may not be indicative of our ongoing core business operating results. Free cash flow is a performance measure that we believe provides useful information to our management and investors about the amount of cash generated by the business after necessary capital expenditures, and we define free cash flow as net cash (used in) provided by operating activities less purchases of property and equipment. TCV revenue and TCV billings are performance measures that we believe provide useful information to our management and investors as they allow us to better track the true growth of our software business by excluding the amounts attributable to the pass-through hardware sales that we use to deliver our solutions. Subscription revenue, subscription billings, and professional services billings are performance measures that we believe provide useful information to our management and investors as they allow us to better track the growth of the subscription-based portion of our business, which is a critical part of our business plan. ACV billings and Run-rate ACV are performance measures that we believe provide useful information to our management and investors as they allow us to better track the topline growth of our business during our transition to a subscription-based business model because they take into account variability in term lengths. We use these non-GAAP financial and key performance measures for financial and operational decision-making and as a means to evaluate period-to-period comparisons. However, these non-GAAP financial and key performance measures have limitations as analytical tools and you should not consider them in isolation or as substitutes for analysis of our results as reported under GAAP. Billings, non-GAAP gross margin, non-GAAP operating expenses, non-GAAP net loss, non-GAAP net loss per share, and free cash flow are not substitutes for total revenue, gross margin, operating expenses, net loss, net loss per share, or net cash (used in) provided by operating activities, respectively; subscription revenue, TCV revenue and TCV billings are not substitutes for total revenue; and subscription and professional services billings are not a substitute for subscription and professional services revenue. There is no GAAP measure that is comparable to either ACV billings or Run-rate ACV, so we have not reconciled either ACV billings or Run-rate ACV numbers included in this press release to any GAAP measure. In addition, other companies, including companies in our industry, may calculate non-GAAP financial measures and key performance measures differently or may use other measures to evaluate their performance, all of which could reduce the usefulness of our non-GAAP financial measures and key performance measures as tools for comparison. We urge you to review the reconciliation of our non-GAAP financial measures and key performance measures to the most directly comparable GAAP financial measures included below in the tables captioned “Reconciliation of Revenue to Billings,” “Disaggregation of Revenue and Billings,” “Reconciliation of Subscription and Professional Services Revenue to Subscription and Professional Services Billings,” “Reconciliation of Software and Support Revenue (TCV Revenue) to Software and Support Billings (TCV Billings),” “Reconciliation of GAAP to Non-GAAP Profit Measures,” and “Reconciliation of GAAP Net Cash (Used In) Provided By Operating Activities to Non-GAAP Free Cash Flow,” and not to rely on any single financial measure to evaluate our business.
Forward-Looking Statements
This press release contains express and implied forward-looking statements, including, but not limited to, statements regarding: our business plans, initiatives and objectives, including changes we have made or anticipate making in response to the COVID-19 pandemic, our ability to manage our business during the pandemic, and the position we anticipate being in following the pandemic; our ability to execute such plans, initiatives and objectives in a timely manner, and the benefits and impact of such plans, initiatives and objectives, including our ability to manage our expenses and decrease our cash usage in future periods; the competitive market, including our competitive position, our projections about our market share and the size of our total addressable market; our customer needs and our response to those needs; the benefits and capabilities of our platform, solutions, products, services and technology, including the interoperability and availability of our solutions with and on third-party platforms; our plans and expectations regarding new products, services, product features and technology, including those that are still under development or in process; our plans and timing for, and the success and impact of, our transition to a subscription-based business model and our changes in guidance metrics; our plans to provide financial guidance in the future; the timing and potential impact of the COVID-19 pandemic on the global market environment and the IT industry, as well as on our business, operations and financial results, including the actions we have taken to manage operating expenses; the investment from Bain Capital Private Equity, including the Company’s plans for the use of the proceeds and the timing thereof, as well as any expected benefits thereof on the Company’s leadership and governance structure, and the expected appointment of new directors to the Company’s Board, including the timing and benefits thereof; and the succession plan for the Company’s Chief Executive Officer, including the timing, success, and impact thereof. These forward-looking statements are not historical facts and instead are based on our current expectations, estimates, opinions, and beliefs. Consequently, you should not rely on these forward-looking statements. The accuracy of such forward-looking statements depends upon future events and involves risks, uncertainties, and other factors, including factors that may be beyond our control, that may cause these statements to be inaccurate and cause our actual results, performance or achievements to differ materially and adversely from those anticipated or implied by such statements, including, among others: failure to successfully close or realize the full benefits of the above-described investment from Bain Capital Private Equity, failure to achieve financial milestones, adjustment to the conversion price of the convertible notes, or unexpected difficulties or delays in successfully closing or realizing the full benefits of such investment; failure to attract, integrate and retain a new Chief Executive Officer, or otherwise successfully manage our CEO succession plan; failure to successfully implement or realize the full benefits of, or unexpected difficulties or delays in successfully implementing or realizing the full benefits of, our business plans, initiatives and objectives; the timing, breadth, and impact of the COVID-19 pandemic on our business, operations, and financial results, as well as the impact on our customers, partners, and end markets; failure to timely and successfully meet our customer needs; negative impact of the changes in our guidance metrics; delays in or lack of customer or market acceptance of our new products, services, product features or technology; delays or unexpected accelerations in the transition to a subscription-based business model; the rapid evolution of the markets in which we compete; our ability to achieve, sustain and/or manage future growth effectively; factors that could result in the significant fluctuation of our future quarterly operating results, including, among other things, anticipated changes to our revenue and product mix, including changes as a result of our transition to a subscription-based business model, which will slow revenue growth during such transition and make forecasting future performance more difficult, the timing and magnitude of orders, shipments and acceptance of our solutions in any given quarter, our ability to attract new and retain existing end-customers, changes in the pricing of certain components of our solutions, and fluctuations in demand and competitive pricing pressures for our solutions; the introduction, or acceleration of adoption of, competing solutions, including public cloud infrastructure; and other risks detailed in our Quarterly Report on Form 10-Q for the fiscal quarter ended April 30, 2020, filed with the U.S. Securities and Exchange Commission, or the SEC, on June 4, 2020. Additional information will also be set forth in our Annual Report on Form 10-K that will be filed for the fiscal year ended July 31, 2020, which should be read in conjunction with this press release and the financial results included herein. Our SEC filings are available on the Investor Relations section of the company’s website at ir.nutanix.com and on the SEC's website at www.sec.gov. These forward-looking statements speak only as of the date of this press release and, except as required by law, we assume no obligation, and expressly disclaim any obligation, to update, alter or otherwise revise any of these forward-looking statements to reflect actual results or subsequent events or circumstances.
About Nutanix
Nutanix is a global leader in cloud software and a pioneer in hyperconverged infrastructure solutions, making computing invisible anywhere. Organizations around the world use Nutanix software to leverage a single platform to manage any app at any location for their private, hybrid and multicloud environments. Learn more at www.nutanix.com or follow us on Twitter @nutanix.
© 2020 Nutanix, Inc. All rights reserved. Nutanix, the Nutanix logo, and all Nutanix product and service names mentioned herein are registered trademarks or trademarks of Nutanix, Inc. in the United States and other countries. All other brand names mentioned herein are for identification purposes only and may be the trademarks of their respective holder(s). This press release contains links to external websites that are not part of Nutanix.com. Nutanix does not control these sites and disclaims all responsibility for the content or accuracy of any external site. Our decision to link to an external site should not be considered an endorsement of any content on such a site.
| NUTANIX, INC. | ||||||||
CONSOLIDATED BALANCE SHEETS |
||||||||
(Unaudited) |
||||||||
|
As of |
|||||||
|
July 31,
|
|
July 31,
|
|||||
|
|
|
|
|||||
|
(in thousands) |
|||||||
Assets |
|
|
|
|||||
Current assets: |
|
|
|
|||||
Cash and cash equivalents |
$ |
396,678 |
|
|
$ |
318,737 |
|
|
Short-term investments |
512,156 |
|
|
401,041 |
|
|||
Accounts receivable, net |
245,475 |
|
|
242,516 |
|
|||
Deferred commissions—current |
46,238 |
|
|
68,694 |
|
|||
Prepaid expenses and other current assets |
74,665 |
|
|
63,032 |
|
|||
Total current assets |
1,275,212 |
|
|
1,094,020 |
|
|||
Property and equipment, net |
136,962 |
|
|
143,172 |
|
|||
Operating lease right-of-use assets |
— |
|
|
127,326 |
|
|||
Deferred commissions—non-current |
107,474 |
|
|
146,834 |
|
|||
Intangible assets, net |
66,773 |
|
|
49,392 |
|
|||
Goodwill |
185,180 |
|
|
185,260 |
|
|||
Other assets—non-current |
14,441 |
|
|
22,543 |
|
|||
Total assets |
$ |
1,786,042 |
|
|
$ |
1,768,547 |
|
|
|
|
|
|
|||||
Liabilities and Stockholders’ Equity (Deficit) |
|
|
|
|||||
Current liabilities: |
|
|
|
|||||
Accounts payable |
$ |
74,047 |
|
|
$ |
54,029 |
|
|
Accrued compensation and benefits |
99,804 |
|
|
109,109 |
|
|||
Accrued expenses and other current liabilities |
28,797 |
|
|
25,924 |
|
|||
Deferred revenue—current |
396,667 |
|
|
534,572 |
|
|||
Operating lease liabilities—current |
— |
|
|
36,569 |
|
|||
Total current liabilities |
599,315 |
|
|
760,203 |
|
|||
Deferred revenue—non-current |
513,377 |
|
|
648,869 |
|
|||
Operating lease liabilities—non-current |
— |
|
|
116,794 |
|
|||
Convertible senior notes, net |
458,910 |
|
|
490,222 |
|
|||
Other liabilities—non-current |
27,547 |
|
|
27,436 |
|
|||
Total liabilities |
1,599,149 |
|
|
2,043,524 |
|
|||
Stockholders’ equity (deficit): |
|
|
|
|||||
Common stock |
5 |
|
|
5 |
|
|||
Additional paid-in capital |
1,835,528 |
|
|
2,245,180 |
|
|||
Accumulated other comprehensive income |
669 |
|
|
2,030 |
|
|||
Accumulated deficit |
(1,649,309 |
) |
|
(2,522,192 |
) |
|||
Total stockholders’ equity (deficit) |
186,893 |
|
|
(274,977 |
) |
|||
Total liabilities and stockholders’ equity (deficit) |
$ |
1,786,042 |
|
|
$ |
1,768,547 |
|
|
| NUTANIX, INC. | ||||||||||||||||
CONSOLIDATED STATEMENTS OF OPERATIONS |
||||||||||||||||
(Unaudited) |
||||||||||||||||
|
Three Months Ended
|
|
Fiscal Year Ended
|
|||||||||||||
|
2019 |
|
2020 |
|
2019 |
|
2020 |
|||||||||
|
|
|
|
|
|
|
|
|||||||||
|
(in thousands, except per share data) |
|||||||||||||||
Revenue: |
|
|
|
|
|
|
|
|||||||||
Product |
$ |
186,347 |
|
|
$ |
179,075 |
|
|
$ |
832,419 |
|
|
$ |
765,822 |
|
|
Support, entitlements and other services |
113,529 |
|
|
148,799 |
|
|
403,724 |
|
|
541,860 |
|
|||||
Total revenue |
299,876 |
|
|
327,874 |
|
|
1,236,143 |
|
|
1,307,682 |
|
|||||
Cost of revenue: |
|
|
|
|
|
|
|
|||||||||
Product (1)(2) |
28,323 |
|
|
13,413 |
|
|
143,078 |
|
|
71,312 |
|
|||||
Support, entitlements and other services (1) |
40,640 |
|
|
53,558 |
|
|
161,050 |
|
|
215,377 |
|
|||||
Total cost of revenue |
68,963 |
|
|
66,971 |
|
|
304,128 |
|
|
286,689 |
|
|||||
Gross profit |
230,913 |
|
|
260,903 |
|
|
932,015 |
|
|
1,020,993 |
|
|||||
Operating expenses: |
|
|
|
|
|
|
|
|||||||||
Sales and marketing (1)(2) |
253,843 |
|
|
264,453 |
|
|
909,750 |
|
|
1,160,389 |
|
|||||
Research and development (1) |
129,169 |
|
|
135,338 |
|
|
500,719 |
|
|
553,978 |
|
|||||
General and administrative (1) |
30,420 |
|
|
32,464 |
|
|
119,587 |
|
|
135,547 |
|
|||||
Total operating expenses |
413,432 |
|
|
432,255 |
|
|
1,530,056 |
|
|
1,849,914 |
|
|||||
Loss from operations |
(182,519 |
) |
|
(171,352 |
) |
|
(598,041 |
) |
|
(828,921 |
) |
|||||
Other expense, net |
(4,705 |
) |
|
(9,757 |
) |
|
(15,019 |
) |
|
(26,300 |
) |
|||||
Loss before provision for income taxes |
(187,224 |
) |
|
(181,109 |
) |
|
(613,060 |
) |
|
(855,221 |
) |
|||||
Provision for income taxes |
7,114 |
|
|
4,239 |
|
|
8,119 |
|
|
17,662 |
|
|||||
Net loss |
$ |
(194,338 |
) |
|
$ |
(185,348 |
) |
|
$ |
(621,179 |
) |
|
$ |
(872,883 |
) |
|
Net loss per share attributable to Class A and Class B common stockholders—basic and diluted |
$ |
(1.04 |
) |
|
$ |
(0.93 |
) |
|
$ |
(3.43 |
) |
|
$ |
(4.48 |
) |
|
Weighted average shares used in computing net loss per share attributable to Class A and Class B common stockholders—basic and diluted |
186,371 |
|
|
200,150 |
|
|
181,031 |
|
|
194,719 |
|
|||||
| __________________________________________________ | |
(1) |
Includes the following stock-based compensation expense: |
Three Months Ended
|
|
Fiscal Year Ended
|
||||||||||||||
|
2019 |
|
2020 |
|
2019 |
|
2020 |
|||||||||
|
|
|
|
|
|
|
|
|||||||||
|
(in thousands) |
|||||||||||||||
Product cost of revenue |
$ |
1,012 |
|
|
$ |
1,397 |
|
|
$ |
3,535 |
|
|
$ |
5,334 |
|
|
Support, entitlements and other services cost of revenue |
4,254 |
|
|
6,164 |
|
|
15,326 |
|
|
22,014 |
|
|||||
Sales and marketing |
26,426 |
|
|
33,878 |
|
|
107,751 |
|
|
126,015 |
|
|||||
Research and development |
32,566 |
|
|
39,768 |
|
|
140,519 |
|
|
153,252 |
|
|||||
General and administrative |
9,149 |
|
|
11,654 |
|
|
39,598 |
|
|
45,383 |
|
|||||
Total stock-based compensation expense |
$ |
73,407 |
|
|
$ |
92,861 |
|
|
$ |
306,729 |
|
|
$ |
351,998 |
|
|
(2) |
Includes the following amortization of intangible assets: |
|
Three Months Ended
|
|
Fiscal Year Ended
|
|||||||||||||
|
2019 |
|
2020 |
|
2019 |
|
2020 |
|||||||||
|
|
|
|
|
|
|
|
|||||||||
|
(in thousands) |
|||||||||||||||
Product cost of sales |
$ |
3,694 |
|
|
$ |
3,695 |
|
|
$ |
14,248 |
|
|
$ |
14,777 |
|
|
Sales and marketing |
651 |
|
|
650 |
|
|
2,528 |
|
|
2,603 |
|
|||||
Total amortization of intangible assets |
$ |
4,345 |
|
|
$ |
4,345 |
|
|
$ |
16,776 |
|
|
$ |
17,380 |
|
|
| NUTANIX, INC. | ||||||||
CONSOLIDATED STATEMENTS OF CASH FLOWS |
||||||||
(Unaudited) |
||||||||
|
Fiscal Year Ended
|
|||||||
|
2019 |
|
2020 |
|||||
|
|
|
|
|||||
|
(in thousands) |
|||||||
Cash flows from operating activities: |
|
|
|
|||||
Net loss |
$ |
(621,179 |
) |
|
$ |
(872,883 |
) |
|
Adjustments to reconcile net loss to net cash provided by (used in) operating activities: |
|
|
|
|||||
Depreciation and amortization |
77,612 |
|
|
93,773 |
|
|||
Stock-based compensation |
306,729 |
|
|
351,998 |
|
|||
Amortization of debt discount and debt issuance costs |
29,313 |
|
|
31,313 |
|
|||
Operating lease cost, net of accretion |
— |
|
|
30,374 |
|
|||
Change in fair value of contingent consideration |
(832 |
) |
|
— |
|
|||
Impairment of lease-related assets |
— |
|
|
3,002 |
|
|||
Other |
(2,786 |
) |
|
324 |
|
|||
Changes in operating assets and liabilities: |
|
|
|
|||||
Accounts receivable, net |
15,704 |
|
|
4,334 |
|
|||
Deferred commissions |
(39,333 |
) |
|
(61,816 |
) |
|||
Prepaid expenses and other assets |
(12,037 |
) |
|
10,089 |
|
|||
Accounts payable |
13,508 |
|
|
(16,574 |
) |
|||
Accrued compensation and benefits |
14,406 |
|
|
18,765 |
|
|||
Accrued expenses and other liabilities |
(17,454 |
) |
|
3,400 |
|
|||
Operating leases, net |
— |
|
|
(28,394 |
) |
|||
Deferred revenue |
278,517 |
|
|
272,410 |
|
|||
Net cash provided by (used in) operating activities |
42,168 |
|
|
(159,885 |
) |
|||
Cash flows from investing activities: |
|
|
|
|||||
Maturities of investments |
588,763 |
|
|
645,828 |
|
|||
Purchases of investments |
(468,144 |
) |
|
(607,194 |
) |
|||
Sales of investments |
— |
|
|
75,413 |
|
|||
Purchases of property and equipment |
(118,452 |
) |
|
(89,488 |
) |
|||
Payments for acquisitions, net of cash and restricted cash acquired |
(19,017 |
) |
|
— |
|
|||
Net cash (used in) provided by investing activities |
(16,850 |
) |
|
24,559 |
|
|||
Cash flows from financing activities: |
|
|
|
|||||
Proceeds from sales of shares through employee equity incentive plans, net of repurchases |
69,210 |
|
|
57,797 |
|
|||
Payment of contingent consideration associated with an acquisition |
(1,040 |
) |
|
— |
|
|||
Payment of debt in conjunction with an acquisition |
(991 |
) |
|
— |
|
|||
Payment of issuance costs related to convertible senior notes |
(75 |
) |
|
— |
|
|||
Net cash provided by financing activities |
67,104 |
|
|
57,797 |
|
|||
Net increase (decrease) in cash, cash equivalents and restricted cash |
$ |
92,422 |
|
|
$ |
(77,529 |
) |
|
Cash, cash equivalents and restricted cash—beginning of period |
307,098 |
|
|
399,520 |
|
|||
Cash, cash equivalents and restricted cash—end of period |
$ |
399,520 |
|
|
$ |
321,991 |
|
|
Restricted cash (1) |
2,842 |
|
|
3,254 |
|
|||
Cash and cash equivalents—end of period |
$ |
396,678 |
|
|
$ |
318,737 |
|
|
Supplemental disclosures of cash flow information: |
|
|
|
|||||
Cash paid for income taxes |
$ |
28,999 |
|
|
$ |
16,625 |
|
|
Supplemental disclosures of non-cash investing and financing information: |
|
|
|
|||||
Issuance of common stock for acquisitions |
$ |
103,305 |
|
|
$ |
— |
|
|
Purchases of property and equipment included in accounts payable and accrued liabilities |
$ |
8,074 |
|
|
$ |
4,630 |
|
|
Vesting of early exercised stock options |
$ |
183 |
|
|
$ |
— |
|
|
| __________________________________________________ | |
(1) |
Included within other assets—non-current in the consolidated balance sheets. |
| Reconciliation of Revenue to Billings | ||||||||||||||||
(Unaudited) |
||||||||||||||||
|
Three Months Ended
|
|
Fiscal Year Ended
|
|||||||||||||
|
2019 |
|
2020 |
|
2019 |
|
2020 |
|||||||||
|
|
|
|
|
|
|
|
|||||||||
|
(in thousands) |
|||||||||||||||
Total revenue |
$ |
299,876 |
|
|
$ |
327,874 |
|
|
$ |
1,236,143 |
|
|
$ |
1,307,682 |
|
|
Change in deferred revenue, net of acquisitions |
71,782 |
|
|
60,636 |
|
|
278,517 |
|
|
272,410 |
|
|||||
Total billings |
$ |
371,658 |
|
|
$ |
388,510 |
|
|
$ |
1,514,660 |
|
|
$ |
1,580,092 |
|
|
Disaggregation of Revenue and Billings |
||||||||||||||||
(Unaudited) |
||||||||||||||||
|
Three Months Ended
|
|
Fiscal Year Ended
|
|||||||||||||
|
2019 |
|
2020 |
|
2019 |
|
2020 |
|||||||||
|
|
|
|
|
|
|
|
|||||||||
|
(in thousands) |
|||||||||||||||
Disaggregation of Revenue: |
|
|
|
|
|
|
|
|||||||||
Subscription |
$ |
195,636 |
|
|
$ |
284,777 |
|
|
$ |
648,415 |
|
|
$ |
1,030,180 |
|
|
Non-portable software |
82,221 |
|
|
29,539 |
|
|
449,131 |
|
|
208,158 |
|
|||||
Hardware |
13,002 |
|
|
1,403 |
|
|
105,321 |
|
|
23,455 |
|
|||||
Professional services |
9,017 |
|
|
12,155 |
|
|
33,276 |
|
|
45,889 |
|
|||||
Total revenue |
$ |
299,876 |
|
|
$ |
327,874 |
|
|
$ |
1,236,143 |
|
|
$ |
1,307,682 |
|
|
|
|
|
|
|
|
|
|
|||||||||
Disaggregation of Billings: |
|
|
|
|
|
|
|
|||||||||
Subscription |
$ |
263,308 |
|
|
$ |
340,633 |
|
|
$ |
916,000 |
|
|
$ |
1,276,413 |
|
|
Non-portable software |
82,221 |
|
|
29,539 |
|
|
449,131 |
|
|
208,158 |
|
|||||
Hardware |
13,002 |
|
|
1,403 |
|
|
105,321 |
|
|
23,455 |
|
|||||
Professional services |
13,127 |
|
|
16,935 |
|
|
44,208 |
|
|
72,066 |
|
|||||
Total billings |
$ |
371,658 |
|
|
$ |
388,510 |
|
|
$ |
1,514,660 |
|
|
$ |
1,580,092 |
|
|
Subscription — Subscription revenue includes any performance obligation which has a defined term, and is generated from the sales of software entitlement and support subscriptions, subscription software licenses and cloud-based Software as a Service, or SaaS offerings.
- Ratable — We recognize revenue from software entitlement and support subscriptions and SaaS offerings ratably over the contractual service period, the substantial majority of which relate to software entitlement and support subscriptions.
- Upfront — Revenue from our subscription software licenses is generally recognized upfront upon transfer of control to the customer, which happens when we make the software available to the customer.
Non-portable software — Non-portable software revenue includes sales of our enterprise cloud platform when delivered on a configured-to-order appliance by us or one of our OEM partners. The software licenses associated with these sales are typically non-portable and have a term equal to the life of the appliance on which the software is delivered. Revenue from our non-portable software products is generally recognized upon transfer of control to the customer.
Hardware — In transactions where we deliver the hardware appliance, we consider ourselves to be the principal in the transaction and we record revenue and costs of goods sold on a gross basis. We consider the amount allocated to hardware revenue to be equivalent to the cost of the hardware procured. Hardware revenue is generally recognized upon transfer of control to the customer.
Professional services — We also sell professional services with our products. We recognize revenue related to professional services as they are performed.
Annual Contract Value Billings and Run-rate Annual Contract Value |
||||||||||||||||
(Unaudited) |
||||||||||||||||
|
Three Months Ended
|
|
Fiscal Year Ended
|
|||||||||||||
|
2019 |
|
2020 |
|
2019 |
|
2020 |
|||||||||
|
|
|
|
|
|
|
|
|||||||||
|
(in thousands) |
|||||||||||||||
Annual Contract Value Billings (ACV Billings) |
$ |
123,646 |
|
|
$ |
139,942 |
|
|
$ |
428,564 |
|
|
$ |
505,179 |
|
|
Run-rate Annual Contract Value (Run-rate ACV) |
$ |
944,444 |
|
|
$ |
1,219,965 |
|
|
$ |
944,444 |
|
|
$ |
1,219,965 |
|
|
| Reconciliation of Subscription and Professional Services Revenue to Subscription and Professional Services Billings | ||||||||||||||||
(Unaudited) |
||||||||||||||||
|
Three Months Ended
|
|
Fiscal Year Ended
|
|||||||||||||
|
2019 |
|
2020 |
|
2019 |
|
2020 |
|||||||||
|
|
|
|
|
|
|
|
|||||||||
|
(in thousands) |
|||||||||||||||
Subscription revenue |
$ |
195,636 |
|
|
$ |
284,777 |
|
|
$ |
648,415 |
|
|
$ |
1,030,180 |
|
|
Change in subscription deferred revenue, net of acquisitions |
67,672 |
|
|
55,856 |
|
|
267,585 |
|
|
246,233 |
|
|||||
Subscription billings |
$ |
263,308 |
|
|
$ |
340,633 |
|
|
$ |
916,000 |
|
|
$ |
1,276,413 |
|
|
|
|
|
|
|
|
|
|
|||||||||
Professional services revenue |
$ |
9,017 |
|
|
$ |
12,155 |
|
|
$ |
33,276 |
|
|
$ |
45,889 |
|
|
Change in professional services deferred revenue |
4,110 |
|
|
4,780 |
|
|
10,932 |
|
|
26,177 |
|
|||||
Professional services billings |
$ |
13,127 |
|
|
$ |
16,935 |
|
|
$ |
44,208 |
|
|
$ |
72,066 |
|
|
Reconciliation of Software and Support Revenue (TCV Revenue) to Software and Support Billings (TCV Billings) |
||||||||||||||||
(Unaudited) |
||||||||||||||||
|
Three Months Ended
|
|
Fiscal Year Ended
|
|||||||||||||
|
2019 |
|
2020 |
|
2019 |
|
2020 |
|||||||||
|
|
|
|
|
|
|
|
|||||||||
|
(in thousands) |
|||||||||||||||
Software revenue |
$ |
173,345 |
|
|
$ |
177,672 |
|
|
$ |
727,098 |
|
|
$ |
742,367 |
|
|
Hardware revenue |
13,002 |
|
|
1,403 |
|
|
105,321 |
|
|
23,455 |
|
|||||
Product revenue |
186,347 |
|
|
179,075 |
|
|
832,419 |
|
|
765,822 |
|
|||||
Support, entitlements and other services revenue |
113,529 |
|
|
148,799 |
|
|
403,724 |
|
|
541,860 |
|
|||||
Total revenue |
$ |
299,876 |
|
|
$ |
327,874 |
|
|
$ |
1,236,143 |
|
|
$ |
1,307,682 |
|
|
|
|
|
|
|
|
|
|
|||||||||
Software and support revenue (TCV revenue) (1) |
$ |
286,874 |
|
|
$ |
326,471 |
|
|
$ |
1,130,822 |
|
|
$ |
1,284,227 |
|
|
Change in software and support deferred revenue (TCV deferred revenue), net of acquisitions |
71,782 |
|
|
60,636 |
|
|
278,517 |
|
|
272,410 |
|
|||||
Software and support billings (TCV billings) (1) |
$ |
358,656 |
|
|
$ |
387,107 |
|
|
$ |
1,409,339 |
|
|
$ |
1,556,637 |
|
|
| __________________________________________________ | |
(1) |
Software and support revenue and billings (TCV revenue and billings) include software and support, entitlements and other services revenue and billings. |
| Reconciliation of GAAP to Non-GAAP Profit Measures | |||||||||||||||||||||||||
(Unaudited) |
|||||||||||||||||||||||||
|
GAAP |
Non-GAAP Adjustments |
Non-GAAP |
||||||||||||||||||||||
|
Three Months Ended July 31, 2020 |
(1) |
(2) |
(3) |
(4) |
(5) |
Three Months Ended July 31, 2020 |
||||||||||||||||||
|
|
|
|
|
|
|
|
||||||||||||||||||
|
(in thousands, except percentages and per share data) |
||||||||||||||||||||||||
Gross profit |
$ |
260,903 |
|
$ |
7,561 |
|
$ |
3,695 |
|
$ |
— |
|
$ |
— |
|
$ |
— |
|
$ |
272,159 |
|
||||
Gross margin |
79.6 |
% |
2.3 |
% |
1.1 |
% |
— |
|
— |
|
— |
|
83.0 |
% |
|||||||||||
Operating expenses: |
|
|
|
|
|
|
|
||||||||||||||||||
Sales and marketing |
264,453 |
|
(33,878 |
) |
(650 |
) |
— |
|
— |
|
— |
|
229,925 |
|
|||||||||||
Research and development |
135,338 |
|
(39,768 |
) |
— |
|
— |
|
— |
|
— |
|
95,570 |
|
|||||||||||
General and administrative |
32,464 |
|
(11,654 |
) |
— |
|
(520 |
) |
— |
|
— |
|
20,290 |
|
|||||||||||
Total operating expenses |
432,255 |
|
(85,300 |
) |
(650 |
) |
(520 |
) |
— |
|
— |
|
345,785 |
|
|||||||||||
Loss from operations |
(171,352 |
) |
92,861 |
|
4,345 |
|
520 |
|
— |
|
— |
|
(73,626 |
) |
|||||||||||
Net loss |
$ |
(185,348 |
) |
$ |
92,861 |
|
$ |
4,345 |
|
$ |
520 |
|
$ |
8,023 |
|
$ |
605 |
|
$ |
(78,994 |
) |
||||
Weighted shares outstanding, basic and diluted |
200,150 |
|
|
|
|
|
|
200,150 |
|
||||||||||||||||
Net loss per share, basic and diluted |
$ |
(0.93 |
) |
$ |
0.47 |
|
$ |
0.02 |
|
$ |
— |
|
$ |
0.04 |
|
$ |
0.01 |
|
$ |
(0.39 |
) |
||||
| __________________________________________________ | |
(1) |
Stock-based compensation |
(2) |
Amortization of intangible assets |
(3) |
Other |
(4) |
Amortization of debt discount and issuance costs |
(5) |
Income tax effect primarily related to stock-based compensation expense |
GAAP |
Non-GAAP Adjustments |
Non-GAAP |
||||||||||||||||||||||||||
|
Fiscal Year Ended July 31, 2020 |
(1) |
(2) |
(3) |
(4) |
(5) |
(6) |
Fiscal Year Ended July 31, 2020 |
||||||||||||||||||||
|
|
|
|
|
|
|
|
|
||||||||||||||||||||
|
(in thousands, except percentages and per share data) |
|||||||||||||||||||||||||||
Gross profit |
$ |
1,020,993 |
|
$ |
27,348 |
|
$ |
14,777 |
|
$ |
537 |
|
$ |
— |
|
$ |
— |
|
$ |
— |
|
$ |
1,063,655 |
|
||||
Gross margin |
78.1 |
% |
2.1 |
% |
1.1 |
% |
— |
|
— |
|
— |
|
— |
|
81.3 |
% |
||||||||||||
Operating expenses: |
|
|
|
|
|
|
|
|
||||||||||||||||||||
Sales and marketing |
1,160,389 |
|
(126,015 |
) |
(2,603 |
) |
— |
|
— |
|
— |
|
— |
|
1,031,771 |
|
||||||||||||
Research and development |
553,978 |
|
(153,252 |
) |
— |
|
(2,465 |
) |
— |
|
— |
|
— |
|
398,261 |
|
||||||||||||
General and administrative |
135,547 |
|
(45,383 |
) |
— |
|
— |
|
(1,499 |
) |
— |
|
— |
|
88,665 |
|
||||||||||||
Total operating expenses |
1,849,914 |
|
(324,650 |
) |
(2,603 |
) |
(2,465 |
) |
(1,499 |
) |
— |
|
— |
|
1,518,697 |
|
||||||||||||
Loss from operations |
(828,921 |
) |
351,998 |
|
17,380 |
|
3,002 |
|
1,499 |
|
— |
|
— |
|
(455,042 |
) |
||||||||||||
Net loss |
$ |
(872,883 |
) |
$ |
351,998 |
|
$ |
17,380 |
|
$ |
3,002 |
|
$ |
1,499 |
|
$ |
31,313 |
|
$ |
1,845 |
|
$ |
(465,846 |
) |
||||
Weighted shares outstanding, basic and diluted |
194,719 |
|
|
|
|
|
|
|
194,719 |
|
||||||||||||||||||
Net loss per share, basic and diluted |
$ |
(4.48 |
) |
$ |
1.80 |
|
$ |
0.09 |
|
$ |
0.02 |
|
$ |
0.01 |
|
$ |
0.16 |
|
$ |
0.01 |
|
$ |
(2.39 |
) |
||||
| __________________________________________________ | |
(1) |
Stock-based compensation |
(2) |
Amortization of intangible assets |
(3) |
Impairment of lease-related assets |
(4) |
Other |
(5) |
Amortization of debt discount and issuance costs |
(6) |
Income tax effect primarily related to stock-based compensation expense |
GAAP |
Non-GAAP Adjustments |
Non-GAAP |
|||||||||||||||||||||||
|
Three Months Ended July 31, 2019 |
(1) |
(2) |
(3) |
(4) |
(5) |
Three Months Ended July 31, 2019 |
||||||||||||||||||
|
|
|
|
|
|
|
|
||||||||||||||||||
|
(in thousands, except percentages and per share data) |
||||||||||||||||||||||||
Gross profit |
$ |
230,913 |
|
$ |
5,266 |
|
$ |
3,694 |
|
$ |
— |
|
$ |
— |
|
$ |
— |
|
$ |
239,873 |
|
||||
Gross margin |
77.0 |
% |
1.8 |
% |
1.2 |
% |
— |
|
— |
|
— |
|
80.0 |
% |
|||||||||||
Operating expenses: |
|
|
|
|
|
|
|
||||||||||||||||||
Sales and marketing |
253,843 |
|
(26,426 |
) |
(651 |
) |
— |
|
— |
|
— |
|
226,766 |
|
|||||||||||
Research and development |
129,169 |
|
(32,566 |
) |
— |
|
— |
|
— |
|
— |
|
96,603 |
|
|||||||||||
General and administrative |
30,420 |
|
(9,149 |
) |
— |
|
(156 |
) |
— |
|
— |
|
21,115 |
|
|||||||||||
Total operating expenses |
413,432 |
|
(68,141 |
) |
(651 |
) |
(156 |
) |
— |
|
— |
|
344,484 |
|
|||||||||||
Loss from operations |
(182,519 |
) |
73,407 |
|
4,345 |
|
156 |
|
— |
|
— |
|
(104,611 |
) |
|||||||||||
Net loss |
$ |
(194,338 |
) |
$ |
73,407 |
|
$ |
4,345 |
|
$ |
156 |
|
$ |
7,511 |
|
$ |
3,086 |
|
$ |
(105,833 |
) |
||||
Weighted shares outstanding, basic and diluted |
186,371 |
|
|
|
|
|
|
186,371 |
|
||||||||||||||||
Net loss per share, basic and diluted |
$ |
(1.04 |
) |
$ |
0.39 |
|
$ |
0.02 |
|
$ |
— |
|
$ |
0.04 |
|
$ |
0.02 |
|
$ |
(0.57 |
) |
||||
| __________________________________________________ | |
(1) |
Stock-based compensation |
(2) |
Amortization of intangible assets |
(3) |
Other |
(4) |
Amortization of debt discount and debt issuance costs |
(5) |
Income tax effect primarily related to stock-based compensation expense |
GAAP |
|
Non-GAAP Adjustments |
|
Non-GAAP |
|||||||||||||||||||
|
Fiscal Year Ended July 31, 2019 |
|
(1) |
(2) |
(3) |
(4) |
(5) |
|
Fiscal Year Ended July 31, 2019 |
||||||||||||||
|
|
|
|
|
|
|
|
|
|
||||||||||||||
|
(in thousands, except percentages and per share data) |
||||||||||||||||||||||
Gross profit |
$ |
932,015 |
|
|
$ |
18,861 |
|
$ |
14,248 |
|
$ |
163 |
|
$ |
— |
|
$ |
— |
|
|
$ |
965,287 |
|
Gross margin |
75.4 |
% |
|
1.5 |
% |
1.2 |
% |
— |
|
— |
|
— |
|
|
78.1 |
% |
|||||||
Operating expenses: |
|
|
|
|
|
|
|
|
|
||||||||||||||
Sales and marketing |
909,750 |
|
|
(107,751 |
) |
(2,528 |
) |
|
— |
|
|
— |
|
|
— |
|
|
799,471 |
|
||||
Research and development |
500,719 |
|
|
(140,519 |
) |
— |
|
|
— |
|
|
— |
|
|
— |
|
|
360,200 |
|
||||
General and administrative |
119,587 |
|
|
(39,598 |
) |
— |
|
(93 |
) |
|
— |
|
|
— |
|
|
79,896 |
|
|||||
Total operating expenses |
1,530,056 |
|
|
(287,868 |
) |
(2,528 |
) |
(93 |
) |
— |
|
— |
|
|
1,239,567 |
|
|||||||
Loss from operations |
(598,041 |
) |
|
306,729 |
|
16,776 |
|
256 |
|
— |
|
— |
|
|
(274,280 |
) |
|||||||
Net loss |
$ |
(621,179 |
) |
|
$ |
306,729 |
|
$ |
16,776 |
|
$ |
256 |
|
$ |
29,313 |
|
$ |
(4,752 |
) |
|
$ |
(272,857 |
) |
Weighted shares outstanding, basic and diluted |
181,031 |
|
|
|
|
|
|
|
|
181,031 |
|
||||||||||||
Net loss per share, basic and diluted |
$ |
(3.43 |
) |
|
$ |
1.70 |
|
$ |
0.09 |
|
$ |
— |
|
$ |
0.16 |
|
$ |
(0.03 |
) |
|
$ |
(1.51 |
) |
| __________________________________________________ | |
(1) |
Stock-based compensation expense |
(2) |
Amortization of intangible assets |
(3) |
Other |
(4) |
Amortization of debt discount and issuance costs |
(5) |
Income tax effect primarily related to stock-based compensation expense and the partial release of valuation allowance in connection with an acquisition and tax effect of a change in law |
Reconciliation of GAAP Net Cash (Used In) Provided by Operating Activities to Non-GAAP Free Cash Flow |
|||||||||||||||
(Unaudited) |
|||||||||||||||
|
Three Months Ended
|
|
Fiscal Year Ended
|
||||||||||||
|
2019 |
|
2020 |
|
2019 |
|
2020 |
||||||||
|
|
|
|
|
|
|
|
||||||||
|
(in thousands) |
||||||||||||||
Net cash (used in) provided by operating activities |
$ |
(9,656 |
) |
|
$ |
3,630 |
|
|
$ |
42,168 |
|
|
$ |
(159,885 |
) |
Purchases of property and equipment |
(23,637 |
) |
|
(17,415 |
) |
|
(118,452 |
) |
|
(89,488 |
) |
||||
Free cash flow |
$ |
(33,293 |
) |
|
$ |
(13,785 |
) |
|
$ |
(76,284 |
) |
|
$ |
(249,373 |
) |
View source version on businesswire.com: https://www.businesswire.com/news/home/20200827005684/en/
Investor Contact:
Shane Xie
[email protected]
Media Contact:
Jennifer Massaro
[email protected]
Source: Nutanix, Inc.