
Form N-CSR Stone Harbor Emerging For: Nov 30
UNITED STATES
SECURITIES AND EXCHANGE COMMISSION
Washington, D.C. 20549
FORM N-CSR
CERTIFIED SHAREHOLDER REPORT OF REGISTERED
MANAGEMENT INVESTMENT COMPANIES
Investment Company Act file number: 811-22473
Stone Harbor Emerging Markets Income Fund
(Exact name of registrant as specified in charter)
31 West 52nd Street, 16th Floor
New York, NY 10019
(Address of principal executive offices) (Zip code)
Adam J. Shapiro, Esq.
c/o Stone Harbor Investment Partners LP
31 West 52nd Street, 16th Floor
New York, NY 10019
(Name and address of agent for service)
With copies To:
Michael G. Doherty, Esq.
Ropes & Gray LLP
1211 Avenue of the Americas
New York, NY 10036
Registrant’s telephone number, including area code: (303) 623-2577
Date of fiscal year end: November 30
Date of reporting period: November 30, 2019
Item 1. Report to Stockholders.
Beginning on January 1, 2021, as permitted by regulations adopted by the U.S. Securities and Exchange Commission, paper copies of the Fund’s annual and semi-annual shareholder reports will no longer be sent by mail, unless you specifically request paper copies of the reports. Instead, the reports will be made available on the Fund’s website www.shiplpcef.com, and you will be notified by mail each time a report is posted and provided with a website link to access the report.
If you already elected to receive shareholder reports electronically, you will not be affected by this change and you need not take any action. You may elect to receive shareholder reports and other communications from the Fund electronically anytime by contacting your financial intermediary (such as a broker-dealer or bank) or, if you are a direct investor, by enrolling at www.shiplpcef.com.
You may elect to receive all future reports in paper free of charge. If you invest through a financial intermediary, you can contact your financial intermediary to request that you continue to receive paper copies of your shareholder reports. If you invest directly with the Fund, you can call 1-866-390-3910 to let the Fund know you wish to continue receiving paper copies of your shareholder reports. Your election to receive reports in paper will apply to all funds held in your account if you invest through your financial intermediary or all funds held with the fund complex if you invest directly with the Fund.
Distribution
Policy
November 30, 2019
Stone Harbor Emerging Markets Income Fund (the “Fund”), acting pursuant to a U.S. Securities and Exchange Commission exemptive order and with the approval of the Fund’s Board of Trustees (the “Board”), has adopted a plan, consistent with its investment objectives and policies to support a level distribution of income, capital gains and/or return of capital (the “Plan”). In accordance with the Plan, effective February 2020 the Fund will distribute $0.17 per share on a monthly basis.
The fixed amount distributed per share is subject to change at the discretion of the Fund’s Board. Under the Plan, the Fund will typically distribute most or all of its available investment income to its shareholders, consistent with its primary investment objectives and as required by the Internal Revenue Code of 1986, as amended (the “Code”). The Fund may also distribute long term capital gains and short term capital gains and return capital to shareholders in order to maintain a level distribution. Each monthly distribution to shareholders is expected to be at the fixed amount established by the Board, except for extraordinary distributions and potential distribution rate increases or decreases to enable the Fund to comply with the distribution requirements imposed by the Code. In addition, the Fund currently distributes more than its net income and net realized capital gains, and therefore, a portion of the distribution is a return of capital. A return of capital may occur, for example, when some or all of the money that a shareholder invested in the Fund is paid back to that shareholder. A return of capital distribution does not necessarily reflect the Fund’s investment performance and should not be confused with ‘yield’ or ‘income’. When distributions exceed total return performance, the difference will reduce the Fund’s net asset value per share. The amounts and sources of distributions reported to shareholders during the fiscal year are only estimates and are not provided for tax or financial reporting purposes. The actual amounts and sources of the amounts for tax or financial reporting purposes will depend upon the Fund’s investment experience during the year and are subject to change.
Shareholders should not draw any conclusions about the Fund’s investment performance from the amount of these distributions or from the terms of the Plan. The Fund’s total return performance on net asset value is presented in its financial highlights table.
The Board may amend, suspend or terminate the Fund’s Plan without prior notice if it deems such action to be in the best interest of the Fund or its shareholders. The suspension or termination of the Plan could have the effect of creating a trading discount (if the Fund’s stock is trading at or above net asset value) or widening an existing trading discount. The Fund is subject to risks that could have an adverse impact on its ability to maintain level distributions. Examples of potential risks include, but are not limited to, economic downturns impacting the markets, investments in foreign securities, foreign currency fluctuations and changes in the Code. Please refer to the Fund’s prospectus for a more complete description of its risks.
Table of Contents
| Shareholder Letter | 2 |
| Summary of Portfolio Holdings | 5 |
| Growth of $10,000 Investment | 6 |
| Report of Independent Registered Public Accounting Firm | 7 |
| Statement of Investments | 8 |
| Statement of Assets & Liabilities | 16 |
| Statement of Operations | 17 |
| Statements of Changes in Net Assets | 18 |
| Statement of Cash Flows | 19 |
| Financial Highlights | 20 |
| Notes to Financial Statements | 21 |
| Summary of Dividend Reinvestment Plan | 32 |
| Additional Information | 33 |
| Trustees & Officers | 35 |
| Benchmark Descriptions | 38 |
| Stone Harbor Emerging Markets Income Fund | Shareholder Letter |
November 30, 2019 (Unaudited)
Dear Investor,
The Stone Harbor Emerging Markets Income Fund (“EDF” or “Fund”) seeks to maximize total return, which consists of income on its investments and capital appreciation. The Fund invests in fixed income securities and related instruments that are economically tied to emerging markets (“EM”) countries, including sovereign external debt, local currency debt (non-U.S. dollar), and corporate debt from issuers domiciled in emerging markets.
Despite defaults, drought, oil price shocks and geopolitical tensions, including war, EM external sovereign debt (as represented by the JPMorgan EMBI Global Diversified Index) has delivered negative returns in only five years since 1991. By and large, EM countries have lowered debt levels and improved their fiscal positions, particularly when compared to developed countries. In addition, as gross domestic product (“GDP”) growth slows across the globe, EM countries as a whole continue to expand at a faster rate, on average, than the developed world. And yet, despite better fundamentals in most cases, EM debt offers higher yields than advanced economy debt.
We continue to believe that these factors support our investment thesis: EM bonds and currencies provide attractive returns for patient total return investors. While our investment thesis is straightforward, navigating the current macroeconomic and geopolitical environment is anything but easy. We monitor external risks while also assessing the credit quality of each of the countries and companies in which we invest. Doing so requires frequent travel, continuous and disciplined evaluation of the fundamentals, and a consistent framework for analyzing potential macroeconomic scenarios.
Over the past 12-month period, central banks successfully intervened to stabilize potentially deteriorating conditions across markets. In particular, perceived dovish comments by the Federal Reserve (“Fed”) spurred a rally in bond and stock markets in January 2019. In July, the Fed delivered the first of three rate cuts, which brought the Fed Funds target rate down to 1.75% by the third rate cut in October. This change in policy direction, coupled with indications of strength in select areas of the economy — namely, the housing sector and the labor market — helped to partially offset the negative impact from ongoing weakness, particularly in the manufacturing sector.
The Fed’s rate reductions, which were characterized as mid-cycle adjustments to protect against downside risk, dovetailed with further accommodation in Europe, China and elsewhere. In Europe, ongoing concerns about negative effects of the trade war dragged down the European manufacturing sector. The weakness in manufacturing, coupled with subdued Eurozone core inflation at just over 1% versus the European Central Bank’s (“ECB”) target of just under 2%, led the ECB to provide further support with a package that included lower policy rates, more quantitative easing (“QE”), tiering of reserves and a renewal of the targeted longer-term refinancing operations (“TLTROs”). In China, economic data were mixed, though easing measures from earlier in 2019 appeared to have helped support the economy. On the trade front, the sharp decline in exports to the U.S. was offset by increasing Chinese exports to other countries. Likewise, the global slowdown in manufacturing weighed on emerging markets, as did idiosyncratic risks stemming from political uncertainties in select countries. Nonetheless, the trend of easing monetary policy in developing countries continued throughout the reporting period. By the end of November, signs of some reconciliation between China and the U.S. began to take shape, along with suggestion of stabilization and even improvement in PMI readings.
We believe that having the latitude to adjust risk levels in the portfolio based on our fundamental economic and credit views, and according to our assessment of the macroeconomic environment, is a key advantage in managing the Fund. Our investment process focuses on allocating to three distinct sectors of EM debt — hard currency sovereign debt, local currency sovereign debt, and corporate debt — each of which tend to behave differently in various macroeconomic environments.
In addition, we can vary the amount of leverage used by the Fund, depending on our confidence in our return expectations. In general, we employ leverage to seek higher returns. However, when uncertainty rises, and with it greater perceived risks, we can also reduce leverage in order to decrease the Fund’s exposure to EM risk.
Performance Review
The total return on net asset value (NAV) and market price of EDF for the 12 months ended November 30, 2019 (net of expenses) was 4.45%(1) and 29.86%(2), respectively. For the same period, the Fund had an average premium to its NAV of 31.61%. Market tracking indices for the three sectors of EM debt(3) — hard currency sovereign debt, local currency sovereign debt, and corporate debt — delivered total returns of 14.29%, 10.39% and 12.80%, respectively, during the reporting period.
The largest driver of returns for the period was falling interest rates across both developed and emerging markets. The Fed’s loose monetary policy further pushed down global interest rates and supported growth in the U.S. for the period. On the other hand, trade uncertainty between the U.S. and China remained a headwind for markets, though there appeared to be some de-escalation of tensions between the two countries later in the reporting period.
| 2 | www.shiplpcef.com |
| Stone Harbor Emerging Markets Income Fund | Shareholder Letter |
November 30, 2019 (Unaudited)
Overall, the Fund’s local currency exposure contributed significantly to total returns during the period, led by contributions from Russia, Mexico and Egypt. In Russia, bonds rallied due to conservative interest rate policies that supported the ruble, the country’s strong balance sheet and strengthening oil prices. In Mexico, local bond markets benefitted from preliminary approval of a trade agreement between the United States, Canada and Mexico and falling yields on U.S. Treasury securities, as well as an apparent shift to pragmatism by Mexican President Andrés Manuel López Obrador. In Egypt, returns were driven by a strengthening of the Egyptian pound, which rallied during the period. Egypt has performed well under a program administered by the International Monetary Fund (“IMF”) and its ratio of long-term debt to GDP has fallen, leading to lower local rates.
The Fund’s exposure to Argentina detracted most from total returns during the period. In our view, political events drove down the price of Argentine debt. Argentina’s presidential election season began with a primary in August 2019, with the incumbent Mauricio Macri facing opposition leader Alberto Fernández in what was expected to be a tight race. Following Fernández’s unexpectedly resounding defeat of Macri in the primary, Argentine equity and bond markets fell sharply in value. In October 2019, Fernández was elected president in the general election, cementing the shift in leadership in Argentina and initiating a departure from Macri’s economic policies. Despite the volatility in Argentine bond markets, we believe that Fernández is eager to resolve the debt issue quickly. In addition, Fernández appears to have shown willingness to engage with the IMF and to set responsible fiscal targets. As a result, we believe bond recovery values will be substantially higher even in the event of a broader restructuring. The Fund continues to hold Argentine bonds. The Fund’s exposure to Brazil, Turkey and Uruguay also detracted from performance during the period, though to a lesser extent than the negative contribution from Argentina.
Asset allocation is an important decision in the management of the Fund. The Fund’s allocation to hard currency sovereign debt ranged between 48.8% and 57.6% during the reporting period, with an allocation of 52.2% as of November 30, 2019. The Fund’s allocation to local currency sovereign debt ranged between 31.0% and 40.3%, with an allocation of 37.0% as of November 30, 2019. The Fund’s allocation to corporate debt ranged between 6.2% and 12.3%, with an allocation of 10.5% as of November 30, 2019.
Throughout the reporting period, leverage consisted primarily of short-term reverse repurchase agreements through which the Fund borrowed funds by selling securities under the obligation to repurchase them at a later date at a fixed price. The implied borrowing costs of the repurchase agreements averaged approximately 2.67% per annum for the 12 months ended November 30, 2019. The level of gross leverage reached a maximum of 33.3% of managed assets on December 6, 2018 and a minimum of 0% on March 18, 2019. By the end of the reporting period, leverage was 5.78%.
Net leverage (gross leverage less cash held) remained lower than gross leverage throughout the period. The Fund’s management team varied borrowing levels to reflect the team’s outlook on EM risk, increasing borrowings when it felt opportunities had improved and reducing borrowings when, in the team’s judgment, macroeconomic risks had risen.
The Fund uses various derivative instruments to implement its strategies. These derivatives are utilized to manage the Fund’s credit risk, interest rate risk, foreign exchange risk and efficiently gain certain investment exposure. These derivative positions may increase or decrease the Fund’s exposure to these risks. At the end of the reporting period the Fund had net exposure to derivatives of approximately ($109) thousand. Over the course of the reporting period derivative positions generated net realized loss of approximately $1.2 million and $2.4 million in unrealized depreciation for a net decrease in operations of approximately $3.6 million.
Market Review and Outlook
In our base case scenario, we believe that the U.S. GDP growth rate will be approximately 1.75% in 2020. In our view, U.S./China trade tensions will continue but are likely to de-escalate. In terms of monetary policy, we believe the Fed is finished cutting interest rates for now, though we think the Fed will act decisively if the unemployment rate rises meaningfully. In Europe, we do not foresee additional easing by the ECB, though we believe that the effects of the ECB’s looser monetary policy implemented in 2019 will help growth in 2020. Growth in Japan will likely remain sluggish due to the effects of the increased value-added tax, though we believe the Japanese economy will recover somewhat in 2020.
Looking ahead, we believe that protectionist policies will remain central to macroeconomic conditions in the months ahead and will be watching for further developments between the U.S. and China. We are also closely following upcoming political events in developed markets that carry broad implications. At the time of writing, these events included uncertainty surrounding the implementation of Brexit; the risk of an early election in Germany, where the coalition looks at risk; and the Presidential election in the U.S., where the outcome remains difficult to gauge at this juncture.
In this environment, we continue to believe that many EM country growth rates will outperform developed country growth in the next 12 to 18 months. Slow growth across most of the developed world and abnormally low interest rates in select countries continue to underscore the higher yields and stronger fundamentals available in EM, in our view. In addition to solid fundamentals, we believe that EM debt assets continue to offer attractive valuations.
| Annual Report | November 30, 2019 | 3 |
| Stone Harbor Emerging Markets Income Fund | Shareholder Letter |
November 30, 2019 (Unaudited)
Despite these headwinds from advanced economies, our positive views on EM fundamentals remain intact. We continue to believe that many EM country growth rates will outperform developed country growth in the next 12 to 18 months. In addition to solid fundamentals, EM debt assets continue to offer attractive valuations, in our opinion.
In the past, we have detailed some of the key risks to our constructive outlook for EM debt. Today, those risks come from both developed and EM countries. The uncertainties surrounding ongoing trade wars and the potential for policy mistakes by developed market central banks are potential risks for EM debt investors. We anticipate that protectionist trade policies will continue to be a reality for the medium term. Geopolitical strife in the Middle East and ongoing domestic political tensions in a range of developing countries — including Chile, Ecuador and Lebanon, among others — also may increase volatility as well as opportunity in emerging markets. In assessing all these factors, our base case return scenarios for EM debt over the coming year remain positive. Our view derives from a disciplined investment process in which we review the ability and willingness of borrowers to repay their debts. We also assess whether current prices of EM bonds, currencies and local interest rates reflect adequate compensation for the risks the Fund is incurring. Based on this analysis, we continue to believe that EM debt will generate among the highest returns in the fixed income markets.
Other general risks of the Fund relate to our use of leverage and also to the longer-term prospects for a global recession, in the event that proactive monetary policies fail to offset weaker growth. Stone Harbor Investment Partners LP attempts to mitigate the risk of loss of principal due to the possibility of weaker growth, depreciating currencies and widening of bond credit spreads and yields through our investment process that determines sector and country allocations, as well as security selection. We also seek to reduce interest rate sensitivity during periods of rising interest rates. Notwithstanding these efforts, rising interest rates or wider credit spreads could increase the Fund’s cost of leverage and could also decrease the value of its portfolio securities, adversely affecting Fund performance.
We continue to believe that investing in EDF may offer an attractive means of capitalizing on further improvements in credit quality in EM. We thank you for your confidence in our ability to invest in these volatile markets and look forward to reporting on EDF in six months.
Sincerely,

Peter
J. Wilby, CFA
President
| (1) | Total return assumes the reinvestment of all distributions at NAV |
| (2) | Total return assumes the reinvestment of all distributions in additional shares in accordance with the Fund’s Dividend Reinvest Plan |
| (3) | JPMorgan EMBI Global Diversified Index, JPMorgan GBI-EM Global Diversified Index, and JPMorgan CEMBI Broad Diversified Index |
| 4 | www.shiplpcef.com |
| Stone Harbor Emerging Markets Income Fund | Summary of Portfolio Holdings |
November 30, 2019 (Unaudited)
| Fund Details | |
| Market Price | $13.18 |
| Net Asset Value (NAV) | $8.91 |
| Premium/(Discount) | 47.92% |
| Current Distribution Rate(1) | 16.39% |
| Net Assets (in millions) | $146 |
| Country Allocation | |
| (as a% of Total Net Assets)(3) | |
| Country Breakdown | % |
| Mexico | 11.07% |
| Russia | 8.73% |
| Egypt | 7.61% |
| Argentina | 7.59% |
| Brazil | 7.47% |
| Angola | 7.46% |
| Indonesia | 7.33% |
| Uruguay | 5.75% |
| Iraq | 4.53% |
| Turkey | 3.98% |
| South Africa | 3.37% |
| Ukraine | 3.25% |
| Papua New Guinea | 3.16% |
| Nigeria | 2.75% |
| Colombia | 2.75% |
| Benin | 2.39% |
| Ivory Coast | 2.03% |
| Cameroon | 1.77% |
| Ecuador | 1.43% |
| Zambia | 1.25% |
| Sri Lanka | 1.17% |
| El Salvador | 1.12% |
| Mozambique | 1.02% |
| Gabon | 0.87% |
| Kenya | 0.61% |
| Venezuela | 0.57% |
| Ghana | 0.40% |
| Dominican Republic | 0.31% |
| Lebanon | 0.31% |
| Hong Kong | 0.04% |
| Oman | 0.04% |
| Short Term Investments | 1.87% |
| Other Liabilities in Excess of Assets | -4.00% |
| Total Net Assets | 100.00% |
Security Type Allocation(2)
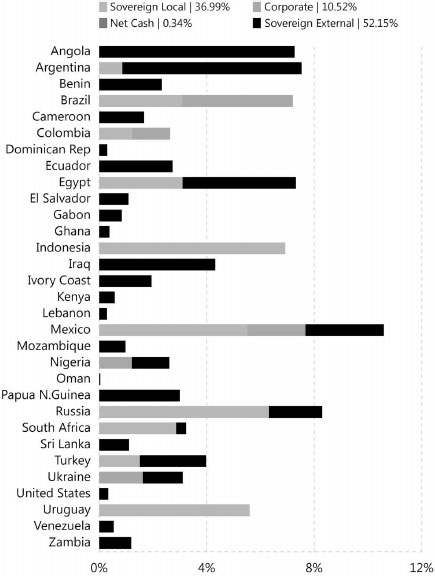
Sector Allocation(2) |
Regional Breakdown(2) |
Sovereign Local Currency Breakdown(2) |
|||||
| Sovereign Local | 36.99% | Latin America | 38.24% | Brazilian Real | 3.09% | ||
| Sovereign External | 52.15% | Africa | 30.36% | Argentine Peso | 0.86% | ||
| Corporate | 10.52% | Europe | 15.39% | Colombian Peso | 1.22% | ||
| Net Cash | 0.34% | Asia | 11.03% | Egyptian Pound | 3.10% | ||
| Middle East | 4.64% | Indonesian Rupiah | 6.92% | ||||
| Net Cash | 0.34% | Mexican Peso | 5.52% | ||||
| Russian Ruble | 6.31% | ||||||
| Turkish New Lira | 1.51% | ||||||
| South African Rand | 2.86% | ||||||
| Uruguayan Peso | 5.60% | ||||||
| Total | 36.99% |
| (1) | Current Distribution Rate is based on the Fund’s current annualized monthly distribution divided by the Fund’s current market price. The Fund’s monthly distributions to its shareholders may be comprised of ordinary income, net realized capital gains and return of capital in order to maintain a level distribution. |
| (2) | Based on managed assets and investment manager’s sector classifications including derivative exposure. For purposes of this example, managed assets include total net assets plus any borrowings attributed to the use of reverse repurchase agreements and the notional values of credit default swaps as described on pages 14 and 15. |
| (3) | Country refers to country of primary risk exposure, as determined by Stone Harbor. In certain instances, a security’s country of incorporation may be different from its country of risk. |
| Annual Report | November 30, 2019 | 5 |
| Stone Harbor Emerging Markets Income Fund | Growth of $10,000 Investment |
November 30, 2019 (Unaudited)
Comparison of Change in Value of $10,000 Investment in Stone Harbor Emerging Markets Income Fund and the JPMorgan Emerging Markets Bond Indices: JPMorgan EMBI Global Diversified Index, JPMorgan CEMBI Broad Diversified Index, and JPMorgan GBI-EM Global Diversified Index (Please refer to the Benchmark Descriptions section for detailed benchmark descriptions).
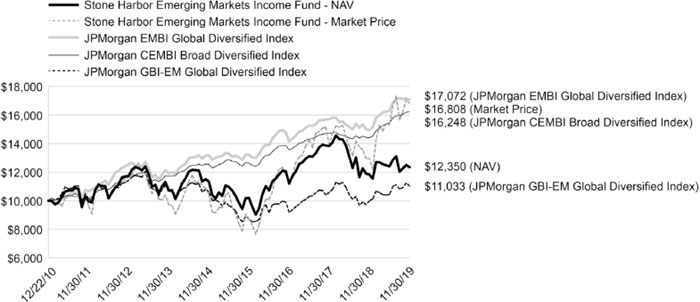
Total Returns as of November 30, 2019 (Inception Date December 22, 2010)
| Average Annual Return | ||||
| One Year | Three Year | Five Year | Since Inception | |
| Stone Harbor Emerging Markets Income Fund – NAV | 4.45% | 3.29% | 1.74% | 2.39% |
| Stone Harbor Emerging Markets Income Fund – Market Price | 29.86% | 14.49% | 10.02% | 5.98% |
| JPMorgan CEMBI Broad Diversified Index | 12.80% | 6.22% | 5.31% | 5.58% |
| JPMorgan EMBI Global Diversified Index | 14.29% | 6.45% | 5.32% | 6.17% |
| JPMorgan GBI-EM Global Diversified Index | 10.39% | 6.25% | 0.71% | 1.11% |
Past performance is no guarantee of future results. Current performance may be lower or higher than the performance shown. Total return is calculated by determining the percentage change in NAV or market price (as applicable) in the specified period. The calculation assumes that all income dividends, capital gain and return of capital distributions, if any, have been reinvested and includes all fee waivers and expense reimbursements. Total return does not reflect the deduction of taxes that a shareholder would pay on Fund distributions or broker commissions or sales charges in connection with the purchase or sale of Fund shares. Investment return and principal value will vary, and shares, when sold, may be worth more or less than their original cost. Total returns for a period of less than one year are not annualized. Index returns do not include the effects of sales charges, management fees and fund expenses or transaction costs. It is not possible to invest directly in an index.
Performance at market price will differ from its results at NAV. Although market price returns typically reflect investment results over time, during shorter periods returns at market price can also be influenced by factors such as changing views about the Fund, market conditions, supply and demand for the Fund’s shares, or changes in Fund dividends.
An investment in the Fund involves risk, including the loss of principal. Total return, market price, market price yield and NAV will fluctuate with changes in market conditions. This data is provided for information purposes only and is not intended for trading purposes. Closed-end funds, unlike open-end funds, are not continuously offered. There is a onetime public offering and once issued, shares of closed-end funds are traded in the open market through a stock exchange. NAV is equal to total assets attributable to common shareholders less total liabilities divided by the number of common shares outstanding. Holdings are subject to change daily.
| 6 | www.shiplpcef.com |
| Stone Harbor Emerging Markets Income Fund | Report of Independent Registered Public Accounting Firm |
To the shareholders and the Board of Trustees of Stone Harbor Emerging Markets Income Fund:
Opinion on the Financial Statements and Financial Highlights
We have audited the accompanying statement of assets and liabilities of Stone Harbor Emerging Markets Income Fund (the “Fund”), including the statement of investments, as of November 30, 2019, the related statements of operations and cash flows for the year then ended, the statements of changes in net assets for each of the two years in the period then ended, the financial highlights for each of the five years in the period then ended, and the related notes. In our opinion, the financial statements and financial highlights present fairly, in all material respects, the financial position of the Fund as of November 30, 2019, and the results of its operations and its cash flows for the year then ended, the changes in its net assets for each of the two years in the period then ended, and the financial highlights for each of the five years in the period then ended, in conformity with accounting principles generally accepted in the United States of America.
Basis for Opinion
These financial statements and financial highlights are the responsibility of the Fund's management. Our responsibility is to express an opinion on the Fund's financial statements and financial highlights based on our audits. We are a public accounting firm registered with the Public Company Accounting Oversight Board (United States) (PCAOB) and are required to be independent with respect to the Fund in accordance with the U.S. federal securities laws and the applicable rules and regulations of the Securities and Exchange Commission and the PCAOB.
We conducted our audits in accordance with the standards of the PCAOB. Those standards require that we plan and perform the audit to obtain reasonable assurance about whether the financial statements and financial highlights are free of material misstatement, whether due to error or fraud. The Fund is not required to have, nor were we engaged to perform, an audit of its internal control over financial reporting. As part of our audits we are required to obtain an understanding of internal control over financial reporting but not for the purpose of expressing an opinion on the effectiveness of the Fund’s internal control over financial reporting. Accordingly, we express no such opinion.
Our audits included performing procedures to assess the risks of material misstatement of the financial statements and financial highlights, whether due to error or fraud, and performing procedures that respond to those risks. Such procedures included examining, on a test basis, evidence regarding the amounts and disclosures in the financial statements and financial highlights. Our audits also included evaluating the accounting principles used and significant estimates made by management, as well as evaluating the overall presentation of the financial statements and financial highlights. Our procedures included confirmation of securities owned as of November 30, 2019, by correspondence with the custodian and brokers; when replies were not received from brokers, we performed other auditing procedures. We believe that our audits provide a reasonable basis for our opinion.

Denver, Colorado
January 27, 2020
We have served as the auditor of one or more Stone Harbor Investment Partners investment companies since 2008.
| Annual Report | November 30, 2019 | 7 |
| Stone Harbor Emerging Markets Income Fund | Statement of Investments |
November 30, 2019
| Currency | Rate | Maturity Date | Principal Amount/Shares* | Value (Expressed in USD) | ||||||||||||
| SOVEREIGN DEBT OBLIGATIONS - 80.24% | ||||||||||||||||
| Angola - 7.46% | ||||||||||||||||
| Republic of Angola: | ||||||||||||||||
| USD | 6M US L + 7.50 | % | 07/01/23 | 8,207,692 | $ | 8,874,567 | (1) | |||||||||
| USD | 6M US L + 4.50 | % | 12/07/23 | 1,557,000 | 1,560,893 | (1) | ||||||||||
| USD | 8.25 | % | 05/09/28 | 454,000 | 464,924 | (2)(3) | ||||||||||
| 10,900,384 | ||||||||||||||||
| Argentina - 7.59% | ||||||||||||||||
| Argent Letras Del Tesoro | ARS | 0.00 | % | 02/26/20 | 140,805,000 | 1,344,665 | (4) | |||||||||
| Provincia Del Chaco | USD | 9.38 | % | 08/18/24 | 1,107,000 | 459,405 | (2) | |||||||||
| Republic of Argentina: | ||||||||||||||||
| USD | 6.88 | % | 04/22/21 | 1,414,000 | 641,382 | |||||||||||
| EUR | 3.38 | % | 01/15/23 | 832,000 | 347,341 | |||||||||||
| EUR | 7.82 | % | 12/31/33 | 15,413,738 | 8,086,575 | |||||||||||
| EUR | 3.38 | % | 12/31/38 | 509,052 | 216,776 | (5) | ||||||||||
| 11,096,144 | ||||||||||||||||
| Benin - 2.39% | ||||||||||||||||
| Republic of Benin | EUR | 5.75 | % | 03/26/26 | 3,053,000 | 3,498,331 | (6) | |||||||||
| Brazil - 3.17% | ||||||||||||||||
| Nota Do Tesouro Nacional: | ||||||||||||||||
| BRL | 10.00 | % | 01/01/21 | 10,160,000 | 2,529,938 | |||||||||||
| BRL | 10.00 | % | 01/01/27 | 4,210,000 | 1,165,783 | |||||||||||
| BRL | 10.00 | % | 01/01/29 | 3,340,000 | 943,817 | |||||||||||
| 4,639,538 | ||||||||||||||||
| Cameroon - 1.77% | ||||||||||||||||
| Republic of Cameroon | USD | 9.50 | % | 11/19/25 | 2,359,000 | 2,588,634 | (6) | |||||||||
| Colombia - 0.71% | ||||||||||||||||
| Titulos De Tesoreria | COP | 6.00 | % | 04/28/28 | 3,730,000,000 | 1,043,770 | ||||||||||
| Dominican Republic - 0.31% | ||||||||||||||||
| Dominican Republic | USD | 6.88 | % | 01/29/26 | 400,000 | 453,375 | (2)(3) | |||||||||
| Ecuador - 1.04% | ||||||||||||||||
| Republic of Ecuador: | ||||||||||||||||
| USD | 7.88 | % | 03/27/25 | 548,000 | 435,147 | (2) | ||||||||||
| USD | 7.88 | % | 03/27/25 | 580,000 | 460,556 | (6) | ||||||||||
| USD | 9.63 | % | 06/02/27 | 552,000 | 455,400 | (6) | ||||||||||
| USD | 9.50 | % | 03/27/30 | 200,000 | 165,500 | (6) | ||||||||||
| 1,516,603 | ||||||||||||||||
| Egypt - 7.61% | ||||||||||||||||
| Egypt Government Bond | EGP | 15.60 | % | 08/06/26 | 34,650,000 | 2,307,837 | ||||||||||
| Egypt Treasury Bill | EGP | 0.00 | % | 03/10/20 | 40,700,000 | 2,428,114 | (4) | |||||||||
See Notes to Financial Statements.
| 8 | www.shiplpcef.com |
| Stone Harbor Emerging Markets Income Fund | Statement of Investments |
November 30, 2019
| Currency | Rate | Maturity Date | Principal Amount/Shares* | Value (Expressed in USD) | ||||||||||||
| Egypt (continued) | ||||||||||||||||
| Republic of Egypt: | ||||||||||||||||
| EUR | 5.63 | % | 04/16/30 | 1,249,000 | $ | 1,381,517 | (6) | |||||||||
| EUR | 6.38 | % | 04/11/31 | 3,031,000 | 3,488,776 | (6) | ||||||||||
| USD | 8.50 | % | 01/31/47 | 325,000 | 345,312 | (6) | ||||||||||
| USD | 8.50 | % | 01/31/47 | 395,000 | 419,688 | (2) | ||||||||||
| USD | 8.15 | % | 11/20/59 | 731,000 | 749,275 | (3)(6) | ||||||||||
| 11,120,519 | ||||||||||||||||
| El Salvador - 1.12% | ||||||||||||||||
| Republic of El Salvador | USD | 7.65 | % | 06/15/35 | 1,513,000 | 1,643,260 | (2)(3) | |||||||||
| Gabon - 0.87% | ||||||||||||||||
| Republic of Gabon | USD | 6.95 | % | 06/16/25 | 1,248,000 | 1,267,500 | (3)(6) | |||||||||
| Ghana - 0.40% | ||||||||||||||||
| Republic of Ghana: | ||||||||||||||||
| USD | 8.13 | % | 01/18/26 | 424,000 | 448,446 | (6) | ||||||||||
| USD | 8.63 | % | 06/16/49 | 8,000 | 7,748 | (6) | ||||||||||
| USD | 8.95 | % | 03/26/51 | 128,000 | 125,960 | (6) | ||||||||||
| 582,154 | ||||||||||||||||
| Indonesia - 7.33% | ||||||||||||||||
| Republic of Indonesia: | ||||||||||||||||
| IDR | 8.25 | % | 05/15/36 | 107,190,000,000 | 8,017,402 | |||||||||||
| IDR | 7.50 | % | 05/15/38 | 38,650,000,000 | 2,705,911 | |||||||||||
| 10,723,313 | ||||||||||||||||
| Ivory Coast - 2.03% | ||||||||||||||||
| Ivory Coast Government: | ||||||||||||||||
| EUR | 5.88 | % | 10/17/31 | 1,503,000 | 1,674,627 | (6) | ||||||||||
| USD | 6.13 | % | 06/15/33 | 602,000 | 591,089 | (2) | ||||||||||
| USD | 6.13 | % | 06/15/33 | 712,000 | 699,095 | (6) | ||||||||||
| 2,964,811 | ||||||||||||||||
| Kenya - 0.61% | ||||||||||||||||
| Republic of Kenya | USD | 8.00 | % | 05/22/32 | 844,000 | 893,453 | (3)(6) | |||||||||
| Lebanon - 0.31% | ||||||||||||||||
| Lebanese Republic: | ||||||||||||||||
| USD | 6.40 | % | 05/26/23 | 691,000 | 319,695 | |||||||||||
| USD | 6.85 | % | 05/25/29 | 275,000 | 125,813 | |||||||||||
| 445,508 | ||||||||||||||||
| Mexico - 4.39% | ||||||||||||||||
| Mexican Bonos: | ||||||||||||||||
| MXN | 5.75 | % | 03/05/26 | 38,940,000 | 1,867,046 | |||||||||||
| MXN | 7.50 | % | 06/03/27 | 86,890,000 | 4,558,007 | |||||||||||
| 6,425,053 | ||||||||||||||||
See Notes to Financial Statements.
| Annual Report | November 30, 2019 | 9 |
| Stone Harbor Emerging Markets Income Fund | Statement of Investments |
November 30, 2019
| Currency | Rate | Maturity Date | Principal Amount/Shares* | Value (Expressed in USD) | ||||||||||||
| Mozambique - 1.02% | ||||||||||||||||
| Republic of Mozambique | USD | 5.00 | % | 09/15/31 | 1,634,000 | $ | 1,495,110 | (6) | ||||||||
| Nigeria - 1.48% | ||||||||||||||||
| Republic of Nigeria | USD | 7.63 | % | 11/28/47 | 2,293,000 | 2,169,393 | (2) | |||||||||
| Oman - 0.04% | ||||||||||||||||
| Oman Government | USD | 5.63 | % | 01/17/28 | 54,000 | 54,270 | (6) | |||||||||
| Papua New Guinea - 3.16% | ||||||||||||||||
| Papua New Guinea Government: | ||||||||||||||||
| USD | 8.38 | % | 10/04/28 | 2,330,000 | 2,479,630 | (3)(6) | ||||||||||
| USD | 8.38 | % | 10/04/28 | 2,004,000 | 2,132,694 | (2)(3) | ||||||||||
| 4,612,324 | ||||||||||||||||
| Russia - 8.73% | ||||||||||||||||
| Russian Federation: | ||||||||||||||||
| RUB | 8.50 | % | 09/17/31 | 532,559,000 | 9,697,820 | |||||||||||
| USD | 5.10 | % | 03/28/35 | 2,600,000 | 3,069,300 | (2) | ||||||||||
| 12,767,120 | ||||||||||||||||
| South Africa - 3.37% | ||||||||||||||||
| Republic of South Africa: | ||||||||||||||||
| ZAR | 8.75 | % | 02/28/48 | 73,500,000 | 4,334,052 | |||||||||||
| USD | 5.75 | % | 09/30/49 | 614,000 | 587,791 | |||||||||||
| 4,921,843 | ||||||||||||||||
| Sri Lanka - 1.17% | ||||||||||||||||
| Republic of Sri Lanka | USD | 5.75 | % | 04/18/23 | 1,750,000 | 1,711,994 | (3)(6) | |||||||||
| Turkey - 3.98% | ||||||||||||||||
| International Finance Corp. | TRY | 20.00 | % | 01/22/20 | 11,450,000 | 2,009,129 | ||||||||||
| Republic of Turkey: | ||||||||||||||||
| USD | 5.75 | % | 03/22/24 | 450,000 | 457,875 | |||||||||||
| USD | 6.00 | % | 03/25/27 | 758,000 | 755,631 | |||||||||||
| USD | 5.75 | % | 05/11/47 | 3,035,000 | 2,604,884 | |||||||||||
| 5,827,519 | ||||||||||||||||
| Ukraine - 0.99% | ||||||||||||||||
| Ukraine Government | USD | 7.75 | % | 09/01/26 | 225,000 | 238,050 | (2) | |||||||||
| Ukreximbank Via Biz Finance PLC | USD | 9.75 | % | 01/22/25 | 1,150,000 | 1,213,250 | (2) | |||||||||
| 1,451,300 | ||||||||||||||||
| Uruguay - 5.75% | ||||||||||||||||
| Republic of Uruguay | UYU | 4.38 | % | 12/15/28 | 61,000,000 | 3,180,512 | ||||||||||
See Notes to Financial Statements.
| 10 | www.shiplpcef.com |
| Stone Harbor Emerging Markets Income Fund | Statement of Investments |
November 30, 2019
| Currency | Rate | Maturity Date | Principal Amount/Shares* | Value (Expressed in USD) | ||||||||||||
| Uruguay (continued) | ||||||||||||||||
| Uruguay Notas del Teso | UYU | 13.90 | % | 07/29/20 | 192,000,000 | $ | 5,220,797 | |||||||||
| 8,401,309 | ||||||||||||||||
| Venezuela - 0.19% | ||||||||||||||||
| Republic of Venezuela | USD | 9.00 | % | 05/07/23 | 2,250,000 | 281,250 | (7) | |||||||||
| Zambia - 1.25% | ||||||||||||||||
| Republic of Zambia: | ||||||||||||||||
| USD | 5.38 | % | 09/20/22 | 425,000 | 270,605 | (6) | ||||||||||
| USD | 5.38 | % | 09/20/22 | 1,457,000 | 927,699 | (2) | ||||||||||
| USD | 8.50 | % | 04/14/24 | 966,000 | 628,957 | (6) | ||||||||||
| 1,827,261 | ||||||||||||||||
| TOTAL SOVEREIGN DEBT OBLIGATIONS | 117,323,043 | |||||||||||||||
| (Cost $121,112,718) | ||||||||||||||||
| CORPORATE BONDS - 17.32% | ||||||||||||||||
| Brazil - 4.30% | ||||||||||||||||
| Banco do Brasil SA | USD | 9.00 | % | Perpetual | 1,150,000 | 1,310,102 | (1)(6)(8) | |||||||||
| Gol Finance SA | USD | 7.00 | % | 01/31/25 | 2,344,000 | 2,359,749 | (6) | |||||||||
| JSL Europe SA | USD | 7.75 | % | 07/26/24 | 750,000 | 806,062 | (6) | |||||||||
| MV24 Capital BV | USD | 6.75 | % | 06/01/34 | 1,750,000 | 1,809,762 | (6) | |||||||||
| 6,285,675 | ||||||||||||||||
| Colombia - 2.04% | ||||||||||||||||
| AI Candelaria Spain SLU | USD | 7.50 | % | 12/15/28 | 1,250,000 | 1,372,194 | (6) | |||||||||
| Empresas Publicas de Medellin ESP | COP | 7.63 | % | 09/10/24 | 2,700,000,000 | 808,668 | (2) | |||||||||
| Gran Tierra Energy, Inc. | USD | 7.75 | % | 05/23/27 | 883,000 | 795,804 | (6) | |||||||||
| 2,976,666 | ||||||||||||||||
| Ecuador - 0.39% | ||||||||||||||||
| Petroamazonas EP | USD | 4.63 | % | 02/16/20 | 584,500 | 573,950 | (6) | |||||||||
| Indonesia - 0.00%(9) | ||||||||||||||||
| PT Bakrie & Brothers TBK | IDR | 0.00 | % | 12/22/22 | 27,175,847,000 | 198 | (4)(10) | |||||||||
| Mexico - 6.68% | ||||||||||||||||
| Banco Mercantil del Norte SA/Grand Cayman: | ||||||||||||||||
| USD | 6.75 | % | Perpetual | 1,010,000 | 1,041,878 | (1)(6)(8) | ||||||||||
| USD | 7.50 | % | Perpetual | 673,000 | 711,698 | (1)(6)(8) | ||||||||||
| Petroleos Mexicanos: | ||||||||||||||||
| MXN | 7.65 | % | 11/24/21 | 19,300,000 | 959,183 | (2) | ||||||||||
| MXN | 7.47 | % | 11/12/26 | 23,050,000 | 1,021,079 | |||||||||||
| USD | 5.35 | % | 02/12/28 | 1,502,000 | 1,458,442 | |||||||||||
| USD | 6.50 | % | 01/23/29 | 443,000 | 456,467 | |||||||||||
| USD | 6.84 | % | 01/23/30 | 892,000 | 937,492 | (6) | ||||||||||
| USD | 7.69 | % | 01/23/50 | 1,507,000 | 1,619,272 | (6) | ||||||||||
| Sixsigma Networks Mexico SA de CV | USD | 7.50 | % | 05/02/25 | 1,541,000 | 1,553,039 | (6) | |||||||||
| 9,758,550 | ||||||||||||||||
See Notes to Financial Statements.
| Annual Report | November 30, 2019 | 11 |
| Stone Harbor Emerging Markets Income Fund | Statement of Investments |
November 30, 2019
| Currency | Rate | Maturity Date | Principal Amount/Shares* | Value (Expressed in USD) | ||||||||||||
| Nigeria - 1.27% | ||||||||||||||||
| IHS Netherlands Holdco BV | USD | 8.00 | % | 09/18/27 | 1,745,000 | $ | 1,858,425 | (6) | ||||||||
| Ukraine - 2.26% | ||||||||||||||||
| Metinvest BV: | ||||||||||||||||
| USD | 7.75 | % | 04/23/23 | 593,000 | 615,386 | (6) | ||||||||||
| USD | 7.75 | % | 10/17/29 | 1,895,000 | 1,871,312 | (6) | ||||||||||
| NAK Naftogaz Ukraine via Kondor Finance PLC | USD | 7.63 | % | 11/08/26 | 829,000 | 820,254 | (6) | |||||||||
| 3,306,952 | ||||||||||||||||
| Venezuela - 0.38% | ||||||||||||||||
| Petroleos de Venezuela SA: | ||||||||||||||||
| USD | 6.00 | % | 11/15/26 | 2,550,000 | 210,375 | (2)(7) | ||||||||||
| USD | 9.75 | % | 05/17/35 | 4,200,000 | 346,500 | (2)(7) | ||||||||||
| 556,875 | ||||||||||||||||
| TOTAL CORPORATE BONDS | 25,317,291 | |||||||||||||||
| (Cost $25,898,107) | ||||||||||||||||
| CREDIT LINKED NOTES - 4.53% | ||||||||||||||||
| Iraq - 4.53% | ||||||||||||||||
| Republic of Iraq (Counterparty: Bank of America - Merrill Lynch): | ||||||||||||||||
| JPY | 2.89 | % | 01/01/28 | 837,643,291 | 6,283,473 | (1)(10) | ||||||||||
| JPY | 0.00 | % | 01/01/28 | 46,326,878 | 346,668 | (4)(10) | ||||||||||
| 6,630,141 | ||||||||||||||||
| TOTAL CREDIT LINKED NOTES | 6,630,141 | |||||||||||||||
| (Cost $8,552,496) | ||||||||||||||||
| Contracts | Currency | Exercise Price | Expiration Date | Notional Amount | Value (Expressed in USD) | |||||||||||||||
| PURCHASED OPTIONS - 0.04% | ||||||||||||||||||||
| Foreign Currency Call Option - 0.04% | ||||||||||||||||||||
| Hong Kong Dollar (Goldman Sachs) | 3,559,357 | USD | 7.86 | 9/1/2020 | 3,559,357 | 15,555 | ||||||||||||||
| Hong Kong Dollar (Goldman Sachs) | 8,542,456 | USD | 7.86 | 9/1/2020 | 8,542,456 | 38,091 | ||||||||||||||
| TOTAL PURCHASED OPTIONS | 53,646 | |||||||||||||||||||
| (Cost $117,104) | ||||||||||||||||||||
See Notes to Financial Statements.
| 12 | www.shiplpcef.com |
| Stone Harbor Emerging Markets Income Fund | Statement of Investments |
November 30, 2019
| Currency | Rate | Maturity Date | Principal Amount/Shares* | Value (Expressed in USD) | ||||||||||||
| SHORT TERM INVESTMENTS - 1.87% | ||||||||||||||||
| Money Market Fund - 1.87% | ||||||||||||||||
| State Street Institutional Liquid Reserves Fund - Institutional Class (7-Day Yield) | USD | 1.76 | % | N/A | 2,739,137 | $ | 2,739,411 | |||||||||
| TOTAL SHORT TERM INVESTMENTS | 2,739,411 | |||||||||||||||
| (Cost $2,739,461) | ||||||||||||||||
| Total Investments - 104.00% | 152,063,532 | |||||||||||||||
| (Cost $158,419,886) | ||||||||||||||||
| Liabilities in Excess of Other Assets - (4.00)% | (5,850,327 | ) | ||||||||||||||
| Net Assets - 100.00% | $ | 146,213,205 | ||||||||||||||
| * | The principal amount/shares of each security is stated in the currency in which the security is denominated. |
Currency Abbreviations:
| ARS | - | Argentine Peso |
| BRL | - | Brazilian Real |
| COP | - | Colombian Peso |
| EGP | - | Egyptian Pound |
| EUR | - | Euro Currency |
| IDR | - | Indonesian Rupiah |
| JPY | - | Japanese Yen |
| MXN | - | Mexican Peso |
| RUB | - | Russian Ruble |
| TRY | - | New Turkish Lira |
| USD | - | United States Dollar |
| UYU | - | Uruguayan Peso |
| ZAR | - | South African Rand |
See Notes to Financial Statements.
| Annual Report | November 30, 2019 | 13 |
| Stone Harbor Emerging Markets Income Fund | Statement of Investments |
November 30, 2019
Investment Abbreviations:
LIBOR - London Interbank Offered Rate
Libor Rates:
6M US L - 6 Month LIBOR as of November 30, 2019 was 1.90%
| (1) | Floating or variable rate security. The reference rate is described above. The rate in effect as of November 30, 2019 is based on the reference rate plus the displayed spread as of the security's last reset date. Certain variable rate securities are not based on a published reference rate and spread but are determined by the issuer or agent and are based on current market conditions. These securities do not indicate a reference rate and spread in their description. |
| (2) | Securities were originally issued pursuant to Regulation S under the Securities Act of 1933, which exempts securities offered and sold outside of the United States from registration. Such securities cannot be sold in the United States without either an effective registration statement filed pursuant to the Securities Act of 1933, or pursuant to an exemption from registration. As of November 30, 2019, the aggregate fair value of those securities was $16,542,000, which represents approximately 11.31% of net assets. |
| (3) | On November 30, 2019, securities valued at $10,967,239 were pledged as collateral for reverse repurchase agreements. |
| (4) | Issued with a zero coupon. Income is recognized through the accretion of discount. |
| (5) | Step bond. Coupon changes periodically based upon a predetermined schedule. Interest rate disclosed is that which is in effect as of November 30, 2019. |
| (6) | Security exempt from registration under Rule 144A of the Securities Act of 1933. Such securities may normally be sold to qualified institutional buyers in transactions exempt from registration. Total fair value of Rule 144A securities amounts to $44,947,075, which represents approximately 30.74% of net assets as of November 30, 2019. |
| (7) | Security is in default and therefore is non-income producing. |
| (8) | Security has no contractual maturity date, is not redeemable and contractually pays an indefinite stream of interest. |
| (9) | Amount represents less than 0.005% of net assets. |
| (10) | The level 3 assets were valued using significant unobservable inputs as a result of unavailable quoted prices from an active market or the unavailability of other significant observable inputs. |
OUTSTANDING FORWARD FOREIGN CURRENCY CONTRACTS
| Counterparty | Settlement Date | Fund Receiving | U.S. $ Value at November 30, 2019 | Fund Delivering | U.S. $ Value at November 30, 2019 | Unrealized Appreciation/ (Depreciation) | ||||||||||||||
| Goldman Sachs & Co. | 01/24/20 | USD | 3,120,082 | MXN | 3,094,598 | 25,484 | ||||||||||||||
| J.P. Morgan Chase & Co. | 01/03/20 | BRL | 5,205,533 | USD | 5,177,367 | 28,166 | ||||||||||||||
| J.P. Morgan Chase & Co. | 01/24/20 | USD | 6,972,087 | JPY | 6,845,294 | 126,793 | ||||||||||||||
| $ | 180,443 | |||||||||||||||||||
| Goldman Sachs & Co. | 12/20/19 | COP | 768,591 | USD | 777,877 | (9,286 | ) | |||||||||||||
| J.P. Morgan Chase & Co. | 12/03/19 | BRL | 5,214,115 | USD | 5,528,633 | (314,518 | ) | |||||||||||||
| J.P. Morgan Chase & Co. | 12/03/19 | USD | 5,185,577 | BRL | 5,214,115 | (28,538 | ) | |||||||||||||
| $ | (352,342 | ) | ||||||||||||||||||
REVERSE REPURCHASE AGREEMENTS
| Counterparty | Interest Rate | Acquisition Date | Maturity Date | Amount | |||||||
| Credit Suisse First Boston | 2.100% | 10/31/2019 | 11/01/2020 | $ | 3,304,999 | ||||||
| Credit Suisse First Boston | 2.100% | 11/05/2019 | 11/06/2020 | 1,374,388 | |||||||
| Credit Suisse First Boston | 2.100% | 11/19/2019 | 11/20/2020 | 2,028,258 | |||||||
| Credit Suisse First Boston | 2.000% | 11/20/2019 | 11/21/2020 | 592,266 | |||||||
| Credit Suisse First Boston | 2.100% | 11/21/2019 | 11/22/2020 | 1,306,808 | |||||||
| Credit Suisse First Boston | 2.000% | 11/25/2019 | 11/26/2020 | 368,800 | |||||||
| $ | 8,975,519 | ||||||||||
All agreements can be terminated by either party on demand at value plus accrued interest.
See Notes to Financial Statements.
| 14 | www.shiplpcef.com |
| Stone Harbor Emerging Markets Income Fund | Statement of Investments |
November 30, 2019
CREDIT DEFAULT SWAP CONTRACTS ON SOVEREIGN DEBT OBLIGATIONS ISSUE - SELL PROTECTION (OVER THE COUNTER)(1)
Reference Obligations | Counterparty | Fixed Deal Receive Rate | Currency | Maturity Date | Implied Credit Spread at November 30, 2019(2) | Notional Amount**(3) | Value | Upfront Premiums Received/(Paid) | Unrealized Appreciation | ||||||||||||||||||
| Republic of Ecuador CDS SR 1Y(4) | Credit Suisse | 5.000% | USD | 12/20/2019 | 15.185% | 2,100,000 | $ | (12,368 | ) | $ | 39,456 | $ | 27,088 | ||||||||||||||
| $ | (12,368 | ) | $ | 39,456 | $ | 27,088 | |||||||||||||||||||||
Credit default swaps pay quarterly.
| ** | The notional amount of each security is stated in the currency in which the security is denominated. |
| (1) | If the Fund is a seller of protection and a credit event occurs, as defined under the terms of that particular swap agreement, the Fund will either (i) pay to the buyer of protection an amount equal to the notional amount of the swap and take delivery of the referenced obligation or underlying securities comprising the referenced index or (ii) pay a net settlement amount in the form of cash or securities equal to the notional amount of the swap less the recovery value of the referenced obligation or underlying securities comprising the referenced index. |
| (2) | Implied credit spreads, represented in absolute terms, are utilized in determining the market value of credit default swap agreements on sovereign issues of an emerging country as of period end, and serve as an indicator of the current status of the payment/performance risk and represent the likelihood or risk of default for the credit derivative. The implied credit spread of a particular referenced entity reflects the cost of buying/selling protection and may include upfront payments required to be made to enter into the agreement. Wider credit spreads represent a deterioration of the referenced entity’s credit soundness and a greater likelihood or risk of default or other credit event occurring as defined under the terms of the agreement. |
| (3) | The maximum potential amount the Fund could be required to pay as a seller of credit protection or receive as a buyer of credit protection if a credit event occurs as defined under the terms of that particular swap agreement. |
| (4) | Based on Republic of Ecuador Sovereign Debt Obligation, USD denominated 7.88% fixed coupon, 01/23/2028 maturity. |
See Notes to Financial Statements.
| Annual Report | November 30, 2019 | 15 |
| Stone Harbor Emerging Markets Income Fund | Statement of Assets & Liabilities |
November 30, 2019
| ASSETS: | ||||
| Investments, at value(1) | $ | 152,063,532 | ||
| Cash | 381,357 | |||
| Foreign currency, at value (Cost $650) | 571 | |||
| Unrealized appreciation on credit default swap contracts | 27,088 | |||
| Unrealized appreciation on forward foreign currency contracts | 180,443 | |||
| Receivable for investments sold | 114,798 | |||
| Receivable on credit default swap contracts | 21,160 | |||
| Interest receivable | 3,687,482 | |||
| Prepaid and other assets | 2,196 | |||
| Total Assets | 156,478,627 | |||
| LIABILITIES: | ||||
| Payable for reverse repurchase agreements | 8,975,519 | |||
| Interest payable on reverse repurchase agreements | 10,207 | |||
| Swap premium received | 39,456 | |||
| Payable for investments purchased | 526,600 | |||
| Unrealized depreciation on forward foreign currency contracts | 352,342 | |||
| Payable to adviser | 127,915 | |||
| Payable to administrator | 49,770 | |||
| Other payables | 183,613 | |||
| Total Liabilities | 10,265,422 | |||
| Net Assets | $ | 146,213,205 | ||
| NET ASSETS CONSIST OF: | ||||
| Paid-in capital | $ | 254,722,133 | ||
| Total distributable earnings | (108,508,928 | ) | ||
| Net Assets | $ | 146,213,205 | ||
| PRICING OF SHARES: | ||||
| Net Assets | $ | 146,213,205 | ||
| Shares of beneficial interest outstanding (unlimited number of shares, par value of $0.001 per share authorized) | 16,402,095 | |||
| Net assets value, offering and redemption price per share | $ | 8.91 | ||
| (1) Cost of Investments | $ | 158,419,886 | ||
See Notes to Financial Statements.
| 16 | www.shiplpcef.com |
| Stone Harbor Emerging Markets Income Fund | Statement of Operations |
For the Year Ended November 30, 2019
| INVESTMENT INCOME: | ||||
| Interest (net of foreign withholding tax of $121,301) | $ | 17,716,717 | ||
| Total Investment Income | 17,716,717 | |||
| EXPENSES: | ||||
| Investment advisory fees | 1,836,489 | |||
| Interest on reverse repurchase agreements | 613,619 | |||
| Administration fees | 286,477 | |||
| Custodian fees | 49,117 | |||
| Professional fees | 181,139 | |||
| Printing fees | 108,594 | |||
| Trustee fees | 29,324 | |||
| Transfer agent fees | 20,411 | |||
| Insurance fees | 6,452 | |||
| Other | 78,024 | |||
| Total Expenses | 3,209,646 | |||
| Net Investment Income | 14,507,071 | |||
| REALIZED AND UNREALIZED GAIN/(LOSS) ON INVESTMENTS: | ||||
| Net realized gain/(loss) on: | ||||
| Investments | (18,842,591 | ) | ||
| Credit default swap contracts | 191,178 | |||
| Interest rate swap contracts | (978,082 | ) | ||
| Forward foreign currency contracts | (413,140 | ) | ||
| Foreign currency transactions | (550,515 | ) | ||
| Net realized loss | (20,593,150 | ) | ||
| Net change in unrealized appreciation/(depreciation) on: | ||||
| Investments | 15,950,576 | |||
| Credit default swap contracts | (2,660 | ) | ||
| Interest rate swap contracts | (2,127,878 | ) | ||
| Forward foreign currency contracts | (236,894 | ) | ||
| Translation of assets and liabilities denominated in foreign currencies | (50,246 | ) | ||
| Net change in unrealized appreciation | 13,532,898 | |||
| Net Realized and Unrealized Loss on Investments | (7,060,252 | ) | ||
| Net Increase in Net Assets Resulting from Operations | $ | 7,446,819 | ||
See Notes to Financial Statements.
| Annual Report | November 30, 2019 | 17 |
| Stone Harbor Emerging Markets Income Fund | Statements of Changes in Net Assets |
For the Year Ended November 30, 2019 | For the Year Ended November 30, 2018 | |||||||
| OPERATIONS: | ||||||||
| Net investment income | $ | 14,507,071 | $ | 18,173,072 | ||||
| Net realized loss | (20,593,150 | ) | (24,851,663 | ) | ||||
| Net change in unrealized appreciation/(depreciation) | 13,532,898 | (24,537,613 | ) | |||||
| Net increase/(decrease) in net assets resulting from operations | 7,446,819 | (31,216,204 | ) | |||||
| DISTRIBUTIONS TO SHAREHOLDERS: | ||||||||
| From distributable earnings | (12,330,480 | ) | (6,798,725 | ) | ||||
| From tax return of capital | (22,810,192 | ) | (27,881,362 | ) | ||||
| Net decrease in net assets from distributions to shareholders | (35,140,672 | ) | (34,680,087 | ) | ||||
| Value of common shares issued to stockholders from reinvestment of dividends | 2,914,559 | 2,608,149 | ||||||
| Net increase in net assets from capital share transactions | 2,914,559 | 2,608,149 | ||||||
| Net Decrease in Net Assets | (24,779,294 | ) | (63,288,142 | ) | ||||
| NET ASSETS: | ||||||||
| Beginning of year | 170,992,499 | 234,280,641 | ||||||
| End of year | $ | 146,213,205 | $ | 170,992,499 | ||||
| OTHER INFORMATION: | ||||||||
| Share Transactions: | ||||||||
| Beginning shares | 16,168,916 | 15,973,492 | ||||||
| Shares issued as reinvestment of dividends | 233,179 | 195,424 | ||||||
| Shares outstanding - end of year | 16,402,095 | 16,168,916 | ||||||
See Notes to Financial Statements.
| 18 | www.shiplpcef.com |
| Stone Harbor Emerging Markets Income Fund | Statement of Cash Flows |
For the Year Ended November 30, 2019
| CASH FLOWS FROM OPERATING ACTIVITIES: | ||||
| Net increase in net assets from operations | $ | 7,446,819 | ||
| Purchase of investment securities | (177,283,009 | ) | ||
| Proceeds from disposition of investment securities | 262,240,277 | |||
| Net sales of short-term investment securities | 10,573,755 | |||
| Net amortization of discounts, accretion of premiums and inflation income | (3,390,835 | ) | ||
| Net realized (gain)/loss on: | ||||
| Investments | 18,842,591 | |||
| Net change in unrealized (appreciation)/depreciation on: | ||||
| Investments | (15,950,576 | ) | ||
| Credit default swap contracts | 2,660 | |||
| Forward foreign currency contracts | 236,894 | |||
| Decrease in interest receivable | 1,976,868 | |||
| Increase in receivable on credit default swap contracts | (160 | ) | ||
| Increase in prepaid and other assets | (22 | ) | ||
| Decrease in payable due to brokers for forward foreign currency contracts | (20,000 | ) | ||
| Decrease in variation margin payable on interest rate swap contracts | (109,791 | ) | ||
| Decrease in payable to adviser | (85,137 | ) | ||
| Increase in payable to administrator | 13,608 | |||
| Increase in other payables | 38,045 | |||
| Decrease in interest payable on reverse repurchase agreements | (446,763 | ) | ||
| Net cash provided by operating activities | 104,085,224 | |||
| CASH FLOWS FROM FINANCING ACTIVITIES: | ||||
| Cash receipts from reverse repurchase agreements | 277,820,892 | |||
| Cash payments for reverse repurchase agreements | (353,532,357 | ) | ||
| Cash distributions paid | (32,226,113 | ) | ||
| Cash payments for borrowings from bank overdraft | (1,586,293 | ) | ||
| Net cash used in financing activities | (109,523,871 | ) | ||
| Net decrease in restricted cash and unrestricted cash | (5,438,647 | ) | ||
| Restricted and unrestricted cash, beginning balance | 5,820,575 | |||
| Restricted and unrestricted cash, ending balance | $ | 381,928 | ||
| SUPPLEMENTAL DISCLOSURE OF CASH FLOW INFORMATION: | ||||
| Cash paid during the period for interest expense on reverse repurchase agreements: | $ | 1,060,382 | ||
| Non-cash financing activities not included herein consist of reinvestment of dividends and distributions of: | $ | 2,914,559 | ||
| RECONCILIATION OF RESTRICTED AND UNRESTRICTED CASH AT THE BEGINNING OF PERIOD TO THE STATEMENT OF ASSETS AND LIABILITIES | ||||
| Deposits with broker | ||||
| Interest rate swap contracts | 1,943,575 | |||
| Reverse repurchase agreements | 3,877,000 | |||
| RECONCILIATION OF RESTRICTED AND UNRESTRICTED CASH AT THE END OF PERIOD TO THE STATEMENT OF ASSETS AND LIABILITIES | ||||
| Cash | 381,357 | |||
| Foreign currency | 571 | |||
See Notes to Financial Statements.
| Annual Report | November 30, 2019 | 19 |
| Stone Harbor Emerging Markets Income Fund | Financial Highlights |
For a share outstanding throughout the periods presented.
For the Year Ended November 30, 2019 | For the Year Ended November 30, 2018 | For the Year Ended November 30, 2017 | For the Year Ended November 30, 2016 | For the Year Ended November 30, 2015 | ||||||||||||
| Net asset value - beginning of period | $ | 10.58 | $ | 14.67 | $ | 13.76 | $ | 14.55 | $ | 18.56 | ||||||
| Income/(loss) from investment operations: | ||||||||||||||||
| Net investment income(1) | 0.89 | 1.13 | 1.40 | 1.42 | 2.24 | |||||||||||
| Net realized and unrealized gain/(loss) on investments | (0.40 | ) | (3.06 | ) | 1.67 | (0.05 | ) | (4.09 | ) | |||||||
| Total income/(loss) from investment operations | 0.49 | (1.93 | ) | 3.07 | 1.37 | (1.85 | ) | |||||||||
| Less distributions to shareholders: | ||||||||||||||||
| From net investment income | (0.76 | ) | (0.42 | ) | (1.08 | ) | (0.35 | ) | (0.33 | ) | ||||||
| From tax return of capital | (1.40 | ) | (1.74 | ) | (1.08 | ) | (1.81 | ) | (1.83 | ) | ||||||
| Total distributions | (2.16 | ) | (2.16 | ) | (2.16 | ) | (2.16 | ) | (2.16 | ) | ||||||
| Net Increase/(Decrease) in Net Asset Value | (1.67 | ) | (4.09 | ) | 0.91 | (0.79 | ) | (4.01 | ) | |||||||
| Net asset value - end of period | $ | 8.91 | $ | 10.58 | $ | 14.67 | $ | 13.76 | $ | 14.55 | ||||||
| Market price - end of period | $ | 13.18 | $ | 12.05 | $ | 15.19 | $ | 14.09 | $ | 12.86 | ||||||
| Total Return - Net Asset Value - DRP(2) | (0.01 | %) | (15.35 | %) | 22.74 | % | 10.87 | % | (9.27 | %) | ||||||
| Total Return - Net Asset Value - NAV(3) | 4.45 | % | (14.51 | %) | 23.43 | % | 10.20 | % | (10.24 | %) | ||||||
| Total Return - Market Price(2) | 29.86 | % | (6.89 | %) | 24.11 | % | 28.45 | % | (16.38 | %) | ||||||
| Ratios/Supplemental Data: | ||||||||||||||||
| Net assets, end of period (in millions) | $ | 146 | $ | 171 | $ | 234 | $ | 218 | $ | 230 | ||||||
| Ratio of expenses to average net assets | 1.97 | %(4) | 2.96 | %(4) | 2.59 | %(4) | 2.18 | %(4) | 2.13 | %(4) | ||||||
| Ratio of net investment income to average net assets | 8.88 | % | 8.76 | % | 9.47 | % | 10.03 | % | 14.08 | % | ||||||
| Ratio of expenses to average managed assets(5) | 1.75 | %(4) | 2.09 | %(4) | 1.85 | %(4) | 1.62 | %(4) | 1.46 | %(4) | ||||||
| Portfolio turnover rate | 107 | % | 130 | % | 107 | % | 105 | % | 89 | % | ||||||
| Borrowings at End of Period | ||||||||||||||||
| Aggregate Amount Outstanding (in millions) | $ | 9 | $ | 85 | $ | 65 | $ | 101 | $ | 90 | ||||||
| Asset Coverage | $ | 17 | $ | 3 | $ | 5 | $ | 3 | $ | 4 | ||||||
| (1) | Calculated using average shares throughout the period. |
| (2) | Total investment return is calculated assuming a purchase of one common share at the opening on the first day and a sale at closing on the last day of each period reported. Dividends and distributions, if any, are assumed for purposes of this calculation to be reinvested at prices obtained under the Fund’s dividend reinvestment plan ("DRP"). Total investment returns do not reflect brokerage commissions, if any. |
| (3) | Total return is calculated assuming a purchase of one common share at the beginning of the period and a sale on the last day of the period reported at net asset value (“NAV”) per share. Dividends and distributions are assumed to be reinvested at NAV. Total return does not reflect brokerage commissions. |
| (4) | For the years ended 2019, 2018, 2017, 2016, and 2015, includes borrowing costs of 0.38%, 1.08%, 0.74%, 0.41% and 0.30% to average net assets and 0.34%, 0.76%, 0.53%, 0.30% and 0.21% to average managed assets, respectively. |
| (5) | Average managed assets represent average net assets applicable to common shares plus average amount of borrowings during the period. |
See Notes to Financial Statements.
| 20 | www.shiplpcef.com |
| Stone Harbor Emerging Markets Income Fund | Notes to Financial Statements |
November 30, 2019
1. ORGANIZATION
The Fund is a closed-end management investment company registered under the Investment Company Act of 1940, as amended (the “1940 Act”). The Fund is organized as a Massachusetts business trust pursuant to an Agreement and Declaration of Trust governed by the laws of The Commonwealth of Massachusetts (the “Declaration of Trust”). The Fund’s inception date is December 22, 2010. Prior to that, the Fund had no operations other than matters relating to its organization and the sale and issuance of 4,188 shares of beneficial interest (“Common Shares”) in the Fund to the Stone Harbor Investment Partners LP (the “Adviser” or “Stone Harbor”) at a price of $23.88 per share. The Fund’s common shares are listed on the New York Stock Exchange (the “Exchange”) and trade under the ticker symbol “EDF”.
The Fund’s investment objective is to maximize total return, which consists of income on its investments and capital appreciation. The Fund will normally invest at least 80% of its net assets (plus any borrowings made for investment purposes) in emerging markets securities. Emerging markets securities include fixed income securities and other instruments (including derivatives) that are economically tied to emerging market countries, which are denominated in the predominant currency of the local market of an emerging market country or whose performance is linked to those countries’ markets, currencies, economies or ability to repay loans. A security or instrument is economically tied to an emerging market country if it is principally traded on the country’s securities markets or if the issuer is organized or principally operates in the country, derives a majority of its income from its operations within the country or has a majority of its assets within the country.
The Fund is classified as “non-diversified” under the 1940 Act. As a result, it can invest a greater portion of its assets in obligations of a single issuer than a “diversified” fund. The Fund may therefore be more susceptible than a diversified fund to being adversely affected by any single corporate, economic, political or regulatory occurrence.
2. SIGNIFICANT ACCOUNTING POLICIES AND RISK DISCLOSURES
The following is a summary of significant accounting policies consistently followed by the Fund in the preparation of its financial statements. The Fund is considered an investment company for financial reporting purposes under generally accepted accounting principles in the United States of America (“GAAP”). The policies are in conformity with GAAP. The preparation of the financial statements in accordance with GAAP requires management to make estimates and assumptions that affect the reported amounts of assets and liabilities at the date of the financial statements and the reported amounts of income and expenses during the reporting period. Actual results could differ from those estimates.
Investment Valuation: Sovereign debt obligations, corporate bonds, and convertible corporate bonds, are generally valued at the mean between the closing bid and asked prices provided by an independent pricing service. The pricing service generally uses market models that consider trade data, yields, spreads, quotations from dealers and active market makers, credit worthiness, market information on comparable securities, and other relevant security specific information. Bank Loans are primarily valued by a loan pricing provider using a composite loan price at the mean of the bid and ask prices from one or more brokers of dealers. Credit Linked securities are generally valued using quotations from the broker through which the Fund executed the transaction. The broker’s quotation considers cash flows, default and recovery rates, and other security specific information. Equity securities for which market quotations are available are generally valued at the last sale price or official closing price on the primary market or exchange on which they trade. If, on a given day, a closing price is not available on the exchange, the equity security is valued at the mean between the closing bid and ask prices, as such prices are provided by a pricing service. Publicly traded foreign government debt securities are typically traded internationally in the over-the-counter (“OTC”) market and are valued at the mean between the bid and asked prices as of the close of business of that market. When prices are not readily available, or are determined not to reflect fair value, such as when the value of a security has been significantly affected by events after the close of the exchange or market on which the security is principally traded, but before the Fund calculates its net asset value, the Fund may value these investments at fair value as determined in accordance with the procedures approved by the Fund’s Board. Short term obligations with maturities of 60 days or less are valued at amortized cost, which approximates market value. Exchange Traded Funds (“ETFs”) are valued at the close price on the exchange it is listed. Money market mutual funds are valued at their net asset value. OTC traded derivatives (primarily swaps and foreign currency options) are generally priced by an independent pricing service. OTC traded credit default swaps are valued by the independent pricing source using a mid price that is calculated based on data an independent pricing source receives from dealers. OTC traded foreign currency options are valued by an independent pricing source using mid foreign exchange rates against USD for all currencies at 4:00 p.m. EST. Derivatives which are cleared by an exchange are priced by using the last price on such exchange. Foreign currency positions including forward currency contracts are priced at the mean between the closing bid and asked prices at 4:00 p.m. Eastern time.
A three-tier hierarchy has been established to measure fair value based on the extent of use of “observable inputs” as compared to “unobservable inputs” for disclosure purposes and requires additional disclosures about these valuations measurements. Inputs refer broadly to the assumptions that market participants would use in pricing a security. Observable inputs are inputs that reflect the assumptions market participants would use in pricing the security developed based on market data obtained from sources independent of the reporting entity. Unobservable inputs are inputs that reflect the reporting entity’s own assumptions about the assumptions market participants would use in pricing the security developed based on the best information available in the circumstances.
| Annual Report | November 30, 2019 | 21 |
| Stone Harbor Emerging Markets Income Fund | Notes to Financial Statements |
November 30, 2019
The three-tier hierarchy is summarized as follows:
| Level 1 | Unadjusted quoted prices in active markets for identical assets or liabilities that the Fund has the ability to access. |
| Level 2 | Observable inputs other than quoted prices included in Level 1 that are observable for the asset or liability, either directly or indirectly. These inputs may include quoted prices for the identical instrument on an inactive market, prices for similar instruments, interest rates, prepayment speeds, credit risk, yield curves, default rates and similar data. |
| Level 3 | Unobservable inputs for the asset or liability, to the extent relevant observable inputs are not available, representing the Fund’s own assumptions about the assumptions a market participant would use in valuing the asset or liability and would be based on the best information available. |
The following is a summary of the Fund’s investment and financial instruments based on the three-tier hierarchy as of November 30, 2019:
| Investments in Securities at Value* | Level 1 | Level 2 | Level 3 | Total | ||||||||||||
| Sovereign Debt Obligations | $ | – | $ | 117,323,043 | $ | – | $ | 117,323,043 | ||||||||
| Corporate Bonds | ||||||||||||||||
| Indonesia | – | – | 198 | 198 | ||||||||||||
| Other | – | 25,317,093 | – | 25,317,093 | ||||||||||||
| Credit Linked Notes | – | – | 6,630,141 | 6,630,141 | ||||||||||||
| Purchased Options | – | 53,646 | – | 53,646 | ||||||||||||
| Short Term Investments | 2,739,411 | – | – | 2,739,411 | ||||||||||||
| Total | $ | 2,739,411 | $ | 142,693,782 | $ | 6,630,339 | $ | 152,063,532 | ||||||||
| Other Financial Instruments** | ||||||||||||||||
| Assets | ||||||||||||||||
| Forward Foreign Currency Contracts | $ | – | $ | 180,443 | $ | – | $ | 180,443 | ||||||||
| Credit Default Swap Contracts | – | 27,088 | – | 27,088 | ||||||||||||
| Liabilities | ||||||||||||||||
| Forward Foreign Currency Contracts | – | (352,342 | ) | – | (352,342 | ) | ||||||||||
| Total | $ | – | $ | (144,811 | ) | $ | – | $ | (144,811 | ) |
| * | For detailed country descriptions, see accompanying Statement of Investments. |
| ** | Other financial instruments are derivative instruments reflected in the Statement of Investments. The derivatives shown in this table are reported at their unrealized appreciation/(depreciation) at measurement date, which represents the change in the contract's value from trade date. For liabilities arising from reverse repurchase agreements, the carrying amount approximates fair value due to the relatively short-term maturity of these financial instruments. |
The following is a reconciliation of assets in which significant unobservable inputs (Level 3) were used in determining fair value:
| Asset Type | Balance November 30, 2018 | Accrued Discount/ Premium | Realized Gain/(Loss) | Change
in Unrealized Appreciation/ Depreciation | Purchases | Sales Proceeds | Balance November 30, 2019 | Net change in November 30, 2019 | ||||||||||||||||||||||||
| Corporate Bonds | $ | 195 | $ | – | $ | – | $ | 3 | $ | – | $ | – | $ | 198 | $ | 3 | ||||||||||||||||
| Credit Linked Notes | 6,010,257 | 130,422 | (42,910 | ) | 1,086,304 | 360,081 | (914,013 | ) | 6,630,141 | 1,086,304 | ||||||||||||||||||||||
| $ | 6,010,452 | $ | 130,422 | $ | (42,910 | ) | $ | 1,086,307 | $ | 360,081 | $ | (914,013 | ) | $ | 6,630,339 | $ | 1,086,307 | |||||||||||||||
All level 3 investments have values determined utilizing third-party pricing information without adjustment.
The inputs or methodology used for valuing securities are not necessarily an indication of the risk associated with investing in those securities.
| 22 | www.shiplpcef.com |
| Stone Harbor Emerging Markets Income Fund | Notes to Financial Statements |
November 30, 2019
In the event a Board approved independent pricing service is unable to provide an evaluated price for a security or the Adviser believes the price provided is not reliable, the Adviser may seek to find an alternative independent source, such as a broker/dealer to provide a price quote, or use evaluated pricing models similar to the techniques and models used by the independent pricing service. These fair value measurement techniques may utilize unobservable inputs (Level 3).
On at least a quarterly basis, the Adviser presents the factors considered in determining the fair value measurements and presents that information to the Board which meets at least quarterly.
Security Transactions and Investment Income: Security transactions are accounted for on a trade date basis. Interest income, adjusted for amortization of premium and accretion of discount, is recorded on the accrual basis. Dividend income is recorded on the ex-dividend date. Foreign dividend income is recorded on the ex-dividend date or as soon as practical after the Fund determines the existence of a dividend declaration after exercising reasonable due diligence. If applicable, any foreign capital gains taxes are accrued, net of unrealized gains, and are payable upon the sale of such investments. The cost of investments sold is determined by use of the specific identification method. To the extent any issuer defaults on an expected interest payment, the Fund’s policy is to generally halt any additional interest income accruals and consider the realizability of interest accrued up to the date of default.
Foreign Currency Translation: The books and records of the Fund are maintained in U.S. dollars. Investment valuations and other assets and liabilities initially expressed in foreign currencies are converted each business day into U.S. dollars based upon current exchange rates. Prevailing foreign exchange rates may generally be obtained at the close of the NYSE (normally 4:00 p.m. Eastern time).
The portion of realized and unrealized gains or losses on investments due to fluctuations in foreign currency exchange rates is not separately disclosed and is included in realized and unrealized gains or losses on investments, when applicable.
Foreign Securities: The Fund may directly purchase securities of foreign issuers. Investing in securities of foreign issuers involves special risks not typically associated with investing in securities of U.S. issuers. The risks include possible revaluation of currencies, the ability to repatriate funds, less complete financial information about companies and possible future adverse political and economic developments. Moreover, securities of many foreign issuers and their markets may be less liquid and their prices more volatile than those of securities of comparable U.S. issuers.
Credit Linked Notes: The Fund may invest in credit linked notes to obtain economic exposure to high yield, emerging markets or other securities. Investments in a credit linked note typically provide the holder with a return based on the return of an underlying reference instrument, such as an emerging market bond. Like an investment in a bond, investments in credit linked securities represent the right to receive periodic income payments (in the form of distributions) and payment of principal at the end of the term of the security. In addition to the risks associated with the underlying reference instrument, an investment in a credit linked note is also subject to liquidity risk, market risk, interest rate risk and the risk that the counterparty will be unwilling or unable to meet its obligations under the note.
Loan Participations and Assignments: The Fund may invest in loans arranged through private negotiation between one or more financial institutions. The Fund’s investment in any such loan may be in the form of a participation in or an assignment of the loan. In connection with purchasing participations, the Fund generally will have no right to enforce compliance by the borrower with the terms of the loan agreement relating to the loan, or any rights of set-off against the borrower, and the Fund may not benefit directly from any collateral supporting the loan in which it has purchased the participation.
While some loans are collateralized and senior to an issuer’s other debt securities, other loans may be unsecured and/or subordinated to other securities. Some senior loans, such as bank loans, may be illiquid and generally tend to be less liquid than many other debt securities.
The Fund assumes the credit risk of the borrower, the lender that is selling the participation and any other persons interpositioned between the Fund and the borrower. In the event of the insolvency of the lender selling the participation, the Fund may be treated as a general creditor of the lender and may not benefit from any set-off between the lender and the borrower. Loans may not be considered “securities”, and purchasers, such as the Fund, therefore may not be entitled to rely on the anti-fraud protections of the federal securities laws.
Segregation and Collateralization: In cases in which the 1940 Act and the interpretive positions of the U.S. Securities and Exchange Commission (“SEC”) require that the Fund either delivers collateral or segregates assets in connection with certain investments (e.g., foreign currency exchange contracts, securities with extended settlement periods, and swaps) or certain borrowings (e.g., reverse repurchase agreements), the Fund will segregate collateral or designate on its books and record cash or other liquid securities having a value at least equal to the amount that is required to be physically segregated for the benefit of the counterparty. Furthermore, based on requirements and agreements with certain exchanges and third party broker-dealers, each party has requirements to deliver/deposit cash or securities as collateral for certain investments. Cash collateral that has been pledged to cover obligations of the Fund and cash collateral received from the counterparty, if any, is reported separately on the Statement of Assets and Liabilities as “Deposits with brokers” or “Payable due to brokers”, respectively. Securities collateral pledged for the same purpose is noted on the Statement of Investments.
| Annual Report | November 30, 2019 | 23 |
| Stone Harbor Emerging Markets Income Fund | Notes to Financial Statements |
November 30, 2019
Leverage: The Fund may borrow from banks and other financial institutions and may also borrow additional funds by entering into reverse repurchase agreements or the issuance of debt securities (collectively, “Borrowings”) in an amount that does not exceed 33 1/3% of the Fund’s Managed Assets (defined in Note 5) immediately after such transactions. It is possible that following such Borrowings, the assets of the Fund will decline due to market conditions such that this 33 1/3% limit will be exceeded. In that case, the leverage risk to Common Shareholders will increase.
In a reverse repurchase agreement, the Fund delivers a security in exchange for cash to a financial institution, the counterparty, with a simultaneous agreement to repurchase the same or substantially the same security at an agreed upon price and date. The Fund is entitled to receive principal and interest payments, if any, made on the security delivered to the counterparty during the term of the agreement. Cash received in exchange for securities delivered plus accrued interest payments to be made by the Fund to counterparties are reflected as a liability on the Statement of Assets and Liabilities. Interest payments made by the Fund to counterparties are recorded as a component of interest expense on the Statement of Operations. In periods of increased demand for the security, the Fund may receive a fee for use of the security by the counterparty, which may result in interest income to the Fund. The Fund will segregate assets determined to be liquid to cover its obligations under reverse repurchase agreements. The segregated assets are found on the Fund’s Statement of Investments as full or partially pledge securities. The total amount of securities pledged at November 30, 2019 was $10,967,239. As all agreements can be terminated by either party on demand, face value approximates fair value at November 30, 2019. This fair value is based on Level 2 inputs under the three-tier fair valuation hierarchy described above. For the year ended November 30, 2019, the average amount of reverse repurchase agreements, on days outstanding was $23,807,118, at a weighted average interest rate of 2.67%.
The following table indicates the total amount of reverse repurchased agreements, reconciled to gross liability as of November 30, 2019:
Remaining contractual maturity of the lending agreement
| Overnight
& Continuous | Up to 30 days | 30-90 days | Greater
than 90 days | Total | ||||||||||||||||
| Stone Harbor Emerging Markets Income Fund | ||||||||||||||||||||
| Sovereign Debt Obligations | $ | 8,975,519 | $ | – | $ | – | $ | – | $ | 8,975,519 | ||||||||||
| Total | $ | 8,975,519 | $ | – | $ | – | $ | – | $ | 8,975,519 | ||||||||||
| Gross amount of unrecognized liabilities for reverse repurchase agreements | $ | 8,975,519 | ||||||||||||||||||
Emerging Market Risk: Emerging market countries often experience instability in their political and economic structures. Government actions could have a great effect on the economic conditions in these countries, which can affect the value and liquidity of the assets of a Fund. Specific risks that could decrease a Fund’s return include seizure of a company’s assets, restrictions imposed on payments as a result of blockages on foreign currency exchanges, expropriation, confiscatory taxation and unanticipated social or political occurrences. In addition, the ability of an emerging market government to make timely payments on its debt obligations will depend on the extent of its reserves, interest rate fluctuations and access to international credit and investments. A country with non-diversified exports or that relies on specific imports will be subject to a greater extent to fluctuations in the pricing of those commodities. Failure to generate adequate earnings from foreign trade would make it difficult for an emerging market country to service foreign debt. Disruptions resulting from social and political factors may cause the securities markets of emerging market countries to close. If this were to occur, the liquidity and value of a Fund’s assets invested in corporate debt obligations of emerging market companies would decline. Foreign investment in debt securities of emerging market countries may be restricted or controlled to varying degrees. These restrictions can limit or preclude foreign investment in debt securities of certain emerging market countries. In addition, certain emerging market countries may also restrict investment opportunities in issuers in industries deemed important to national interests.
Interest Rate Risk: Changes in interest rates will affect the value of the Fund’s investments. In general, as interest rates rise, bond prices fall, and as interest rates fall, bond prices rise. Interest rate risk is generally greater for funds that invest a significant portion of their assets in high yield securities. However, funds that generally invest a significant portion of their assets in higher-rated fixed income securities are also subject to this risk. The Fund also faces increased interest rate risk if it invests in fixed income securities paying no current interest (such as zero coupon securities and principal-only securities), interest-only securities and fixed income securities paying non-cash interest in the form of other securities. Many financial instruments use or may use a floating rate based on LIBOR, which is the offered rate for short-term Eurodollar deposits between major international banks. On July 27, 2017, the head of the U.K.'s Financial Conduct Authority announced a desire to phase out the use of LIBOR by the end of 2021. At this time, there remains uncertainty regarding the future utilization of LIBOR and the nature of any replacement rate. The transition process away from LIBOR may lead to increased volatility and illiquidity in markets that currently rely on LIBOR to determine interest rates, and the eventual use of an alternative reference rate may adversely affect the Fund's performance. In addition, the usefulness of LIBOR may deteriorate in the period leading up to its discontinuation, which could adversely affect the liquidity or market value of securities that use LIBOR.
| 24 | www.shiplpcef.com |
| Stone Harbor Emerging Markets Income Fund | Notes to Financial Statements |
November 30, 2019
Liquidity Risk: Liquidity risk exists when particular investments are difficult to purchase or sell at the time that the Fund would like or at the price that the Fund believes such investments are currently worth. Certain of the Fund’s investments may be illiquid. Illiquid securities may become harder to value, especially in changing markets. The Fund’s investments in illiquid securities may reduce the returns of the Fund because it may be unable to sell the illiquid securities at an advantageous time or price or possibly require the Fund to dispose of other investments at unfavorable times or prices in order to satisfy its obligations, which could prevent the Fund from taking advantage of other investment opportunities. Additionally, the market for certain investments may become illiquid under adverse market or economic conditions independent of any specific adverse changes in the conditions of a particular issuer. Derivatives, securities that involve substantial interest rate or credit risk and bank loans tend to involve greater liquidity risk. In addition, liquidity risk tends to increase to the extent the Fund invests in securities whose sale may be restricted by law or by contract, such as Rule 144A and Regulation S securities.
Foreign Investment Risk: The securities markets of many foreign countries are relatively small, with a limited number of companies representing a small number of industries. Additionally, issuers of foreign (non-U.S.) securities are usually not subject to the same degree of regulation as U.S. issuers. Reporting, accounting, auditing and custody standards of foreign countries differ, in some cases significantly, from U.S. standards. Global economies and financial markets are becoming increasingly interconnected, and conditions and events in one country, region or financial market may adversely impact issuers in a different country, region or financial market. Also, nationalization, expropriation or confiscatory taxation, currency blockage, political changes or diplomatic developments could adversely affect the Fund’s investments in a foreign country. In the event of nationalization, expropriation or other confiscation, the Fund could lose its entire investment in foreign (non-U.S.) securities. Adverse conditions in a certain region can adversely affect securities of other countries whose economies appear to be unrelated. Foreign (non-U.S.) securities may also be less liquid and more difficult to value than securities of U.S. issuers.
Leverage Risk: Leverage creates risks for Common Shareholders, including the likelihood of greater volatility of NAV per share and market price of, and dividends paid on, the Common Shares. There is a risk that fluctuations in the interest rates on any Borrowings held by the Fund may adversely affect the return to the Common Shareholders. If the income from the securities purchased with the proceeds of leverage is not sufficient to cover the cost of leverage, the return on the Fund will be less than if leverage had not been used, and therefore the amount available for distribution to the Common Shareholders as dividends and other distributions will be reduced.
The Fund may choose not to use leverage at all times. The amount and composition of leverage used may vary depending upon a number of factors, including economic and market conditions in the relevant emerging market countries, the availability of relatively attractive investment opportunities not requiring leverage and the costs and risks that the Fund would incur as a result of leverage.
Credit and Market Risk: The Fund invests in high yield and emerging market instruments that are subject to certain credit and market risks. The yields of high yield and emerging market debt obligations reflect, among other things, perceived credit and market risks. The Fund’s investment in securities rated below investment grade typically involves risks not associated with higher rated securities including, among others, greater risk related to timely and ultimate payment of interest and principal, greater market price volatility and less liquid secondary market trading. The consequences of political, social, economic or diplomatic changes may have disruptive effects on the market prices of investments held by the Fund. The Fund’s investment in non-dollar denominated securities may also result in foreign currency losses caused by devaluations and exchange rate fluctuations. Investments in derivatives are also subject to credit and market risks.
ETFs and Other Investment Companies Risk: The Fund may invest in an ETF or other investment company. The Fund will be subject to the risks of the underlying securities in which the other investment company invests. In addition, as a shareholder in an ETF or other investment company, the Fund will bear its ratable share of that investment company's expenses, and would remain subject to payment of the Fund's investment management fees with respect to the assets so invested. Common Shareholders would therefore be subject to duplicative expenses to the extent the Fund invests in other investment companies. In addition, these other investment companies may use leverage, in which case an investment would subject the Fund to additional risks associated with leverage. The Fund may invest in other investment companies for which the Adviser or an affiliate serves as investment manager or with which the Adviser is otherwise affiliated. The relationship between the Adviser and any such other investment company could create a conflict of interest between the Adviser and the Fund.
In addition to the risks related to investing in investment companies generally, investments in ETFs involve the risk that the ETF's performance may not track the performance of the index or markets the ETF is designed to track. In addition, ETFs often use derivatives to track the performance of the relevant index and, therefore, investments in those ETFs are subject to the same derivatives risks discussed below.
Distributions to Shareholders: The Fund intends to make a level dividend distribution each month to Common Shareholders. The level dividend rate may be modified by the Board from time to time. Any net capital gains earned by the Fund are distributed at least annually. For federal income tax purposes income and capital gain distributions are determined in accordance with federal income tax regulations, which may differ from GAAP. Distributions to shareholders are recorded by the Fund on the ex-dividend date. A portion of the Fund’s distributions made for a taxable year may be recharacterized as a return of capital to shareholders. This may occur, for example, if the Fund’s distributions exceed its “earnings and profits” for the taxable year or because certain foreign currency losses may reduce the Fund’s income. This recharacterization may be retroactive. A return of capital will generally not be taxable, but will reduce a shareholder’s basis in his or her Fund shares and therefore result in a higher gain or lower loss when the shareholder sells the shares.
| Annual Report | November 30, 2019 | 25 |
| Stone Harbor Emerging Markets Income Fund | Notes to Financial Statements |
November 30, 2019
Federal and Other Taxes: No provision for income taxes is included in the accompanying financial statements, as the Fund intends to distribute to shareholders all taxable investment income and realized gains and otherwise comply with Subchapter M of the Code applicable to regulated investment companies.
The Fund evaluates tax positions taken (or expected to be taken) in the course of preparing the Fund’s tax returns to determine whether these positions meet a “more-likely-than-not” standard that, based on the technical merits, have more than a 50 percent likelihood of being sustained by a taxing authority upon examination. A tax position that meets the “more-likely-than-not” recognition threshold is measured to determine the amount of benefit to recognize in the financial statements.
As of and during the year ended November 30, 2019, the Fund did not have a liability for any unrecognized tax benefits. The Fund files U.S. federal, state, and local tax returns as required. The Fund’s tax returns are subject to examination by the relevant tax authorities until expiration of the applicable statute of limitations which is generally three years after the filing of the tax return for federal purposes and four years for most state returns. Tax returns for open years have incorporated no uncertain tax positions that require a provision for income taxes.
3. DERIVATIVE INSTRUMENTS
Risk Exposure and the Use of Derivative Instruments: The Fund’s investment objectives not only permit the Fund to purchase investment securities, they also allow the Fund to enter in various types of derivatives contracts. In doing so, the Fund will employ strategies in differing combinations to permit it to increase, decrease or change the level or types of exposure to market factors. Central to those strategies are features inherent to derivatives that may make them more attractive for this purpose than equity or debt securities: they require little or no initial cash investment; they can focus exposure on only certain selected risk factors; and they may not require the ultimate receipt or delivery of the underlying security (or securities) to the contract. This may allow the Fund to pursue its objectives more quickly and efficiently than if the Fund were to make direct purchases or sales of securities capable of effecting a similar response to market factors.
The Fund’s use of derivatives can result in losses due to unanticipated changes in the risk factors described in Note 2 and the overall market. In instances where the Fund is using derivatives to decrease, or hedge, exposures to market risk factors for securities held by the Fund, there are also risks that those derivatives may not perform as expected resulting in losses for the combined or hedged positions.
Derivatives may have little or no initial cash investment relative to their market value exposure and therefore can produce significant gains or losses in excess of their cost. This use of embedded leverage allows the Fund to increase its market value exposure relative to its net assets and can substantially increase the volatility of the Fund’s performance.
Additional associated risks from investing in derivatives also exist and potentially could have significant effects on the valuation of the derivative and the Fund. Typically, the associated risks are not the risks that the Fund is attempting to increase or decrease exposure to, per its investment objectives, but are the additional risks from investing in derivatives.
Examples of these associated risks are liquidity risk, which is the risk that the Fund will not be able to sell or close out the derivative in a timely manner, and counterparty credit risk, which is the risk that the counterparty will not fulfill its obligation to the Fund. Associated risks can be different for each type of derivative and are discussed by each derivative type below and in the notes that follow.
Derivatives are also subject to the risk of possible regulatory changes, which could adversely affect the availability and performance of derivative securities, make them more costly and limit or restrict their use by the Fund, which could prevent the Fund from implementing its investment strategies and adversely affect returns. The SEC has issued a proposed rule under the 1940 Act providing for the regulation of registered investment companies' use of derivatives and certain related instruments. The ultimate impact, if any, of possible regulation remains unclear, but the proposed rule, if adopted, could, among other things, restrict the Fund's ability to engage in derivatives transactions and/or increase the costs of such derivatives transactions such that the Fund may be unable to implement its investment strategy.
Forward Foreign Currency Contracts: The Fund engaged in currency transactions with counterparties during the year ended November 30, 2019 to hedge the value of portfolio securities denominated in particular currencies against fluctuations in relative value, to gain or reduce exposure to certain currencies or to generate income or gains. A forward foreign currency contract is an agreement between two parties to buy and sell a currency at a set price on a future date. The contract is marked-to-market daily, and the change in value is recorded by the Fund as an unrealized gain or loss. When a forward foreign currency contract is closed, the Fund records a realized gain or loss equal to the difference between the value of the contract at the time it was opened and the value of the contract at the time it was closed.
| 26 | www.shiplpcef.com |
| Stone Harbor Emerging Markets Income Fund | Notes to Financial Statements |
November 30, 2019
Forward foreign currency contracts involve elements of market risk in excess of the amounts reflected in the Statement of Assets & Liabilities. The Fund bears the risk of an unfavorable change in the foreign exchange rate underlying the forward foreign currency contract. Risks may also arise upon entering into these contracts from the potential inability of the counterparties to meet the terms of their contracts.
Swap Agreements: The Fund invested in swap agreements during the year ended November 30, 2019. Swap agreements are bilaterally negotiated agreements between the Fund and a counterparty to exchange or swap investment cash flows, assets, or market-linked returns at specified, future intervals. Swap agreements are privately negotiated in the over-the-counter market (“OTC swaps”) or may be executed in a multilateral or other trade facility platform, such as a registered exchange (“centrally cleared swaps”). In a centrally cleared swap, immediately following execution of the swap agreement, the swap agreement is novated to a central counterparty (the “CCP”) and the Fund’s counterparty on the swap agreement becomes the CCP. The Fund may enter into credit default swaps, interest rate swaps, total return swaps on individual securities or groups or indices of securities for hedging, investment or leverage purposes. In connection with these agreements, securities or cash may be identified as collateral or margin in accordance with the terms of the respective swap agreements to provide assets of value and recourse in the event of default or bankruptcy/insolvency.
Swaps are marked-to-market daily and changes in value, including the accrual of periodic amounts of interest, are recorded daily within net change in unrealized appreciation/depreciation on swaps. Daily changes in valuation of centrally cleared swaps, if any, are recorded as a receivable or payable for the change in value as appropriate (“variation margin”). Each day the Fund may pay or receive cash, equal to the variation margin of the centrally cleared swap. OTC swap payments received or paid at the beginning of the measurement period represent premiums paid or received upon entering into the swap agreement to compensate for differences between the stated terms of the swap agreement and prevailing market conditions (credit spreads, interest rates, and other relevant factors).
Generally, the basis of the OTC swaps is the unamortized premium received or paid. The periodic swap payments received or made by the Fund are recorded in the Statement of Operations as realized gains or losses, respectively. Any upfront fees paid are recorded as assets and any upfront fees received are recorded as liabilities. When the swap is terminated, the Fund will record a realized gain or loss equal to the difference between the proceeds from (or cost of) the closing transaction and the Fund’s basis in the contract, if any.
Credit Default Swap Contracts: The Fund entered into credit default swap contracts during the year ended November 30, 2019 for hedging purposes to gain market exposure or to add leverage to its portfolio. When used for hedging purposes, the Fund is the buyer of a credit default swap contract. In that case, the Fund is entitled to receive the par (or other agreed upon) value of a referenced debt obligation, index or other investment from the counterparty to the contract in the event of a default by a third party, such as a U.S. or foreign issuer, on the referenced debt obligation. In return, the Fund pays to the counterparty a periodic stream of payments over the term of the contract provided that no event of default has occurred. If no event of default occurs, the Fund has spent the stream of payments and received no benefit from the contract. When the Fund is the seller of a credit default swap contract, the Fund receives the stream of payments but is obligated to pay upon default of the referenced debt obligation. As the seller, the Fund effectively adds leverage to its portfolio because, in addition to its total assets, the Fund is subject to investment exposure on the notional amount of the swap.
In addition to the risks applicable to derivatives generally, credit default swaps involve special risks because they may be difficult to value, are highly susceptible to liquidity and credit risk and generally pay a return to the counterparty only in the event of an actual default by the issuer of the underlying obligation, as opposed to a credit downgrade or other indication of financial difficulty.
Interest Rate Swap Contracts: The Fund engaged in interest rate swap contracts during the year ended November 30, 2019. Interest rate swap agreements involve the exchange by the Fund with another party for their respective commitment to pay or receive interest on the notional amount of principal. Certain forms of interest rate swap agreements may include: (i) interest rate caps, under which, in return for a premium, one party agrees to make payments to the other to the extent that interest rates exceed a specified rate, or “cap”, (ii) interest rate floors, under which, in return for a premium, one party agrees to make payments to the other to the extent that interest rates fall below a specified rate, or “floor”, (iii) interest rate collars, under which a party sells a cap and purchases a floor or vice versa in an attempt to protect itself against interest rate movements exceeding given minimum or maximum levels, (iv) callable interest rate swaps, under which the buyer pays an upfront fee in consideration for the right to early terminate the swap transaction in whole, at zero costs and at a predetermined date and time prior to the maturity date, (v) spreadlocks, which allow the interest rate swap users to lock in the forward differential (or spread) between the interest rate swap rate and a specified benchmark, or (vi) basis swaps, under which two parties can exchange variable interest rates based on different segments of money markets.
Purchased Options: When the Fund purchases an option, an amount equal to the premium paid by the Fund is recorded as an investment and is subsequently adjusted to the current value of the option purchased. If an option expires on the stipulated expiration date or if the Fund enters into a closing sale transaction, a gain or loss is realized. If a call option is exercised, the cost of the security acquired is increased by the premium paid for the call. If a put option is exercised, a gain or loss is realized from the sale of the underlying security, and the proceeds from such sale are decreased by the premium originally paid. Purchased options are non-income producing securities.
| Annual Report | November 30, 2019 | 27 |
| Stone Harbor Emerging Markets Income Fund | Notes to Financial Statements |
November 30, 2019
The tables below are a summary of the fair valuations of derivative instruments categorized by risk exposure.
Fair Values of derivative instruments on the Statement of Assets & Liabilities as of November 30, 2019:
| Risk Exposure | Location | Fair Value | Location | Fair Value | ||||||||
| Foreign Exchange Rate Risk (Purchased Options) | Investments, at value | $ | 53,646 | Investments, at value | $ | – | ||||||
| Credit Risk (Swap Contracts) | Unrealized appreciation on credit default swap contracts | 27,088 | Unrealized depreciation on credit default swap contracts | – | ||||||||
| Foreign Exchange Rate Risk (Forward Foreign Currency Contracts) | Unrealized appreciation on forward foreign currency contracts | 180,443 | Unrealized depreciation on forward foreign currency contracts | (352,342 | ) | |||||||
| Total | $ | 261,177 | $ | (352,342 | ) | |||||||
The purchased options, forward foreign currency contracts, credit default swaps, and interest rate swaps average use during the year ended November 30, 2019 is noted below:
| Purchased Options* | Forward Foreign Currency Contracts Bought** | Forward Foreign Currency Contracts Sold** | Credit Default Swap Contracts*** | Interest Rate Swap Contracts*** | |||||||||||||||
| $ | 21,231 | $ | (11,663,551 | ) | $ | 5,516,833 | $ | 2,781,750 | $ | 17,650,000 | |||||||||
| * | Represents the average market value. |
| ** | Represents the average foreign currency amount translated into U.S. dollars (bought) or sold. |
| *** | Represents the average notional value. |
For the year ended November 30, 2019, the effect of derivative instruments on the Statement of Operations were as follows:
| Risk Exposure | Location | Realized Gain/(Loss) on Derivatives | Change in Unrealized Appreciation/ (Depreciation) on Derivatives Recognized in Income | |||||||
| Credit Risk (Swap Contracts) | Net realized gain/(loss) on credit default swap contracts/Net change in unrealized appreciation/(depreciation) on credit default swap contracts | $ | 191,178 | $ | (2,660 | ) | ||||
| Interest Rate Risk (Swap Contracts) | Net realized gain/(loss) on interest rate swap contracts/Net change in unrealized appreciation/(depreciation) on interest rate swap contracts | (978,082 | ) | (2,127,878 | ) | |||||
| Foreign Exchange Rate Risk (Purchased Options) | Net realized gain/(loss) on investments/Net change in unrealized appreciation/(depreciation) on investments | – | (63,458 | ) | ||||||
| Foreign Exchange Rate Risk (Forward Foreign Currency Contracts) | Net realized gain/(loss) on forward foreign currency contracts/Net change in unrealized appreciation/(depreciation) on forward foreign currency contracts | (413,140 | ) | (236,894 | ) | |||||
| Total | $ | (1,200,044 | ) | $ | (2,430,890 | ) | ||||
Offsetting Arrangements: Certain derivative contracts and reverse repurchase agreements are executed under standardized netting agreements. A derivative netting arrangement creates an enforceable right of set-off that becomes effective, and affects the realization of settlement on individual assets, liabilities and collateral amounts, only following a specified event of default or early termination. Default events may include the failure to make payments or deliver securities timely, material adverse changes in financial condition or insolvency, the breach of minimum regulatory capital requirements, or loss of license, charter or other legal authorization necessary to perform under the contract. These agreements mitigate counterparty credit risk by providing for a single net settlement with a counterparty of all financial transactions covered by the agreement in an event of default as defined under such agreement.
| 28 | www.shiplpcef.com |
| Stone Harbor Emerging Markets Income Fund | Notes to Financial Statements |
November 30, 2019
The following table presents derivative financial instruments and reverse repurchase arrangements that are subject to enforceable netting arrangements, collateral arrangements or other similar agreements as of November 30, 2019.
Offsetting of Derivatives Assets
November 30, 2019
Gross Amounts Not Offset in the Statements of Assets and Liabilities | ||||||||||||||||||||||||
Gross Amounts of Recognized Assets | Gross Amounts Offset in the Statements of Assets and Liabilities | Net Amounts Presented in the Statements of Assets and Liabilities | Financial Instruments Available for Offset(a) | Cash Collateral Received(a) | Net Amount Receivable | |||||||||||||||||||
| Forward foreign currency contracts | $ | 180,443 | $ | – | $ | 180,443 | $ | (164,245 | ) | $ | – | $ | 16,198 | |||||||||||
| Credit default swap contracts | 27,088 | – | 27,088 | – | – | 27,088 | ||||||||||||||||||
| Purchased options | 53,646 | – | 53,646 | – | – | 53,646 | ||||||||||||||||||
| Total | $ | 261,177 | $ | – | $ | 261,177 | $ | (164,245 | ) | $ | – | $ | 96,932 | |||||||||||
Offsetting of Derivatives Liabilities
Gross Amounts Not Offset in the Statements of Assets and Liabilities | ||||||||||||||||||||||||
Gross Amounts of Recognized Liabilities | Gross Amounts Offset in the Statements of Assets and Liabilities | Net Amounts Presented in the Statements of Assets and Liabilities | Financial Instruments Available for Offset(a) | Cash Collateral Pledged(a) | Net Amount Payable | |||||||||||||||||||
| Stone Harbor Emerging Markets | ||||||||||||||||||||||||
| Income Fund | ||||||||||||||||||||||||
| Forward foreign currency contracts | $ | 352,342 | $ | – | $ | 352,342 | $ | (164,245 | ) | $ | – | $ | 188,097 | |||||||||||
| Reverse repurchase agreements | 8,975,519 | – | 8,975,519 | (8,975,519 | ) | – | – | |||||||||||||||||
| Total | $ | 9,327,861 | $ | – | $ | 9,327,861 | $ | (9,139,764 | ) | $ | – | $ | 188,097 | |||||||||||
| (a) | These amounts are limited to the derivatives asset/liability balance and, accordingly, do not include excess collateral received/pledged. |
4. TAX BASIS INFORMATION
Tax Basis of Distributions to Shareholders: Net investment income (loss) and net realized gain (loss) may differ for financial statement and tax purposes. The character of distributions made during the year from net investment income or net realized gains may differ from its ultimate characterization for federal income tax purposes. Also, due to the timing of dividend distributions, the fiscal year in which amounts are distributed may differ from the fiscal year in which the income or realized gain was recorded by the Fund.
The tax character of the distributions paid by the Fund during the fiscal years ended November 30 was as follows:
| 2019 | 2018 | |||||||
| Ordinary Income | $ | 12,330,480 | $ | 6,798,725 | ||||
| Return of Capital | 22,810,192 | 27,881,362 | ||||||
| Total | $ | 35,140,672 | $ | 34,680,087 | ||||
| Annual Report | November 30, 2019 | 29 |
| Stone Harbor Emerging Markets Income Fund | Notes to Financial Statements |
November 30, 2019
Components of Distributable Earnings on a Tax Basis: As of November 30, 2019, the components of distributable earnings on a tax basis were as follows:
| Accumulated Capital Loss | (101,803,082 | ) | ||
| Unrealized Depreciation | (6,652,866 | ) | ||
| Cumulative Effect of Other Timing Difference* | (52,980 | ) | ||
| Total | $ | (108,508,928 | ) |
| * | Other temporary differences due to timing consist primarily of credit default swaps. |
The tax components of distributable earnings are determined in accordance with income tax regulations which may differ from the composition of net assets reported under GAAP. These differences were primarily due to the differing tax treatment of certain investments.
Capital Losses: Under current law, capital losses maintain their character as short-term or long-term and are carried forward to the next tax year without expiration. As of November 30, 2019, the following amounts are available as carry forwards to the next tax year.
Capital losses carried forward were as follows:
| Fund | Short-Term | Long-Term | ||||||
| Stone Harbor Emerging Markets Income Fund | $ | 44,162,438 | $ | 57,640,644 | ||||
Unrealized Appreciation and Depreciation on Investments: At November 30, 2019, the aggregate gross unrealized appreciation and depreciation of investments for federal income tax purposes were as follows:
| Stone Harbor Emerging Markets Income Fund | ||||
| Gross appreciation on investments (excess of value over tax cost) | $ | 3,932,460 | ||
| Gross depreciation on investments (excess of tax cost over value) | (10,553,529 | ) | ||
| Net depreciation of foreign currency | (31,797 | ) | ||
| Net unrealized depreciation | $ | (6,652,866 | ) | |
| Cost of investments for income tax purposes | $ | 158,711,689 | ||
The differences between book and tax cost of investments are primarily attributed to wash sales, straddle deferrals, and mark-to-market adjustments on certain derivatives.
5. ADVISORY FEES, TRUSTEE FEES, ADMINISTRATION FEES, CUSTODY FEES AND TRANSFER AGENT FEES
The Adviser receives a monthly fee at the annual rate of 1.00% of the average daily value of the Fund’s total assets (including any assets attributable to any leverage used) minus the Fund’s accrued liabilities (other than Fund liabilities incurred for any leverage) (“Managed Assets”) provided that the Adviser fee does not exceed 1.50% of the Fund’s net assets.
ALPS Fund Services, Inc. (“ALPS”) serves as administrator to the Fund. Under the administration agreement, ALPS is responsible for calculating the net asset value of the common shares and generally managing the administrative affairs of the Fund. ALPS receives a monthly fee based on the average daily value of the Fund’s Managed Assets.
State Street Bank and Trust Company serves as the Fund’s custodian. Computershare, Inc. serves as the Fund’s transfer agent.
The Fund, along with the Stone Harbor Emerging Markets Total Income Fund and the Stone Harbor Investment Funds (collectively, the “Stone Harbor Fund Complex”) paid each Trustee who is not an interested person of the Adviser or any of its affiliates an aggregate fee of $84,000 per year. The Chair of the Audit Committee of the Board receives additional compensation of $5,000 per year for his service as chair. These fees are allocated over the Stone Harbor Fund Complex based on the average net assets of each fund. Interested Trustees (as defined below) of the Fund are not compensated by the Stone Harbor Fund Complex. All Trustees are reimbursed for reasonable travel and out-of-pocket expenses incurred to attend such meetings. Officers of the Fund do not receive compensation for performing the duties of their office.
| 30 | www.shiplpcef.com |
| Stone Harbor Emerging Markets Income Fund | Notes to Financial Statements |
November 30, 2019
6. SECURITIES TRANSACTIONS
The cost of purchases and proceeds from sales of securities (excluding short-term securities) during the year ended November 30, 2019, were as follows:
| Purchases | Sales |
| $176,551,030 | $259,899,847 |
7. AFFILIATED TRANSACTIONS
The Fund engaged in cross trades with an affiliate during the year ended November 30, 2019 pursuant to Rule 17a-7 under the 1940 Act. Cross trading is the buying or selling of portfolio securities between funds to which the Adviser serves as the investment adviser. The Board of Trustees previously adopted procedures that apply to transactions between funds in the Stone Harbor Fund Complex pursuant to Rule 17a-7. The procedures require that the transactions be a purchase or sale for no consideration other than cash payment against prompt delivery of a security for which market quotations are readily available, and be consistent with the investment policies of the funds involved. During the year ended November 30, 2019, the Fund purchased securities from another fund for which the Adviser is the investment adviser in the amount of $1,934,169.
8. INDEMNIFICATIONS
Under the Fund’s organizational documents, its officers and Trustees are indemnified against certain liability arising out of the performance of their duties to the Fund. Additionally, in the normal course of business, the Fund enters into contracts with service providers that may contain general indemnification clauses. The Fund’s maximum exposure under these arrangements is unknown, as this would involve future claims that may be made against the Fund that have not yet occurred.
9. RECENT ACCOUNTING PRONOUNCEMENTS
In March 2017, the Financial Accounting Standards Board (“FASB”) issued Accounting Standards Update (“ASU”) 2017-08, “Premium Amortization on Purchased Callable Debt Securities” which amends the amortization period for a callable debt security held at a premium from the maturity date to the earliest call date. The guidance is effective for annual periods beginning after December 15, 2018, and interim periods within those annual periods. At this time, management is evaluating the implications that these changes will have on the financial statements of the Fund.
In November 2016, the FASB issued ASU No. 2016-18, “Statement of Cash Flows (Topic 230) - Restricted Cash”. The new guidance is intended to change the presentation of restricted cash on the statement of cash flows. The new standard affects all entities that have restricted cash or restricted cash equivalents and are required to present a statement of cash flows under Topic 230. The new guidance is effective for fiscal years beginning after December 15, 2017, including interim periods within those annual periods. The requirements from the adoption of ASU No. 2016-18 have been incorporated into the presentation of the statement of cash flows.
10. SUBSEQUENT EVENTS
Shareholder Distributions: On December 26, 2019, the Fund paid the regularly scheduled distribution in the amount of $0.18 per share to shareholders of record as of December 13, 2019. The Board of Trustees previously approved a regularly scheduled distribution payable on January 30, 2020, of $0.18 per share to shareholders of record as of January 17, 2020. On January 22, 2020 the Board of Trustees approved a $0.17 per share distribution for February, March and April. More information can be found on the fund’s website www.shiplpcef.com.
| Annual Report | November 30, 2019 | 31 |
| Stone Harbor Emerging Markets Income Fund | Summary of Dividend Reinvestment Plan |
November 30, 2019 (Unaudited)
Unless the registered owner of Common Shares elects to receive cash by contacting Computershare (the “Plan Administrator”), all dividends declared on Common Shares will be automatically reinvested by the Plan Administrator for shareholders in the Fund’s Automatic Dividend Reinvestment Plan (the “Plan”), in additional Common Shares. Common Shareholders who elect not to participate in the Plan will receive all dividends and other distributions in cash paid by check mailed directly to the shareholder of record (or, if the Common Shares are held in street or other nominee name, then to such nominee) by the Plan Administrator as dividend disbursing agent. Participation in the Plan is completely voluntary and may be terminated or resumed at any time without penalty by notice if received and processed by the Plan Administrator prior to the dividend record date; otherwise such termination or resumption will be effective with respect to any subsequently declared dividend or other distribution. Such notice will be effective with respect to a particular dividend or other distribution (together, a “Dividend”). Some brokers may automatically elect to receive cash on behalf of Common Shareholders and may re-invest that cash in additional Common Shares, which may result in a higher cost to such shareholders as compared to shareholders who participate in the Plan.
The Plan Administrator will open an account for each Common Shareholder under the Plan in the same name in which such Common Shareholder’s Common Shares are registered. Whenever the Fund declares a Dividend payable in cash, non-participants in the Plan will receive cash and participants in the Plan will receive the equivalent in Common Shares. The Common Shares will be acquired by the Plan Administrator for the participants’ accounts, depending upon the circumstances described below, either (i) through receipt of additional unissued but authorized Common Shares from the Fund (“Newly Issued Common Shares”) or (ii) by purchase of outstanding Common Shares on the open market (“Open-Market Purchases”) on the NYSE or elsewhere. If, on the payment date for any Dividend, the closing market price plus estimated brokerage commissions per Common Share is equal to or greater than the NAV per Common Share, the Plan Administrator will invest the Dividend amount in Newly Issued Common Shares on behalf of the participants. The number of Newly Issued Common Shares to be credited to each participant’s account will be determined by dividing the dollar amount of the Dividend by the NAV per Common Share on the payment date; provided that, if the NAV is less than or equal to 95% of the closing market value on the payment date, the dollar amount of the Dividend will be divided by 95% of the closing market price per Common Share on the payment date. If, on the payment date for any Dividend, the NAV per Common Share is greater than the closing market value plus estimated brokerage commissions, the Plan Administrator will invest the Dividend amount in Common Shares acquired on behalf of the participants in Open-Market Purchases.
In the event of a market discount on the payment date for any Dividend, the Plan Administrator will have until the last business day before the next date on which the Common Shares trade on an “ex-dividend” basis or 30 days after the payment date for such Dividend, whichever is sooner (the “Last Purchase Date”), to invest the Dividend amount in Common Shares acquired in Open-Market Purchases. It is contemplated that the Fund will pay monthly income Dividends. If, before the Plan Administrator has completed its Open-Market Purchases, the market price per Common Share exceeds the NAV per Common Share, the average per Common Share purchase price paid by the Plan Administrator may exceed the NAV of the Common Shares, resulting in the acquisition of fewer Common Shares than if the Dividend had been paid in Newly Issued Common Shares on the Dividend payment date. Because of the foregoing difficulty with respect to Open-Market Purchases, the Plan provides that if the Plan Administrator is unable to invest the full Dividend amount in Open-Market Purchases during the purchase period or if the market discount shifts to a market premium during the purchase period, the Plan Administrator may cease making Open-Market Purchases and may invest the uninvested portion of the Dividend amount in Newly Issued Common Shares at the NAV per Common Share at the close of business on the Last Purchase Date provided that, if the NAV is less than or equal to 95% of the then current market price per Common Share, the dollar amount of the Dividend will be divided by 95% of the market price on the payment date for purposes of determining the number of shares issuable under the Plan.
The Plan Administrator maintains all shareholders’ accounts in the Plan and furnishes written confirmation of all transactions in the accounts, including information needed by shareholders for tax records. Common Shares in the account of each Plan participant will be held by the Plan Administrator on behalf of the Plan participant, and each shareholder proxy will include those shares purchased or received pursuant to the Plan. The Plan Administrator will forward all proxy solicitation materials to participants and vote proxies for shares held under the Plan in accordance with the instructions of the participants.
In the case of Common Shareholders such as banks, brokers or nominees which hold shares for others who are the beneficial owners, the Plan Administrator will administer the Plan on the basis of the number of Common Shares certified from time to time by the record shareholder’s name and held for the account of beneficial owners who participate in the Plan.
There will be no brokerage charges with respect to Common Shares issued directly by the Fund. However, each participant will pay a pro rata share of brokerage commissions incurred in connection with Open-Market Purchases. The automatic reinvestment of Dividends will not relieve participants of any federal, state or local income tax that may be payable (or required to be withheld) on such Dividends. Participants that request a sale of Common Shares through the Plan Administrator are subject to brokerage commissions.
The Fund reserves the right to amend or terminate the Plan. There is no direct service charge to participants with regard to purchases in the Plan; however, the Fund reserves the right to amend the Plan to include a service charge payable by the participants.
All correspondence or questions concerning the Plan should be directed to the Plan Administrator at 1-866-390-3910.
| 32 | www.shiplpcef.com |
| Stone Harbor Emerging Markets Income Fund | Additional Information |
November 30, 2019 (Unaudited)
FUND PORTFOLIO HOLDINGS
The Fund files its complete schedule of portfolio holdings with the SEC for the first and third quarters of each fiscal year as an exhibit to its reports on Form N-PORT. The Fund's Form N-PORT reports are available on the SEC's website at http://www.sec.gov.
PROXY VOTING
The policies and procedures used to determine how to vote proxies relating to securities held by the Fund are available (1) without charge, upon request, by calling 1-877-206-0791, or (2) on the SEC’s website at http://www.sec.gov. Information regarding how the Fund voted proxies relating to portfolio securities during the most recent twelve-month period ended June 30 is available by August 31 of each year (1) without charge, upon request, by calling 1-877-206-0791, or (2) on the SEC’s website at http://www.sec.gov.
SENIOR OFFICER CODE OF ETHICS
The Fund files a copy of its code of ethics that applies to the Fund’s principal executive officer, principal financial officer or controller, or persons performing similar functions, with the SEC as an exhibit to its annual report on Form N-CSR. This will be available on the SEC’s website at http://www.sec.gov.
PRIVACY POLICY
The Fund has adopted the following privacy policies in order to safeguard the personal information of the Fund's customers and consumers in accordance with Regulation S-P as promulgated by the U.S. Securities and Exchange Commission.
Fund officers are responsible for ensuring that the following policies and procedures are implemented:
| 1. | The Fund is committed to protecting the confidentiality and security of the information they collect and will handle personal customer and consumer information only in accordance with Regulation S-P and any other applicable laws, rules and regulations(1). The Fund will ensure: (a) the security and confidentiality of customer records and information; (b) that customer records and information are protected from any anticipated threats and hazards; and (c) that customer records and information are protected from unauthorized access or use. |
| 2. | The Fund conducts its business affairs through its trustees, officers and third parties that provide services pursuant to agreements with the Fund. The Fund does not have any employees. It is anticipated that the trustees and officers of the Fund who are not employees of service providers will not have access to customer records and information in the performance of their normal responsibilities for the Fund. |
| 3. | The Fund may share customer information with its affiliates, subject to the customers' right to prohibit such sharing. |
| 4. | The Fund may share customer information with unaffiliated third parties only in accordance with the requirements of Regulation S-P. Pursuant to this policy, the Fund will not share customer information with unaffiliated third parties other than as permitted by law, unless authorized to do so by the customer. |
| Annual Report | November 30, 2019 | 33 |
| Stone Harbor Emerging Markets Income Fund | Additional Information |
November 30, 2019 (Unaudited)
Consistent with these policies, the Fund has adopted the following procedures:
| 1. | The Fund will determine that the policies and procedures of its affiliates and Service Providers are reasonably designed to safeguard customer information and only permit appropriate and authorized access to and use of customer information through the application of appropriate administrative, technical and physical protections. |
| 2. | The Fund will direct each of its Service Providers to adhere to the privacy policy of the Fund and to their respective privacy policies with respect to the Fund's customer information and to take all action reasonably necessary so that the Fund is in compliance with the provisions of Regulation S-P, including, as applicable, the development and delivery of privacy notices and the maintenance of appropriate and adequate records. |
| 3. | Each Service Provider is required to promptly report to the officers of the Fund any material changes to its privacy policy before, or promptly after, the adoption of such changes. |
| (1) | Generally, shares of the Fund are held through financial intermediaries which are not considered “customers” of the Fund for purposes of Regulation S-P. |
This report, including the financial information herein, is transmitted to the shareholders of Stone Harbor Emerging Markets Income Fund for their information. It is not a prospectus, circular or representation intended for use in the purchase of shares of the Fund or any securities mentioned in this report.
Notice is hereby given in accordance with Section 23(c) of the Investment Company Act of 1940, as amended, that from time to time the Fund may purchase its common shares in the open market.
Information on the Fund is available at www.shiplpcef.com or by calling the Fund’s shareholder servicing agent at 1-866-390-3910.
SPECIAL RISKS RELATED TO CYBER SECURITY
With the increased use of technologies such as the Internet and the dependence on computer systems to perform necessary business functions, the Fund and its service providers are susceptible to operational and information security risks. In general, cyber incidents can result from deliberate attacks or unintentional events. Cyber attacks include, but are not limited to, gaining unauthorized access to digital systems for purposes of misappropriating assets or sensitive information, corrupting data, or causing operational disruption. Cyber attacks may also be carried out in a manner that does not require gaining unauthorized access, such as causing denial of service attacks on websites. Cyber security and other operational and technology failures or breaches of the Fund’s service providers (including, but not limited to, the Adviser, the administrator, the transfer agent and the custodian) or the issuers of securities in which the Fund invests, have the ability to cause disruptions and impact business operations, potentially resulting in financial losses, the inability of Fund shareholders to transact business, delays or mistakes in the calculation of the Fund’s NAV or other materials provided to shareholders, violations of applicable privacy and other laws, regulatory fines, penalties, reputational damage, reimbursement or other compensation costs, and/or additional compliance costs. The Adviser does not control the cyber security plans and systems put in place by third party service providers, and such third party service providers may have limited indemnification obligations to the Adviser or the Fund. In addition, substantial costs may be incurred in order to prevent any cyber incidents in the future. The Fund and its shareholders could be negatively impacted as a result. While the Fund has established business continuity plans and systems designed to prevent such cyber attacks, there are inherent limitations in such plans and systems including the possibility that certain risks have not been identified. Furthermore, the Fund cannot control the cyber security plans and systems put in place by its service providers, financial intermediaries and issuers in which the Fund invests.
ADDITIONAL INFORMATION
The Fund enters into contractual arrangements with various parties, including, among others, the Fund’s Adviser, shareholder service provider, custodian, transfer agent and administrator, who provide services to the Fund. Shareholders are not parties to, or intended (or “third-party”) beneficiaries of, any of those contractual arrangements, and those contractual arrangements are not intended to create in any individual shareholder or group of shareholders any right to enforce them against the service providers or to seek any remedy under them against the service providers, either directly or on behalf of the Fund.
Neither the Fund's original or any subsequent prospectus or statement of additional information, any press release or shareholder report or any contracts filed as exhibits to the Fund's registration statement, is intended to, nor does it, give rise to an agreement or contract between the Fund and any investor, or give rise to any contract or other rights in any individual shareholder, group of shareholders or other person other than any rights conferred explicitly by applicable federal or state securities laws that may not be waived.
| 34 | www.shiplpcef.com |
| Stone Harbor Emerging Markets Income Fund | Trustees & Officers |
November 30, 2019 (Unaudited)
The business and affairs of the Fund are managed under the direction of its Board. The Board approves all significant agreements between the Fund and the persons or companies that furnish services to the Fund, including agreements with its distributor, investment adviser, administrator, custodian and transfer agent. The day to day operations of the Fund are delegated to the Fund’s Adviser and administrator.
The name, year of birth and principal occupations for the past five years of the Trustees and officers of the Fund are listed below, along with the number of portfolios in the Fund Complex overseen by and the other directorships held by each Trustee. The Fund’s Statement of Additional Information includes additional information about the Trustees and is available without a charge, upon request, by calling 1-866-699-8158.
INDEPENDENT TRUSTEES
Name and Year of Birth(1) |
Position(s) Held with the Fund |
Term of Office And Length of Time Served(2) |
Principal Occupation(s) During Past 5 Years |
Number of Portfolios in Fund Complex Overseen by Trustee(3) |
Other Directorships Held by Trustee |
Alan Brott 1942
Class I |
Chairman of the Audit Committee; Trustee | Trustee: Since 2010
Term Expires: 2021 |
Columbia University - Associate Professor, 2000-2017; Consultant, 1991-Present. | 10 | Stone Harbor Investment Funds, Stone Harbor Emerging Markets Total Income Fund, Grosvenor Registered Multi-Strategy Fund and Grosvenor Hedge Fund Guided Portfolio Solution, Man FRM Alternative Multi-Strategy Fund, Excelsior Private Markets Funds (2 funds), UST Global Private Markets and NB Crossroads Private Markets Funds (3 funds). |
Heath B. McLendon 1933
Class II |
Trustee | Trustee: Since 2010
Term Expires: 2022 |
Retired. | 10 | Stone Harbor Investment Funds and Stone Harbor Emerging Markets Total Income Fund. |
Patrick Sheehan 1947
Class III |
Trustee | Trustee: Since 2010
Term Expires: 2020 |
Retired. | 10 | Stone Harbor Investment Funds and Stone Harbor Emerging Markets Total Income Fund. |
Glenn Marchak 1956
Class II |
Trustee | Trustee: Since 2015
Term Expires: 2022 |
Consultant and Private Investor. | 10 | Stone Harbor Investment Funds, Stone Harbor Emerging Markets Total Income Fund, Apollo Tactical Income Fund Inc. and Apollo Senior Floating Rate Fund Inc. |
Bruce Speca 1956
Class III |
Trustee | Trustee: Since 2016
Term Expires: 2020 |
Trustee, Frost Family of Funds (2019-Present); Trustee, The Advisors’ Inner Circle Fund, The Advisors’ Inner Circle Fund II, Bishop Street Funds and The KP Funds (November 2011-Present. | 10 | Stone Harbor Investment Funds, Stone Harbor Emerging Markets Total Income Fund, The Advisors’ Inner Circle Fund (45 funds), The Advisors’ Inner Circle Fund II (19 funds), Bishop Street Funds (2 funds), The KP Funds (15 funds) and Frost Family of Funds (8 funds). |
| Annual Report | November 30, 2019 | 35 |
| Stone Harbor Emerging Markets Income Fund | Trustees & Officers |
November 30, 2019 (Unaudited)
INTERESTED TRUSTEE
Name and Year of Birth(1) |
Position(s) Held with the Fund |
Term of Office And Length of Time Served(2) |
Principal Occupation(s) During Past 5 Years |
Number of Portfolios in Fund Complex Overseen by Trustee(3) |
Other Directorships Held by Trustee |
Thomas K. Flanagan* 1953
Class I |
Chairman and Trustee | Trustee: Since 2012
Term Expires: 2021 |
Retired since 2018; formerly Portfolio Manager of Stone Harbor from April 2006 to December 2018. | 10 | Stone Harbor Investment Funds and Stone Harbor Emerging Markets Total Income Fund. |
OFFICERS
Name and Year of Birth(1) |
Position(s) Held with the Fund |
Term of Office And Length of Time Served(2) |
Principal Occupation(s) During Past 5 Years |
Peter J. Wilby 1958 |
President and Chief Executive Officer | Since 2010 | Co-portfolio manager of the Fund; since December 2018, Co-Chief Investment Officer of Stone Harbor; from April 2006 to December 2018, Chief Investment Officer of Stone Harbor. |
James E. Craige 1967 |
Executive Vice President | Since 2010 | Co-portfolio manager of the Fund; since December 2018, Co-Chief Investment Officer of Stone Harbor; since April 2006, Portfolio Manager of Stone. |
Kumaran Damodaran, PhD 1972 |
Executive Vice President | Since 2019 | Co-portfolio manager of the Fund; Co-portfolio manager of Emerging Markets Total Income Fund, Emerging Markets Debt Fund, Local Markets Fund, Emerging Markets Corporate Debt Fund, Emerging Markets Debt Allocation Fund and Emerging Markets Debt Blend Fund; Since September 2015, Portfolio Manager of Stone Harbor; Prior to joining Stone Harbor, Lead Emerging Markets Macro Portfolio Manager for GLG Partners from 2012 to 2015. |
David Griffiths 1964 |
Executive Vice President | Since 2010 | Co-portfolio manager of the Fund; since April 2006, Portfolio Manager of Stone Harbor. |
David A. Oliver 1959 |
Executive Vice President | Since 2010 | Co-portfolio manager of the Fund; since June 2008, Portfolio Manager of Stone Harbor. |
William Perry 1962 |
Executive Vice President | Since 2012 | Co-portfolio manager of the Fund; since September 2012, Portfolio Manager of Stone Harbor. |
Stuart Sclater-Booth 1969 |
Executive Vice President | Since 2019 | Co-portfolio manager of the Fund; Co-portfolio manager of Emerging Markets Total Income Fund, Emerging Markets Debt Fund, Local Markets Fund, Emerging Markets Corporate Debt Fund, Emerging Markets Debt Allocation Fund and Emerging Markets Blend Fund; Since June 2014, Portfolio Manager of Stone Harbor. |
David Scott 1961 |
Executive Vice President | Since 2010 | Co-portfolio manager of the Fund; since April 2006, Portfolio Manager of Stone Harbor. |
Thomas M. Reynolds 1960 |
Principal Financial and Accounting Officer | Since 2014 | Since February 2008, Controller of Stone Harbor. |
Adam J. Shapiro 1963 |
Chief Legal Officer and Secretary | Since 2010 | Since April 2006, General Counsel of Stone Harbor. |
| 36 | www.shiplpcef.com |
| Stone Harbor Emerging Markets Income Fund | Trustees & Officers |
November 30, 2019 (Unaudited)
OFFICERS (CONTINUED)
Name and Year of Birth(1) |
Position(s) Held with the Fund |
Term of Office And Length of Time Served(2) |
Principal Occupation(s) During Past 5 Years |
Jeffrey S. Scott 1959 |
Chief Compliance Officer and Assistant Secretary | Since 2010 | Since April 2006, Chief Compliance Officer of Stone Harbor. |
Amanda Suss 1969 |
Treasurer | Since 2014 | Since July 2011, Senior Finance Associate of Stone Harbor. |
Vilma V. DeVooght 1977 |
Assistant Secretary | Since 2015 | Senior Counsel, ALPS, since 2014. |
Erich Rettinger 1985 |
Assistant Treasurer | Since 2016 | Fund Controller, ALPS, since 2013. |
| * | Mr. Flanagan is considered an “interested person” of the Fund (as defined in the 1940 Act) (an “Interested Trustee”) because of an ongoing financial interest associated with his December 2018 retirement from the Adviser. |
| (1) | The business address of each Trustee and Officer of the Fund is c/o Stone Harbor Investment Partners LP, 31 West 52nd Street, 16th Floor, New York, NY 10019. |
| (2) | Each Trustee serves until retirement, resignation or removal from the Board. Officers are typically elected every year, unless an officer earlier retires, resigns or is removed from office. |
| (3) | The term “Fund Complex” as used in this table includes the Fund and the following registered investment companies: Stone Harbor Emerging Markets Debt Fund, Stone Harbor High Yield Bond Fund, Stone Harbor Local Markets Fund, Stone Harbor Emerging Markets Corporate Debt Fund, Stone Harbor Investment Grade Fund, Stone Harbor Strategic Income Fund, Stone Harbor Emerging Markets Debt Allocation Fund, Stone Harbor Emerging Markets Debt Blend Fund and Stone Harbor Emerging Markets Total Income Fund. As of November 30, 2019, the Stone Harbor Emerging Markets Debt Blend Fund had not commenced operations. |
| Annual Report | November 30, 2019 | 37 |
| Stone Harbor Emerging Markets Income Fund | Benchmark Descriptions |
November 30, 2019 (Unaudited)
| Index | Description |
| JPMorgan EMBI Global Diversified Index | The JPMorgan EMBI Global Diversified Index (EMBI Global Diversified) tracks total returns for U.S. dollar-denominated debt instruments issued by emerging markets sovereign and quasi-sovereign entities: Brady bonds, loans, and Eurobonds. The index limits the weights of those index countries with larger debt stocks by only including specified portions of these countries’ eligible current face amounts outstanding. The countries covered in the EMBI Global Diversified are identical to those covered by the EMBI Global. |
| JPMorgan CEMBI Broad Diversified Index | The JPMorgan CEMBI Broad Diversified Index (CEMBI Broad Diversified) tracks total returns of U.S. dollar-denominated debt instruments issued by corporate entities in emerging market countries and consists of an investable universe of corporate bonds. The minimum amount outstanding required is $350 mm for the CEMBI Broad Diversified. The CEMBI Broad Diversified limits the weights of those index countries with larger corporate debt stocks by only including a specified portion of these countries’ eligible current face amounts of debt outstanding. |
| JPMorgan GBI-EM Global Diversified Index | The JPMorgan GBI-EM Global Diversified Index consists of regularly traded, liquid fixed-rate, domestic currency government bonds to which international investors can gain exposure. The weightings among the countries are more evenly distributed within this index. |
| 38 | www.shiplpcef.com |
Page Intentionally Left Blank.

INVESTMENT ADVISER
Stone Harbor Investment Partners LP
31 W. 52nd Street, 16th Floor
New York, New York 10019
ADMINISTRATOR & FUND ACCOUNTANT
ALPS Fund Services, Inc.
1290 Broadway, Suite 1100
Denver, Colorado 80203
TRANSFER AGENT
Computershare, Inc.
480 Washington Blvd.
Jersey City, New Jersey 07310
CUSTODIAN
State Street Bank and Trust Company
One Iron Street
Boston, Massachusetts 02210
LEGAL COUNSEL
Ropes & Gray LLP
1211 Avenue of the Americas
New York, New York 10036
INDEPENDENT REGISTERED PUBLIC ACCOUNTING FIRM
Deloitte & Touche LLP
1601 Wewatta Street, Suite 400
Denver, Colorado 80202
Item 2. Code of Ethics.
| (a) | The Registrant, as of the end of the period covered by this Report, has adopted a code of ethics that applies to the Registrant’s principal executive officer, principal financial officer, principal accounting officer or controller, or persons performing similar functions on behalf of the Registrant. |
| (b) | Not applicable. |
| (c) | During the period covered by this Report, no substantive amendments were made to the provisions of the code of ethics adopted in Item 2(a) above. |
| (d) | During the period covered by this Report, no implicit or explicit waivers to the provision of the code of ethics adopted in Item 2(a) above were granted. |
| (e) | Not Applicable. |
| (f) | The registrant’s Code of Ethics is attached as Exhibit 13(a)(1) hereto. |
Item 3. Audit Committee Financial Expert.
The Registrant’s Board of Trustees has determined that the Registrant has as least one audit committee financial expert serving on its audit committee. The Board of Trustees has designated Alan Brott as the Registrant’s “audit committee financial expert.” Mr. Brott is “independent” as defined in paragraph (a)(2) of Item 3 to Form N-CSR.
Mr. Brott has significant public accounting experience, including significant experience as a partner at a public accounting firm.
Item 4. Principal Accounting Fees and Services.
| (a) | Audit Fees: The aggregate fees billed for the fiscal years ended November 30, 2018 and November 30, 2019 professional services rendered by the principal accountant for the audit of the Registrant's annual financial statements or services that are normally provided by the accountant in connection with statutory and regulatory filings or engagements were $67,900 and $69,900, respectively. |
| (b) | Audit-Related Fees: The aggregate fees billed for the fiscal years ended November 30, 2018 and November 30, 2019 for assurance and related services by the principal accountant that are reasonably related to the performance of the audit of the Registrant's financial statements and are not reported under paragraph (a) of this Item were $0 and $0, respectively. |
| (c) | Tax Fees: The aggregate fees billed for the fiscal years ended November 30, 2018 and November 30, 2019 for professional services rendered by the principal accountant for tax compliance, tax advice and tax planning were $5,720 and $5,890, respectively. |
| (d) | All Other Fees: The aggregate fees billed for the fiscal years ended November 30, 2018 and November 30, 2019 for products and services provided by the principal accountant, other than the services reported in paragraphs (a) through (c) of this Item were $0 and $0, respectively. |
| (e)(1) | All services to be performed by the Registrant's principal auditors must be pre-approved by the Registrant's audit committee. |
| (e)(2) | No services described in paragraphs (b) through (d) were approved pursuant to paragraph (c)(7)(i)(C) of Rule 2-01 of Regulation S-X. |
| (f) | Not applicable. |
| (g) | The aggregate non-audit fees billed for the fiscal years ended November 30, 2018 and November 30, 2019 by the Registrant’s accountant for services rendered to the Registrant, and rendered to the Registrant’s investment adviser, and any entity controlling, controlled by, or under common control with the adviser that provides ongoing services to the Registrant were $0 and $0, respectively. |
| (h) | Not applicable. |
Item 5. Audit Committee of Listed Registrants.
| (a) | The Registrant has a separately designated standing audit committee established in accordance with Section 3(a)(58)(A) of the Securities Exchange Act of 1934, as amended, and is comprised of the following members: |
Alan Brott, Chairman
Heath McLendon
Patrick Sheehan
Glenn Marchak
Bruce Speca
| (b) | Not applicable. |
Item 6. Schedule of Investments.
| (a) | Schedule of Investments in securities of unaffiliated issuers as of the close of the reporting period is included as part of the Report to Stockholders filed under Item 1 of this Form N-CSR. |
| (b) | Not applicable. |
Item 7. Disclosure of Proxy Voting Policies and Procedures for Closed-End Management Investment Companies.
Attached as Exhibit 13(c), is a copy of the Registrant’s proxy voting policies and procedures.
Item 8. Portfolio Managers of Closed-End Management Investment Companies as of February 7, 2020.
(a)(1)
| Name | Position(s) Held with the Fund | Term of Office And Length of Time Served | Principal Occupation(s) During Past 5 Years |
| Peter J. Wilby | President and Chief Executive Officer | Since 2010 | Co-portfolio manager of the Fund; since December 2018, Co-Chief Investment Officer of Stone Harbor; since April 2006, Chief Investment Officer of Stone Harbor Investment Partners LP (“Stone Harbor”). |
| James E. Craige | Executive Vice President | Since 2010 | Co-portfolio manager of the Fund; since December 2018, Co-Chief Investment Officer of Stone Harbor; since April 2006, Portfolio Manager of Stone Harbor. |
|
Kumaran Damodaran
|
Executive Vice President | Since 2019 |
Co-portfolio manager of the Fund; Co-portfolio manager of Emerging Markets Total Income Fund, Emerging Markets Debt Fund, Local Markets Fund, Emerging Markets Corporate Debt Fund, Emerging Markets Debt Allocation Fund and Emerging Markets Debt Blend Fund; Since September 2015, Portfolio Manager of Stone Harbor; Prior to joining Stone Harbor, Lead Emerging Markets Macro Portfolio Manager for GLG Partners from 2012 to 2015. |
| David Griffiths | Executive Vice President | Since 2010 | Co-portfolio manager of the Fund; since April 2006, Portfolio Manager of Stone Harbor. |
| David A. Oliver | Executive Vice President | Since 2010 | Co-portfolio manager of the Fund; since June 2008, Portfolio Manager of Stone Harbor. |
| William Perry | Executive Vice President | Since 2012 | Co-portfolio manager of the Fund; since September 2012, Portfolio Manager of Stone Harbor. |
|
Stuart Sclater- Booth |
Executive Vice President | Since 2019 | Co-portfolio manager of the Fund; Co-portfolio manager of Emerging Markets Total Income Fund, Emerging Markets Debt Fund, Local Markets Fund, Emerging Markets Corporate Debt Fund, Emerging Markets Debt Allocation Fund and Emerging Markets Blend Fund; Since June 2014, Portfolio Manager of Stone Harbor. |
| David Scott | Executive Vice President | Since 2010 | Co-portfolio manager of the Fund; since April 2006, Portfolio Manager of Stone Harbor. |
(a)(2) As of November 30, 2019, the Portfolio Managers listed above are also responsible for the day-to-day management of the following:
| Registered Investment Companies | Other Pooled Investment Vehicles | Other Accounts | ||||
| Portfolio Manager | # of Accounts | Total Assets | # of Accounts | Total Assets | # of Accounts | Total Assets |
| ($mm) | ($mm) | ($mm) | ||||
| Peter Wilby, CFA | 11 | 3,382 | 42 1 | 7,228 | 42 2 | 9,116 |
| James Craige, CFA | 8 | 2,533 | 29 1 | 4,872 | 31 2 | 8,212 |
| Kumaran Damodaran, PhD | 7 | 2,453 | 20 1 | 4,426 | 26 2 | 7,501 |
| David Griffiths | 7 | 2,453 | 20 1 | 4,426 | 26 2 | 7,501 |
| David Oliver, CFA | 7 | 2,453 | 20 1 | 4,426 | 26 2 | 7,501 |
| William Perry | 8 | 2,533 | 29 1 | 4,872 | 31 2 | 8,212 |
| Stuart Sclater-Booth | 7 | 2,453 | 20 1 | 4,426 | 26 2 | 7,501 |
| David Scott | 3 | 849 | 13 | 2,356 | 11 3 | 810 |
| # | of Accounts does not include investors in Stone Harbor's pooled vehicles. |
| 1 | One segregated account of total market value $188 mm is subject to a performance-based advisory fee. |
| 2 | One segregated account of total market value $133 mm is subject to a performance-based advisory fee. |
| 3 | One segregated account of total market value $28 mm is subject to a performance-based advisory fee. Assets for multi-sector mandates do not include portions of those accounts that are invested in pooled vehicles. |
Potential Conflicts of Interest
Potential conflicts of interest may arise when one of the Fund’s portfolio managers has day-to-day management responsibilities with respect to one or more other funds or other accounts, as is the case for the portfolio managers listed in the table above.
The Investment Manager and the Fund have adopted compliance policies and procedures that are designed to address various conflicts of interest that may arise for the Investment Manager and the individuals that it employs. For example, the Investment Manager seeks to minimize the effects of competing interests for the time and attention of portfolio managers by assigning portfolio managers to manage funds and accounts that share a similar investment style. The Investment Manager has also adopted trade allocation procedures that are designed to facilitate the fair allocation of limited investment opportunities among similarly-managed funds and accounts. There is no guarantee, however, that the policies and procedures adopted by the Investment Manager and the Fund will be able to detect and/or prevent every situation in which an actual or potential conflict may appear.
These potential conflicts include:
Allocation of Limited Time and Attention. A portfolio manager who is responsible for managing multiple funds and/or accounts may devote unequal time and attention to the management of those funds and/or accounts. As a result, the portfolio manager may not be able to formulate as complete a strategy or identify equally attractive investment opportunities for each of those accounts as might be the case if he or she were to devote substantially more attention to the management of a single fund. The effects of this potential conflict may be more pronounced where funds and/or accounts overseen by a particular portfolio manager have different investment strategies.
Allocation of Limited Investment Opportunities. If a portfolio manager identifies a limited investment opportunity that may be suitable for multiple funds and/or accounts, the opportunity may be allocated among these several funds or accounts, which may limit a fund’s ability to take full advantage of the investment opportunity.
Pursuit of Differing Strategies. At times, a portfolio manager may determine that an investment opportunity may be appropriate for only some of the funds and/or accounts for which he or she exercises investment responsibility, or may decide that certain of the funds and/or accounts should take differing positions with respect to a particular security. In these cases, the portfolio manager may place separate transactions for one or more funds or accounts which may affect the market price of the security or the execution of the transaction, or both, to the detriment or benefit of one or more other funds and/or accounts.
Selection of Brokers/Dealers. Portfolio managers may be able to select or influence the selection of the brokers and dealers that are used to execute securities transactions for the funds and/or account that they supervise. In addition to executing trades, some brokers and dealers provide portfolio managers with brokerage and research services (as those terms are defined in Section 28(e) of the Securities Exchange Act of 1934), which may result in the payment of higher brokerage fees than might have otherwise been available. These services may be more beneficial to certain funds or accounts than to others. Although the payment of brokerage commissions is subject to the requirement that the portfolio manager determine in good faith that the commissions are reasonable in relation to the value of the brokerage and research services provided to the fund, a portfolio manager’s decision as to the selection of brokers and dealers could yield disproportionate costs and benefits among the funds and/or accounts that he or she manages.
Use of Leverage. During periods in which the Fund is using leverage, the fees paid to the Investment Manager, which may directly or indirectly affect the portfolio manager’s compensation, for investment advisory services will be higher than if the Fund did not use leverage because the fees paid will be calculated on the basis of the Fund’s Total Assets, including assets attributable to any Borrowings and/or to any Preferred Shares, which may create an incentive for the portfolio manager to leverage the Fund or to leverage using strategies that increase the Investment Manager’s fee.
Variation in Compensation. A conflict of interest may arise where the financial or other benefits available to the portfolio manager differ among the funds and/or accounts that he or she manages. If the structure of the Investment Manager’s management fee and/or the portfolio manager’s compensation differs among funds and/or accounts (such as where certain funds or accounts pay higher management fees or performance-based management fees), the portfolio manager might be motivated to help certain funds and/or accounts over others. The portfolio manager might be motivated to favor funds and/or accounts in which he or she has an interest or in which the investment advisor and/or its affiliates have interests. Similarly, the desire to maintain or raise assets under management or to enhance the portfolio manager’s performance record or to derive other rewards, financial or otherwise, could influence the portfolio manager to lend preferential treatment to those funds and/or accounts that could most significantly benefit the portfolio manager.
Related Business Opportunities. The Investment Manager or its affiliates may provide more services (such as distribution or recordkeeping) for some types of funds or accounts than for others. In such cases, a portfolio manager may benefit, either directly or indirectly, by devoting disproportionate attention to the management of fund and/or accounts that provide greater overall returns to the Investment Manager and its affiliates.
(a)(3) Portfolio Manager Compensation as of November 30, 2019.
The Investment Manager is 100% employee owned, which gives its personnel a direct stake in the success of the firm. In addition to a share in firm ownership, this compensation program includes a salary commensurate with experience and a performance-based bonus.
The overall compensation structure for the Fund’s portfolio managers is based on three components: (a) base remuneration; (b) discretionary performance-based bonus; and (c) profit participation.
Portfolio managers are compensated on pre-tax investment performance versus both the applicable benchmark and peer group as measured on a one-, three- and five-year horizon equally weighted. For these purposes, the benchmark for the Fund is a blend of the JPMorgan EMBI Global Diversified Bond Index, the JPMorganGBI-EM Global Diversified Index and the JPMorgan CEMBI Broad Diversified Index. Analysts are compensated on credit performance versus the applicable benchmark for the same periods. All employees will also participate in firm profit-sharing.
(a)(4) Dollar Range of Securities Owned as of November 30, 2019.
| Portfolio Managers | Dollar Range of the Registrant’s Securities Owned by the Portfolio Managers |
| Peter J. Wilby, CFA | $500,001-1,000,000 |
| James E. Craige, CFA | $1,000,000+ |
| Kumaran Damodaran | $0 |
| David Griffiths | $0 |
| David A. Oliver, CFA | $100,001-500,000 |
| William Perry | $0 |
| Stuart Sclater-Booth | $0 |
| David Scott | $0 |
(b) Not applicable.
Item 9. Purchases of Equity Securities by Closed-End Management Investment Companies and Affiliated Purchasers.
None.
Item 10. Submission of Matters to a Vote of Security Holders.
There have been no material changes to the procedures by which shareholders may recommend nominees to the Registrant’s Board of Trustees.
Item 11. Controls and Procedures.
| (a) | The Registrant’s principal executive officer and principal financial officer have concluded that the Registrant’s disclosure controls and procedures (as defined in Rule 30a-3(c) under the Investment Company Act of 1940, as amended) are effective based on their evaluation of these controls and procedures as of a date within 90 days of the filing date of this report. |
| (b) | There was no change in the Registrant’s internal control over financial reporting (as defined in Rule 30a-3(d) under the Investment Company Act of 1940, as amended) that occurred during the period covered by this report that has materially affected, or is reasonably likely to materially affect, the Registrant’s internal control over financial reporting. |
Item 12. Disclosure of Securities Lending Activities for Closed-End Management Investment Companies.
(a) Not applicable. The Registrant did not engage in securities lending activities during its most recent fiscal year.
(b) Not applicable. The Registrant did not engage in securities lending activities during its most recent fiscal year.
Item 13. Exhibits.
(a)(1) Registrant’s Code of Ethics for Senior Financial Officers, which is the subject of the disclosure required by Item 2 of Form N-CSR, is attached hereto as Exhibit 13(a)(1).
(a)(2) The certifications required by Rule 30a-2(a) of the Investment Company Act of 1940, as amended, and Section 302 of the Sarbanes-Oxley Act of 2002 are attached hereto as Exhibit 99.Cert.
(a)(3) None.
(a)(4) Not applicable.
(b) A certification for the Registrant’s principal executive officer and principal financial officer, as required by Rule 30a-2(b) of the Investment Company Act of 1940, as amended, and Section 906 of the Sarbanes-Oxley Act of 2002 is attached hereto as Exhibit 99.906Cert.
(c) The Registrant’s Proxy Voting Policies and Procedures are attached hereto as Exhibit 13(c).
(d) Pursuant to the Securities and Exchange Commission’s Order granting relief from Section 19(b) of the Investment Company Act of 1940, as amended, dated October 12, 2011, the form of Section 19(a) Notices to Beneficial Owners are attached hereto as Exhibit 13(d).
SIGNATURES
Pursuant to the requirements of the Securities Exchange Act of 1934 and the Investment Company Act of 1940, the Registrant has duly caused this report to be signed on its behalf by the undersigned, thereunto duly authorized.
| Stone Harbor Emerging Markets Income Fund | ||
| By: | /s/ Peter J. Wilby | |
| Peter J. Wilby | ||
| President and Chief Executive Officer/Principal Executive Officer | ||
| Date: | February 7, 2020 | |
Pursuant to the requirements of the Securities Exchange Act of 1934 and the Investment Company Act of 1940, this report has been signed below by the following persons on behalf of the Registrant and in the capacities and on the dates indicated.
| Stone Harbor Emerging Markets Income Fund | ||
| By: | /s/ Peter J. Wilby | |
| Peter J. Wilby | ||
| President and Chief Executive Officer/Principal Executive Officer | ||
| Date: | February 7, 2020 | |
| By: | /s/ Thomas M. Reynolds | |
| Thomas M. Reynolds | ||
| Principal Financial Officer/Principal Accounting Officer | ||
| Date: | February 7, 2020 | |
Stone Harbor Investment Funds
Stone Harbor Closed-End Funds
Code Of Ethics
Pursuant To Section 406 Of The Sarbanes-Oxley Act Of 2002 For
Principal Executive And Senior Financial Officers
| I. | Covered Officers/Purpose of the Code |
This Code of Ethics (this “Code”) pursuant to Section 406 of the Sarbanes-Oxley Act of 2002 has been adopted by Stone Harbor Investment Partners LP (“Stone Harbor” or the “Adviser”)-managed U.S. registered open-end investment companies (the “Stone Harbor Investment Funds”) and Stone Harbor-managed U.S. registered closed-end investment companies (the “Stone Harbor Closed-End Funds,” together with the Stone Harbor Investment Funds, the “Funds”) and applies to each Fund’s Principal Executive Officer, Principal Financial Officer and Principal Accounting Officer (the “Covered Officers,” each of whom is identified in Exhibit A) for the purpose of promoting:
| ● | honest and ethical conduct, including the ethical handling of actual or apparent conflicts of interest between personal and professional relationships; |
| ● | full, fair, accurate, timely and understandable disclosure in reports and documents that a Fund files with, or submits to, the Securities and Exchange Commission (“SEC”) and in other public communications made by a Fund; |
| ● | compliance with applicable laws and governmental rules and regulations; |
| ● | the prompt internal reporting of violations of the Code to an appropriate person or persons identified in the Code; and |
| ● | accountability for adherence to the Code. |
Each Covered Officer should adhere to a high standard of business ethics and should be sensitive to situations that may give rise to conflicts of interest.
| II. | Covered Officers Should Handle Ethically Any Actual or Apparent Conflicts of Interest |
Overview. A “conflict of interest” occurs when a Covered Officer’s private interest interferes with the interests of, or his service to, the relevant Fund. For example, a conflict of interest would arise if a Covered Officer, or a member of the Covered Officer’s family, receives improper personal benefits as a result of the Covered Officer’s position with the relevant Fund.
Certain conflicts of interest arise out of the relationships between Covered Officers and the relevant Fund and already are subject to conflict of interest provisions and procedures in the Investment Company Act of 1940, as amended (including the regulations thereunder, the “1940 Act”) and the Investment Advisers Act of 1940, as amended (including the regulations thereunder, the “Investment Advisers Act”). Indeed, conflicts of interest are endemic for certain registered management investment companies and those conflicts are both substantially and procedurally dealt with under the 1940 Act. For example, Covered Officers may not engage in certain transactions with a Fund because of their status as “affiliated persons” of such Fund. The compliance program of each Fund and the compliance programs of its investment adviser, principal underwriters and administrator (each a “Service Provider” and, collectively, the “Service Providers”) are reasonably designed to prevent, or identify and correct, violations of many of those provisions, although they are not designed to provide absolute assurance as to those matters. This Code does not, and is not intended to, repeat or replace these programs and procedures, and such conflicts fall outside of the parameters of this Code. See also Section V of this Code.
Although typically not presenting an opportunity for improper personal benefit, conflicts arise from, or as a result of, the contractual relationship between a Fund and its Service Providers of which the Covered Officers are also officers or employees. As a result, this Code recognizes that the Covered Officers will, in the normal course of their duties (whether for the Funds or for a Service Provider, or for both), be involved in establishing policies and implementing decisions that will have different effects on the Service Providers and the Funds. The participation of the Covered Officers in such activities is inherent in the contractual relationships between the Funds and their Service Providers and is consistent with the performance by the Covered Officers of their duties as officers of the relevant Fund. Thus, if performed in conformity with the provisions of the 1940 Act, the Investment Advisers Act, other applicable law and the relevant Fund’s constitutional documents, such activities will be deemed to have been handled ethically. Frequently, the 1940 Act establishes, as a mechanism for dealing with conflicts, disclosure to and approval by the Trustees of a Fund who are not “interested persons” of such Fund under the 1940 Act. In addition, it is recognized by the Funds’ Board of Trustees (“Board”) that the Covered Officers may also be officers or employees of one or more other investment companies covered by other codes and that such service, by itself, does not give rise to a conflict of interest.
Other conflicts of interest are covered by the Code, even if such conflicts of interest are not the subject of provisions of the 1940 Act and the Investment Advisers Act. The following list provides examples of conflicts of interest under the Code, but Covered Officers should bear in mind that these examples are not exhaustive. The overarching principle is that the personal interest of a Covered Officer should not be placed improperly before the interest of the relevant Fund, unless the personal interest has been disclosed to and approved by other officers of such Fund or such Fund’s Board or a committee of such Fund’s Board that has no such personal interest.
* * * *
2
Each Covered Officer must not:
| ● | use his personal influence or personal relationships improperly to influence investment decisions or financial reporting by the relevant Fund whereby the Covered Officer would benefit personally to the detriment of such Fund; |
| ● | cause the relevant Fund to take action, or fail to take action, for the individual personal benefit of the Covered Officer rather than the benefit of such Fund; or |
| ● | retaliate against any other Covered Officer or any employee of the relevant Fund or its Service Providers for reports of potential violations that are made in good faith. |
There are some conflict of interest situations that should always be subject to approval by the President of the relevant Fund (or, with respect to activities of the President, by the Chairman of such Fund). These conflict of interest situations are listed below:
| ● | service on the board of directors or governing board of a publicly traded entity; |
| ● | any ownership interest in, or any consulting or employment relationship with, any entities doing business with the Fund, other than a Service Provider or an affiliate of a Service Provider. This restriction shall not apply to or otherwise limit the ownership of publicly traded securities so long as the Covered Person’s ownership does not exceed more than 2% of the outstanding securities of the relevant class. |
| ● | a direct or indirect financial interest in commissions, transaction charges or spreads paid by the Fund for effecting portfolio transactions or for selling or redeeming shares other than an interest arising from the Covered Officer’s employment with a Service Provider or its affiliate. This restriction shall not apply to or otherwise limit the ownership of publicly traded securities so long as the Covered Person’s ownership does not exceed more than 2% of the particular class of security outstanding. |
| III. | Disclosure and Compliance |
| ● | No Covered Officer should knowingly misrepresent, or cause others to misrepresent, facts about the Funds to others, whether within or outside the Funds, including to the relevant Fund’s Board and auditors, and to governmental regulators and self-regulatory organizations. |
3
| ● | Each Covered Officer should, to the extent appropriate within his area of responsibility, consult with other officers and employees of the relevant Fund and the Service Providers or with counsel to such Fund with the goal of promoting full, fair, accurate, timely and understandable disclosure in the registration statements or periodic reports that the Fund files with, or submits to, the SEC (which, for sake of clarity, does not include any sales literature, omitting prospectuses, or “tombstone” advertising prepared by the Fund’s principal underwriter(s)). |
| ● | It is the responsibility of each Covered Officer to promote compliance with the standards and restrictions imposed by applicable laws, rules and regulations. |
| IV. | Reporting and Accountability |
Each Covered Officer must, with respect to the relevant Fund:
| ● | upon adoption of the Code (or thereafter as applicable, upon becoming a Covered Officer), affirm in writing to the Fund that he has received, read, and understands the Code; |
| ● | provide full and fair responses to all questions asked in any Trustee and Officer Questionnaire provided by the Fund as well as with respect to any supplemental request for information; and |
| ● | notify the President of the Fund promptly if he is convinced to a moral certainty that there has been a material violation of this Code (with respect to violations by a President, the Covered Officer shall report to the Chairman of the Fund). |
The President of each Fund is responsible for applying this Code to specific situations in which questions are presented under it and has the authority to interpret this Code in any particular situation. However, any approvals or waivers sought by the President will be considered by the Chairman of the Fund.
Each Fund will follow these procedures in investigating and enforcing this Code:
| ● | the President will take all appropriate action to investigate any potential material violations reported to him, which actions may include the use of internal or external counsel, accountants or other personnel; |
| ● | if, after such investigation, the President believes that no material violation has occurred, the President is not required to take any further action; |
| ● | any matter that the President believes is a material violation will be reported to the Audit Committee of the Board of Trustees (the “Committee”); |
4
| ● | if the Committee concurs that a material violation has occurred, it will inform and make a recommendation to the Board, which will consider appropriate action, which may include review of, and appropriate modifications to applicable policies and procedures; notification to appropriate personnel of a Service Provider or its board; or a recommendation to dismiss the Covered Officer; |
| ● | the Committee will be authorized to grant waivers, as it deems appropriate; and |
| ● | any changes to or waivers of this Code will, to the extent required, be disclosed as provided by SEC rules. |
| V. | Other Policies and Procedures |
This Code shall be the sole code of ethics adopted by the Funds for purposes of Section 406 of the Sarbanes-Oxley Act of 2002 and the rules and forms applicable to registered investment companies thereunder. Insofar as other policies or procedures of the Funds or the Funds’ Service Providers govern or purport to govern the behavior or activities of the Covered Officers who are subject to this Code, they are superseded by this Code to the extent that they conflict with the provisions of this Code. The Funds and their Service Providers’s codes of ethics under Rule 17j-1 under the 1940 Act and the Service Providers’s more detailed compliance policies and procedures are separate requirements applying to the Covered Officers and others, and are not part of this Code.
| VI. | Amendments |
Any material amendments to this Code must be approved or ratified by a majority vote of the Board.
| VII. | Confidentiality |
All reports and records prepared or maintained pursuant to this Code will be considered confidential and shall be maintained and protected accordingly. Except as otherwise required by law or this Code, such matters shall not be disclosed to anyone except as permitted by the Board.
| VIII. | Internal Use |
The Code is intended solely for the internal use by the Funds and does not constitute an admission, by or on behalf of any Fund, as to any fact, circumstance, or legal conclusion.
Last Reviewed April 2019
5
Exhibit A
Persons Covered by this Code of Ethics
| Principal Executive Officer | Principal Financial Officer | Principal Accounting Officer |
| Peter Wilby | Thomas Reynolds | Thomas Reynolds |
Note that the listed officers are “Covered Officers” of each of the Funds.
6
Exhibit 99.Cert
I, Peter J. Wilby, President and Chief Executive Officer/Principal Executive Officer of Stone Harbor Emerging Markets Income Fund certify that:
| 1. | I have reviewed this report on Form N-CSR of Stone Harbor Emerging Markets Income Fund (the “registrant”); |
| 2. | Based on my knowledge, this report does not contain any untrue statement of a material fact or omit to state a material fact necessary to make the statements made, in light of the circumstances under which such statements were made, not misleading with respect to the period covered by this report; |
| 3. | Based on my knowledge, the financial statements, and other financial information included in this report, fairly present in all material respects the financial condition, results of operations, changes in net assets, and cash flows (if the financial statements are required to include a statement of cash flows) of the registrant as of, and for, the periods presented in this report; |
| 4. | The registrant’s other certifying officer and I are responsible for establishing and maintaining disclosure controls and procedures (as defined in Rule 30a-3(c) under the Investment Company Act of 1940) and internal control over financial reporting (as defined in Rule 30a-3(d) under the Investment Company Act of 1940) for the registrant and have: |
| (a) | Designed such disclosure controls and procedures, or caused such disclosure controls and procedures to be designed under our supervision, to ensure that material information relating to the registrant, including its consolidated subsidiaries, is made known to us by others within those entities, particularly during the period in which this report is being prepared; |
| (b) | Designed such internal control over financial reporting, or caused such internal control over financial reporting to be designed under our supervision, to provide reasonable assurance regarding the reliability of financial reporting and the preparation of financial statements for external purposes in accordance with generally accepted accounting principles; |
| (c) | Evaluated the effectiveness of the registrant’s disclosure controls and procedures and presented in this report our conclusions about the effectiveness of the disclosure controls and procedures, as of a date within 90 days prior to the filing date of this report based on such evaluation; and |
| (d) | Disclosed in this report any change in the registrant’s internal control over financial reporting that occurred during the period covered by this report that has materially affected, or is reasonably likely to materially affect, the registrant’s internal control over financial reporting; and |
| 5. | The registrant’s other certifying officer and I have disclosed to the registrant’s auditors and the audit committee of the registrant’s board of directors (or persons performing the equivalent functions): |
| (a) | All significant deficiencies and material weaknesses in the design or operation of internal control over financial reporting which are reasonably likely to adversely affect the registrant’s ability to record, process, summarize, and report financial information; and |
| (b) | Any fraud, whether or not material, that involves management or other employees who have a significant role in the registrant’s internal control over financial reporting. |
| By: | /s/ Peter J. Wilby | |
| Peter J. Wilby (Principal Executive Officer) | ||
| President and Chief Executive Officer | ||
| Date: | February 7, 2020 |
I, Thomas M. Reynolds, Principal Financial Officer/Principal Accounting Officer of Stone Harbor Emerging Markets Income Fund certify that:
| 1. | I have reviewed this report on Form N-CSR of Stone Harbor Emerging Markets Income Fund (the “registrant”); |
| 2. | Based on my knowledge, this report does not contain any untrue statement of a material fact or omit to state a material fact necessary to make the statements made, in light of the circumstances under which such statements were made, not misleading with respect to the period covered by this report; |
| 3. | Based on my knowledge, the financial statements, and other financial information included in this report, fairly present in all material respects the financial condition, results of operations, changes in net assets, and cash flows (if the financial statements are required to include a statement of cash flows) of the registrant as of, and for, the periods presented in this report; |
| 4. | The registrant’s other certifying officer and I are responsible for establishing and maintaining disclosure controls and procedures (as defined in Rule 30a-3(c) under the Investment Company Act of 1940) and internal control over financial reporting (as defined in Rule 30a-3(d) under the Investment Company Act of 1940) for the registrant and have: |
| (a) | Designed such disclosure controls and procedures, or caused such disclosure controls and procedures to be designed under our supervision, to ensure that material information relating to the registrant, including its consolidated subsidiaries, is made known to us by others within those entities, particularly during the period in which this report is being prepared; |
| (b) | Designed such internal control over financial reporting, or caused such internal control over financial reporting to be designed under our supervision, to provide reasonable assurance regarding the reliability of financial reporting and the preparation of financial statements for external purposes in accordance with generally accepted accounting principles; |
| (c) | Evaluated the effectiveness of the registrant’s disclosure controls and procedures and presented in this report our conclusions about the effectiveness of the disclosure controls and procedures, as of a date within 90 days prior to the filing date of this report, based on such evaluation; and |
| (d) | Disclosed in this report any change in the registrant’s internal control over financial reporting that occurred during the period covered by this report that has materially affected, or is reasonably likely to materially affect, the registrant’s internal control over financial reporting; and |
| 5. | The registrant’s other certifying officer and I have disclosed to the registrant’s auditors and the audit committee of the registrant’s board of directors (or persons performing the equivalent functions): |
| (a) | All significant deficiencies and material weaknesses in the design or operation of internal control over financial reporting which are reasonably likely to adversely affect the registrant’s ability to record, process, summarize, and report financial information; and |
| (b) | Any fraud, whether or not material, that involves management or other employees who have a significant role in the registrant’s internal control over financial reporting. |
| By: | /s/ Thomas M. Reynolds | |
| Thomas M. Reynolds | ||
| Principal Financial Officer/Principal Accounting Officer | ||
| Date: | February 7, 2020 |
Exhibit 99.906Cert
This certification is furnished pursuant to Section 906 of the Sarbanes-Oxley Act of 2002, 18 U.S.C. § 1350, and accompanies the report on Form N-CSR (the “Report”) for the period ended November 30, 2019 of the Stone Harbor Emerging Markets Income Fund (the “Registrant”).
I, Peter J. Wilby, the President and Chief Executive Officer/Principal Executive Officer of the Registrant, certify that:
| (i) | the Report fully complies with the requirements of Section 13(a) or Section 15(d), as applicable, of the Securities Exchange Act of 1934 (15 U.S.C. 78m or 78o(d)); and |
| (ii) | the information contained in the Report fairly presents, in all material respects, the financial condition and results of operations of the Registrant. |
| Dated: | February 7, 2020 | |
| By: | /s/ Peter J. Wilby | |
| Peter J. Wilby (Principal Executive Officer) | ||
| President and Chief Executive Officer |
This certification is being furnished solely pursuant to Section
906 of the Sarbanes-Oxley Act of 2002 and is not being filed as part of the Form N-CSR or as a separate disclosure document. A
signed original of this written statement required by Section 906 has been provided to the Registrant and will be retained by the
Registrant and furnished to the Securities and Exchange Commission or its staff upon request.
This certification is furnished pursuant to Section 906 of the Sarbanes-Oxley Act of 2002, 18 U.S.C. § 1350, and accompanies the report on Form N-CSR (the “Report”) for the period ended November 30, 2019 of the Stone Harbor Emerging Markets Income Fund (the “Registrant”).
I, Thomas M. Reynolds, the Principal Financial Officer/Principal Accounting Officer of the Registrant, certify that:
| (i) | the Report fully complies with the requirements of Section 13(a) or Section 15(d), as applicable of the Securities Exchange Act of 1934 (15 U.S.C. 78m or 78o(d)); and |
| (ii) | the information contained in the Report fairly presents, in all material respects, the financial condition and results of operations of the Registrant. |
| Dated: | February 7, 2020 | |
| By: | /s/ Thomas M. Reynolds | |
| Thomas M. Reynolds | ||
| Principal Financial Officer/Principal Accounting Officer |
This certification is being furnished solely pursuant to Section 906 of the Sarbanes-Oxley Act of 2002 and is not being filed as part of the Form N-CSR or as a separate disclosure document. A signed original of this written statement required by Section 906 has been provided to the Registrant and will be retained by the Registrant and furnished to the Securities and Exchange Commission or its staff upon request.
Stone Harbor Investment Funds
Stone Harbor Closed-End Funds
Proxy Voting Policies And Procedures
Stone Harbor Investment Partners LP (“Stone Harbor” or the “Adviser”)-managed U.S. registered open-end investment companies (the “Stone Harbor Investment Funds”) and Stone Harbor-managed U.S. registered closed-end investment companies (the “Stone Harbor Closed-End Funds,” together with the Stone Harbor Investment Funds, the “Funds”) have adopted the following policies and procedures to determine how to vote proxies relating to portfolio securities held by each Fund.
| A. | Delegation |
The Board of Trustees of each Fund (the “Board of Trustees,” or the “Board”) has delegated to the Adviser the responsibility for voting proxies relating to portfolio securities held by a Fund as a part of the investment advisory services provided by the Adviser to the Fund. All such proxy voting responsibilities shall be subject to the Board’s continuing oversight. Notwithstanding this delegation of responsibilities for voting proxies, a Fund may revoke such delegation, in whole or in part, at any time.
| B. | Fiduciary Duty |
The Adviser is a fiduciary to each of the Funds and shall vote proxies in a manner consistent with the best interests of each such Fund and its shareholders. Every reasonable effort shall be made by the Adviser to vote the Funds’ proxies. However, the Adviser shall not be required to vote a proxy if it is not practicable to do so, or if it determines that the potential costs involved with voting a proxy outweigh the potential benefits to a Fund or its shareholders.
| C. | Proxy Voting Services |
Stone Harbor invests almost exclusively in fixed-income securities and votes a relatively small number of proxies in connection with equities generally received in reorganizations or through warrants. As a result, Stone Harbor has decided not to utilize a proxy voting advisory firm, and generally votes proxies on a case-by-case basis considering the interests of each Fund.
| D. | Conflicts of Interest |
The proxy voting guidelines of the Adviser addresses the procedures it follows with respect to conflicts of interest.
| E. | Annual Filing |
Each Fund shall file an annual report of each proxy voted with respect to portfolio securities of the Fund during the twelve-month period ended June 30 on Form N-PX not later than August 31 of each year.
| F. | Reports |
The Adviser shall report annually to the Board of Trustees with respect to the filing of Form N–PX with the Securities and Exchange Commission.
| G. | Role of the Board of Directors |
The Board of Trustees shall oversee the Adviser’s proxy voting processes and periodically review the Funds’ and the Adviser’s proxy voting policies and procedures. The Adviser shall notify the Board promptly of any material changes to the Adviser’s proxy voting policies and procedures.
Last Revised January 2020
2
STONE HARBOR EMERGING MARKETS INCOME FUND
Notification of Sources of Distribution
Statement Pursuant to Section 19(a) of the Investment Company Act of 1940
On June 27, 2019, the Stone Harbor Emerging Markets Income Fund (NYSE: EDF) (the “Fund”), a closed-end fund, will pay a monthly distribution on its common stock of $0.18 per share to shareholders of record at the close of business on June 17, 2019. The Fund, acting in accordance with an exemptive order received from the Securities and Exchange Commission and with approval of its Board of Trustees, adopted a managed distribution policy under which the Fund may utilize capital gains, where applicable, as part of regular monthly cash distributions to its shareholders. This policy gives the Fund greater flexibility to realize capital gains and to distribute those gains to shareholders.
The following table sets forth the estimated amounts of the current distribution and the cumulative distributions paid this fiscal year-to-date from the sources indicated in the table. In addition, the table shows the percentages of the total distribution amount per share attributable to (i) net investment income, (ii) net realized short-term capital gain, (iii) net realized long-term capital gain and (iv) return of capital or other capital source. These percentages are disclosed for the current distribution as well as the fiscal year-to-date cumulative distribution amount per share for the Fund.
| Current Distribution from: | ||
| Per Share ($) | % | |
| Net Investment Income | 0.0517 | 28.72% |
| Net Realized Short-Term Capital Gains | 0.0000 | 0.00% |
| Net Realized Long-Term Capital Gains | 0.0000 | 0.00% |
| Return of Capital or other Capital Source | 0.1283 | 71.28% |
| Total (per common share) | 0.1800 | 100.00% |
| Fiscal Year-to-Date Cumulative Distributions from1: | ||
| Per Share ($) | % | |
| Net Investment Income | 0.5788 | 45.94% |
| Net Realized Short-Term Capital Gains | 0.0000 | 0.00% |
| Net Realized Long-Term Capital Gains | 0.0000 | 0.00% |
| Return of Capital or other Capital Source | 0.6812 | 54.06% |
| Total (per common share) | 1.2600 | 100.00% |
Shareholders should not draw any conclusions about the Fund’s investment performance from the amount of this distribution or from the terms of the Fund’s managed distribution policy.
The Fund estimates that it has distributed more than its income and net realized capital gains, therefore, a portion of your distribution may be a return of capital. A return of capital may occur, for example, when some or all of the money that you invested in the Fund is paid back to you. A return of capital distribution does not necessarily reflect the Fund’s investment performance and should not be confused with ‘yield’ or ‘income’.
| 1 | The Fund’s fiscal year is December 1 to November 30. Information shown is for the period beginning December 1, 2018. |
The amounts and sources of distributions reported in this 19(a) Notice are only estimates, may change over time and are not being provided for tax reporting purposes. The actual amounts and sources of the amounts for tax reporting purposes will depend upon the Fund’s investment experience during the remainder of its fiscal year and may be subject to changes based on tax regulations. The Fund will send you a Form 1099-DIV for the calendar year that will tell you how to report these distributions for federal income tax purposes.
Presented below are return figures, based on the change in the Fund’s Net Asset Value per share (“NAV”), compared to the annualized distribution rate for this current distribution as a percentage of the NAV on the last day of the month prior to distribution declaration date.
Fund Performance & Distribution Information
| Annualized Distribution Rate as a Percentage of NAV^ | 21.56% |
| Cumulative Distribution Rate as a Percentage of NAV* | 12.57% |
| Cumulative Total Return as a Percentage of NAV** | 3.42% |
| Average Annual Total Return*** | 0.37% |
| ^ | Based on the Fund’s NAV as of May 31, 2019 and the June 27, 2019 distribution. |
| * | Based on the Fund’s NAV as of May 31, 2019 and includes distributions through June 27, 2019. |
| ** | Cumulative Total Return is the percentage change in the Fund’s NAV including distributions paid and assuming reinvestment of these distributions for the period December 1, 2018 through May 31, 2019. |
| *** | Average Annual Total Return represents the compound average of the Annual NAV Total Returns of the Fund for the five year period ending May 31, 2019. Annual NAV Total Return is the percentage change in the Fund’s NAV over a year including distributions paid and assuming reinvestment of these distributions. |
While the NAV performance may be indicative of the Fund’s investment performance, it does not measure the value of a shareholder’s investment in the Fund. The value of a shareholder’s investment in the Fund is determined by the Fund’s market price, which is based on the supply and demand for the Fund’s shares in the open market.
The Fund’s Board of Trustees reviews the amount of any distributions made pursuant to the Fund’s distribution policy and considers the income earned and capital gain realized by the Fund, as well as the Fund’s available capital. The Board of Trustees will continue to monitor the Fund’s distribution level, taking into consideration, among other things, the Fund’s net asset value and market conditions. The Fund’s distribution policy is subject to modification, suspension or termination by the Board of Trustees at any time, which could have an adverse effect on the market price of the Fund’s shares. The distribution rate should not be considered the dividend yield or total return on an investment in the Fund.
STONE HARBOR EMERGING MARKETS INCOME FUND
Notification of Sources of Distribution
Statement Pursuant to Section 19(a) of the Investment Company Act of 1940
On July 25, 2019, the Stone Harbor Emerging Markets Income Fund (NYSE: EDF) (the “Fund”), a closed-end fund, will pay a monthly distribution on its common stock of $0.18 per share to shareholders of record at the close of business on July 15, 2019. The Fund, acting in accordance with an exemptive order received from the Securities and Exchange Commission and with approval of its Board of Trustees, adopted a managed distribution policy under which the Fund may utilize capital gains, where applicable, as part of regular monthly cash distributions to its shareholders. This policy gives the Fund greater flexibility to realize capital gains and to distribute those gains to shareholders.
The following table sets forth the estimated amounts of the current distribution and the cumulative distributions paid this fiscal year-to-date from the sources indicated in the table. In addition, the table shows the percentages of the total distribution amount per share attributable to (i) net investment income, (ii) net realized short-term capital gain, (iii) net realized long-term capital gain and (iv) return of capital or other capital source. These percentages are disclosed for the current distribution as well as the fiscal year-to-date cumulative distribution amount per share for the Fund.
| Current Distribution from: | ||
| Per Share ($) | % | |
| Net Investment Income | 0.0715 | 39.72% |
| Net Realized Short-Term Capital Gains | 0.0000 | 0.00% |
| Net Realized Long-Term Capital Gains | 0.0000 | 0.00% |
| Return of Capital or other Capital Source | 0.1085 | 60.28% |
| Total (per common share) | 0.1800 | 100.00% |
| Fiscal Year-to-Date Cumulative Distributions from1: | ||
| Per Share ($) | % | |
| Net Investment Income | 0.6503 | 45.16% |
| Net Realized Short-Term Capital Gains | 0.0000 | 0.00% |
| Net Realized Long-Term Capital Gains | 0.0000 | 0.00% |
| Return of Capital or other Capital Source | 0.7897 | 54.84% |
| Total (per common share) | 1.4400 | 100.00% |
Shareholders should not draw any conclusions about the Fund’s investment performance from the amount of this distribution or from the terms of the Fund’s managed distribution policy.
The Fund estimates that it has distributed more than its income and net realized capital gains, therefore, a portion of your distribution may be a return of capital. A return of capital may occur, for example, when some or all of the money that you invested in the Fund is paid back to you. A return of capital distribution does not necessarily reflect the Fund’s investment performance and should not be confused with ‘yield’ or ‘income’.
| 1 | The Fund’s fiscal year is December 1 to November 30. Information shown is for the period beginning December 1, 2018. |
The amounts and sources of distributions reported in this 19(a) Notice are only estimates, may change over time and are not being provided for tax reporting purposes. The actual amounts and sources of the amounts for tax reporting purposes will depend upon the Fund’s investment experience during the remainder of its fiscal year and may be subject to changes based on tax regulations. The Fund will send you a Form 1099-DIV for the calendar year that will tell you how to report these distributions for federal income tax purposes.
Presented below are return figures, based on the change in the Fund’s Net Asset Value per share (“NAV”), compared to the annualized distribution rate for this current distribution as a percentage of the NAV on the last day of the month prior to distribution declaration date.
Fund Performance & Distribution Information
| Annualized Distribution Rate as a Percentage of NAV^ | 21.20% |
| Cumulative Distribution Rate as a Percentage of NAV* | 14.13% |
| Cumulative Total Return as a Percentage of NAV** | 8.65% |
| Average Annual Total Return*** | 1.10% |
| ^ | Based on the Fund’s NAV as of June 30, 2019 and the July 25, 2019 distribution. |
| * | Based on the Fund’s NAV as of June 30, 2019 and includes distributions through July 25, 2019. |
| ** | Cumulative Total Return is the percentage change in the Fund’s NAV including distributions paid and assuming reinvestment of these distributions at NAV for the period December 1, 2018 through June 30, 2019. |
| *** | Average Annual Total Return represents the compound average of the Annual NAV Total Returns of the Fund for the five year period ending June 30, 2019. Annual NAV Total Return is the percentage change in the Fund’s NAV over a year including distributions paid and assuming reinvestment of these distributions at NAV. |
While the NAV performance may be indicative of the Fund’s investment performance, it does not measure the value of a shareholder’s investment in the Fund. The value of a shareholder’s investment in the Fund is determined by the Fund’s market price, which is based on the supply and demand for the Fund’s shares in the open market.
The Fund’s Board of Trustees reviews the amount of any distributions made pursuant to the Fund’s distribution policy and considers the income earned and capital gain realized by the Fund, as well as the Fund’s available capital. The Board of Trustees will continue to monitor the Fund’s distribution level, taking into consideration, among other things, the Fund’s net asset value and market conditions. The Fund’s distribution policy is subject to modification, suspension or termination by the Board of Trustees at any time, which could have an adverse effect on the market price of the Fund’s shares. The distribution rate should not be considered the dividend yield or total return on an investment in the Fund.
STONE HARBOR EMERGING MARKETS INCOME FUND
Notification of Sources of Distribution
Statement Pursuant to Section 19(a) of the Investment Company Act of 1940
On August 29, 2019, the Stone Harbor Emerging Markets Income Fund (NYSE: EDF) (the “Fund”), a closed-end fund, will pay a monthly distribution on its common stock of $0.18 per share to shareholders of record at the close of business on August 19, 2019. The Fund, acting in accordance with an exemptive order received from the Securities and Exchange Commission and with approval of its Board of Trustees, adopted a managed distribution policy under which the Fund may utilize capital gains, where applicable, as part of regular monthly cash distributions to its shareholders. This policy gives the Fund greater flexibility to realize capital gains and to distribute those gains to shareholders.
The following table sets forth the estimated amounts of the current distribution and the cumulative distributions paid this fiscal year-to-date from the sources indicated in the table. In addition, the table shows the percentages of the total distribution amount per share attributable to (i) net investment income, (ii) net realized short-term capital gain, (iii) net realized long-term capital gain and (iv) return of capital or other capital source. These percentages are disclosed for the current distribution as well as the fiscal year-to-date cumulative distribution amount per share for the Fund.
| Current Distribution from: | ||
| Per Share ($) | % | |
| Net Investment Income | 0.0808 | 44.89% |
| Net Realized Short-Term Capital Gains | 0.0000 | 0.00% |
| Net Realized Long-Term Capital Gains | 0.0000 | 0.00% |
| Return of Capital or other Capital Source | 0.0992 | 55.11% |
| Total (per common share) | 0.1800 | 100.00% |
| Fiscal Year-to-Date Cumulative Distributions from1: | ||
| Per Share ($) | % | |
| Net Investment Income | 0.7311 | 45.13% |
| Net Realized Short-Term Capital Gains | 0.0000 | 0.00% |
| Net Realized Long-Term Capital Gains | 0.0000 | 0.00% |
| Return of Capital or other Capital Source | 0.8889 | 54.87% |
| Total (per common share) | 1.6200 | 100.00% |
Shareholders should not draw any conclusions about the Fund’s investment performance from the amount of this distribution or from the terms of the Fund’s managed distribution policy.
The Fund estimates that it has distributed more than its income and net realized capital gains, therefore, a portion of your distribution may be a return of capital. A return of capital may occur, for example, when some or all of the money that you invested in the Fund is paid back to you. A return of capital distribution does not necessarily reflect the Fund’s investment performance and should not be confused with ‘yield’ or ‘income’.
| 1 | The Fund’s fiscal year is December 1 to November 30. Information shown is for the period beginning December 1, 2018. |
The amounts and sources of distributions reported in this 19(a) Notice are only estimates, may change over time and are not being provided for tax reporting purposes. The actual amounts and sources of the amounts for tax reporting purposes will depend upon the Fund’s investment experience during the remainder of its fiscal year and may be subject to changes based on tax regulations. The Fund will send you a Form 1099-DIV for the calendar year that will tell you how to report these distributions for federal income tax purposes.
Presented below are return figures, based on the change in the Fund’s Net Asset Value per share (“NAV”), compared to the annualized distribution rate for this current distribution as a percentage of the NAV on the last day of the month prior to distribution declaration date.
Fund Performance & Distribution Information
| Annualized Distribution Rate as a Percentage of NAV^ | 21.16% |
| Cumulative Distribution Rate as a Percentage of NAV* | 15.87% |
| Cumulative Total Return as a Percentage of NAV** | 10.78% |
| Average Annual Total Return*** | 1.53% |
| ^ | Based on the Fund’s NAV as of July 31, 2019 and the August 29, 2019 distribution. |
| * | Based on the Fund’s NAV as of July 31, 2019 and includes distributions through August 29, 2019. |
| ** | Cumulative Total Return is the percentage change in the Fund’s NAV including distributions paid and assuming reinvestment of these distributions at NAV for the period December 1, 2018 through July 31, 2019. |
| *** | Average Annual Total Return represents the compound average of the Annual NAV Total Returns of the Fund for the five year period ending July 31, 2019. Annual NAV Total Return is the percentage change in the Fund’s NAV over a year including distributions paid and assuming reinvestment of these distributions at NAV. |
While the NAV performance may be indicative of the Fund’s investment performance, it does not measure the value of a shareholder’s investment in the Fund. The value of a shareholder’s investment in the Fund is determined by the Fund’s market price, which is based on the supply and demand for the Fund’s shares in the open market.
The Fund’s Board of Trustees reviews the amount of any distributions made pursuant to the Fund’s distribution policy and considers the income earned and capital gain realized by the Fund, as well as the Fund’s available capital. The Board of Trustees will continue to monitor the Fund’s distribution level, taking into consideration, among other things, the Fund’s net asset value and market conditions. The Fund’s distribution policy is subject to modification, suspension or termination by the Board of Trustees at any time, which could have an adverse effect on the market price of the Fund’s shares. The distribution rate should not be considered the dividend yield or total return on an investment in the Fund.
STONE HARBOR EMERGING MARKETS INCOME FUND
Notification of Sources of Distribution
Statement Pursuant to Section 19(a) of the Investment Company Act of 1940
On September 26, 2019, the Stone Harbor Emerging Markets Income Fund (NYSE: EDF) (the “Fund”), a closed-end fund, will pay a monthly distribution on its common stock of $0.18 per share to shareholders of record at the close of business on September 16, 2019. The Fund, acting in accordance with an exemptive order received from the Securities and Exchange Commission and with approval of its Board of Trustees, adopted a managed distribution policy under which the Fund may utilize capital gains, where applicable, as part of regular monthly cash distributions to its shareholders. This policy gives the Fund greater flexibility to realize capital gains and to distribute those gains to shareholders.
The following table sets forth the estimated amounts of the current distribution and the cumulative distributions paid this fiscal year-to-date from the sources indicated in the table. In addition, the table shows the percentages of the total distribution amount per share attributable to (i) net investment income, (ii) net realized short-term capital gain, (iii) net realized long-term capital gain and (iv) return of capital or other capital source. These percentages are disclosed for the current distribution as well as the fiscal year-to-date cumulative distribution amount per share for the Fund.
| Current Distribution from: | ||
| Per Share ($) | % | |
| Net Investment Income | 0.0515 | 28.61% |
| Net Realized Short-Term Capital Gains | 0.0000 | 0.00% |
| Net Realized Long-Term Capital Gains | 0.0000 | 0.00% |
| Return of Capital or other Capital Source | 0.1285 | 71.39% |
| Total (per common share) | 0.1800 | 100.00% |
| Fiscal Year-to-Date Cumulative Distributions from1: | ||
| Per Share ($) | % | |
| Net Investment Income | 0.7826 | 43.48% |
| Net Realized Short-Term Capital Gains | 0.0000 | 0.00% |
| Net Realized Long-Term Capital Gains | 0.0000 | 0.00% |
| Return of Capital or other Capital Source | 1.0174 | 56.52% |
| Total (per common share) | 1.8000 | 100.00% |
Shareholders should not draw any conclusions about the Fund’s investment performance from the amount of this distribution or from the terms of the Fund’s managed distribution policy.
The Fund estimates that it has distributed more than its income and net realized capital gains, therefore, a portion of your distribution may be a return of capital. A return of capital may occur, for example, when some or all of the money that you invested in the Fund is paid back to you. A return of capital distribution does not necessarily reflect the Fund’s investment performance and should not be confused with ‘yield’ or ‘income’.
| 1 | The Fund’s fiscal year is December 1 to November 30. Information shown is for the period beginning December 1, 2018. |
The amounts and sources of distributions reported in this 19(a) Notice are only estimates, may change over time and are not being provided for tax reporting purposes. The actual amounts and sources of the amounts for tax reporting purposes will depend upon the Fund’s investment experience during the remainder of its fiscal year and may be subject to changes based on tax regulations. The Fund will send you a Form 1099-DIV for the calendar year that will tell you how to report these distributions for federal income tax purposes.
Presented below are return figures, based on the change in the Fund’s Net Asset Value per share (“NAV”), compared to the annualized distribution rate for this current distribution as a percentage of the NAV on the last day of the month prior to distribution declaration date.
Fund Performance & Distribution Information
| Annualized Distribution Rate as a Percentage of NAV^ | 23.48% |
| Cumulative Distribution Rate as a Percentage of NAV* | 19.57% |
| Cumulative Total Return as a Percentage of NAV** | 1.71% |
| Average Annual Total Return*** | (0.15%) |
| ^ | Based on the Fund’s NAV as of August 31, 2019 and the September 26, 2019 distribution. |
| * | Based on the Fund’s NAV as of August 31, 2019 and includes distributions through September 26, 2019. |
| ** | Cumulative Total Return is the percentage change in the Fund’s NAV including distributions paid and assuming reinvestment of these distributions at NAV for the period December 1, 2018 through August 31, 2019. |
| *** | Average Annual Total Return represents the compound average of the Annual NAV Total Returns of the Fund for the five year period ending August 31, 2019. Annual NAV Total Return is the percentage change in the Fund’s NAV over a year including distributions paid and assuming reinvestment of these distributions at NAV. |
While the NAV performance may be indicative of the Fund’s investment performance, it does not measure the value of a shareholder’s investment in the Fund. The value of a shareholder’s investment in the Fund is determined by the Fund’s market price, which is based on the supply and demand for the Fund’s shares in the open market.
The Fund’s Board of Trustees reviews the amount of any distributions made pursuant to the Fund’s distribution policy and considers the income earned and capital gain realized by the Fund, as well as the Fund’s available capital. The Board of Trustees will continue to monitor the Fund’s distribution level, taking into consideration, among other things, the Fund’s net asset value and market conditions. The Fund’s distribution policy is subject to modification, suspension or termination by the Board of Trustees at any time, which could have an adverse effect on the market price of the Fund’s shares. The distribution rate should not be considered the dividend yield or total return on an investment in the Fund.
STONE HARBOR EMERGING MARKETS INCOME FUND
Notification of Sources of Distribution
Statement Pursuant to Section 19(a) of the Investment Company Act of 1940
On October 31, 2019, the Stone Harbor Emerging Markets Income Fund (NYSE: EDF) (the “Fund”), a closed-end fund, will pay a monthly distribution on its common stock of $0.18 per share to shareholders of record at the close of business on October 21, 2019. The Fund, acting in accordance with an exemptive order received from the Securities and Exchange Commission and with approval of its Board of Trustees, adopted a managed distribution policy under which the Fund may utilize capital gains, where applicable, as part of regular monthly cash distributions to its shareholders. This policy gives the Fund greater flexibility to realize capital gains and to distribute those gains to shareholders.
The following table sets forth the estimated amounts of the current distribution and the cumulative distributions paid this fiscal year-to-date from the sources indicated in the table. In addition, the table shows the percentages of the total distribution amount per share attributable to (i) net investment income, (ii) net realized short-term capital gain, (iii) net realized long-term capital gain and (iv) return of capital or other capital source. These percentages are disclosed for the current distribution as well as the fiscal year-to-date cumulative distribution amount per share for the Fund.
| Current Distribution from: | ||
| Per Share ($) | % | |
| Net Investment Income | 0.0625 | 34.72% |
| Net Realized Short-Term Capital Gains | 0.0000 | 0.00% |
| Net Realized Long-Term Capital Gains | 0.0000 | 0.00% |
| Return of Capital or other Capital Source | 0.1175 | 65.28% |
| Total (per common share) | 0.1800 | 100.00% |
| Fiscal Year-to-Date Cumulative Distributions from1: | ||
| Per Share ($) | % | |
| Net Investment Income | 0.8451 | 42.68% |
| Net Realized Short-Term Capital Gains | 0.0000 | 0.00% |
| Net Realized Long-Term Capital Gains | 0.0000 | 0.00% |
| Return of Capital or other Capital Source | 1.1349 | 57.32% |
| Total (per common share) | 1.9800 | 100.00% |
Shareholders should not draw any conclusions about the Fund’s investment performance from the amount of this distribution or from the terms of the Fund’s managed distribution policy.
The Fund estimates that it has distributed more than its income and net realized capital gains, therefore, a portion of your distribution may be a return of capital. A return of capital may occur, for example, when some or all of the money that you invested in the Fund is paid back to you. A return of capital distribution does not necessarily reflect the Fund’s investment performance and should not be confused with ‘yield’ or ‘income’.
| 1 | The Fund’s fiscal year is December 1 to November 30. Information shown is for the period beginning December 1, 2018. |
The amounts and sources of distributions reported in this 19(a) Notice are only estimates, may change over time and are not being provided for tax reporting purposes. The actual amounts and sources of the amounts for tax reporting purposes will depend upon the Fund’s investment experience during the remainder of its fiscal year and may be subject to changes based on tax regulations. The Fund will send you a Form 1099-DIV for the calendar year that will tell you how to report these distributions for federal income tax purposes.
Presented below are return figures, based on the change in the Fund’s Net Asset Value per share (“NAV”), compared to the annualized distribution rate for this current distribution as a percentage of the NAV on the last day of the month prior to distribution declaration date.
Fund Performance & Distribution Information
| Annualized Distribution Rate as a Percentage of NAV^ | 23.48% |
| Cumulative Distribution Rate as a Percentage of NAV* | 21.52% |
| Cumulative Total Return as a Percentage of NAV** | 3.70% |
| Average Annual Total Return*** | 1.57% |
| ^ | Based on the Fund’s NAV as of September 30, 2019 and the October 31, 2019 distribution. |
| * | Based on the Fund’s NAV as of September 30, 2019 and includes distributions through October 31, 2019. |
| ** | Cumulative Total Return is the percentage change in the Fund’s NAV including distributions paid and assuming reinvestment of these distributions at NAV for the period December 1, 2018 through September 30, 2019. |
| *** | Average Annual Total Return represents the compound average of the Annual NAV Total Returns of the Fund for the five year period ending September 30, 2019. Annual NAV Total Return is the percentage change in the Fund’s NAV over a year including distributions paid and assuming reinvestment of these distributions at NAV. |
While the NAV performance may be indicative of the Fund’s investment performance, it does not measure the value of a shareholder’s investment in the Fund. The value of a shareholder’s investment in the Fund is determined by the Fund’s market price, which is based on the supply and demand for the Fund’s shares in the open market.
The Fund’s Board of Trustees reviews the amount of any distributions made pursuant to the Fund’s distribution policy and considers the income earned and capital gain realized by the Fund, as well as the Fund’s available capital. The Board of Trustees will continue to monitor the Fund’s distribution level, taking into consideration, among other things, the Fund’s net asset value and market conditions. The Fund’s distribution policy is subject to modification, suspension or termination by the Board of Trustees at any time, which could have an adverse effect on the market price of the Fund’s shares. The distribution rate should not be considered the dividend yield or total return on an investment in the Fund.
STONE HARBOR EMERGING MARKETS INCOME FUND
Notification of Sources of Distribution
Statement Pursuant to Section 19(a) of the Investment Company Act of 1940
On November 21, 2019, the Stone Harbor Emerging Markets Income Fund (NYSE: EDF) (the “Fund”), a closed-end fund, will pay a monthly distribution on its common stock of $0.18 per share to shareholders of record at the close of business on November 8, 2019. The Fund, acting in accordance with an exemptive order received from the Securities and Exchange Commission and with approval of its Board of Trustees, adopted a managed distribution policy under which the Fund may utilize capital gains, where applicable, as part of regular monthly cash distributions to its shareholders. This policy gives the Fund greater flexibility to realize capital gains and to distribute those gains to shareholders.
The following table sets forth the estimated amounts of the current distribution and the cumulative distributions paid this fiscal year-to-date from the sources indicated in the table. In addition, the table shows the percentages of the total distribution amount per share attributable to (i) net investment income, (ii) net realized short-term capital gain, (iii) net realized long-term capital gain and (iv) return of capital or other capital source. These percentages are disclosed for the current distribution as well as the fiscal year-to-date cumulative distribution amount per share for the Fund.
| Current Distribution from: | ||
| Per Share ($) | % | |
| Net Investment Income | 0.0579 | 32.17% |
| Net Realized Short-Term Capital Gains | 0.0000 | 0.00% |
| Net Realized Long-Term Capital Gains | 0.0000 | 0.00% |
| Return of Capital or other Capital Source | 0.1221 | 67.83% |
| Total (per common share) | 0.1800 | 100.00% |
| Fiscal Year-to-Date Cumulative Distributions from1: | ||
| Per Share ($) | % | |
| Net Investment Income | 0.9030 | 41.81% |
| Net Realized Short-Term Capital Gains | 0.0000 | 0.00% |
| Net Realized Long-Term Capital Gains | 0.0000 | 0.00% |
| Return of Capital or other Capital Source | 1.2570 | 58.19% |
| Total (per common share) | 2.1600 | 100.00% |
Shareholders should not draw any conclusions about the Fund’s investment performance from the amount of this distribution or from the terms of the Fund’s managed distribution policy.
The Fund estimates that it has distributed more than its income and net realized capital gains, therefore, a portion of your distribution may be a return of capital. A return of capital may occur, for example, when some or all of the money that you invested in the Fund is paid back to you. A return of capital distribution does not necessarily reflect the Fund’s investment performance and should not be confused with ‘yield’ or ‘income’.
| 1 | The Fund’s fiscal year is December 1 to November 30. Information shown is for the period beginning December 1, 2018. |
The amounts and sources of distributions reported in this 19(a) Notice are only estimates, may change over time and are not being provided for tax reporting purposes. The actual amounts and sources of the amounts for tax reporting purposes will depend upon the Fund’s investment experience during the remainder of its fiscal year and may be subject to changes based on tax regulations. The Fund will send you a Form 1099-DIV for the calendar year that will tell you how to report these distributions for federal income tax purposes.
Presented below are return figures, based on the change in the Fund’s Net Asset Value per share (“NAV”), compared to the annualized distribution rate for this current distribution as a percentage of the NAV on the last day of the month prior to distribution declaration date.
Fund Performance & Distribution Information
| Annualized Distribution Rate as a Percentage of NAV^ | 23.50% |
| Cumulative Distribution Rate as a Percentage of NAV* | 23.50% |
| Cumulative Total Return as a Percentage of NAV** | 5.62% |
| Average Annual Total Return*** | 1.65% |
| ^ | Based on the Fund’s NAV as of October 31, 2019 and the November 21, 2019 distribution. |
| * | Based on the Fund’s NAV as of October 31, 2019 and includes distributions through November 21, 2019. |
| ** | Cumulative Total Return is the percentage change in the Fund’s NAV including distributions paid and assuming reinvestment of these distributions at NAV for the period December 1, 2018 through October 31, 2019. |
| *** | Average Annual Total Return represents the compound average of the Annual NAV Total Returns of the Fund for the five year period ending October 31, 2019. Annual NAV Total Return is the percentage change in the Fund’s NAV over a year including distributions paid and assuming reinvestment of these distributions at NAV. |
While the NAV performance may be indicative of the Fund’s investment performance, it does not measure the value of a shareholder’s investment in the Fund. The value of a shareholder’s investment in the Fund is determined by the Fund’s market price, which is based on the supply and demand for the Fund’s shares in the open market.
The Fund’s Board of Trustees reviews the amount of any distributions made pursuant to the Fund’s distribution policy and considers the income earned and capital gain realized by the Fund, as well as the Fund’s available capital. The Board of Trustees will continue to monitor the Fund’s distribution level, taking into consideration, among other things, the Fund’s net asset value and market conditions. The Fund’s distribution policy is subject to modification, suspension or termination by the Board of Trustees at any time, which could have an adverse effect on the market price of the Fund’s shares. The distribution rate should not be considered the dividend yield or total return on an investment in the Fund.