Form 8-K Nielsen Holdings plc For: Nov 07
Exhibit 99.1
|
News Release |
|
Investor Relations: Sara Gubins, +1 646 654 8153
Media Relations: Laura Nelson, +1 203 563 2929
NIELSEN REPORTS 3rd QUARTER 2019 RESULTS
|
|
• |
3Q Revenues Increased 1.0% on a Reported Basis; 3Q Revenues Increased 2.4% on a Constant Currency Basis |
|
|
• |
3Q GAAP Diluted Net Loss per Share of $1.33, 3Q Adjusted Earnings per Share of $0.51 |
|
|
• |
Non-Cash Impairment Charge for Nielsen Global Connect, Reflecting Strategic Review Inputs and Updated Valuation |
|
|
• |
Reiterating 2019 Revenue, Adjusted EBITDA, Free Cash Flow and Raising Adjusted EPS Guidance to $1.77-$1.83 |
|
|
• |
Concludes Comprehensive Strategic Review Process; Announces Plan to Spin-Off Global Connect Business |
New York, USA – November 7, 2019 – Today, Nielsen Holdings plc (NYSE: NLSN) announced its third quarter 2019 results, reaffirmed revenue, Adjusted EBITDA, and free cash flow guidance for 2019, and increased Adjusted EPS guidance for 2019. Separately, the Company announced today that its Board of Directors has concluded its previously announced review of strategic alternatives and has decided to separate the Global Media and Global Connect businesses through a spin-off of the Global Connect business.
David Kenny, Chief Executive Officer, commented, “We are pleased with our third quarter results. Both Media and Connect revenues were ahead of our expectations, reflecting strong execution as well as our focus on driving faster, bolder decisions to enhance value for Nielsen and for our clients. We also announced today the conclusion of our strategic review and our decision to separate Global Media and Global Connect. As we look forward, we remain focused on executing on our growth strategies and positioning both businesses to create value for our shareholders.”
Third Quarter 2019 Results
|
|
• |
3rd quarter revenues were $1,616 million, up 1.0%, or 2.4% on a constant currency basis, compared to the prior year. |
|
|
• |
Nielsen Global Media revenues increased 3.9% to $870 million, or 4.6% on a constant currency basis, compared to the prior year. |
|
|
• |
Audience Measurement revenues increased 4.2%, or 4.7% on a constant currency basis, primarily due to continued client adoption of our Total Audience Measurement system, partly offset by pressure in local television measurement. |
|
|
• |
Plan/Optimize revenues increased 3.3%, or 4.2% on a constant currency basis, driven in part by growth at Gracenote as expected, offset in part by pressure in Telecom. |
|
|
• |
Nielsen Global Connect revenues decreased 2.2% to $746 million, or flat on a constant currency basis, compared to the prior year. |
|
|
• |
Measure revenues decreased 2.8%, or 0.4% on a constant currency basis, reflecting stronger performance in retail measurement services and improved trends in Emerging Markets, offset by declines in Developed Markets. |
|
|
• |
Predict/Activate revenues decreased 0.9%, or an increase of 0.9% on a constant currency basis, reflecting an improvement in custom analytics, partly offset by pressure in innovation. |
|
|
• |
Net loss for the third quarter was $472 million, compared to net income of $96 million in the third quarter of 2018. Net loss per share on a diluted basis was $1.33 per share, compared to net income per share on a diluted basis of $0.27 for the third quarter of 2018. During the third quarter of 2019, the company recorded an impairment charge of $1,004 million, or $2.82 per share, related to the writedown of goodwill in our Connect segment as a result of our interim impairment assessment. Net loss was also impacted by a tax benefit related to the resolution of prior year audits and lower restructuring charges. |
|
|
• |
Adjusted earnings per share was $0.51 per share, compared to $0.45 per share in the prior year, driven by a lower effective tax rate and higher operating profit. |
|
|
• |
Adjusted EBITDA increased 1.1% to $476 million, or 1.7% on a constant currency basis, compared to the prior year. |
|
|
• |
Adjusted EBITDA margin increased 2 basis points to 29.5%, or a decrease of 20 basis points on a constant currency basis, compared to the prior year, as productivity initiatives were more than offset by investments in growth initiatives. |
Financial Position
|
|
• |
As of September 30, 2019, Nielsen’s cash and cash equivalents were $389 million and gross debt was $8,487 million. |
|
|
• |
Net debt (gross debt less cash and cash equivalents) was $8,098 million and Nielsen’s net debt leverage ratio was 4.38x at the end of the quarter. |
1
|
|
• |
Cash flow from operations increased to $413 million for the third quarter of 2019, from $387 million in the prior year. Cash flow performance was primarily driven by working capital timing and lower restructuring payments, partially offset by higher interest and tax payments. |
|
|
• |
Cash taxes were $63 million for the third quarter of 2019, compared to $35 million in the prior year. |
|
|
• |
Net capital expenditures were $112 million for the third quarter of 2019, compared to $121 million in the prior year. |
|
|
• |
Free cash flow for the third quarter of 2019 increased to $301 million, compared to $266 million in the prior year. |
Strategic Review Outcome
Separately, Nielsen announced today that it plans to spin-off the company's Global Connect business, creating two independent, publicly traded companies—the Global Media business and the Global Connect business—each of which will have sharper strategic focus and greater opportunity to leverage its unique competitive advantages. The strategic review was led by James Attwood, who had taken on the role of Executive Chairman of the Board. With the strategic review concluded, he will return to his role as Chairman of the Board. Please refer to the Company’s separate press release announcing the planned spin-off for further details.
Capital Allocation
Nielsen did not repurchase ordinary shares during the third quarter of 2019. The Company has a total of $228 million remaining for repurchases under the existing share repurchase program as of September 30, 2019.
In conjunction with the strategic review outcome, on November 3, 2019, the Board of Directors approved a reduction of the dividend, with the goal of strengthening the balance sheet and providing added flexibility to invest for growth. Beginning with the next dividend payment in December 2019, the Company will reduce its quarterly cash dividend payment to $0.06, from $0.35, per ordinary share. The dividend is payable on December 5, 2019, to shareholders of record at the close of business on November 21, 2019.
2019 Full Year Guidance
The Company is reiterating 2019 Revenue, Adjusted EBITDA, Free Cash Flow and raising Adjusted EPS guidance as highlighted below.
|
|
• |
Total revenue growth on a constant currency basis: Flat to +1.5% |
|
|
• |
Adjusted EBITDA margin: 28 - 29% |
|
|
• |
Adjusted EBITDA: $1,800 - $1,900 million |
|
|
• |
Adjusted earnings per share: $1.77 - $1.83 (previously $1.70 - $1.80) |
|
|
• |
Free cash flow: $525 - $575 million |
2019 Guidance Non-GAAP Reconciliations
The below table presents a reconciliation from forecasted revenue to revenue on a constant currency basis for our 2019 guidance:
|
(IN MILLIONS) |
|
2019 Guidance |
|
|
% Variance Constant Currency |
|
2018 Revenue Constant Currency |
|
||
|
Total Revenue |
|
$ |
~6,475 |
|
|
Flat to 1.5% |
|
$ |
6,430 |
|
The below table presents a reconciliation from Net Income/(Loss) to Adjusted EBITDA for our 2019 guidance:
|
(IN MILLIONS) |
|
|
|
Net income/(Loss) |
|
$(275) - $(215) |
|
Interest expense, net |
|
~400 |
|
Provision/(benefit) for income taxes |
|
~(300) |
|
Depreciation and amortization |
|
~750 |
|
Restructuring charges |
|
~90 |
|
Impairment of goodwill and other long-lived assets |
|
~1,000 |
|
Share-based compensation expense and Other |
|
~130 |
|
Adjusted EBITDA |
|
$1,800 – 1,900 |
2
The below table presents a reconciliation from Net Income/(Loss) Attributable to Nielsen Shareholders to Adjusted Net Income to calculate Adjusted Earnings per Share (diluted) for our revised 2019 guidance:
|
(IN MILLIONS EXCEPT PER SHARE AMOUNTS) |
|
|
|
|
Net income/(loss) attributable to Nielsen shareholders |
|
$(285) - $(235) |
|
|
Depreciation and amortization associated with acquisition-related tangible and intangible assets |
|
~200 |
|
|
Restructuring charges |
|
~90 |
|
|
Impairment of goodwill and other long-lived assets |
|
~1,000 |
|
|
Share-based compensation expense and Other |
|
~130 |
|
|
Tax effect of above items |
|
~(120) |
|
|
Discrete tax items |
|
~(400) |
|
|
Adjusted earnings |
|
$630 - $650 |
|
|
Adjusted earnings per share |
|
$1.77 – $1.83 |
|
|
|
|
|
|
The below table presents a reconciliation from Net Cash Provided by Operating Activities to Free Cash Flow for our 2019 guidance:
|
(IN MILLIONS) |
|
|
|
Net cash provided by operating activities |
|
$1,055 - $1,105 |
|
Less: Capital expenditures, net |
|
~(530) |
|
Free cash flow |
|
$525 - $575 |
Conference Call and Webcast
Nielsen will hold a conference call to discuss today’s announcements at 8:00 a.m. U.S. Eastern Time (ET) on November 7, 2019. The audio and slides for the call can be accessed live by webcast at http://nielsen.com/investors or by dialing +1-833-236-2755. Callers outside the U.S. can dial +1-647-689-4180.
A replay of the event will be available on Nielsen’s Investor Relations website, http://nielsen.com/investors, from 11:00 a.m. ET, November 7, 2019, until 11:59 p.m. ET, November 14, 2019. The replay can be accessed from within the U.S. by dialing +1-800-585-8367. Other callers can access the replay at +1-416-621-4642. The replay pass code is 8199309.
Forward-looking Statements
This news release includes information that could constitute forward-looking statements made pursuant to the safe harbor provision of the Private Securities Litigation Reform Act of 1995. These statements include those set forth above relating to those set forth above under “2019 Full Year Guidance,” those regarding our plan to spin-off the company’s Global Connect business as well as those that may be identified by words such as “will,” “intend,” “expect,” “anticipate,” “should,” “could” and similar expressions. These statements are subject to risks and uncertainties, and actual results and events could differ materially from what presently is expected. Factors leading thereto may include, without limitation, the expected benefits and costs of the spin-off transaction, the expected timing of completion of the spin-off transaction, the ability of Nielsen to complete the spin-off transaction considering the various conditions to the completion of the spin-off transaction (some of which are outside Nielsen’s control, including those conditions related to regulatory approvals), business disruption during the pendency of or following the spin-off transaction, diversion of management time on the spin-off transaction-related issues, failure to receive the required shareholder approval of the spin-off transaction, retention of existing management team members, the reaction of customers and other parties to the spin-off transaction, the qualification of the spin-off transaction as a tax-free transaction for U.S. federal income tax purposes (including whether or not an IRS ruling will be sought or obtained), potential dissynergy costs between Nielsen Global Connect and Nielsen Global Media, the impact of the spin-off transaction on relationships with customers, suppliers, employees and other business counterparties, general economic conditions, conditions in the markets Nielsen is engaged in, behavior of customers, suppliers and competitors, technological developments, as well as legal and regulatory rules affecting Nielsen’s business and other specific risk factors that are outlined in our disclosure filings and materials, which you can find on http://www.nielsen.com/investors, such as our 10-K, 10-Q and 8-K reports that have been filed with the Securities and Exchange Commission. Please consult these documents for a more complete understanding of these risks and uncertainties. This list of factors is not intended to be exhaustive. Such forward-looking statements only speak as of the date of this press release, and we assume no obligation to update any written or oral forward-looking statement made by us or on our behalf as a result of new information, future events or other factors, except as required by law.
3
About Nielsen
Nielsen Holdings plc (NYSE: NLSN) is a global measurement and data analytics company that provides the most complete and trusted view available of consumers and markets worldwide. Our approach marries proprietary Nielsen data with other data sources to help clients around the world understand what’s happening now, what’s happening next, and how to best act on this knowledge. For more than 90 years Nielsen has provided data and analytics based on scientific rigor and innovation, continually developing new ways to answer the most important questions facing the media, advertising, retail and fast-moving consumer goods industries. An S&P 500 company, Nielsen has operations in over 100 countries, covering more than 90% of the world’s population. For more information, visit www.nielsen.com.
From time to time, Nielsen may use its website and social media outlets as channels of distribution of material company information. Financial and other material information regarding the company is routinely posted and accessible on our website at http://www.nielsen.com/investors and our Twitter account at http://twitter.com/Nielsen.
4
Results of Operations—(Three and Nine Months Ended September 30, 2019 and 2018)
The following table sets forth, for the periods indicated, the amounts included in our condensed consolidated statements of operations:
|
|
|
Three Months Ended September 30, (Unaudited) |
|
|
Nine Months Ended September 30, (Unaudited) |
|
||||||||||
|
(IN MILLIONS, EXCEPT SHARE AND PER SHARE DATA) |
|
2019 |
|
|
2018 |
|
|
2019 |
|
|
2018 |
|
||||
|
Revenues |
|
$ |
1,616 |
|
|
$ |
1,600 |
|
|
$ |
4,807 |
|
|
$ |
4,857 |
|
|
Cost of revenues |
|
|
694 |
|
|
|
681 |
|
|
|
2,088 |
|
|
|
2,098 |
|
|
Selling, general and administrative expenses |
|
|
467 |
|
|
|
464 |
|
|
|
1,430 |
|
|
|
1,451 |
|
|
Depreciation and amortization (1) |
|
|
186 |
|
|
|
175 |
|
|
|
550 |
|
|
|
504 |
|
|
Impairment of goodwill and other long-lived assets |
|
|
1,004 |
|
|
|
- |
|
|
|
1,004 |
|
|
|
- |
|
|
Restructuring charges |
|
|
5 |
|
|
|
19 |
|
|
|
52 |
|
|
|
108 |
|
|
Operating income/(loss) |
|
|
(740 |
) |
|
|
261 |
|
|
|
(317 |
) |
|
|
696 |
|
|
Interest income |
|
|
1 |
|
|
|
2 |
|
|
|
4 |
|
|
|
6 |
|
|
Interest expense |
|
|
(100 |
) |
|
|
(99 |
) |
|
|
(299 |
) |
|
|
(295 |
) |
|
Foreign currency exchange transaction gains/(losses), net |
|
|
(6 |
) |
|
|
(8 |
) |
|
|
(10 |
) |
|
|
(12 |
) |
|
Other income/(expense), net |
|
|
(3 |
) |
|
|
1 |
|
|
|
2 |
|
|
|
(3 |
) |
|
Income/(loss) from continuing operations before income taxes and equity in net income/(loss) of affiliates |
|
|
(848 |
) |
|
|
157 |
|
|
|
(620 |
) |
|
|
392 |
|
|
Benefit/(provision) for income taxes |
|
|
380 |
|
|
|
(59 |
) |
|
|
325 |
|
|
|
(142 |
) |
|
Equity in net income/(loss) of affiliates |
|
|
- |
|
|
|
- |
|
|
|
- |
|
|
|
(1 |
) |
|
Net income/(loss) |
|
|
(468 |
) |
|
|
98 |
|
|
|
(295 |
) |
|
|
249 |
|
|
Net income/(loss) attributable to noncontrolling interests |
|
|
4 |
|
|
|
2 |
|
|
|
11 |
|
|
|
9 |
|
|
Net income/(loss) attributable to Nielsen shareholders |
|
$ |
(472 |
) |
|
$ |
96 |
|
|
$ |
(306 |
) |
|
$ |
240 |
|
|
Net income/(loss) per share of common stock, basic |
|
|
|
|
|
|
|
|
|
|
|
|
|
|
|
|
|
Net income/(loss) attributable to Nielsen shareholders |
|
$ |
(1.33 |
) |
|
$ |
0.27 |
|
|
$ |
(0.86 |
) |
|
$ |
0.67 |
|
|
Net income/(loss) per share of common stock, diluted |
|
|
|
|
|
|
|
|
|
|
|
|
|
|
|
|
|
Net income/(loss) attributable to Nielsen shareholders |
|
$ |
(1.33 |
) |
|
$ |
0.27 |
|
|
$ |
(0.86 |
) |
|
$ |
0.67 |
|
|
Weighted-average shares of common stock outstanding, basic |
|
|
355,779,274 |
|
|
|
354,993,315 |
|
|
|
355,620,821 |
|
|
|
355,737,081 |
|
|
Dilutive shares of common stock |
|
|
- |
|
|
|
568,389 |
|
|
|
- |
|
|
|
661,438 |
|
|
Weighted-average shares of common stock outstanding, diluted |
|
|
355,779,274 |
|
|
|
355,561,704 |
|
|
|
355,620,821 |
|
|
|
356,398,519 |
|
|
(1) |
Depreciation and amortization associated with tangible and intangible assets acquired in business combinations were $49 million and $156 million, respectively, for the three and nine months ended September 30, 2019 and $55 million and $167 million, respectively, for the three and nine months ended September 30, 2018. |
5
Condensed Consolidated Balance Sheets
|
|
|
September 30, |
|
|
December 31, |
|
||
|
(IN MILLIONS, EXCEPT SHARE AND PER SHARE DATA) |
|
2019 |
|
|
2018 |
|
||
|
|
|
(Unaudited) |
|
|
|
|
|
|
|
Assets: |
|
|
|
|
|
|
|
|
|
Current assets |
|
|
|
|
|
|
|
|
|
Cash and cash equivalents |
|
$ |
389 |
|
|
$ |
524 |
|
|
Trade and other receivables, net of allowances for doubtful accounts and sales returns of $27 and $31 as of September 30, 2019 and December 31, 2018, respectively |
|
|
1,146 |
|
|
|
1,118 |
|
|
Prepaid expenses and other current assets |
|
|
412 |
|
|
|
361 |
|
|
Total current assets |
|
|
1,947 |
|
|
|
2,003 |
|
|
Non-current assets |
|
|
|
|
|
|
|
|
|
Property, plant and equipment, net |
|
|
423 |
|
|
|
468 |
|
|
Operating lease right-of-use asset |
|
|
425 |
|
|
|
— |
|
|
Goodwill |
|
|
5,973 |
|
|
|
6,987 |
|
|
Other intangible assets, net |
|
|
4,911 |
|
|
|
5,024 |
|
|
Deferred tax assets |
|
|
322 |
|
|
|
333 |
|
|
Other non-current assets |
|
|
342 |
|
|
|
364 |
|
|
Total assets |
|
$ |
14,343 |
|
|
$ |
15,179 |
|
|
Liabilities and equity: |
|
|
|
|
|
|
|
|
|
Current liabilities |
|
|
|
|
|
|
|
|
|
Accounts payable and other current liabilities |
|
$ |
1,087 |
|
|
$ |
1,119 |
|
|
Deferred revenues |
|
|
316 |
|
|
|
355 |
|
|
Income tax liabilities |
|
|
74 |
|
|
|
76 |
|
|
Current portion of long-term debt, finance lease obligations and short-term borrowings |
|
|
298 |
|
|
|
107 |
|
|
Total current liabilities |
|
|
1,775 |
|
|
|
1,657 |
|
|
Non-current liabilities |
|
|
|
|
|
|
|
|
|
Long-term debt and finance lease obligations |
|
|
8,189 |
|
|
|
8,280 |
|
|
Deferred tax liabilities |
|
|
1,068 |
|
|
|
1,108 |
|
|
Operating lease liabilities |
|
|
393 |
|
|
|
— |
|
|
Other non-current liabilities |
|
|
565 |
|
|
|
1,091 |
|
|
Total liabilities |
|
|
11,990 |
|
|
|
12,136 |
|
|
Commitments and contingencies (Note 13) |
|
|
|
|
|
|
|
|
|
Equity: |
|
|
|
|
|
|
|
|
|
Nielsen shareholders’ equity |
|
|
|
|
|
|
|
|
|
Common stock, €0.07 par value, 1,185,800,000 and 1,185,800,000 shares authorized, 355,819,078 and 355,323,822 shares issued and 355,810,261 and 355,271,737 shares outstanding at September 30, 2019 and December 31, 2018, respectively |
|
|
32 |
|
|
|
32 |
|
|
Additional paid-in capital |
|
|
4,390 |
|
|
|
4,720 |
|
|
Retained earnings/(accumulated deficit) |
|
|
(1,101 |
) |
|
|
(795 |
) |
|
Accumulated other comprehensive loss, net of income taxes |
|
|
(1,166 |
) |
|
|
(1,110 |
) |
|
Total Nielsen shareholders’ equity |
|
|
2,155 |
|
|
|
2,847 |
|
|
Noncontrolling interests |
|
|
198 |
|
|
|
196 |
|
|
Total equity |
|
|
2,353 |
|
|
|
3,043 |
|
|
Total liabilities and equity |
|
$ |
14,343 |
|
|
$ |
15,179 |
|
6
Condensed Consolidated Statements of Cash Flows (Unaudited)
|
|
|
Nine Months Ended |
|
|||||
|
|
|
September 30, |
|
|||||
|
(IN MILLIONS) |
|
2019 |
|
|
2018 |
|
||
|
Operating Activities |
|
|
|
|
|
|
|
|
|
Net income/(loss) |
|
$ |
(295 |
) |
|
$ |
249 |
|
|
Adjustments to reconcile net income/(loss) to net cash provided by operating activities: |
|
|
|
|
|
|
|
|
|
Share-based compensation expense |
|
|
39 |
|
|
|
21 |
|
|
Currency exchange rate differences on financial transactions and other (gains)/losses |
|
|
7 |
|
|
|
11 |
|
|
Equity in net loss of affiliates, net of dividends received |
|
|
1 |
|
|
|
2 |
|
|
Depreciation and amortization |
|
|
550 |
|
|
|
504 |
|
|
Impairment of goodwill and other long-lived assets |
|
|
1,004 |
|
|
|
— |
|
|
Changes in operating assets and liabilities, net of effect of businesses acquired and divested: |
|
|
|
|
|
|
|
|
|
Trade and other receivables, net |
|
|
(57 |
) |
|
|
(48 |
) |
|
Prepaid expenses and other assets |
|
|
9 |
|
|
|
(70 |
) |
|
Accounts payable and other current liabilities and deferred revenues |
|
|
(157 |
) |
|
|
(190 |
) |
|
Other non-current liabilities |
|
|
(48 |
) |
|
|
(6 |
) |
|
Interest payable |
|
|
49 |
|
|
|
53 |
|
|
Income taxes |
|
|
(506 |
) |
|
|
(14 |
) |
|
Net cash provided by/(used in) operating activities |
|
|
596 |
|
|
|
512 |
|
|
Investing Activities |
|
|
|
|
|
|
|
|
|
Acquisition of subsidiaries and affiliates, net of cash acquired |
|
|
(62 |
) |
|
|
(39 |
) |
|
Additions to property, plant and equipment and other assets |
|
|
(58 |
) |
|
|
(66 |
) |
|
Additions to intangible assets |
|
|
(284 |
) |
|
|
(305 |
) |
|
Proceeds from the sale of property, plant and equipment and other assets |
|
|
— |
|
|
|
4 |
|
|
Other investing activities |
|
|
(18 |
) |
|
|
3 |
|
|
Net cash provided by/(used in) investing activities |
|
|
(422 |
) |
|
|
(403 |
) |
|
Financing Activities |
|
|
|
|
|
|
|
|
|
Net borrowings under revolving credit facility |
|
|
190 |
|
|
|
204 |
|
|
Proceeds from issuances of debt, net of issuance costs |
|
|
— |
|
|
|
781 |
|
|
Repayment of debt |
|
|
(43 |
) |
|
|
(805 |
) |
|
Increase/(decrease) in other short-term borrowings |
|
|
(1 |
) |
|
|
1 |
|
|
Cash dividends paid to shareholders |
|
|
(373 |
) |
|
|
(370 |
) |
|
Repurchase of common stock |
|
|
— |
|
|
|
(70 |
) |
|
Activity from share-based compensation plans |
|
|
(5 |
) |
|
|
17 |
|
|
Proceeds from employee stock purchase plan |
|
|
3 |
|
|
|
4 |
|
|
Finance leases |
|
|
(44 |
) |
|
|
(60 |
) |
|
Other financing activities |
|
|
(17 |
) |
|
|
(15 |
) |
|
Net cash provided by/(used in) financing activities |
|
|
(290 |
) |
|
|
(313 |
) |
|
Effect of exchange-rate changes on cash and cash equivalents |
|
|
(19 |
) |
|
|
(6 |
) |
|
Net increase/(decrease) in cash and cash equivalents |
|
|
(135 |
) |
|
|
(210 |
) |
|
Cash and cash equivalents at beginning of period |
|
|
524 |
|
|
|
656 |
|
|
Cash and cash equivalents at end of period |
|
$ |
389 |
|
|
$ |
446 |
|
|
Supplemental Cash Flow Information |
|
|
|
|
|
|
|
|
|
Cash paid for income taxes |
|
$ |
(181 |
) |
|
$ |
(156 |
) |
|
Cash paid for interest, net of amounts capitalized |
|
$ |
(250 |
) |
|
$ |
(242 |
) |
Certain Non-GAAP Measures
We use the non-GAAP financial measures discussed below to evaluate our results of operations, financial condition, liquidity and indebtedness. We believe that the presentation of these non-GAAP measures provides useful information to investors regarding financial and business trends related to our results of operations, cash flows and indebtedness and that, when this non-GAAP financial information is viewed with our GAAP financial information, investors are provided with valuable supplemental information regarding our results of operations, thereby facilitating period-to-period comparisons of our business performance and is consistent with how management evaluates the company’s operating performance and liquidity. In addition, these non-GAAP measures address questions the Company routinely receives from analysts and investors, and in order to assure that all investors have access to similar data, the Company has determined that it is appropriate to make this data available to all investors. None of the non-GAAP measures presented should be considered as an alternative to net income or loss, operating income or loss,
7
cash flows from operating activities, total indebtedness or any other measures of operating performance and financial condition, liquidity or indebtedness derived in accordance with GAAP. These non-GAAP measures have important limitations as analytical tools and should not be considered in isolation or as substitutes for an analysis of our results as reported under GAAP. Our use of these terms may vary from the use of similarly-titled measures by others in our industry due to the potential inconsistencies in the method of calculation and differences due to items subject to interpretation.
Constant Currency Presentation
We evaluate our results of operations on both an as reported and a constant currency basis. The constant currency presentation, which is a non-GAAP measure, excludes the impact of fluctuations in foreign currency exchange rates. We believe providing constant currency information provides valuable supplemental information regarding our results of operations, thereby facilitating period-to-period comparisons of our business performance and is consistent with how management evaluates the Company’s performance. We calculate constant currency percentages by converting our prior-period local currency financial results using the current period exchange rates and comparing these adjusted amounts to our current period reported results. No adjustment has been made to foreign currency exchange transaction gains or losses in the calculation of constant currency net income.
Organic Constant Currency Presentation
We define organic constant currency revenue as constant currency revenue excluding the net effect of business acquisitions and divestitures over the past 12 months. Refer to the Constant Currency Presentation section above for the definition of constant currency. We believe that this measure is useful to investors and management in understanding our ongoing operations and in analysis of ongoing operating trends.
The below table presents a reconciliation from revenue on a reported basis to revenue on a constant currency basis and organic constant currency basis for the three and nine months ended September 30, 2019.
|
(IN MILLIONS) (UNAUDITED) |
|
Three Months Ended September 30, 2019 Reported |
|
|
Three Months Ended September 30, 2018 Reported |
|
|
% Variance 2019 vs. 2018 Reported |
|
|
Three Months Ended September 30, 2018 Constant Currency |
|
|
% Variance 2019 vs. 2018 Constant Currency |
|
|
Three Months Ended September 30, 2019 Organic |
|
|
Three Months Ended September 30, 2018 Organic Constant Currency |
|
|
% Variance 2019 vs. 2018 Organic Constant Currency |
|
||||||||
|
|
|
|
|
|
|
|
|
|
|
|
|
|
|
|
|
|
|
|
|
|
|
|
|
|
|
|
|
|
|
|
|
|
|
Revenues by |
|
|
|
|
|
|
|
|
|
|
|
|
|
|
|
|
|
|
|
|
|
|
|
|
|
|
|
|
|
|
|
|
|
Measure |
|
$ |
530 |
|
|
$ |
545 |
|
|
|
(2.8 |
)% |
|
$ |
532 |
|
|
|
(0.4 |
)% |
|
$ |
528 |
|
|
$ |
532 |
|
|
|
(0.8 |
)% |
|
Predict/Activate |
|
|
216 |
|
|
|
218 |
|
|
|
(0.9 |
)% |
|
|
214 |
|
|
|
0.9 |
% |
|
|
214 |
|
|
|
211 |
|
|
|
1.4 |
% |
|
Connect |
|
$ |
746 |
|
|
$ |
763 |
|
|
|
(2.2 |
)% |
|
$ |
746 |
|
|
|
0.0 |
% |
|
$ |
742 |
|
|
$ |
743 |
|
|
|
(0.1 |
)% |
|
|
|
|
|
|
|
|
|
|
|
|
|
|
|
|
|
|
|
|
|
|
|
|
|
|
|
|
|
|
|
|
|
|
|
Audience |
|
$ |
621 |
|
|
$ |
596 |
|
|
|
4.2 |
% |
|
$ |
593 |
|
|
|
4.7 |
% |
|
$ |
620 |
|
|
$ |
593 |
|
|
|
4.6 |
% |
|
Plan/Optimize |
|
|
249 |
|
|
|
241 |
|
|
|
3.3 |
% |
|
|
239 |
|
|
|
4.2 |
% |
|
|
243 |
|
|
|
239 |
|
|
|
1.7 |
% |
|
Media |
|
$ |
870 |
|
|
$ |
837 |
|
|
|
3.9 |
% |
|
$ |
832 |
|
|
|
4.6 |
% |
|
$ |
863 |
|
|
$ |
832 |
|
|
|
3.7 |
% |
|
Total |
|
$ |
1,616 |
|
|
$ |
1,600 |
|
|
|
1.0 |
% |
|
$ |
1,578 |
|
|
|
2.4 |
% |
|
$ |
1,605 |
|
|
$ |
1,575 |
|
|
|
1.9 |
% |
8
|
(IN MILLIONS) (UNAUDITED) |
|
Nine Months Ended September 30, 2019 Reported |
|
|
Nine Months Ended September 30, 2018 Reported |
|
|
% Variance 2019 vs. 2018 Reported |
|
|
Nine Months Ended September 30 2018 Constant Currency |
|
|
% Variance 2019 vs. 2018 Constant Currency |
|
|
Nine Months Ended September 30, 2019 Organic |
|
|
Nine Months Ended September 30, 2018 Organic Constant Currency |
|
|
% Variance 2019 vs. 2018 Organic Constant Currency |
|
||||||||
|
|
|
|
|
|
|
|
|
|
|
|
|
|
|
|
|
|
|
|
|
|
|
|
|
|
|
|
|
|
|
|
|
|
|
Revenues by |
|
|
|
|
|
|
|
|
|
|
|
|
|
|
|
|
|
|
|
|
|
|
|
|
|
|
|
|
|
|
|
|
|
Measure |
|
$ |
1,615 |
|
|
$ |
1,668 |
|
|
|
(3.2 |
)% |
|
$ |
1,599 |
|
|
|
1.0 |
% |
|
$ |
1,612 |
|
|
$ |
1,599 |
|
|
|
0.8 |
% |
|
Predict/Activate |
|
|
640 |
|
|
|
681 |
|
|
|
(6.0 |
)% |
|
|
658 |
|
|
|
(2.7 |
)% |
|
|
633 |
|
|
|
649 |
|
|
|
(2.5 |
)% |
|
Connect |
|
$ |
2,255 |
|
|
$ |
2,349 |
|
|
|
(4.0 |
)% |
|
$ |
2,257 |
|
|
|
(0.1 |
)% |
|
$ |
2,245 |
|
|
$ |
2,248 |
|
|
|
(0.1 |
)% |
|
|
|
|
|
|
|
|
|
|
|
|
|
|
|
|
|
|
|
|
|
|
|
|
|
|
|
|
|
|
|
|
|
|
|
Audience |
|
$ |
1,848 |
|
|
$ |
1,793 |
|
|
|
3.1 |
% |
|
$ |
1,782 |
|
|
|
3.7 |
% |
|
$ |
1,844 |
|
|
$ |
1,782 |
|
|
|
3.5 |
% |
|
Plan/Optimize |
|
|
704 |
|
|
|
715 |
|
|
|
(1.5 |
)% |
|
|
704 |
|
|
|
0.0 |
% |
|
|
684 |
|
|
|
704 |
|
|
|
(2.8 |
)% |
|
Media |
|
$ |
2,552 |
|
|
$ |
2,508 |
|
|
|
1.8 |
% |
|
$ |
2,486 |
|
|
|
2.7 |
% |
|
$ |
2,528 |
|
|
$ |
2,486 |
|
|
|
1.7 |
% |
|
Total |
|
$ |
4,807 |
|
|
$ |
4,857 |
|
|
|
(1.0 |
)% |
|
$ |
4,743 |
|
|
|
1.3 |
% |
|
$ |
4,773 |
|
|
$ |
4,734 |
|
|
|
0.8 |
% |
The below table presents a reconciliation of Net Income and Adjusted EBITDA on a reported basis to a constant currency basis for the three and nine months ended September 30, 2019.
|
(IN MILLIONS) (UNAUDITED) |
|
Three |
|
|
Three |
|
|
% Variance |
|
|
Three |
|
|
% Variance |
|
|||||
|
Net Income/(Loss) attributable to Nielsen Shareholders |
|
$ |
(472 |
) |
|
$ |
96 |
|
|
|
(591.7) |
% |
|
$ |
94 |
|
|
|
(602.1) |
% |
|
|
|
|
|
|
|
|
|
|
|
|
|
|
|
|
|
|
|
|
|
|
|
Adjusted EBITDA |
|
$ |
476 |
|
|
$ |
471 |
|
|
|
1.1 |
% |
|
$ |
468 |
|
|
|
1.7 |
% |
|
(IN MILLIONS) (UNAUDITED) |
|
Nine |
|
|
Nine |
|
|
% Variance |
|
|
Nine |
|
|
% Variance |
|
|||||
|
Net Income/(Loss) attributable to Nielsen Shareholders |
|
$ |
(306 |
) |
|
$ |
240 |
|
|
|
(227.5) |
% |
|
$ |
226 |
|
|
|
(235.4) |
% |
|
|
|
|
|
|
|
|
|
|
|
|
|
|
|
|
|
|
|
|
|
|
|
Adjusted EBITDA |
|
$ |
1,361 |
|
|
$ |
1,362 |
|
|
|
(0.1 |
)% |
|
$ |
1,342 |
|
|
|
1.4 |
% |
Adjusted EBITDA
We define Adjusted EBITDA as net income or loss from our consolidated statements of operations before interest income and expense, income taxes, depreciation and amortization, restructuring charges, impairment of goodwill and other long-lived assets, share-based compensation expense and other non-operating items from our consolidated statements of operations, as well as certain other items that arise outside the ordinary course of our continuing operations specifically described below.
Restructuring charges: We exclude restructuring expenses, which primarily include employee severance, office consolidation and contract termination charges, from our Adjusted EBITDA to allow more accurate comparisons of the financial results to historical operations and forward-looking guidance. By excluding these expenses from our non-GAAP measures, management is better able to evaluate our ability to utilize our existing assets and estimate the long-term value these assets will generate for us. Furthermore, we believe that the adjustments of these items more closely correlate with the sustainability of our operating performance.
Impairment of goodwill and other long-lived assets: We exclude the impact of charges related to the impairment of goodwill and other long-lived assets. We believe that the exclusion of these impairments, which are non-cash, allows for more meaningful comparisons of
9
operating results to peer companies. We believe that this increases period-to-period comparability and is useful to evaluate the performance of the total company.
Share-based compensation expense: We exclude the impact of costs relating to share-based compensation. Due to the subjective assumptions and a variety of award types, we believe that the exclusion of share-based compensation expense, which is typically non-cash, allows for more meaningful comparisons of operating results to peer companies. Share-based compensation expense can vary significantly based on the timing, size and nature of awards granted.
Other non-operating expenses, net: We exclude foreign currency exchange transaction gains and losses primarily related to intercompany financing arrangements as well as other non-operating income and expense items, such as, gains and losses recorded on business combinations or dispositions, sales of investments, net income attributable to noncontrolling interests and early redemption payments made in connection with debt refinancing. We believe that the adjustments of these items more closely correlate with the sustainability of our operating performance.
Other items: To measure operating performance, we exclude certain expenses and gains that arise outside the ordinary course of our continuing operations. Such costs primarily include legal settlements, acquisition related expenses, business optimization costs and other transaction costs. We believe the exclusion of such amounts allows management and the users of the financial statements to better understand our financial results.
Adjusted EBITDA is not a presentation made in accordance with GAAP, and our use of the term Adjusted EBITDA may vary from the use of similarly-titled measures by others in our industry due to the potential inconsistencies in the method of calculation and differences due to items subject to interpretation. Adjusted EBITDA margin is Adjusted EBITDA for a particular period expressed as a percentage of revenues for that period.
We use Adjusted EBITDA to measure our performance from period to period both at the consolidated level as well as within our operating segments, to evaluate and fund incentive compensation programs and to compare our results to those of our competitors. In addition to Adjusted EBITDA being a significant measure of performance for management purposes, we also believe that this presentation provides useful information to investors regarding financial and business trends related to our results of operations and that when non-GAAP financial information is viewed with GAAP financial information, investors are provided with a more meaningful understanding of our ongoing operating performance.
Adjusted EBITDA should not be considered as an alternative to net income or loss, operating income, cash flows from operating activities or any other performance measures derived in accordance with GAAP as measures of operating performance or cash flows as measures of liquidity. Adjusted EBITDA has important limitations as an analytical tool and should not be considered in isolation or as a substitute for analysis of our results as reported under GAAP.
Adjusted Earnings per Share
We define Adjusted Earnings per Share as net income attributable to Nielsen shareholders per share (diluted) from continuing operations from our consolidated statements of operations, excluding depreciation and amortization associated with acquired tangible and intangible assets, restructuring charges, impairment of goodwill and other long-lived assets, share-based compensation expense, other non-operating items from our consolidated statements of operations and certain other items considered unusual or non-recurring in nature, adjusted for income taxes related to these items. Management believes that this non-GAAP measure is useful in providing period-to-period comparisons of the results of the Company’s ongoing operating performance.
The below table presents reconciliations from net income to Adjusted EBITDA for the three and nine months ended September 30, 2019 and 2018:
10
|
|
Three Months Ended September 30, (Unaudited) |
|
|
Nine Months Ended September 30, (Unaudited) |
|
|||||||||||
|
(IN MILLIONS) |
|
2019 |
|
|
2018 |
|
|
2019 |
|
|
2018 |
|
||||
|
Net income/(loss) attributable to Nielsen shareholders |
|
$ |
(472 |
) |
|
$ |
96 |
|
|
$ |
(306 |
) |
|
$ |
240 |
|
|
Interest expense, net |
|
|
99 |
|
|
|
97 |
|
|
|
295 |
|
|
|
289 |
|
|
(Benefit)/provision for income taxes |
|
|
(380 |
) |
|
|
59 |
|
|
|
(325 |
) |
|
|
142 |
|
|
Depreciation and amortization |
|
|
186 |
|
|
|
175 |
|
|
|
550 |
|
|
|
504 |
|
|
EBITDA |
|
|
(567 |
) |
|
|
427 |
|
|
|
214 |
|
|
|
1,175 |
|
|
Equity in net (income)/loss of affiliates |
|
|
- |
|
|
|
- |
|
|
|
- |
|
|
|
1 |
|
|
Other non-operating expense, net |
|
|
13 |
|
|
|
9 |
|
|
|
19 |
|
|
|
24 |
|
|
Restructuring charges |
|
|
5 |
|
|
|
19 |
|
|
|
52 |
|
|
|
108 |
|
|
Impairment of goodwill and other long-lived assets |
|
|
1,004 |
|
|
|
- |
|
|
|
1,004 |
|
|
|
- |
|
|
Share-based compensation expense |
|
|
13 |
|
|
|
1 |
|
|
|
39 |
|
|
|
21 |
|
|
Other items (a) |
|
|
8 |
|
|
|
15 |
|
|
|
33 |
|
|
|
33 |
|
|
Adjusted EBITDA |
|
$ |
476 |
|
|
$ |
471 |
|
|
$ |
1,361 |
|
|
$ |
1,362 |
|
|
(a) |
Other items primarily consist of business optimization costs, including strategic review costs, for the three months ended September 30, 2019, and business optimization costs, including strategic review costs, and transaction related costs for the nine months ended September 30, 2019. For the three and nine months ended September 30, 2018, other items primarily consist of business optimization costs and transaction related costs. |
The below table presents reconciliations from diluted net income per share to Adjusted earnings per share for the three and nine months ended September 30, 2019 and 2018:
|
|
|
Three Months Ended September 30, (Unaudited) |
|
|
Nine Months Ended September 30, (Unaudited) |
|
||||||||||
|
(IN MILLIONS) |
|
2019 |
|
|
2018 |
|
|
2019 |
|
|
2018 |
|
||||
|
Net income/(loss) attributable to Nielsen shareholders per share of common stock, diluted |
|
$ |
(1.33 |
) |
|
$ |
0.27 |
|
|
$ |
(0.86 |
) |
|
$ |
0.67 |
|
|
Depreciation and amortization associated with acquisition-related tangible and intangible assets |
|
|
0.14 |
|
|
|
0.15 |
|
|
|
0.44 |
|
|
|
0.47 |
|
|
Restructuring |
|
|
0.01 |
|
|
|
0.05 |
|
|
|
0.15 |
|
|
|
0.30 |
|
|
Impairment of goodwill and other long-lived assets |
|
|
2.82 |
|
|
|
- |
|
|
|
2.82 |
|
|
|
- |
|
|
Share-based compensation |
|
|
0.04 |
|
|
|
0.00 |
|
|
|
0.11 |
|
|
|
0.06 |
|
|
Other non-operating (income)/expense, net |
|
|
0.03 |
|
|
|
0.02 |
|
|
|
0.02 |
|
|
|
0.04 |
|
|
Other items (a) |
|
|
0.02 |
|
|
|
0.04 |
|
|
|
0.09 |
|
|
|
0.09 |
|
|
Tax effect of above items |
|
|
(0.07 |
) |
|
|
(0.10 |
) |
|
|
(0.24 |
) |
|
|
(0.32 |
) |
|
Discrete tax (benefit)/provision |
|
|
(1.15 |
) |
|
|
- |
|
|
|
(1.14 |
) |
|
|
- |
|
|
Adjusted earnings per share |
|
$ |
0.51 |
|
|
$ |
0.45 |
|
|
$ |
1.39 |
|
|
$ |
1.32 |
|
(a)Other items primarily consist of business optimization costs, including strategic review costs, and transaction related costs for the three and nine months ended September 30, 2019. For the three months ended September 30, 2018, other items primarily consist of transaction related costs. For the nine months ended September 30, 2018, other items primarily consist of transaction related costs and business optimization costs.
Free Cash Flow
We define free cash flow as net cash provided by operating activities, plus contributions to the Nielsen Foundation, less capital expenditures, net. We believe providing free cash flow information provides valuable supplemental liquidity information regarding the cash flow that may be available for discretionary use by us in areas such as the distributions of dividends, repurchase of common stock, voluntary repayment of debt obligations or to fund our strategic initiatives, including acquisitions, if any. However, free cash flow does not represent residual cash flows entirely available for discretionary purposes; for example, the repayment of principal amounts borrowed is not deducted from free cash flow. Key limitations of the free cash flow measure include the assumptions that we will be able to refinance our existing debt when it matures and meet other cash flow obligations from financing activities, such as principal payments on debt. Free cash flow is not a presentation made in accordance with GAAP. The following table presents reconciliation from net cash provided by operating activities to free cash flow:
|
|
|
Three Months Ended |
|
|
Nine Months Ended |
|
||||||||||
|
(IN MILLIONS) |
|
2019 |
|
|
2018 |
|
|
2019 |
|
|
2018 |
|
||||
11
|
|
$ |
413 |
|
|
$ |
387 |
|
|
$ |
596 |
|
|
$ |
512 |
|
|
|
Less: Capital expenditures, net |
|
|
(112 |
) |
|
|
(121 |
) |
|
|
(342 |
) |
|
|
(367 |
) |
|
Free cash flow |
|
$ |
301 |
|
|
$ |
266 |
|
|
$ |
254 |
|
|
$ |
145 |
|
Net Debt and Net Debt Leverage Ratio
The net debt leverage ratio is defined as net debt (gross debt less cash and cash equivalents) as of the balance sheet date divided by Adjusted EBITDA for the 12 months then ended. Net debt and the net debt leverage ratio are commonly used metrics to evaluate and compare leverage between companies and are not presentations made in accordance with GAAP. The calculation of net debt and the net debt leverage ratio as of September 30, 2019 is as follows:
|
(IN MILLIONS) (Unaudited) |
|
|||
|
Gross debt as of September 30, 2019 |
|
$ |
8,487 |
|
|
Less: Cash and cash equivalents as of September 30, 2019 |
|
|
(389 |
) |
|
Net debt as of September 30, 2019 |
|
$ |
8,098 |
|
|
|
|
|
|
|
|
Adjusted EBITDA for the year ended December 31, 2018 |
|
$ |
1,850 |
|
|
Less: Adjusted EBITDA for the nine months ended September 30, 2018 |
|
|
1,362 |
|
|
Add: Adjusted EBITDA for the nine months ended September 30, 2019 |
|
|
1,361 |
|
|
Adjusted EBITDA for the twelve months ended September 30, 2019 |
|
$ |
1,849 |
|
|
|
|
|
|
|
|
Net debt leverage ratio as of September 30, 2019 |
|
|
4.38x |
|
12
Exhibit 99.2

News Release
Investor Relations: Sara Gubins, +1 646 654 8153
Media Relations: Laura Nelson, +1 203 563 2929
NIELSEN TO SEPARATE INTO TWO LEADING GLOBAL COMPANIES
|
|
• |
Nielsen Concludes Comprehensive Strategic Review Process; Announces Plan to Spin-Off Nielsen’s Global Connect Business |
|
|
• |
Separation Sharpens Strategic Focus; Allows Each Business to Most Effectively Serve Rapidly Changing End-Markets and Invest in Growth Opportunities |
|
|
• |
Each Business Is Well-Positioned to Accelerate Growth and Profits Over Time |
|
|
• |
Developing Fit-for-Purpose Capital Structures and Allocation Strategies |
|
|
• |
Nielsen to Adjust Dividend to Strengthen Balance Sheet Ahead of Separation and Provide Added Flexibility to Invest for Growth |
|
|
• |
Nielsen Also Announces Third Quarter 2019 Results, Reaffirms Revenue, Adjusted EBITDA, and Free Cash Flow Guidance for 2019, and Increases Adjusted EPS Guidance for 2019 |
New York, USA – November 7, 2019 – Nielsen Holdings plc (“Nielsen” NYSE: NLSN) announced today the completion of its strategic review and its plan to spin-off the company's Global Connect business, creating two independent, publicly traded companies—the Global Media business and the Global Connect business—each of which will have sharper strategic focus and greater opportunity to leverage its unique competitive advantages. The strategic review was led by James Attwood, Chairman of Nielsen’s Board of Directors.
“Nielsen has two strong and global franchises—Global Media and Global Connect. Following an extensive review process, which included an in-depth analysis of our businesses, strategies and market opportunities, the Board concluded that separating into two independent, publicly traded companies is the best path to position each business for long term success and maximize value creation,” commented Attwood. “As independent companies, both Nielsen—the Global Media business—and the new company consisting of Global Connect will enjoy added flexibility and further strengthen their paths toward a new phase of growth, productivity and industry leadership.”
“Since beginning the strategic review, Nielsen has evolved significantly. We are building a track record of execution, led by improved operational and financial discipline, and we have confidence in the path forward for each business,” said David Kenny, Chief Executive Officer. “Both the Global Media and Global Connect businesses are independently essential to the industries they serve, but each business has unique dynamics. Our decision to separate them marks a milestone in our strategic evolution and will best position each to serve the specific needs of their clients and successfully address rapidly changing dynamics in the marketplace. As two independent companies, we can better drive decision making with velocity and push key initiatives to accelerate performance enhancements of each business.”
1
Creating two separate and independent publicly traded companies will enable each business to:
|
|
• |
Drive results with a singular focus and an independent structure that allows faster decision-making. |
|
|
• |
Implement distinct, fit-for-purpose capital structures and allocation strategies aligned with growth plans. |
|
|
• |
Benefit from strategic flexibility to invest in growth opportunities. |
|
|
• |
Create compelling pure-play investment opportunities for investors by driving accelerated growth and profits over time. |
As Nielsen prepares for the separation, it has been developing fit-for-purpose capital structure targets for both businesses. As part of the separation, the Board of Directors approved a reduction of the dividend, with the goal of strengthening the two prospective balance sheets ahead of the separation and providing added flexibility to invest for growth. Beginning with Nielsen’s next dividend payment in December 2019, Nielsen will reduce its quarterly cash dividend payment to $0.06, from $0.35, per ordinary share. The dividend is payable on December 5, 2019, to shareholders of record at the close of business on November 21, 2019.
With the completion of the strategic review, James Attwood resumes his role as Chairman of the Board, effective immediately. He had been serving as Executive Chairman to oversee the Company’s strategic review and Chief Executive Officer search.
After the separation is complete, David Kenny will serve as the Chief Executive Officer of Nielsen’s Global Media business. Nielsen has begun a search for a Chief Executive Officer of the Global Connect business which will consider both external and internal candidates. Additions to the management teams and the composition of the boards of directors for both companies will be named in due course.
Nielsen Global Media Overview
Nielsen Global Media, the arbiter of truth for media markets, provides media and advertising clients with unbiased and reliable metrics that create the shared understanding of the industry required for markets to function, enabling its clients to grow and succeed across the $600 billion global advertising market. Nielsen Global Media helps clients to define exactly who they want to reach, as well as optimize the outcomes they can achieve. The company’s cross-platform measurement strategy brings together the best of TV and digital measurement to ensure a more functional marketplace for the industry.
Nielsen Global Connect Overview
Nielsen Global Connect provides consumer packaged goods manufacturers and retailers with accurate, actionable information and a complete picture of the complex and changing marketplace that brands need to innovate and grow their businesses. Nielsen Global Connect provides data and builds tools that use predictive models to turn observations in the marketplace into business decisions and winning solutions. The business’s data and insights, combined with the only open, cloud native measurement and analytics platform that democratizes the power of data, continue to provide an essential foundation that makes markets possible in the rapidly evolving world of commerce. With Nielsen Global Connect’s set of guiding truths, businesses have the tools to create new opportunities.
Transaction Details
The transaction will be in the form of a distribution to Nielsen shareholders of 100% of the shares of a new entity holding the Nielsen Global Connect business, which will generally be intended to qualify as tax-free to Nielsen and its shareholders for U.S. federal income tax purposes. Immediately following the transaction, Nielsen shareholders will own shares of both Nielsen and the new entity holding the Nielsen Global Connect business. In conjunction with the spin, Nielsen Global Connect is expected to raise new debt. It is currently anticipated that substantially all of the proceeds of the new debt will be used for debt reduction at Nielsen.
Nielsen currently expects the spin-off transaction to be completed in nine to twelve months, subject to certain conditions, including, among others, the receipt of final Board approval, receipt of an opinion from counsel and/or ruling regarding the U.S. federal income tax treatment of the distribution, the effectiveness of a Form 10 registration statement to be filed with the Securities and Exchange Commission (SEC), the approval of Nielsen shareholders and works council consultations.
2
J.P. Morgan Securities LLC and Guggenheim Securities LLC are acting as financial advisors to Nielsen, and Wachtell, Lipton, Rosen & Katz, Baker McKenzie and Clifford Chance LLP are serving as legal advisors to Nielsen.
Third Quarter 2019 Results
Separately, Nielsen announced today its third quarter 2019 results, reaffirmed revenue, Adjusted EBITDA, and free cash flow guidance for 2019, and increased Adjusted EPS guidance for 2019. Further details can be found on Nielsen’s website at http://www.nielsen.com/investors or on EDGAR at http://www.sec.gov.
Conference Call and Webcast
Nielsen will hold a conference call to discuss today’s announcements at 8:00 a.m. U.S. Eastern Time (ET) on November 7, 2019. The audio and slides for the call can be accessed live by webcast at http://nielsen.com/investors or by dialing +1-833-236-2755. Callers outside the U.S. can dial +1-647-689-4180. A replay of the event will be available on Nielsen’s Investor Relations website, http://nielsen.com/investors, from 11:00 a.m. ET, November 7, 2019, until 11:59 p.m. ET, November 14, 2019. The replay can be accessed from within the U.S. by dialing +1-800-585-8367. Other callers can access the replay at +1-416-621-4642. The replay pass code is 8199309.
About Nielsen
Nielsen Holdings plc (NYSE: NLSN) is a global measurement and data analytics company that provides the most complete and trusted view available of consumers and markets worldwide. Our approach marries proprietary Nielsen data with other data sources to help clients around the world understand what’s happening now, what’s happening next, and how to best act on this knowledge. For more than 90 years Nielsen has provided data and analytics based on scientific rigor and innovation, continually developing new ways to answer the most important questions facing the media, advertising, retail and fast-moving consumer goods industries. An S&P 500 company, Nielsen has operations in over 100 countries, covering more than 90% of the world’s population. For more information, visit www.nielsen.com.
From time to time, Nielsen may use its website and social media outlets as channels of distribution of material company information. Financial and other material information regarding the company is routinely posted and accessible on our website at http://www.nielsen.com/investors and our Twitter account at http://twitter.com/Nielsen.
Forward-Looking Statements
This news release includes information that could constitute forward-looking statements made pursuant to the safe harbor provision of the Private Securities Litigation Reform Act of 1995. These statements include those set forth above relating to the spin-off transaction as well as those that may be identified by words such as “will,” “intend,” “expect,” “anticipate,” “should,” “could” and similar expressions. These statements are subject to risks and uncertainties, and actual results and events could differ materially from what presently is expected. Factors leading thereto may include, without limitation, the expected benefits and costs of the spin-off transaction, the expected timing of completion of the spin-off transaction, the ability of Nielsen to complete the spin-off transaction considering the various conditions to the completion of the spin-off transaction (some of which are outside Nielsen’s control, including those conditions related to regulatory approvals), business disruption during the pendency of or following the spin-off transaction, diversion of management time on the spin-off transaction-related issues, failure to receive the required shareholder approval of the spin-off transaction, retention of existing management team members, the reaction of customers and other parties to the spin-off transaction, the qualification of the spin-off transaction as a tax-free transaction for U.S. federal income tax purposes (including whether or not an IRS ruling will be sought or obtained), potential dissynergy costs between Nielsen Global Connect and Nielsen Global Media, the impact of the spin-off transaction on relationships with customers, suppliers, employees and other business counterparties, general economic conditions, conditions in the markets Nielsen is engaged in, behavior of customers, suppliers and competitors, technological developments, as well as legal and regulatory rules affecting Nielsen’s business and other specific risk factors that are outlined in our disclosure filings and materials, which you can find on http://www.nielsen.com/investors, such as our 10-K, 10-Q and 8-K reports that have been filed with the SEC. Please consult these documents for a more complete understanding of these risks and uncertainties. This list of factors is not intended to be exhaustive. Such forward-looking statements only speak as of the date of this press
3
release, and we assume no obligation to update any written or oral forward-looking statement made by us or on our behalf as a result of new information, future events or other factors, except as required by law.
Important Additional Information
In connection with the transaction, Nielsen expects to file with the SEC a proxy statement of Nielsen, as well as other relevant documents concerning the transaction. This communication is not a substitute for the proxy statement or for any other document that Nielsen may file with the SEC and send to its shareholders in connection with the transaction. The transaction will be submitted to Nielsen’s shareholders for their consideration. Before making any voting decision, Nielsen’s shareholders are urged to read the proxy statement regarding the transaction when it becomes available and any other relevant documents filed with the SEC, as well as any amendments or supplements to those documents, because they will contain important information about the transaction.
Nielsen’s shareholders will be able to obtain a free copy of the proxy statement, as well as other filings containing information about Nielsen, without charge, at the SEC’s website (http://www.sec.gov). Copies of the proxy statement and the filings with the SEC that will be incorporated by reference therein can also be obtained, without charge, by directing a request to Nielsen Holdings plc, 85 Broad Street, New York, NY 10004, Attention: Corporate Secretary; telephone (646) 654-5000, or from Nielsen’s website www.nielsen.com.
Participants in the Solicitation
Nielsen and certain of its directors, executive officers and employees may be deemed to be participants in the solicitation of proxies in respect of the transaction. Information regarding Nielsen’s directors and executive officers is available in Nielsen’s definitive proxy statement for its 2019 annual meeting, which was filed with the SEC on April 9, 2019. Other information regarding the participants in the proxy solicitation and a description of their direct and indirect interests, by security holdings or otherwise, will be contained in the proxy statement to be filed with the SEC in connection with the transaction. Free copies of this document may be obtained as described in the preceding paragraph.
4

Nielsen Roadmap for Growth and Value Creation Thursday, November 7, 2019 | 8:00 am EST Exhibit 99.3
The following discussion contains forward-looking statements, including those about Nielsen’s outlook and prospects, as such term is defined in the Private Securities Litigation Reform Act of 1995. Forward-looking statements are those which are not historical facts. These and other statements that relate to future results and events and those regarding our plan to spin-off the Company’s Global Connect business are based on Nielsen’s current expectations as of the date of this presentation. Our actual results in future periods may differ materially from those currently expected because of a number of risks and uncertainties. The risks and uncertainties that we believe are material include, without limitation, the expected benefits and costs of the spin-off transaction, the expected timing of completion of the spin-off transaction, the ability of Nielsen to complete the spin-off transaction considering the various conditions to the completion of the spin-off transaction (some of which are outside Nielsen’s control, including those conditions related to regulatory approvals), business disruption during the pendency of or following the spin-off transaction, diversion of management time on the spin-off transaction-related issues, failure to receive the required shareholder approval of the spin-off transaction, retention of existing management team members, the reaction of customers and other parties to the spin-off transaction, the qualification of the spin-off transaction as a tax-free transaction for US federal income tax purposes (including whether or not an IRS ruling will be sought or obtained), potential dissynergy costs between Nielsen Global Connect and Nielsen Global Media, the impact of the spin-off transaction on relationships with customers, suppliers, employees and other business counterparties, general economic conditions, conditions in the markets Nielsen is engaged in, behavior of customers, suppliers and competitors, technological developments, as well as legal and regulatory rules affecting Nielsen’s business and other specific risk factors that are outlined in our disclosure filings and materials, which you can find on http://ir.nielsen.com, such as our most recent 10-K, 10-Q and 8-K reports that have been filed with the Securities and Exchange Commission. Please consult these documents for a more complete understanding of these risks and uncertainties. We disclaim any intention or obligation to update or revise any forward-looking statements, whether as a result of new information, future events or otherwise, except as may be required by law. Our outlook is provided for the purpose of providing information about current expectations and targets. This information may not be appropriate for other purposes. FORWARD-LOOKING STATEMENTS
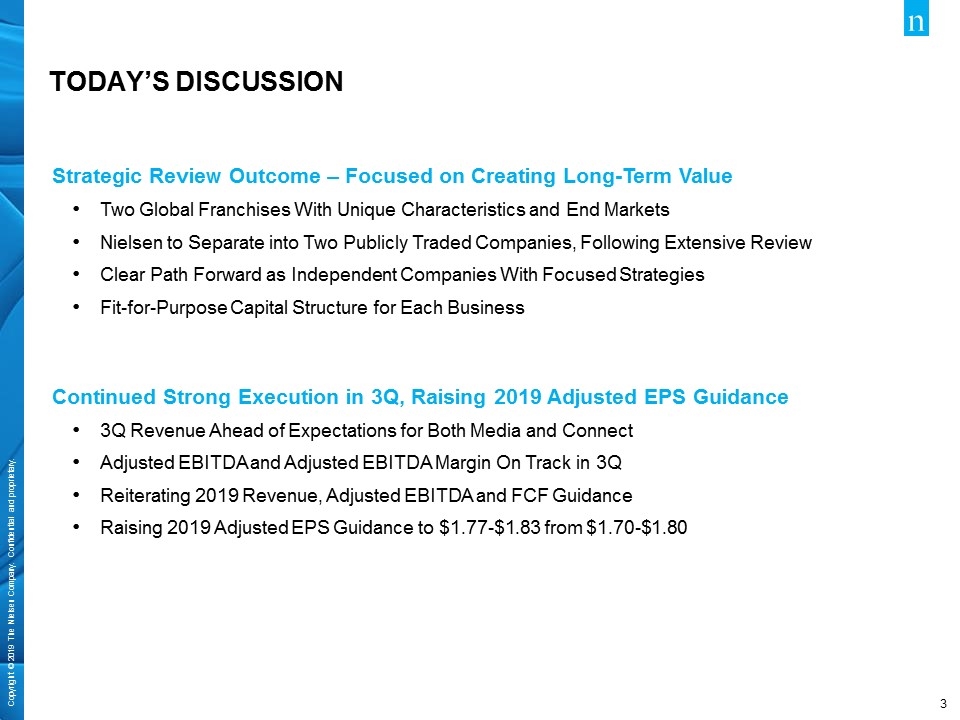
TODAY’S DISCUSSION Strategic Review Outcome – Focused on Creating Long-Term Value Two Global Franchises With Unique Characteristics and End Markets Nielsen to Separate into Two Publicly Traded Companies, Following Extensive Review Clear Path Forward as Independent Companies With Focused Strategies Fit-for-Purpose Capital Structure for Each Business Continued Strong Execution in 3Q, Raising 2019 Adjusted EPS Guidance 3Q Revenue Ahead of Expectations for Both Media and Connect Adjusted EBITDA and Adjusted EBITDA Margin On Track in 3Q Reiterating 2019 Revenue, Adjusted EBITDA and FCF Guidance Raising 2019 Adjusted EPS Guidance to $1.77-$1.83 from $1.70-$1.80

strategic review outcome
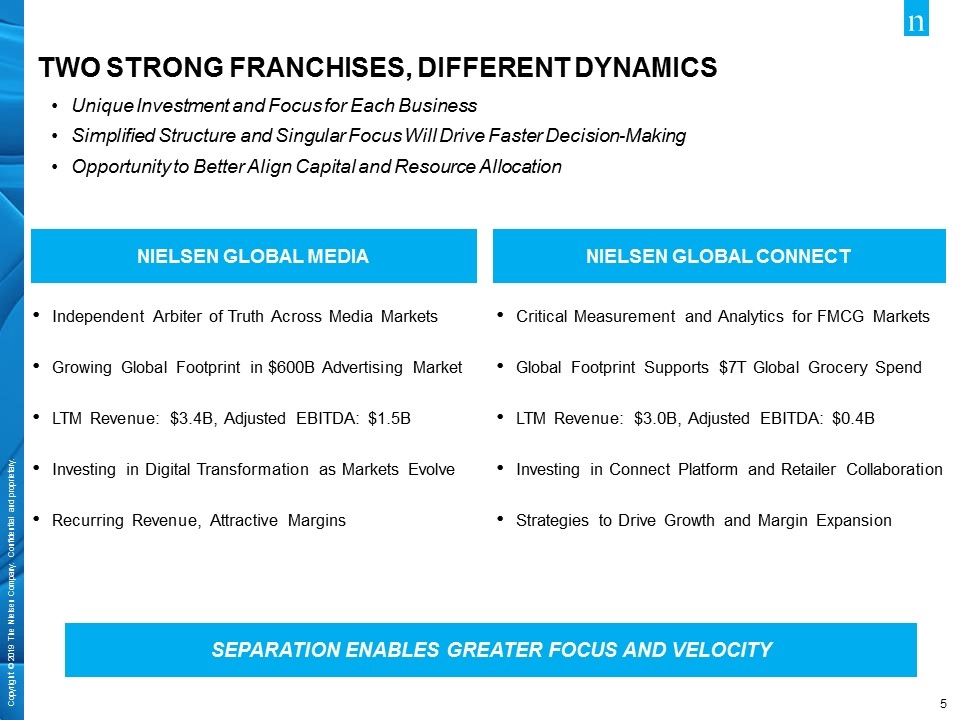
TWO STRONG FRANCHISES, DIFFERENT DYNAMICS SEPARATION ENABLES GREATER FOCUS AND VELOCITY Unique Investment and Focus for Each Business Simplified Structure and Singular Focus Will Drive Faster Decision-Making Opportunity to Better Align Capital and Resource Allocation NIELSEN GLOBAL MEDIA NIELSEN GLOBAL CONNECT Independent Arbiter of Truth Across Media Markets Growing Global Footprint in $600B Advertising Market LTM Revenue: $3.4B, Adjusted EBITDA: $1.5B Investing in Digital Transformation as Markets Evolve Recurring Revenue, Attractive Margins Critical Measurement and Analytics for FMCG Markets Global Footprint Supports $7T Global Grocery Spend LTM Revenue: $3.0B, Adjusted EBITDA: $0.4B Investing in Connect Platform and Retailer Collaboration Strategies to Drive Growth and Margin Expansion
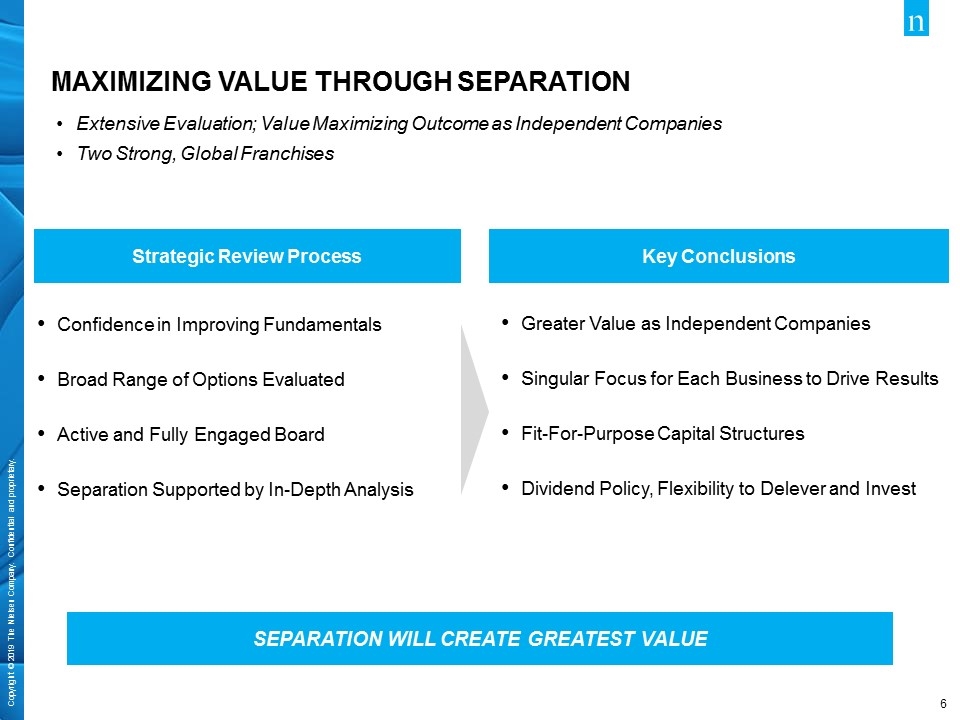
Strategic Review Process Confidence in Improving Fundamentals Broad Range of Options Evaluated Active and Fully Engaged Board Separation Supported by In-Depth Analysis Greater Value as Independent Companies Singular Focus for Each Business to Drive Results Fit-For-Purpose Capital Structures Dividend Policy, Flexibility to Delever and Invest Extensive Evaluation; Value Maximizing Outcome as Independent Companies Two Strong, Global Franchises SEPARATION WILL CREATE GREATEST VALUE MAXIMIZING VALUE THROUGH SEPARATION Key Conclusions
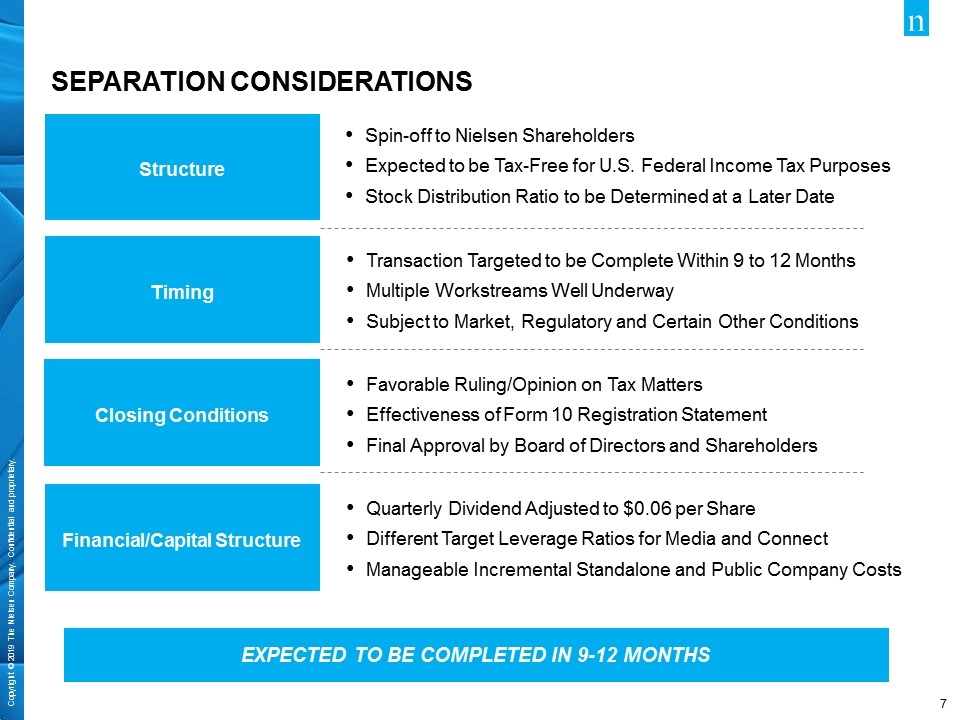
Financial/Capital Structure Spin-off to Nielsen Shareholders Expected to be Tax-Free for U.S. Federal Income Tax Purposes Stock Distribution Ratio to be Determined at a Later Date Transaction Targeted to be Complete Within 9 to 12 Months Multiple Workstreams Well Underway Subject to Market, Regulatory and Certain Other Conditions Favorable Ruling/Opinion on Tax Matters Effectiveness of Form 10 Registration Statement Final Approval by Board of Directors and Shareholders Quarterly Dividend Adjusted to $0.06 per Share Different Target Leverage Ratios for Media and Connect Manageable Incremental Standalone and Public Company Costs Structure Timing Closing Conditions EXPECTED TO BE COMPLETED IN 9-12 MONTHS SEPARATION considerations

The path forward: Global Media
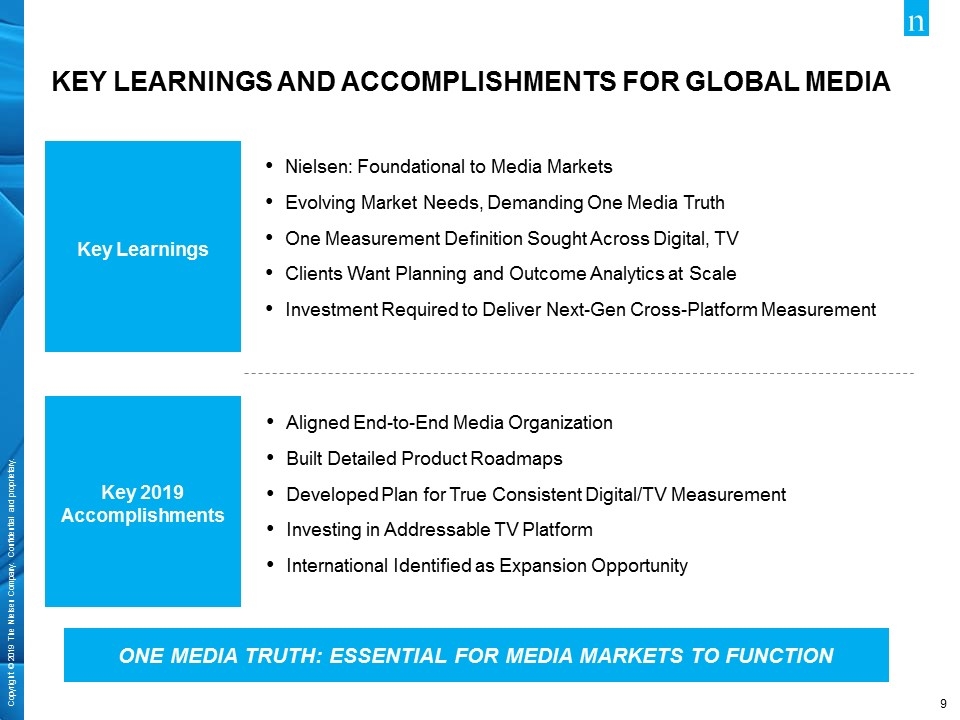
Nielsen: Foundational to Media Markets Evolving Market Needs, Demanding One Media Truth One Measurement Definition Sought Across Digital, TV Clients Want Planning and Outcome Analytics at Scale Investment Required to Deliver Next-Gen Cross-Platform Measurement Aligned End-to-End Media Organization Built Detailed Product Roadmaps Developed Plan for True Consistent Digital/TV Measurement Investing in Addressable TV Platform International Identified as Expansion Opportunity Key 2019 Accomplishments ONE MEDIA TRUTH: ESSENTIAL FOR MEDIA MARKETS TO FUNCTION KEY LEARNINGS AND ACCOMPLISHMENTS FOR GLOBAL MEDIA Key Learnings
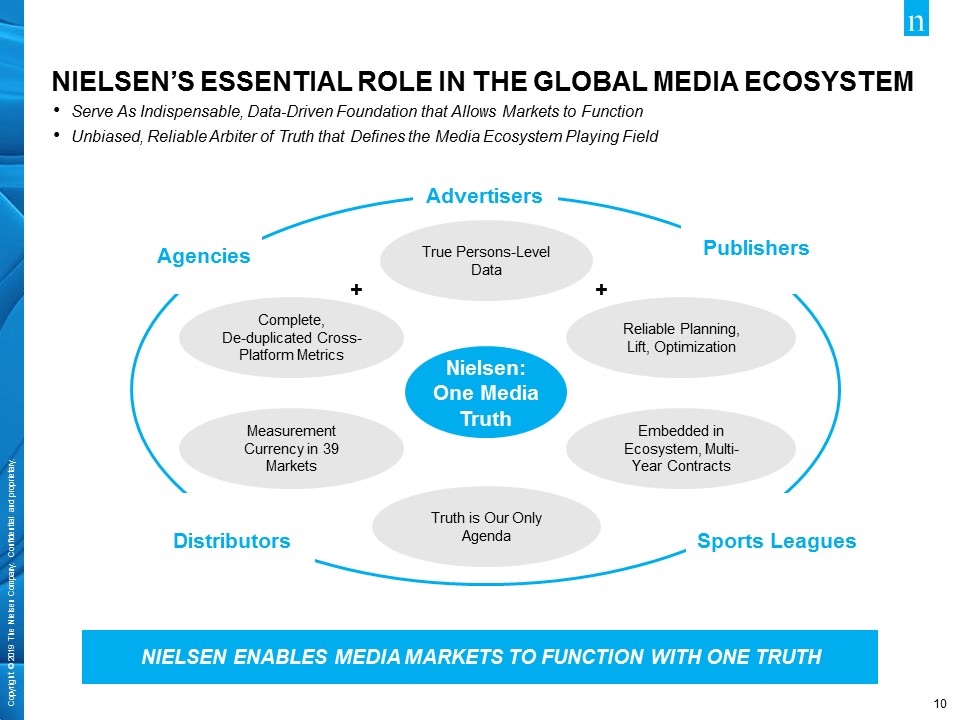
Serve As Indispensable, Data-Driven Foundation that Allows Markets to Function Unbiased, Reliable Arbiter of Truth that Defines the Media Ecosystem Playing Field Advertisers Distributors Nielsen: One Media Truth Embedded in Ecosystem, Multi-Year Contracts Complete, De-duplicated Cross-Platform Metrics Reliable Planning, Lift, Optimization True Persons-Level Data NIELSEN ENABLES MEDIA MARKETS TO FUNCTION WITH ONE TRUTH Agencies Measurement Currency in 39 Markets Truth is Our Only Agenda NIELSEN’S ESSENTIAL ROLE IN THE GLOBAL MEDIA ECOSYSTEM Publishers Sports Leagues + +
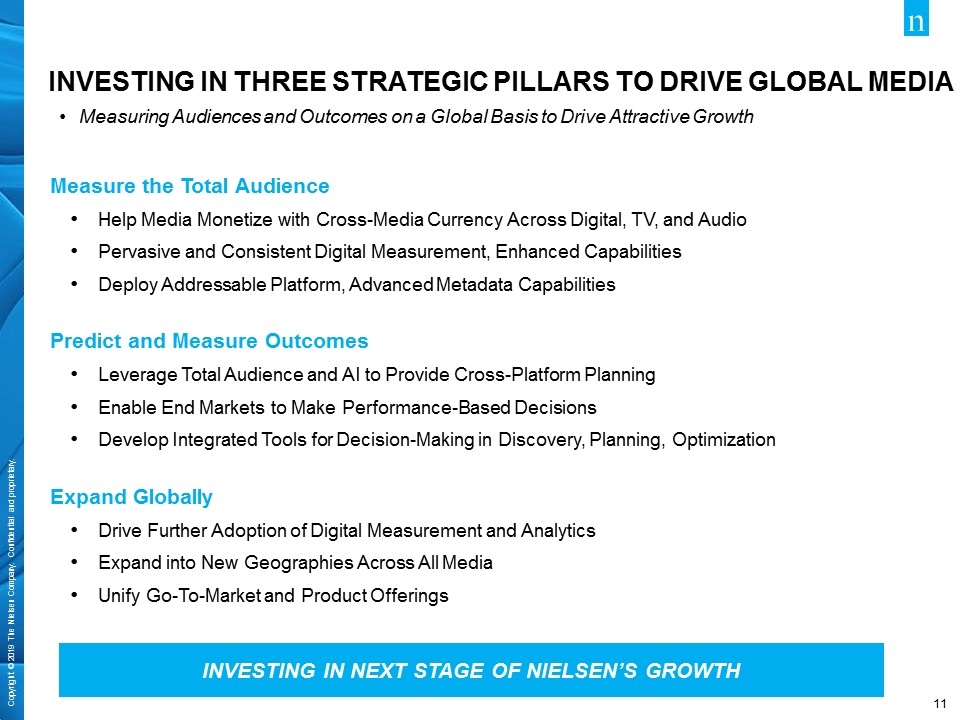
INVESTING IN three STRATEGIC PILLARS TO DRIVE GLOBAL MEDIA Measure the Total Audience Help Media Monetize with Cross-Media Currency Across Digital, TV, and Audio Pervasive and Consistent Digital Measurement, Enhanced Capabilities Deploy Addressable Platform, Advanced Metadata Capabilities Predict and Measure Outcomes Leverage Total Audience and AI to Provide Cross-Platform Planning Enable End Markets to Make Performance-Based Decisions Develop Integrated Tools for Decision-Making in Discovery, Planning, Optimization Expand Globally Drive Further Adoption of Digital Measurement and Analytics Expand into New Geographies Across All Media Unify Go-To-Market and Product Offerings INVESTING IN NEXT STAGE OF NIELSEN’S GROWTH Measuring Audiences and Outcomes on a Global Basis to Drive Attractive Growth
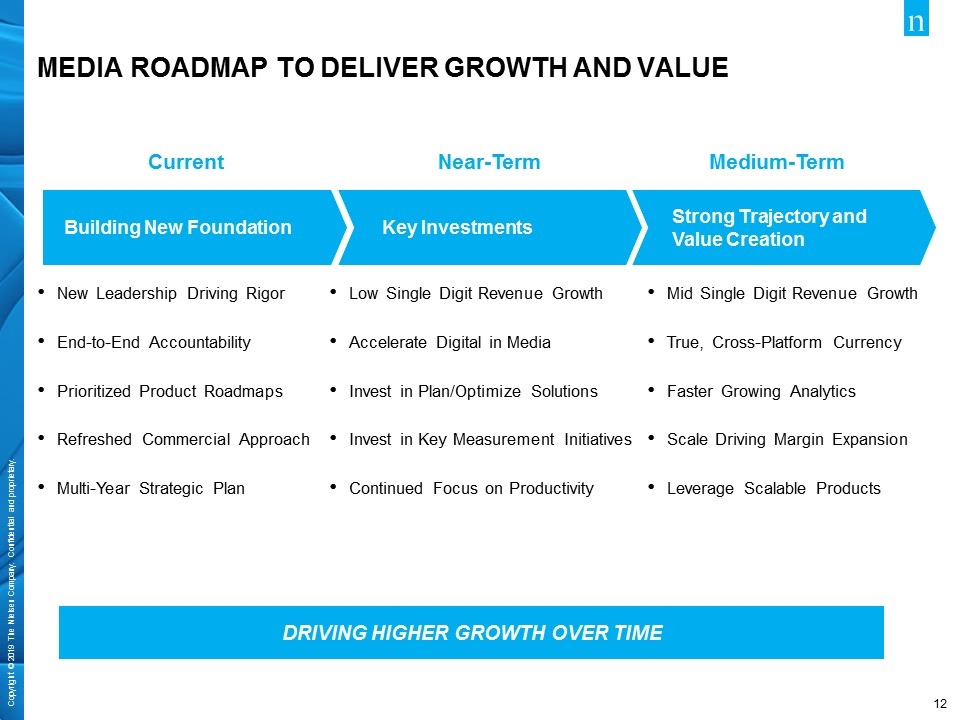
DRIVING HIGHER GROWTH OVER TIME MEDIA ROADMAP TO DELIVER GROWTH AND VALUE Key Investments Strong Trajectory and Value Creation Building New Foundation Low Single Digit Revenue Growth Accelerate Digital in Media Invest in Plan/Optimize Solutions Invest in Key Measurement Initiatives Continued Focus on Productivity New Leadership Driving Rigor End-to-End Accountability Prioritized Product Roadmaps Refreshed Commercial Approach Multi-Year Strategic Plan Mid Single Digit Revenue Growth True, Cross-Platform Currency Faster Growing Analytics Scale Driving Margin Expansion Leverage Scalable Products Medium-Term Current Near-Term

THE PATH FORWARD: GLOBAL connect
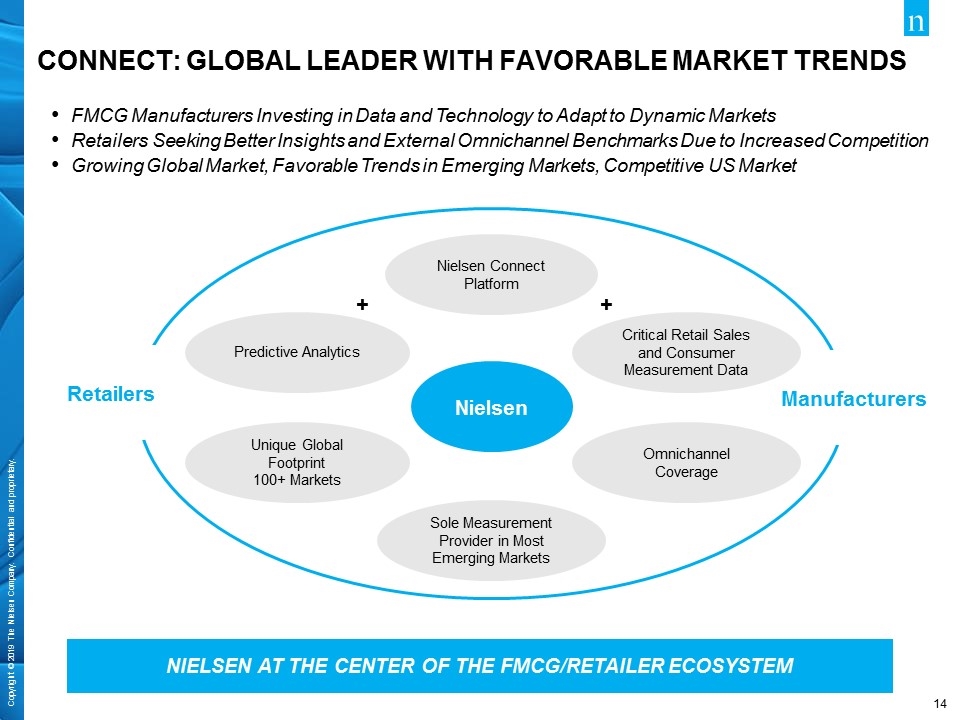
Retailers Manufacturers FMCG Manufacturers Investing in Data and Technology to Adapt to Dynamic Markets Retailers Seeking Better Insights and External Omnichannel Benchmarks Due to Increased Competition Growing Global Market, Favorable Trends in Emerging Markets, Competitive US Market NIELSEN AT THE CENTER OF THE FMCG/RETAILER ECOSYSTEM CONNECT: GLOBAL LEADER WITH FAVORABLE MARKET TRENDS Nielsen Omnichannel Coverage Predictive Analytics Critical Retail Sales and Consumer Measurement Data Nielsen Connect Platform Unique Global Footprint 100+ Markets Sole Measurement Provider in Most Emerging Markets + +
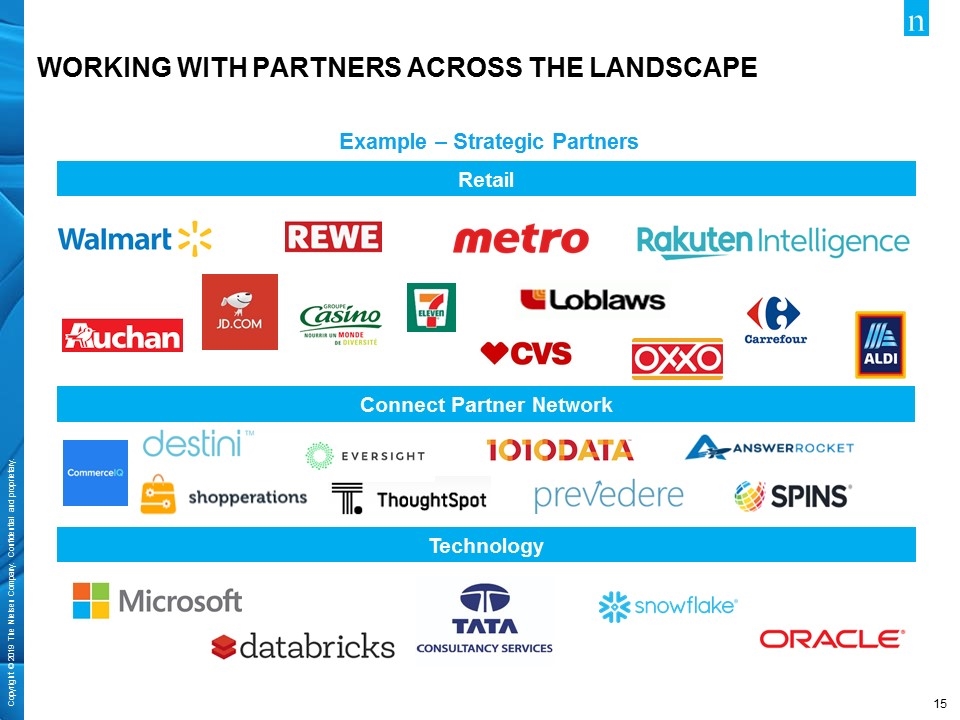
WORKING WITH PARTNERS ACROSS THE LANDSCAPE Retail Connect Partner Network Technology Example – Strategic Partners
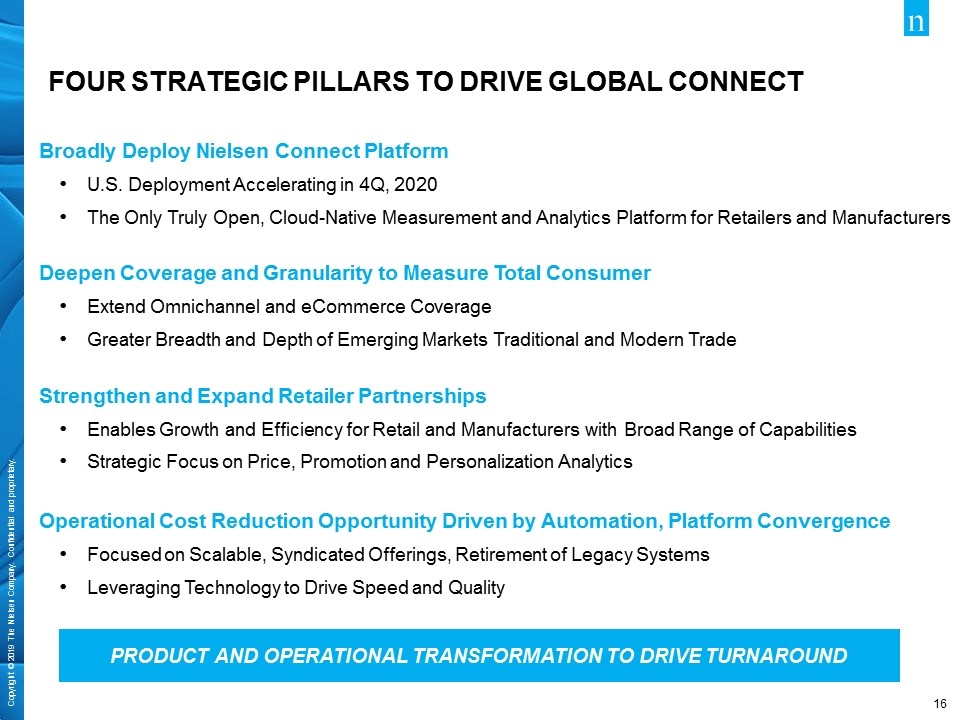
Four STRATEGIC PILLARS TO DRIVE GLOBAL connect Broadly Deploy Nielsen Connect Platform U.S. Deployment Accelerating in 4Q, 2020 The Only Truly Open, Cloud-Native Measurement and Analytics Platform for Retailers and Manufacturers Deepen Coverage and Granularity to Measure Total Consumer Extend Omnichannel and eCommerce Coverage Greater Breadth and Depth of Emerging Markets Traditional and Modern Trade Strengthen and Expand Retailer Partnerships Enables Growth and Efficiency for Retail and Manufacturers with Broad Range of Capabilities Strategic Focus on Price, Promotion and Personalization Analytics Operational Cost Reduction Opportunity Driven by Automation, Platform Convergence Focused on Scalable, Syndicated Offerings, Retirement of Legacy Systems Leveraging Technology to Drive Speed and Quality PRODUCT AND OPERATIONAL TRANSFORMATION TO DRIVE TURNAROUND

Medium-term financial opportunity
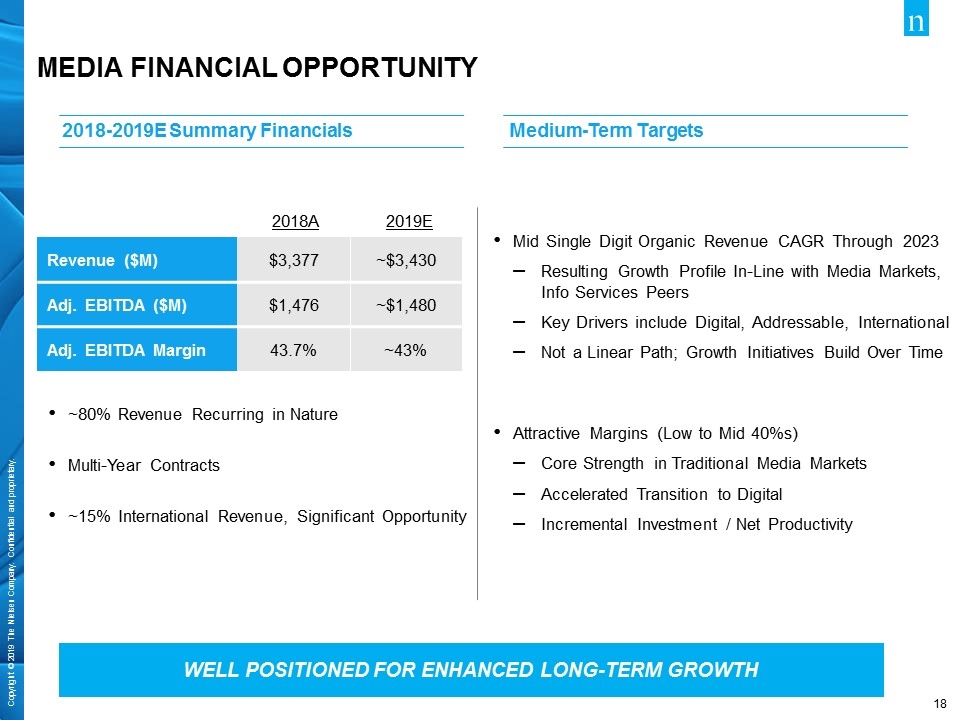
WELL POSITIONED FOR ENHANCED LONG-TERM GROWTH MEDIA FINANCIAL OPPORTUNITY Revenue ($M) $3,377 ~$3,430 Adj. EBITDA ($M) $1,476 ~$1,480 Adj. EBITDA Margin 43.7% ~43% ~80% Revenue Recurring in Nature Multi-Year Contracts ~15% International Revenue, Significant Opportunity 2018A 2019E Mid Single Digit Organic Revenue CAGR Through 2023 Resulting Growth Profile In-Line with Media Markets, Info Services Peers Key Drivers include Digital, Addressable, International Not a Linear Path; Growth Initiatives Build Over Time Attractive Margins (Low to Mid 40%s) Core Strength in Traditional Media Markets Accelerated Transition to Digital Incremental Investment / Net Productivity 2018-2019E Summary Financials Medium-Term Targets
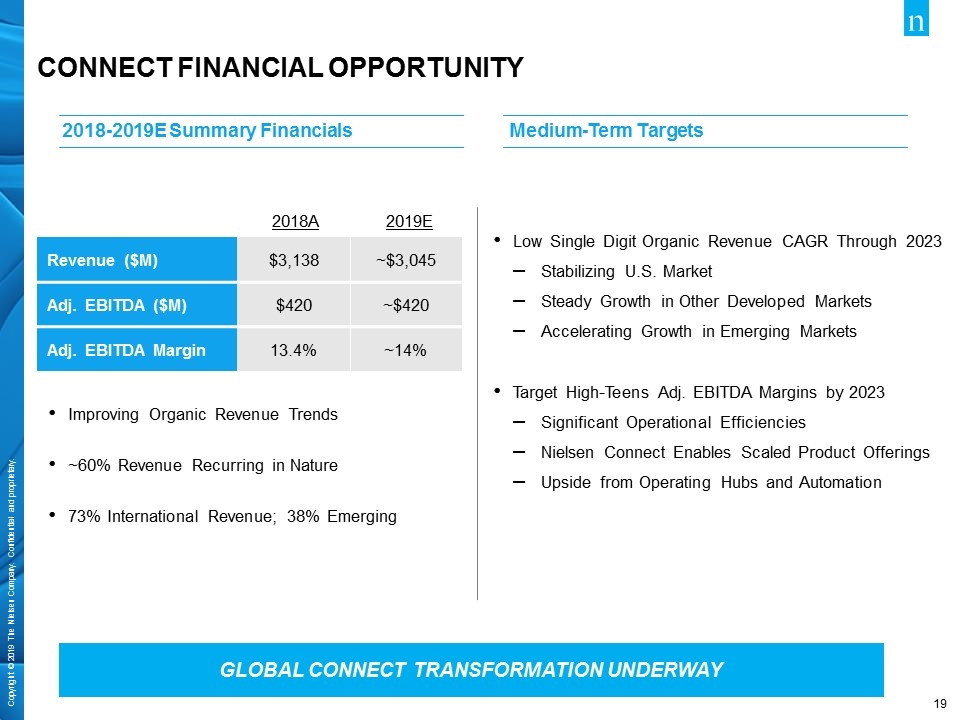
GLOBAL CONNECT TRANSFORMATION UNDERWAY CONNECT FINANCIAL OPPORTUNITY Revenue ($M) $3,138 ~$3,045 Adj. EBITDA ($M) $420 ~$420 Adj. EBITDA Margin 13.4% ~14% Improving Organic Revenue Trends ~60% Revenue Recurring in Nature 73% International Revenue; 38% Emerging 2018A 2019E Low Single Digit Organic Revenue CAGR Through 2023 Stabilizing U.S. Market Steady Growth in Other Developed Markets Accelerating Growth in Emerging Markets Target High-Teens Adj. EBITDA Margins by 2023 Significant Operational Efficiencies Nielsen Connect Enables Scaled Product Offerings Upside from Operating Hubs and Automation 2018-2019E Summary Financials Medium-Term Targets

3Q Earnings AND 2019 OUTLOOK
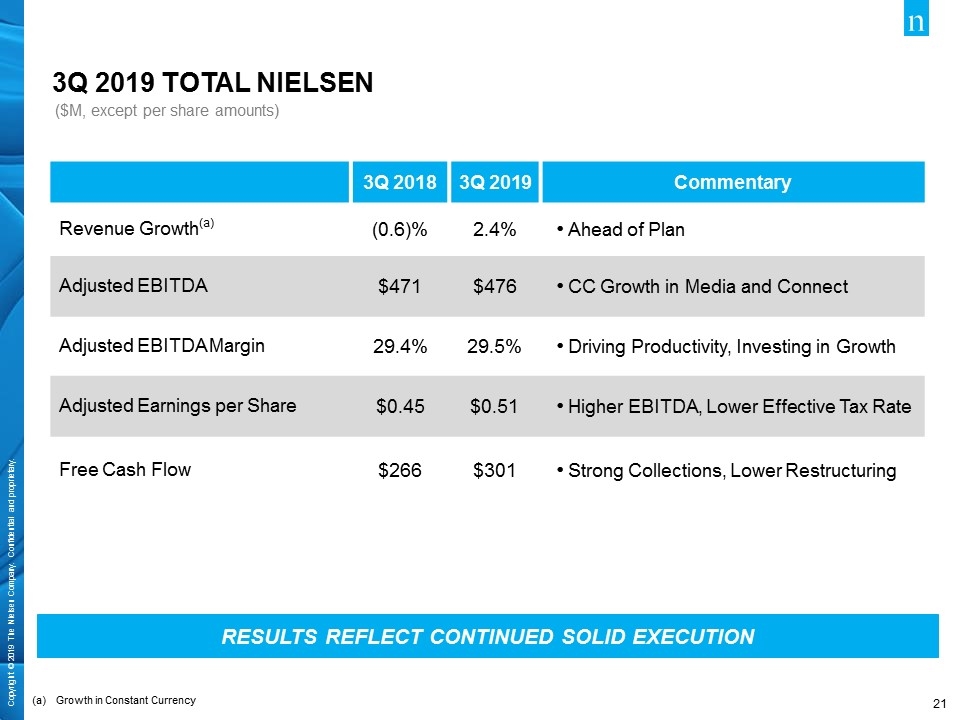
RESULTS REFLECT CONTINUED SOLID EXECUTION 3Q 2018 3Q 2019 Commentary Revenue Growth(a) (0.6)% 2.4% Ahead of Plan Adjusted EBITDA $471 $476 CC Growth in Media and Connect Adjusted EBITDA Margin 29.4% 29.5% Driving Productivity, Investing in Growth Adjusted Earnings per Share $0.45 $0.51 Higher EBITDA, Lower Effective Tax Rate Free Cash Flow $266 $301 Strong Collections, Lower Restructuring ($M, except per share amounts) 3Q 2019 TOTAL NIELSEN Growth in Constant Currency
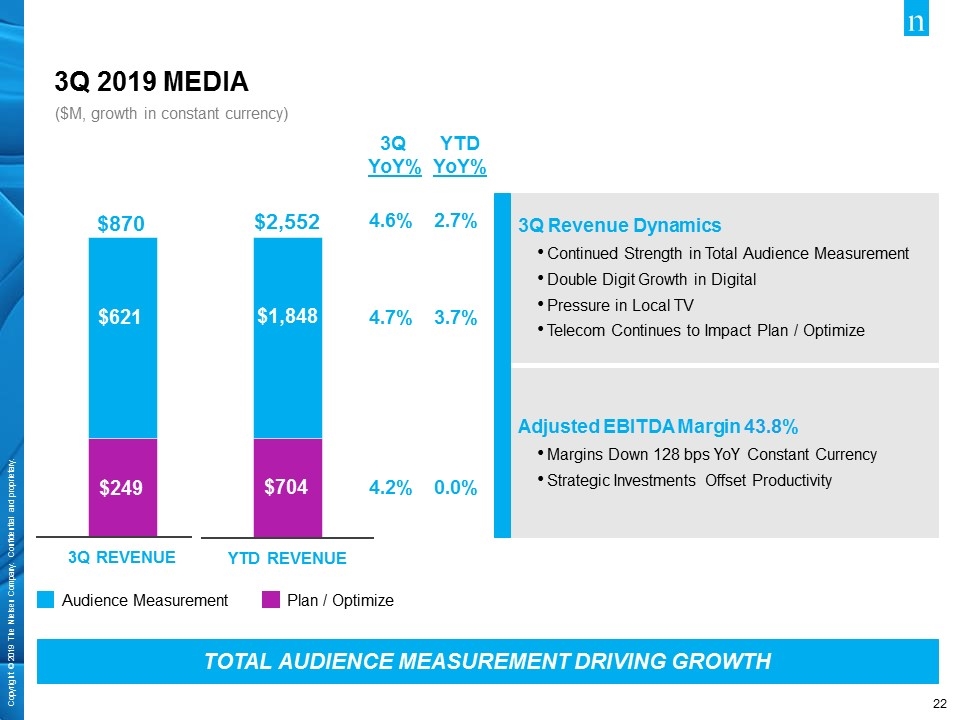
3Q Revenue Dynamics Continued Strength in Total Audience Measurement Double Digit Growth in Digital Pressure in Local TV Telecom Continues to Impact Plan / Optimize Adjusted EBITDA Margin 43.8% Margins Down 128 bps YoY Constant Currency Strategic Investments Offset Productivity $621 Audience Measurement Plan / Optimize TOTAL AUDIENCE MEASUREMENT DRIVING GROWTH 4.2% 4.7% 3Q YoY% 4.6% ($M, growth in constant currency) 3Q 2019 MEDIA YTD YoY% $1,848 0.0% 3.7% 2.7%
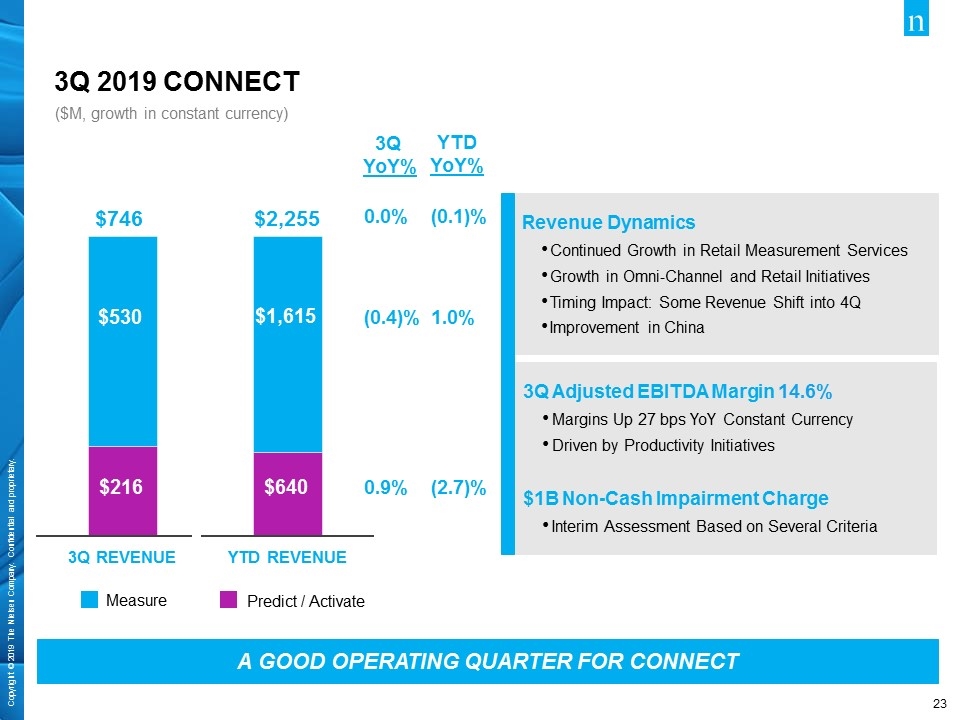
$530 A GOOD OPERATING QUARTER FOR CONNECT 0.9% (0.4)% 3Q YoY% 0.0% ($M, growth in constant currency) 3Q 2019 CONNECT (2.7)% 1.0% YTD YoY% (0.1)% $1,615 Predict / Activate Measure Revenue Dynamics Continued Growth in Retail Measurement Services Growth in Omni-Channel and Retail Initiatives Timing Impact: Some Revenue Shift into 4Q Improvement in China 3Q Adjusted EBITDA Margin 14.6% Margins Up 27 bps YoY Constant Currency Driven by Productivity Initiatives $1B Non-Cash Impairment Charge Interim Assessment Based on Several Criteria
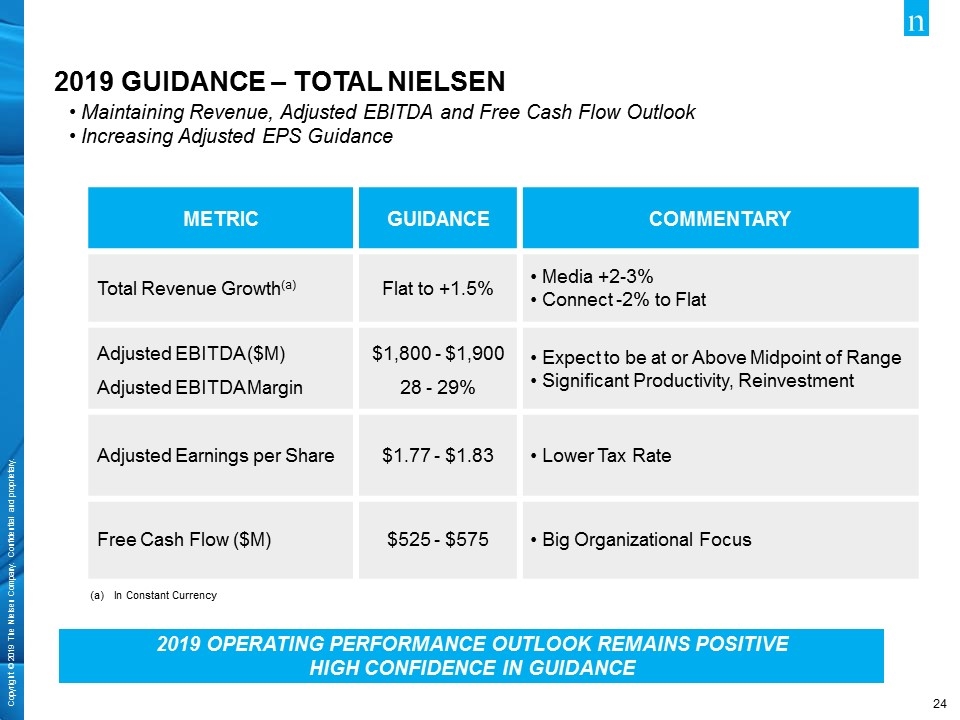
2019 OPERATING PERFORMANCE OUTLOOK REMAINS POSITIVE HIGH CONFIDENCE IN GUIDANCE Maintaining Revenue, Adjusted EBITDA and Free Cash Flow Outlook Increasing Adjusted EPS Guidance METRIC GUIDANCE COMMENTARY Total Revenue Growth(a) Flat to +1.5% Media +2-3% Connect -2% to Flat Adjusted EBITDA ($M) Adjusted EBITDA Margin $1,800 - $1,900 28 - 29% Expect to be at or Above Midpoint of Range Significant Productivity, Reinvestment Adjusted Earnings per Share $1.77 - $1.83 Lower Tax Rate Free Cash Flow ($M) $525 - $575 Big Organizational Focus In Constant Currency 2019 GUIDANCE – total nielsen
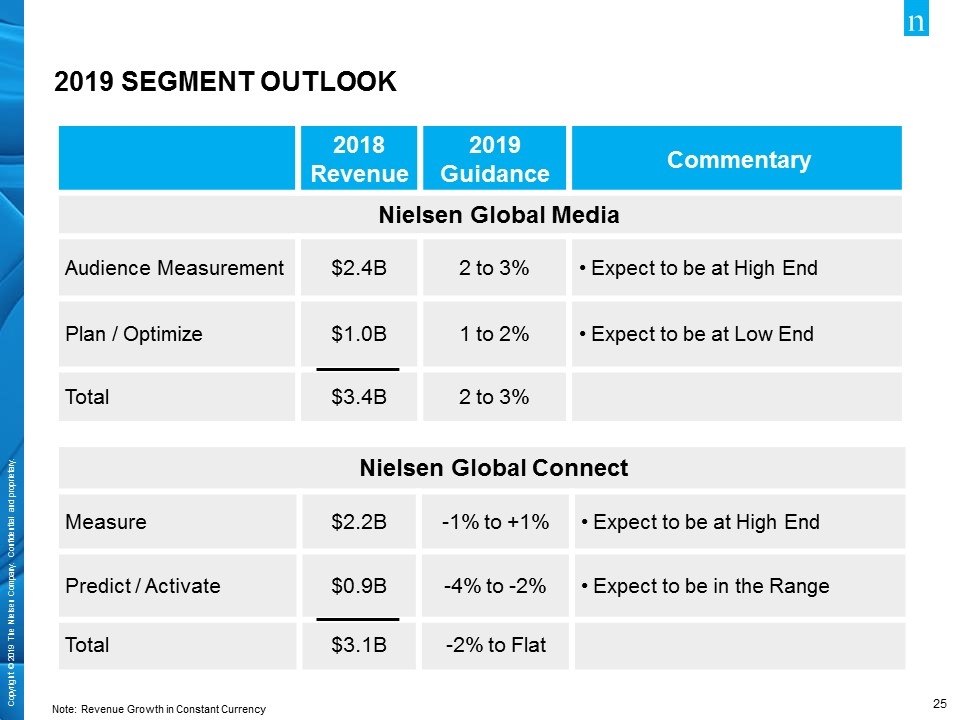
2018 Revenue 2019 Guidance Commentary Nielsen Global Media Audience Measurement $2.4B 2 to 3% Expect to be at High End Plan / Optimize $1.0B 1 to 2% Expect to be at Low End Total $3.4B 2 to 3% Nielsen Global Connect Measure $2.2B -1% to +1% Expect to be at High End Predict / Activate $0.9B -4% to -2% Expect to be in the Range Total $3.1B -2% to Flat Note: Revenue Growth in Constant Currency 2019 SEGMENT OUTLOOK

SUMMARY
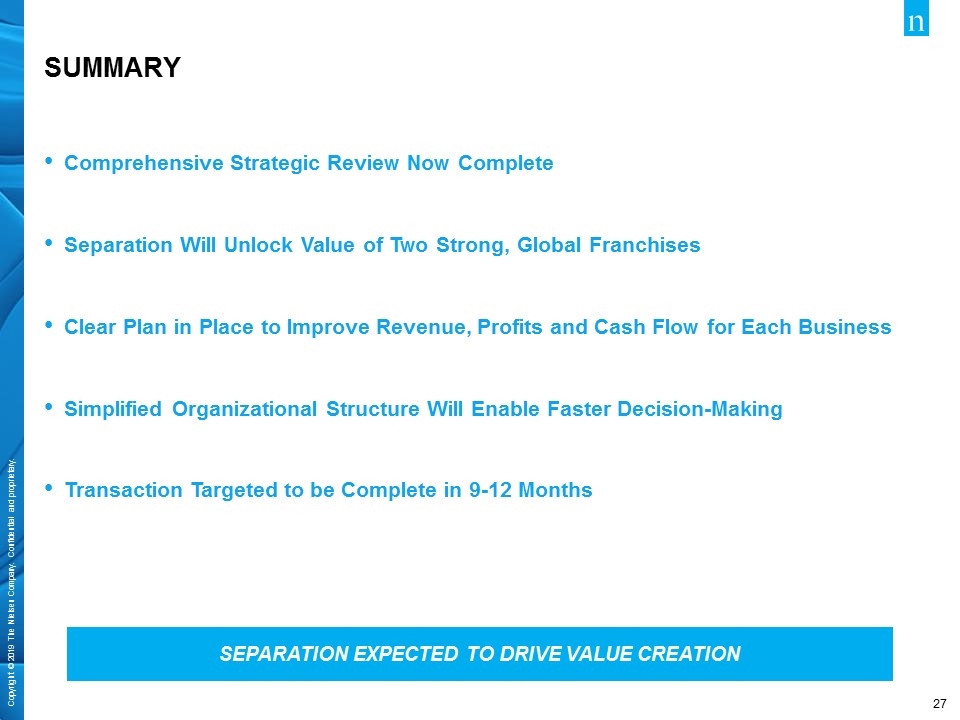
SEPARATION EXPECTED TO DRIVE VALUE CREATION SUMMARY Comprehensive Strategic Review Now Complete Separation Will Unlock Value of Two Strong, Global Franchises Clear Plan in Place to Improve Revenue, Profits and Cash Flow for Each Business Simplified Organizational Structure Will Enable Faster Decision-Making Transaction Targeted to be Complete in 9-12 Months

Q&A

APPENDIX
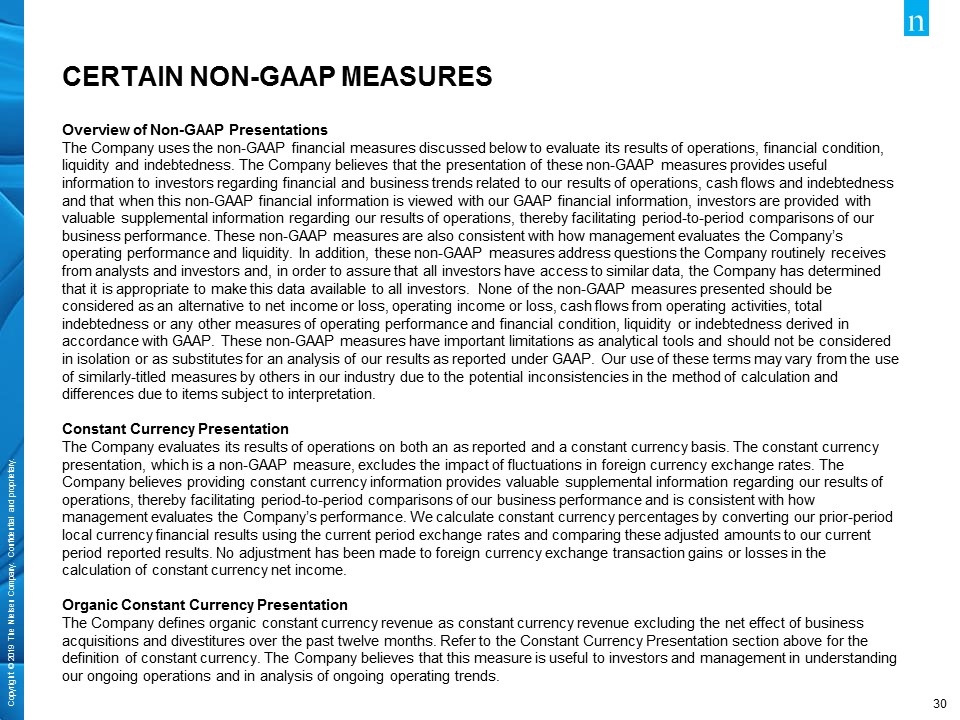
Certain non-gaap measures Overview of Non-GAAP Presentations The Company uses the non-GAAP financial measures discussed below to evaluate its results of operations, financial condition, liquidity and indebtedness. The Company believes that the presentation of these non-GAAP measures provides useful information to investors regarding financial and business trends related to our results of operations, cash flows and indebtedness and that when this non-GAAP financial information is viewed with our GAAP financial information, investors are provided with valuable supplemental information regarding our results of operations, thereby facilitating period-to-period comparisons of our business performance. These non-GAAP measures are also consistent with how management evaluates the Company’s operating performance and liquidity. In addition, these non-GAAP measures address questions the Company routinely receives from analysts and investors and, in order to assure that all investors have access to similar data, the Company has determined that it is appropriate to make this data available to all investors. None of the non-GAAP measures presented should be considered as an alternative to net income or loss, operating income or loss, cash flows from operating activities, total indebtedness or any other measures of operating performance and financial condition, liquidity or indebtedness derived in accordance with GAAP. These non-GAAP measures have important limitations as analytical tools and should not be considered in isolation or as substitutes for an analysis of our results as reported under GAAP. Our use of these terms may vary from the use of similarly-titled measures by others in our industry due to the potential inconsistencies in the method of calculation and differences due to items subject to interpretation. Constant Currency Presentation The Company evaluates its results of operations on both an as reported and a constant currency basis. The constant currency presentation, which is a non-GAAP measure, excludes the impact of fluctuations in foreign currency exchange rates. The Company believes providing constant currency information provides valuable supplemental information regarding our results of operations, thereby facilitating period-to-period comparisons of our business performance and is consistent with how management evaluates the Company’s performance. We calculate constant currency percentages by converting our prior-period local currency financial results using the current period exchange rates and comparing these adjusted amounts to our current period reported results. No adjustment has been made to foreign currency exchange transaction gains or losses in the calculation of constant currency net income. Organic Constant Currency Presentation The Company defines organic constant currency revenue as constant currency revenue excluding the net effect of business acquisitions and divestitures over the past twelve months. Refer to the Constant Currency Presentation section above for the definition of constant currency. The Company believes that this measure is useful to investors and management in understanding our ongoing operations and in analysis of ongoing operating trends.
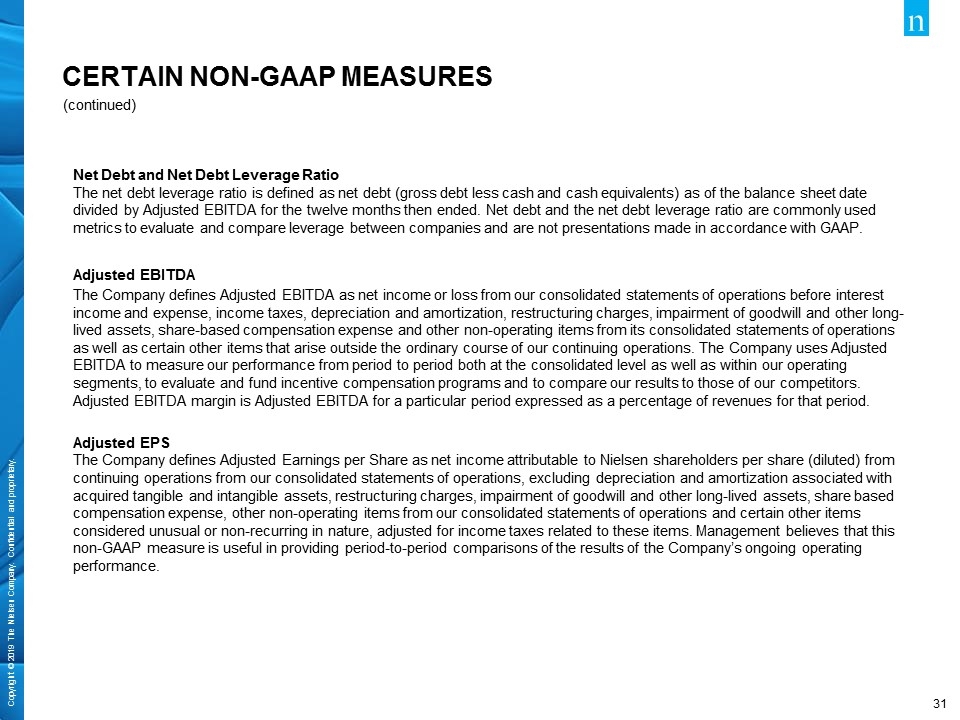
Net Debt and Net Debt Leverage Ratio The net debt leverage ratio is defined as net debt (gross debt less cash and cash equivalents) as of the balance sheet date divided by Adjusted EBITDA for the twelve months then ended. Net debt and the net debt leverage ratio are commonly used metrics to evaluate and compare leverage between companies and are not presentations made in accordance with GAAP. Adjusted EBITDA The Company defines Adjusted EBITDA as net income or loss from our consolidated statements of operations before interest income and expense, income taxes, depreciation and amortization, restructuring charges, impairment of goodwill and other long-lived assets, share-based compensation expense and other non-operating items from its consolidated statements of operations as well as certain other items that arise outside the ordinary course of our continuing operations. The Company uses Adjusted EBITDA to measure our performance from period to period both at the consolidated level as well as within our operating segments, to evaluate and fund incentive compensation programs and to compare our results to those of our competitors. Adjusted EBITDA margin is Adjusted EBITDA for a particular period expressed as a percentage of revenues for that period. Adjusted EPS The Company defines Adjusted Earnings per Share as net income attributable to Nielsen shareholders per share (diluted) from continuing operations from our consolidated statements of operations, excluding depreciation and amortization associated with acquired tangible and intangible assets, restructuring charges, impairment of goodwill and other long-lived assets, share based compensation expense, other non-operating items from our consolidated statements of operations and certain other items considered unusual or non-recurring in nature, adjusted for income taxes related to these items. Management believes that this non-GAAP measure is useful in providing period-to-period comparisons of the results of the Company’s ongoing operating performance. (continued) Certain non-gaap measures
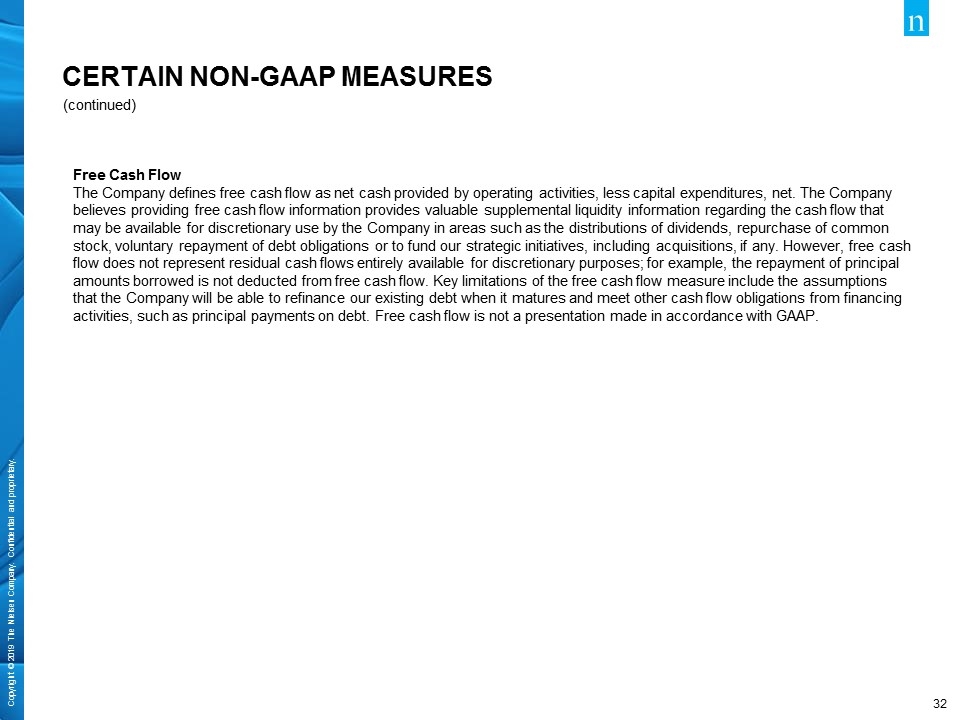
Free Cash Flow The Company defines free cash flow as net cash provided by operating activities, less capital expenditures, net. The Company believes providing free cash flow information provides valuable supplemental liquidity information regarding the cash flow that may be available for discretionary use by the Company in areas such as the distributions of dividends, repurchase of common stock, voluntary repayment of debt obligations or to fund our strategic initiatives, including acquisitions, if any. However, free cash flow does not represent residual cash flows entirely available for discretionary purposes; for example, the repayment of principal amounts borrowed is not deducted from free cash flow. Key limitations of the free cash flow measure include the assumptions that the Company will be able to refinance our existing debt when it matures and meet other cash flow obligations from financing activities, such as principal payments on debt. Free cash flow is not a presentation made in accordance with GAAP. (continued) Certain non-gaap measures
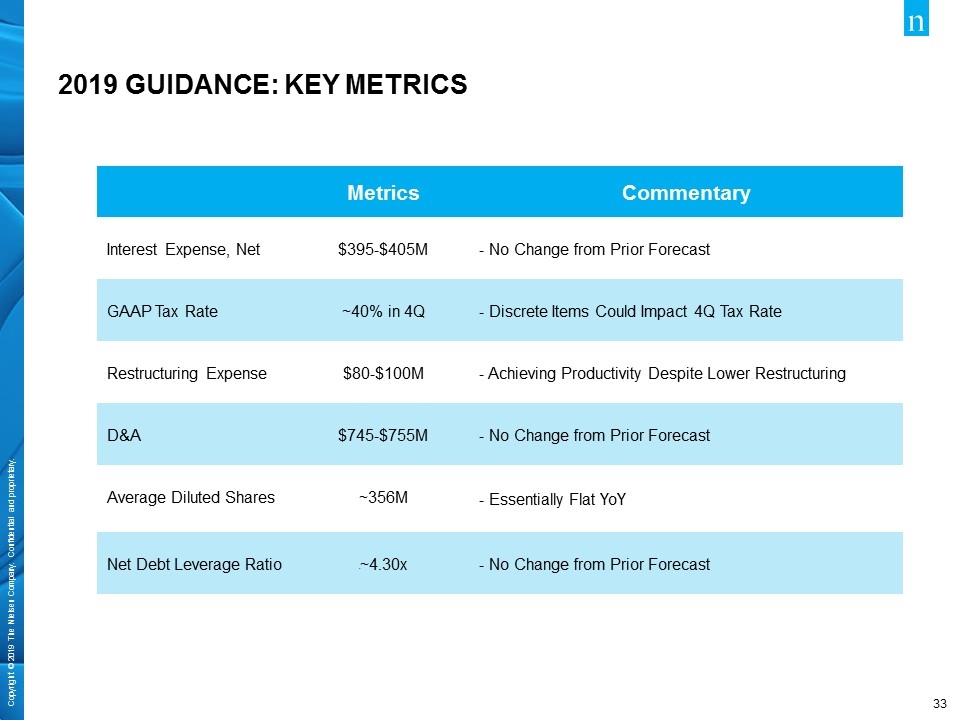
2019 GUIDANCE: KEY METRICS Metrics Commentary Interest Expense, Net $395-$405M - No Change from Prior Forecast GAAP Tax Rate ~40% in 4Q - Discrete Items Could Impact 4Q Tax Rate Restructuring Expense $80-$100M - Achieving Productivity Despite Lower Restructuring D&A $745-$755M - No Change from Prior Forecast Average Diluted Shares ~356M - Essentially Flat YoY Net Debt Leverage Ratio ~4.30x - No Change from Prior Forecast
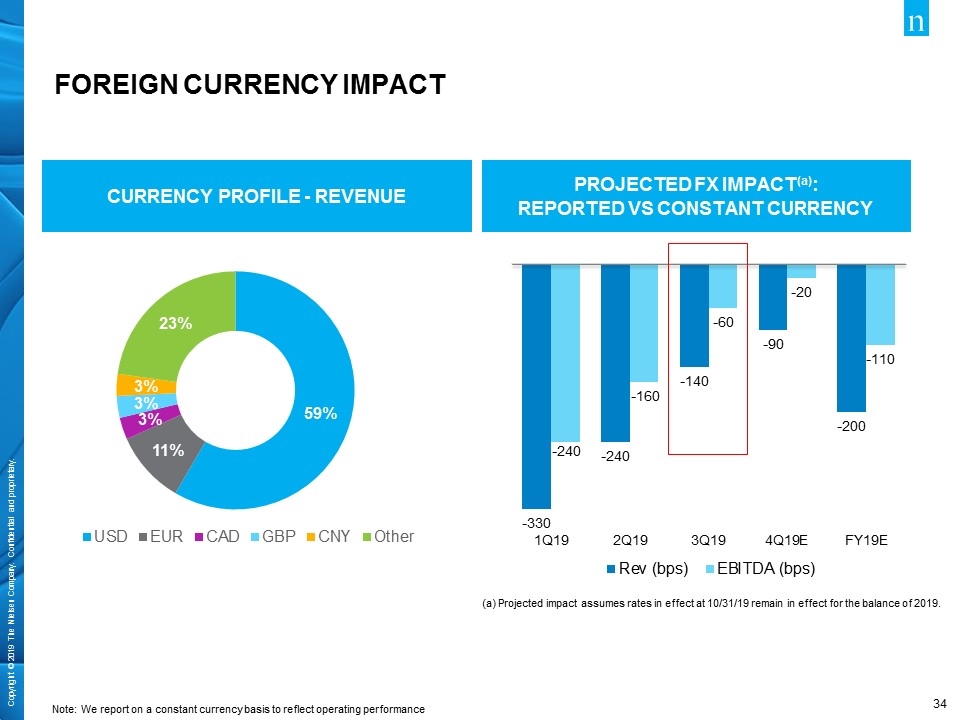
(a) Projected impact assumes rates in effect at 10/31/19 remain in effect for the balance of 2019. Note: We report on a constant currency basis to reflect operating performance CURRENCY PROFILE - REVENUE PROJECTED FX IMPACT(a): REPORTED VS CONSTANT CURRENCY Foreign currency impact
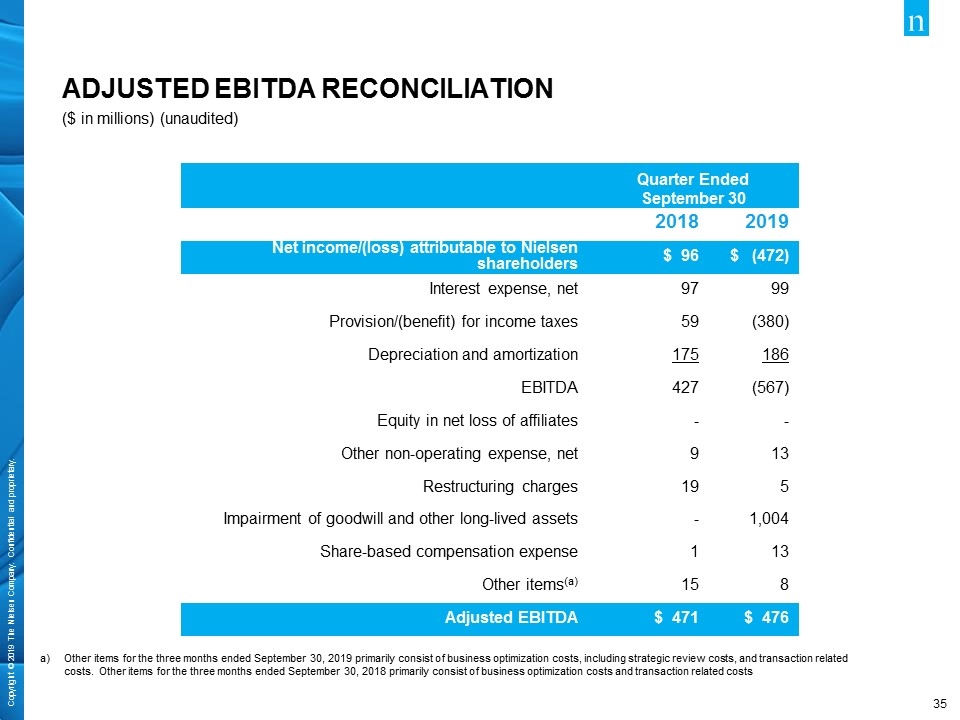
Adjusted ebitda reconciliation Quarter Ended September 30 2018 2019 Net income/(loss) attributable to Nielsen shareholders $ 96 $ (472) Interest expense, net 97 99 Provision/(benefit) for income taxes 59 (380) Depreciation and amortization 175 186 EBITDA 427 (567) Equity in net loss of affiliates - - Other non-operating expense, net 9 13 Restructuring charges 19 5 Impairment of goodwill and other long-lived assets - 1,004 Share-based compensation expense 1 13 Other items(a) 15 8 Adjusted EBITDA $ 471 $ 476 ($ in millions) (unaudited) Other items for the three months ended September 30, 2019 primarily consist of business optimization costs, including strategic review costs, and transaction related costs. Other items for the three months ended September 30, 2018 primarily consist of business optimization costs and transaction related costs
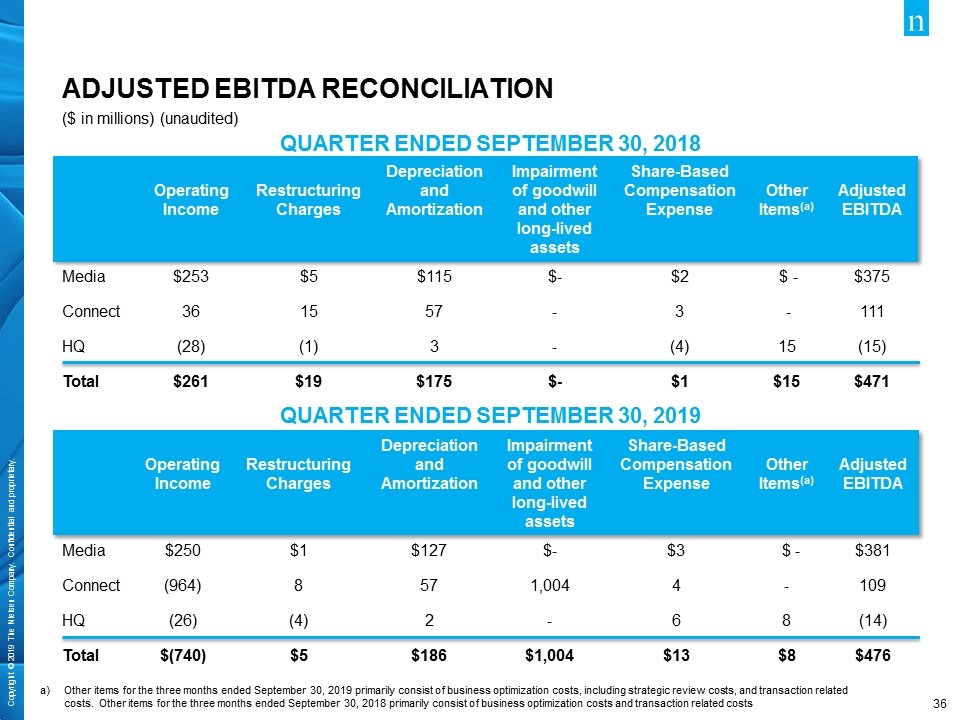
Operating Income Restructuring Charges Depreciation and Amortization Impairment of goodwill and other long-lived assets Share-Based Compensation Expense Other Items(a) Adjusted EBITDA Media $250 $1 $127 $- $3 $ - $381 Connect (964) 8 57 1,004 4 - 109 HQ (26) (4) 2 - 6 8 (14) Total $(740) $5 $186 $1,004 $13 $8 $476 Operating Income Restructuring Charges Depreciation and Amortization Impairment of goodwill and other long-lived assets Share-Based Compensation Expense Other Items(a) Adjusted EBITDA Media $253 $5 $115 $- $2 $ - $375 Connect 36 15 57 - 3 - 111 HQ (28) (1) 3 - (4) 15 (15) Total $261 $19 $175 $- $1 $15 $471 QUARTER ENDED SEPTEMBER 30, 2018 QUARTER ENDED SEPTEMBER 30, 2019 Other items for the three months ended September 30, 2019 primarily consist of business optimization costs, including strategic review costs, and transaction related costs. Other items for the three months ended September 30, 2018 primarily consist of business optimization costs and transaction related costs Adjusted ebitda reconciliation ($ in millions) (unaudited)
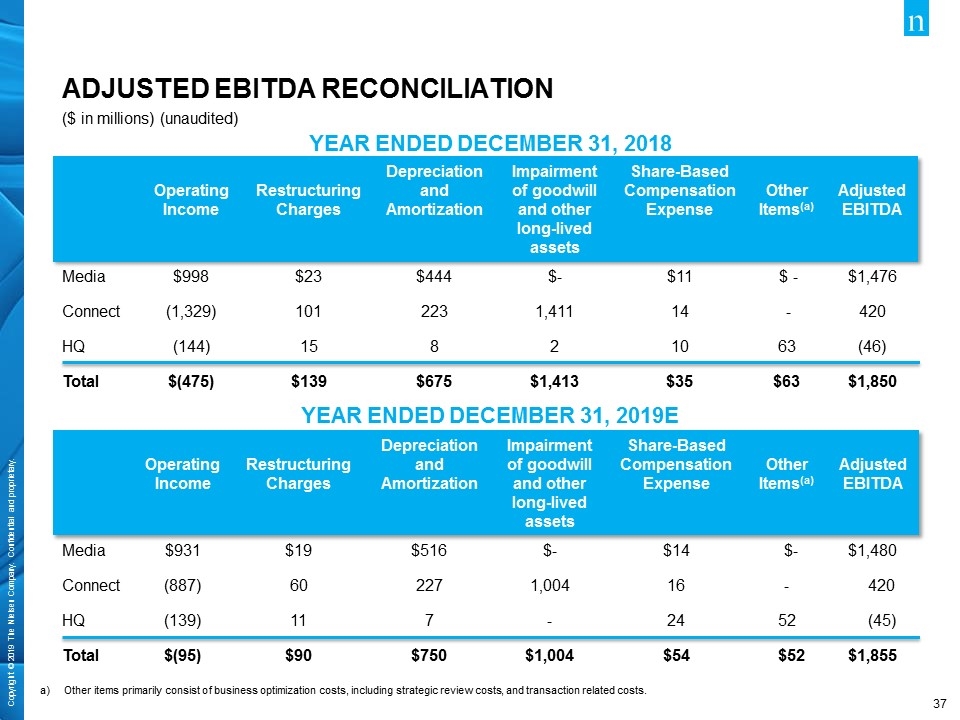
Operating Income Restructuring Charges Depreciation and Amortization Impairment of goodwill and other long-lived assets Share-Based Compensation Expense Other Items(a) Adjusted EBITDA Media $931 $19 $516 $- $14 $- $1,480 Connect (887) 60 227 1,004 16 - 420 HQ (139) 11 7 - 24 52 (45) Total $(95) $90 $750 $1,004 $54 $52 $1,855 Operating Income Restructuring Charges Depreciation and Amortization Impairment of goodwill and other long-lived assets Share-Based Compensation Expense Other Items(a) Adjusted EBITDA Media $998 $23 $444 $- $11 $ - $1,476 Connect (1,329) 101 223 1,411 14 - 420 HQ (144) 15 8 2 10 63 (46) Total $(475) $139 $675 $1,413 $35 $63 $1,850 YEAR ENDED DECEMBER 31, 2018 YEAR ENDED DECEMBER 31, 2019E Other items primarily consist of business optimization costs, including strategic review costs, and transaction related costs. Adjusted ebitda reconciliation ($ in millions) (unaudited)
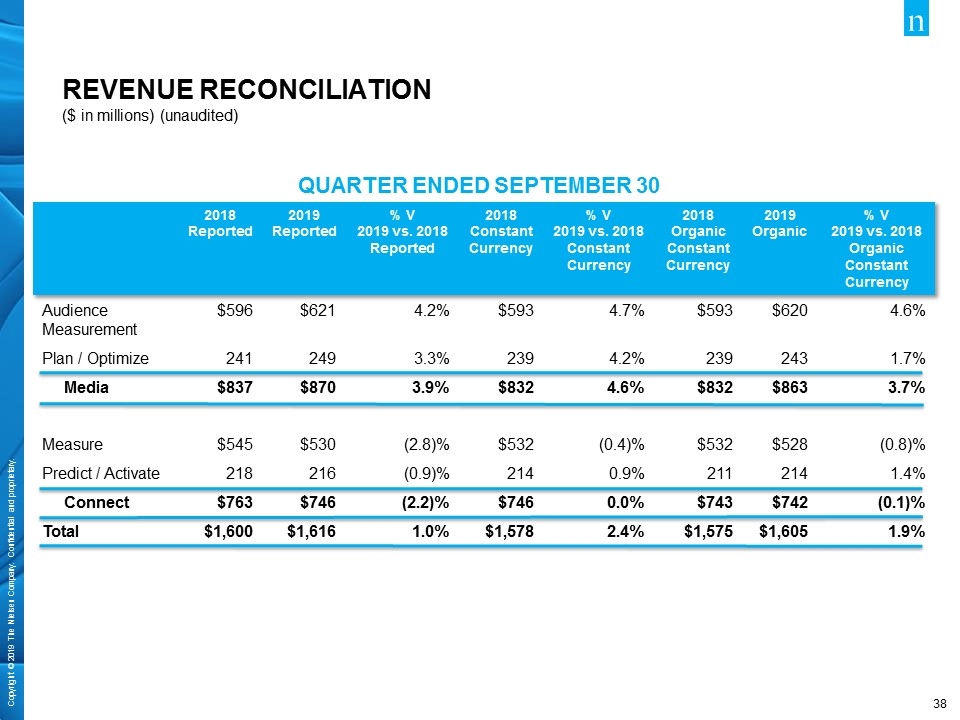
Revenue reconciliation ($ in millions) (unaudited) 2018 Reported 2019 Reported % V 2019 vs. 2018 Reported 2018 Constant Currency % V 2019 vs. 2018 Constant Currency 2018 Organic Constant Currency 2019 Organic % V 2019 vs. 2018 Organic Constant Currency Audience Measurement $596 $621 4.2% $593 4.7% $593 $620 4.6% Plan / Optimize 241 249 3.3% 239 4.2% 239 243 1.7% Media $837 $870 3.9% $832 4.6% $832 $863 3.7% Measure $545 $530 (2.8)% $532 (0.4)% $532 $528 (0.8)% Predict / Activate 218 216 (0.9)% 214 0.9% 211 214 1.4% Connect $763 $746 (2.2)% $746 0.0% $743 $742 (0.1)% Total $1,600 $1,616 1.0% $1,578 2.4% $1,575 $1,605 1.9% QUARTER ENDED SEPTEMBER 30
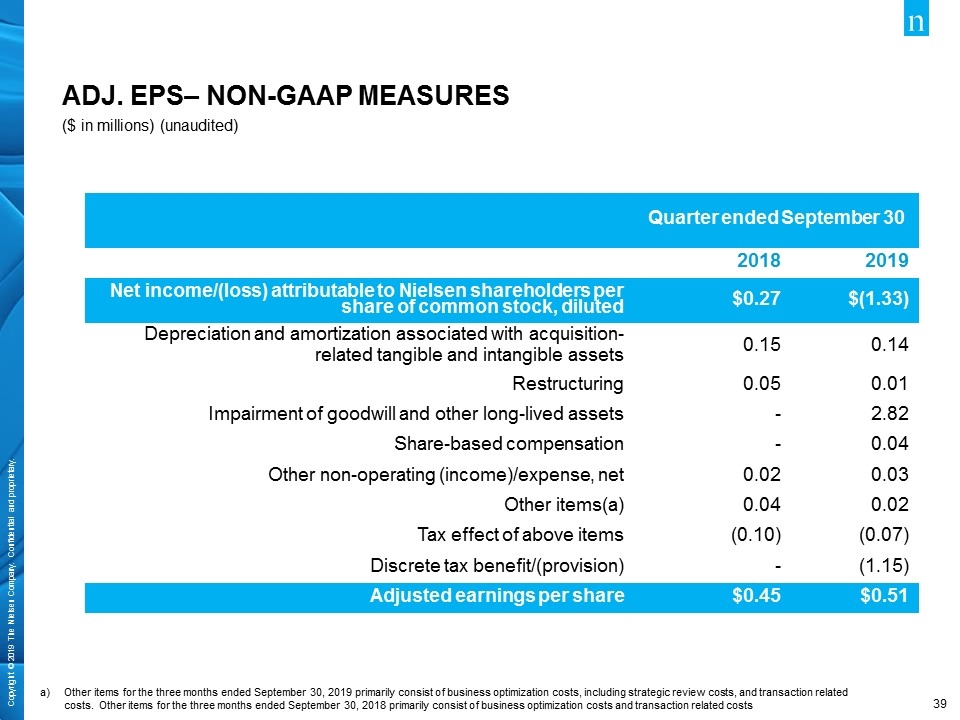
ADJ. EPS– NON-GAAP MEASURES ($ in millions) (unaudited) Quarter ended September 30 2018 2019 Net income/(loss) attributable to Nielsen shareholders per share of common stock, diluted $0.27 $(1.33) Depreciation and amortization associated with acquisition- related tangible and intangible assets 0.15 0.14 Restructuring 0.05 0.01 Impairment of goodwill and other long-lived assets - 2.82 Share-based compensation - 0.04 Other non-operating (income)/expense, net 0.02 0.03 Other items(a) 0.04 0.02 Tax effect of above items (0.10) (0.07) Discrete tax benefit/(provision) - (1.15) Adjusted earnings per share $0.45 $0.51 Other items for the three months ended September 30, 2019 primarily consist of business optimization costs, including strategic review costs, and transaction related costs. Other items for the three months ended September 30, 2018 primarily consist of business optimization costs and transaction related costs
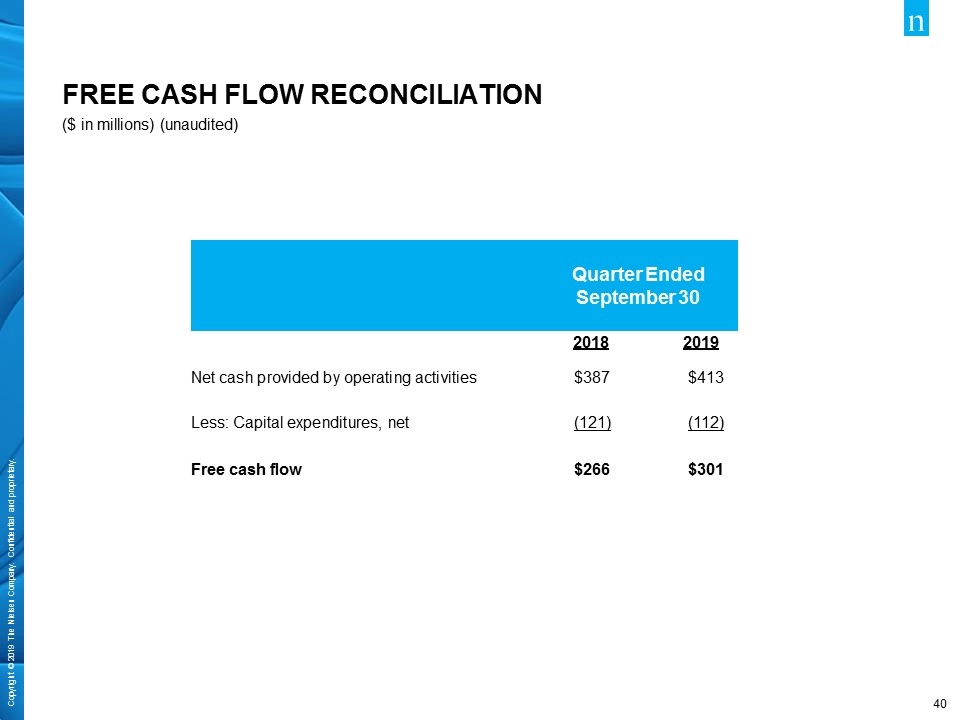
FREE CASH FLOW RECONCILIATION ($ in millions) (unaudited) Quarter Ended September 30 2018 2019 Net cash provided by operating activities $387 $413 Less: Capital expenditures, net (121) (112) Free cash flow $266 $301
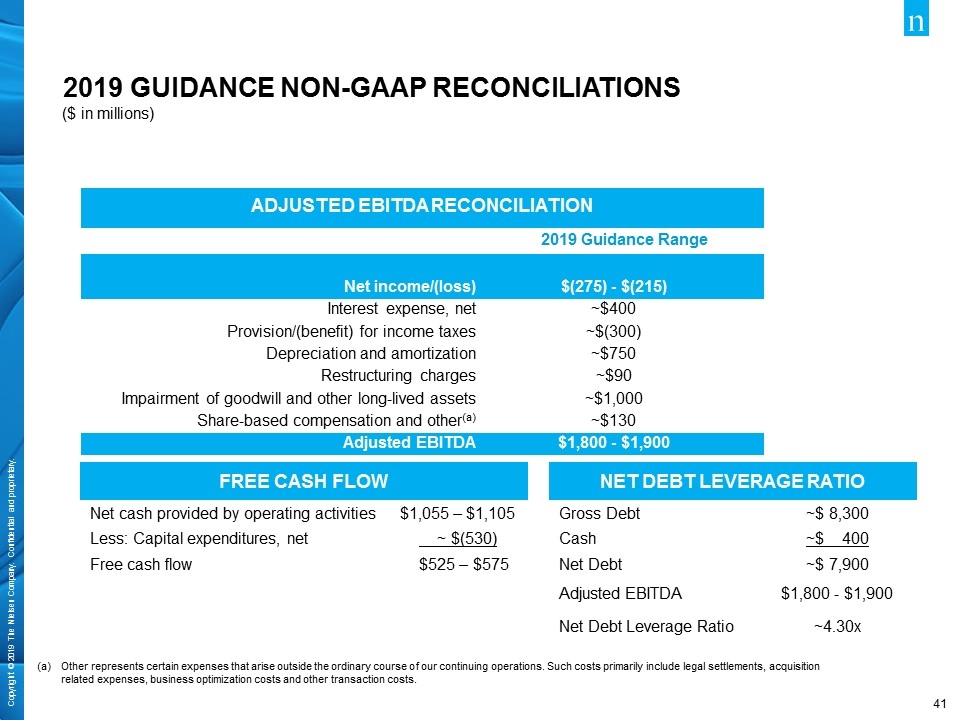
ADJUSTED EBITDA RECONCILIATION 2019 Guidance Range Net income/(loss) $(275) - $(215) Interest expense, net ~$400 Provision/(benefit) for income taxes ~$(300) Depreciation and amortization ~$750 Restructuring charges ~$90 Impairment of goodwill and other long-lived assets ~$1,000 Share-based compensation and other(a) ~$130 Adjusted EBITDA $1,800 - $1,900 Free cash flow Net cash provided by operating activities $1,055 – $1,105 Less: Capital expenditures, net ~ $(530) Free cash flow $525 – $575 Net Debt leverage ratio Gross Debt ~$ 8,300 Cash ~$ 400 Net Debt ~$ 7,900 Adjusted EBITDA $1,800 - $1,900 Net Debt Leverage Ratio ~4.30x Other represents certain expenses that arise outside the ordinary course of our continuing operations. Such costs primarily include legal settlements, acquisition related expenses, business optimization costs and other transaction costs. ($ in millions) 2019 guidance non-gaap reconciliations
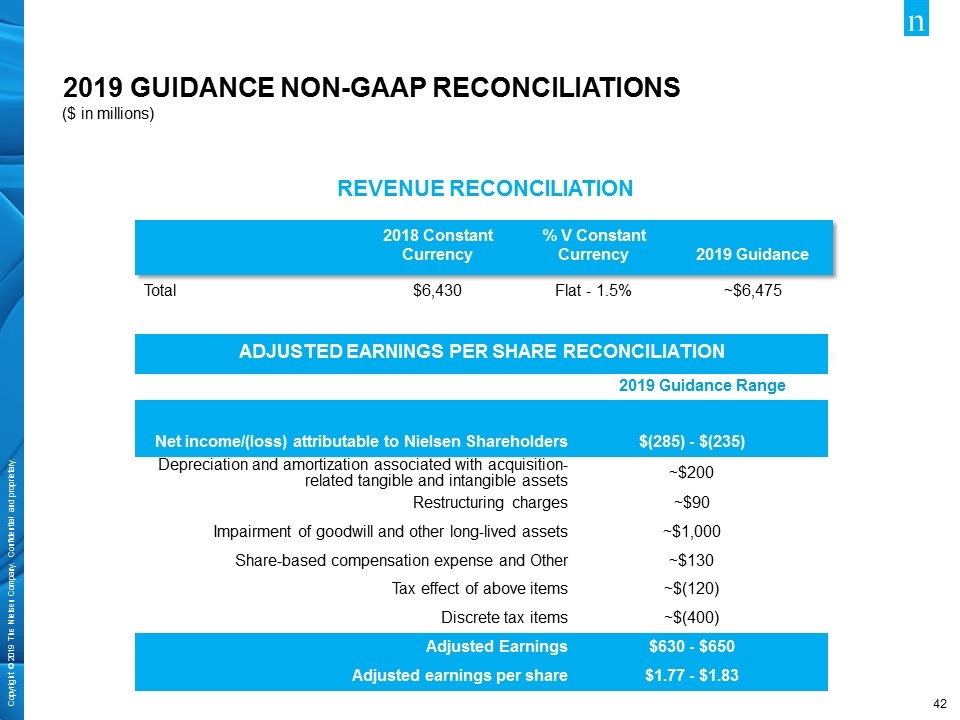
($ in millions) 2018 Constant Currency % V Constant Currency 2019 Guidance Total $6,430 Flat - 1.5% ~$6,475 REVENUE RECONCILIATION ADJUSTED EARNINGS PER SHARE RECONCILIATION 2019 Guidance Range Net income/(loss) attributable to Nielsen Shareholders $(285) - $(235) Depreciation and amortization associated with acquisition-related tangible and intangible assets ~$200 Restructuring charges ~$90 Impairment of goodwill and other long-lived assets ~$1,000 Share-based compensation expense and Other ~$130 Tax effect of above items ~$(120) Discrete tax items ~$(400) Adjusted Earnings $630 - $650 Adjusted earnings per share $1.77 - $1.83 2019 guidance non-gaap reconciliations
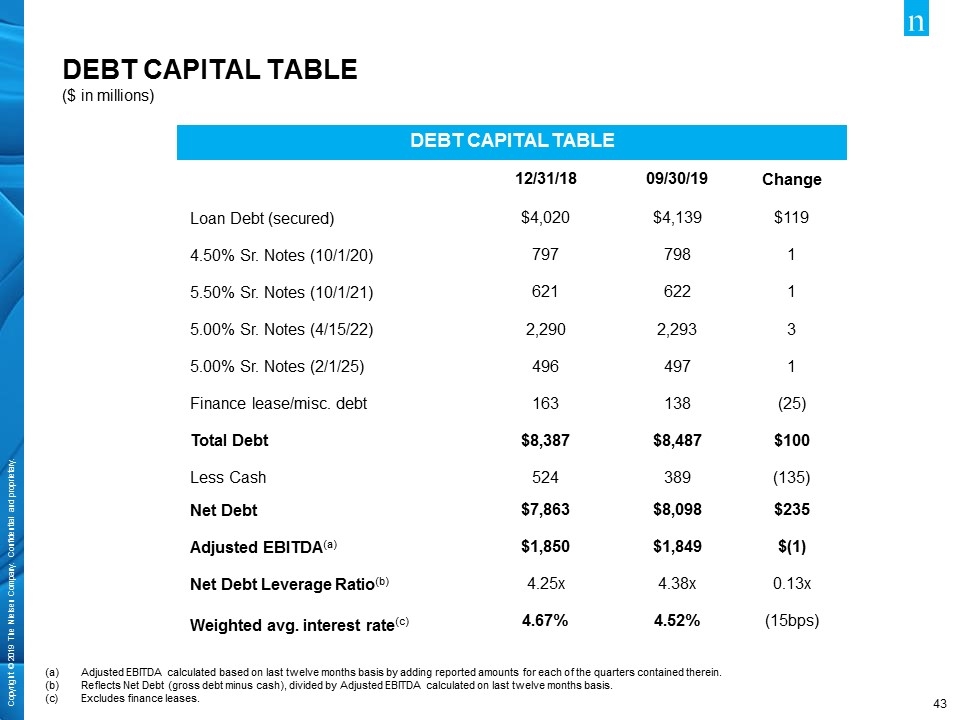
Debt capital table ($ in millions) Debt Capital Table 12/31/18 09/30/19 Change Loan Debt (secured) $4,020 $4,139 $119 4.50% Sr. Notes (10/1/20) 797 798 1 5.50% Sr. Notes (10/1/21) 621 622 1 5.00% Sr. Notes (4/15/22) 2,290 2,293 3 5.00% Sr. Notes (2/1/25) 496 497 1 Finance lease/misc. debt 163 138 (25) Total Debt $8,387 $8,487 $100 Less Cash 524 389 (135) Net Debt $7,863 $8,098 $235 Adjusted EBITDA(a) $1,850 $1,849 $(1) Net Debt Leverage Ratio(b) 4.25x 4.38x 0.13x Weighted avg. interest rate(c) 4.67% 4.52% (15bps) Adjusted EBITDA calculated based on last twelve months basis by adding reported amounts for each of the quarters contained therein. Reflects Net Debt (gross debt minus cash), divided by Adjusted EBITDA calculated on last twelve months basis. Excludes finance leases.
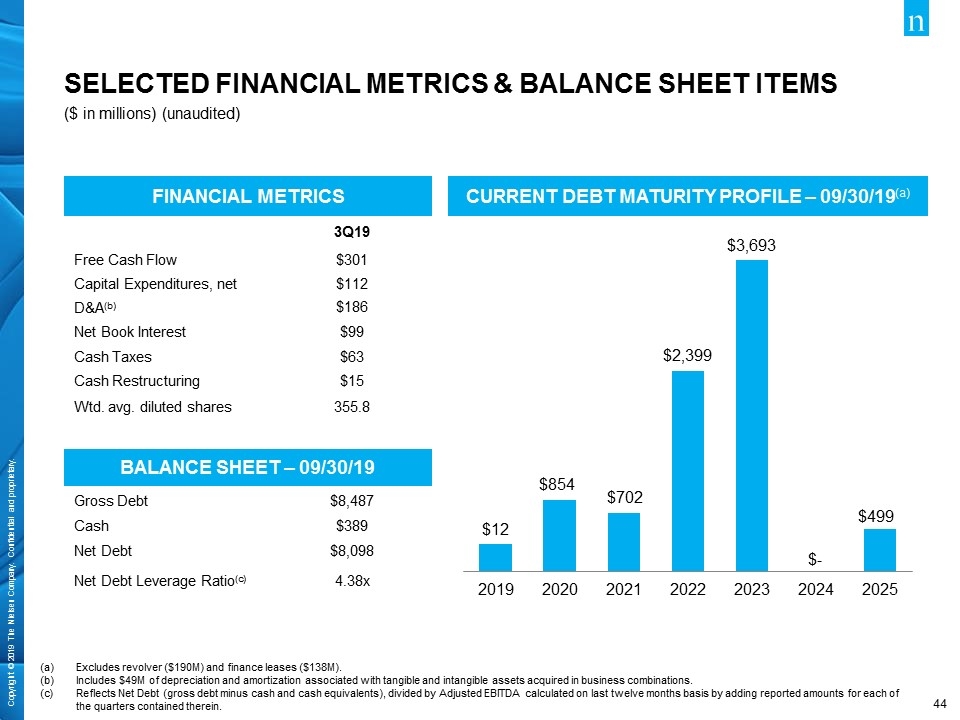
Selected financial metrics & balance sheet items ($ in millions) (unaudited) Financial metrics 3Q19 Free Cash Flow $301 Capital Expenditures, net $112 D&A(b) $186 Net Book Interest $99 Cash Taxes $63 Cash Restructuring $15 Wtd. avg. diluted shares 355.8 Balance Sheet – 09/30/19 Gross Debt $8,487 Cash $389 Net Debt $8,098 Net Debt Leverage Ratio(c) 4.38x CURRENT DEBT MATURITY PROFILE – 09/30/19(a) Excludes revolver ($190M) and finance leases ($138M). Includes $49M of depreciation and amortization associated with tangible and intangible assets acquired in business combinations. Reflects Net Debt (gross debt minus cash and cash equivalents), divided by Adjusted EBITDA calculated on last twelve months basis by adding reported amounts for each of the quarters contained therein. $-

Nielsen investor relations [email protected] +1.646.654.8153 http://www.nielsen.com/investors Follow @Nielsen


