Form 8-K PennyMac Financial Servi For: Sep 09
UNITED STATES
SECURITIES AND EXCHANGE COMMISSION
Washington, D.C. 20549
FORM 8-K
CURRENT REPORT
Pursuant to Section 13 or 15(d) of the Securities Exchange Act of 1934
Date of Report (Date of earliest event reported): September 9, 2019
PennyMac Financial Services, Inc.
(formerly known as New PennyMac Financial Services, Inc.)
(Exact name of registrant as specified in its charter)
|
Delaware |
|
001-38727 |
|
83-1098934 |
|
(State or other jurisdiction |
|
(Commission |
|
(IRS Employer |
|
of incorporation) |
|
File Number) |
|
Identification No.) |
|
3043 Townsgate Road, Westlake Village, California |
|
91361 |
|
(Address of principal executive offices) |
|
(Zip Code) |
(818) 224-7442
(Registrant’s telephone number, including area code)
Not Applicable
(Former name or former address, if changed since last report)
Check the appropriate box below if the Form 8-K filing is intended to simultaneously satisfy the filing obligation of the registrant under any of the following provisions:
o Written communications pursuant to Rule 425 under the Securities Act (17 CFR 230.425)
o Soliciting material pursuant to Rule 14a-12 under the Exchange Act (17 CFR 240.14a-12)
o Pre-commencement communications pursuant to Rule 14d-2(b) under the Exchange Act (17 CFR 240.14d-2(b))
o Pre-commencement communications pursuant to Rule 13e-4(c) under the Exchange Act (17 CFR 240.13e-4(c))
Securities registered pursuant to Section 12(b) of the Act:
|
Title of each class |
|
Trading Symbol(s) |
|
Name of each exchange on which registered |
|
Common Stock, $0.0001 par value |
|
PFSI |
|
New York Stock Exchange |
Indicate by check mark whether the registrant is an emerging growth company as defined in Rule 405 of the Securities Act of 1933 (§230.405 of this chapter) or Rule 12b-2 of the Securities Exchange Act of 1934 (§240.12b-2 of this chapter).
Emerging growth company o
If an emerging growth company, indicate by check mark if the registrant has elected not to use the extended transition period for complying with any new or revised financial accounting standards provided pursuant to Section 13(a) of the Exchange Act. o
Item 7.01 Regulation FD Disclosure.
David A. Spector, President and Chief Executive Officer of PennyMac Financial Services, Inc. (the “Company”), and Andrew S. Chang, Senior Managing Director and Chief Financial Officer of the Company, will present at the Barclays Global Financial Services Conference in New York, NY, at 3:30 p.m. Eastern Time on Tuesday, September 10, 2019 and participate in meetings beginning on September 9, 2019 in connection with the conference. A copy of the presentation to be used by Mr. Spector and Mr. Chang has been made available on the Company’s investor relations website and is furnished herewith as Exhibit 99.1 to this Current Report on Form 8-K.
The information in Item 7.01 of this Current Report on Form 8-K, including Exhibit 99.1 attached hereto, shall not be deemed “filed” for purposes of Section 18 of the Securities Exchange Act of 1934, or otherwise subject to the liabilities of Section 18, nor shall it be deemed incorporated by reference into any disclosure document relating to the Company, except to the extent, if any, expressly set forth by specific reference in such filing.
Item 9.01 Financial Statements and Exhibits.
(d) Exhibits.
|
Exhibit No. |
|
Description |
|
|
|
|
|
99.1 |
|
SIGNATURE
Pursuant to the requirements of the Securities Exchange Act of 1934, the registrant has duly caused this report to be signed on its behalf by the undersigned hereunto duly authorized.
|
|
PENNYMAC FINANCIAL SERVICES, INC. |
|
|
|
|
|
|
|
Dated: September 9, 2019 |
/s/ Andrew S. Chang |
|
|
Andrew S. Chang |
|
|
Senior Managing Director and Chief Financial Officer |
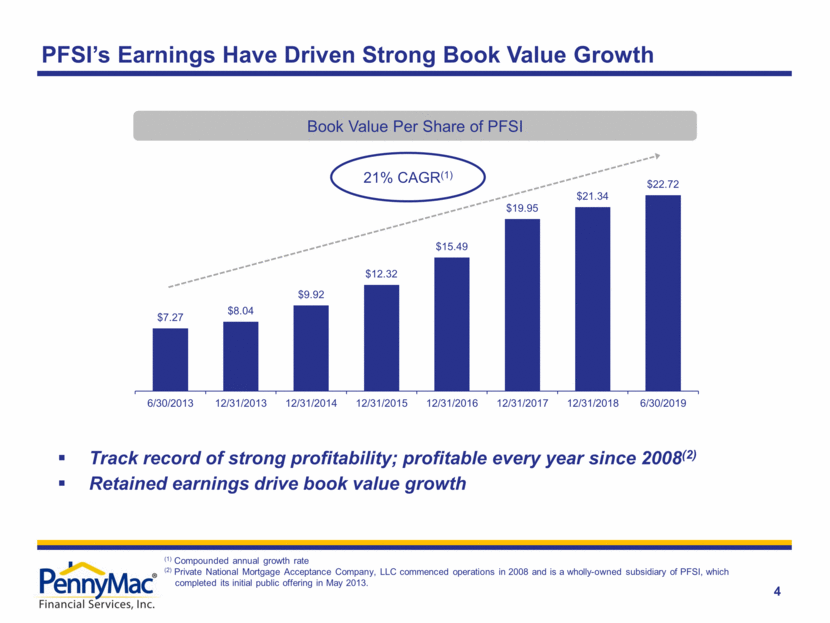
Forward-Looking Statements 2 This presentation contains forward-looking statements within the meaning of Section 21E of the Securities Exchange Act of 1934, as amended, regarding management’s beliefs, estimates, projections and assumptions with respect to, among other things, the Company’s financial results, future operations, business plans and investment strategies, as well as industry and market conditions, all of which are subject to change. Words like “believe,” “expect,” “anticipate,” “promise,” “plan,” and other expressions or words of similar meanings, as well as future or conditional verbs such as “will,” “would,” “should,” “could,” or “may” are generally intended to identify forward-looking statements. Actual results and operations for any future period may vary materially from those projected herein and from past results discussed herein. These forward-looking statements include statements regarding the Company’s corporate reorganization, the expected benefits of such reorganization and the related impact on existing stakeholders, estimates regarding future market capitalization and the anticipated financial impact of the corporate reorganization. Factors which could cause actual results to differ materially from historical results or those anticipated include, but are not limited to: the continually changing federal, state and local laws and regulations applicable to the highly regulated industry in which we operate; lawsuits or governmental actions that may result from any noncompliance with the laws and regulations applicable to our businesses; the mortgage lending and servicing-related regulations promulgated by the Consumer Financial Protection Bureau and its enforcement of these regulations; our dependence on U.S. government-sponsored entities and changes in their current roles or their guarantees or guidelines; changes to government mortgage modification programs; the licensing and operational requirements of states and other jurisdictions applicable to the Company’s businesses, to which our bank competitors are not subject; foreclosure delays and changes in foreclosure practices; certain banking regulations that may limit our business activities; changes in macroeconomic and U.S. real estate market conditions; difficulties inherent in growing loan production volume; difficulties inherent in adjusting the size of our operations to reflect changes in business levels; purchase opportunities for mortgage servicing rights and our success in winning bids; changes in prevailing interest rates; increases in loan delinquencies and defaults; our reliance on PennyMac Mortgage Investment Trust (NYSE: PMT) as a significant source of financing for, and revenue related to, our mortgage banking business; any required additional capital and liquidity to support business growth that may not be available on acceptable terms, if at all; our obligation to indemnify third-party purchasers or repurchase loans if loans that we originate, acquire, service or assist in the fulfillment of, fail to meet certain criteria or characteristics or under other circumstances; our obligation to indemnify PMT if our services fail to meet certain criteria or characteristics or under other circumstances; decreases in the returns on the assets that we select and manage for our clients, and our resulting management and incentive fees; the extensive amount of regulation applicable to our investment management segment; conflicts of interest in allocating our services and investment opportunities among us and our advised entities; the effect of public opinion on our reputation; our recent growth; our ability to effectively identify, manage, monitor and mitigate financial risks; our initiation of new business activities or expansion of existing business activities; our ability to detect misconduct and fraud; and our ability to mitigate cybersecurity risks and cyber incidents. Our exposure to risks of loss resulting from adverse weather conditions and man-made or natural disasters; and or organizational structure and certain requirements in our charter documents. You should not place undue reliance on any forward-looking statement and should consider all of the uncertainties and risks described above, as well as those more fully discussed in reports and other documents filed by the Company with the Securities and Exchange Commission from time to time. The Company undertakes no obligation to publicly update or revise any forward-looking statements or any other information contained herein, and the statements made in this presentation are current as of the date of this presentation only.
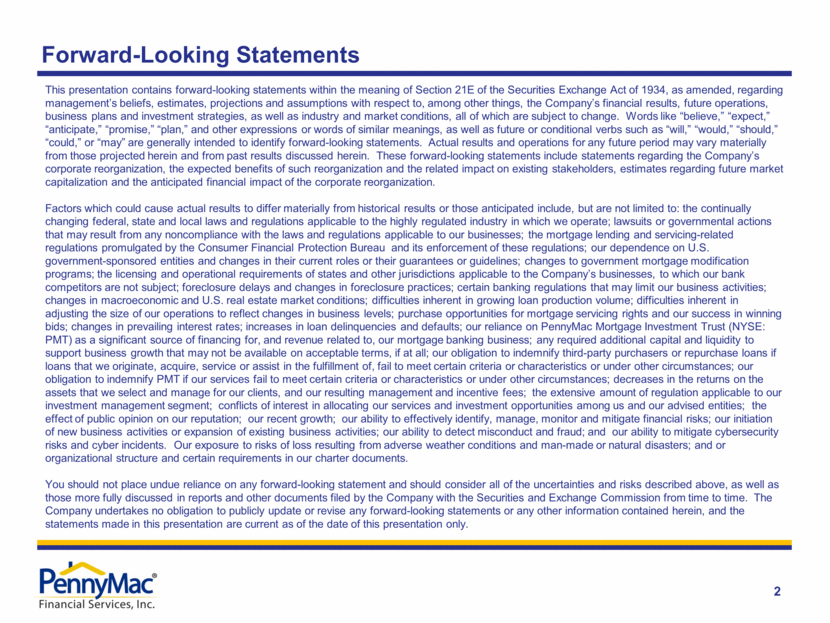
3 PFSI Is a Leading Nonbank Residential Mortgage Specialist (1) Source: Inside Mortgage Finance, for the last twelve months ended June 30, 2019 or as of June 30, 2019 (2) Reflects PMT’s issuance of 9.2 million common shares which settled on August 13, 2019 Loan Production Volume Loan Servicing Portfolio Net Assets Under Management 12th year of operations; initial public offering in May 2013 Leading Market Position in the U.S. 4th largest mortgage producer(1) 7th largest mortgage servicer(1) Unique Capabilities Comprehensive and scalable mortgage platform with considerable opportunities for growth Significant technology investments drive competitive advantage and scale Well-developed and sophisticated risk management structure Unique, synergistic partnership with PennyMac Mortgage Investment Trust (NYSE: PMT), a tax-efficient investment vehicle (in billions) (2) Largest government-insured producer(1) 2nd largest correspondent producer(1) (UPB in billions) (UPB in billions) $31.7 $78.1 2013 LTM @ 6/30/2019 $1.2 $2.1 6/30/2013 6/30/2019 Pro Forma $44.4 $334.5 6/30/2013 6/30/2019
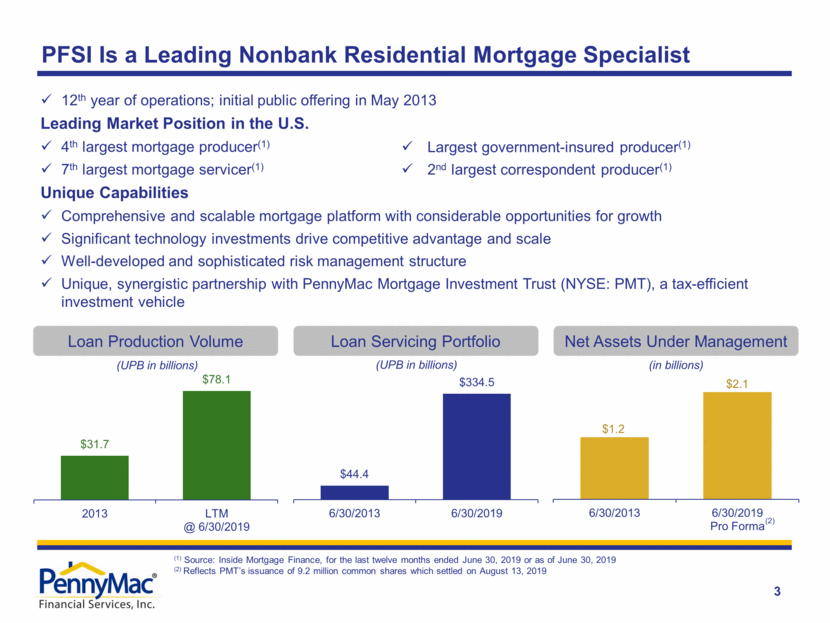
4 PFSI’s Earnings Have Driven Strong Book Value Growth Track record of strong profitability; profitable every year since 2008(2) Retained earnings drive book value growth Book Value Per Share of PFSI 21% CAGR(1) (1) Compounded annual growth rate (2) Private National Mortgage Acceptance Company, LLC commenced operations in 2008 and is a wholly-owned subsidiary of PFSI, which completed its initial public offering in May 2013. $7.27 $8.04 $9.92 $12.32 $15.49 $19.95 $21.34 $22.72 6/30/2013 12/31/2013 12/31/2014 12/31/2015 12/31/2016 12/31/2017 12/31/2018 6/30/2019
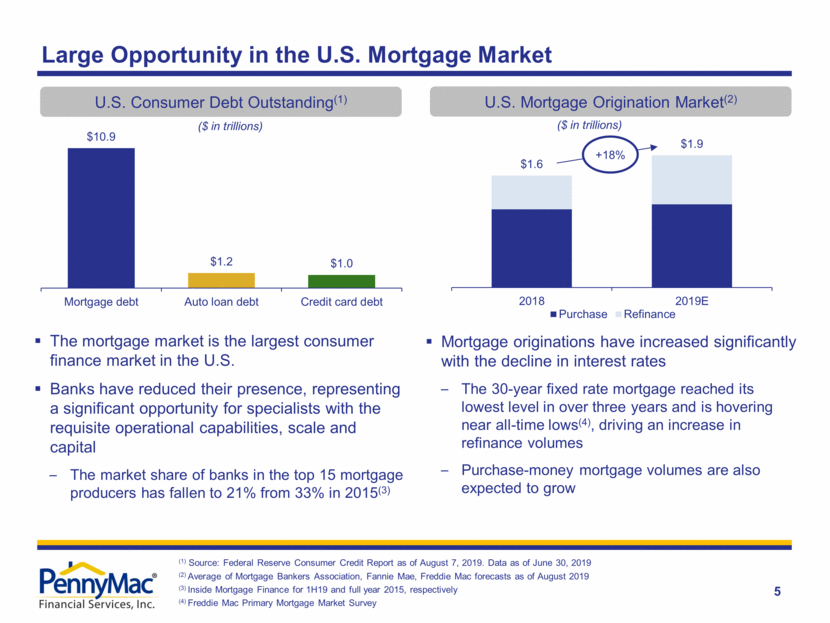
5 Large Opportunity in the U.S. Mortgage Market U.S. Consumer Debt Outstanding(1) The mortgage market is the largest consumer finance market in the U.S. Banks have reduced their presence, representing a significant opportunity for specialists with the requisite operational capabilities, scale and capital The market share of banks in the top 15 mortgage producers has fallen to 21% from 33% in 2015(3) ($ in trillions) (1) Source: Federal Reserve Consumer Credit Report as of August 7, 2019. Data as of June 30, 2019 (2) Average of Mortgage Bankers Association, Fannie Mae, Freddie Mac forecasts as of August 2019 (3) Inside Mortgage Finance for 1H19 and full year 2015, respectively (4) Freddie Mac Primary Mortgage Market Survey U.S. Mortgage Origination Market(2) Mortgage originations have increased significantly with the decline in interest rates The 30-year fixed rate mortgage reached its lowest level in over three years and is hovering near all-time lows(4), driving an increase in refinance volumes Purchase-money mortgage volumes are also expected to grow ($ in trillions) +18% $1.6 $1.9 2018 2019E Purchase Refinance $10.9 $1.2 $1.0 Mortgage debt Auto loan debt Credit card debt
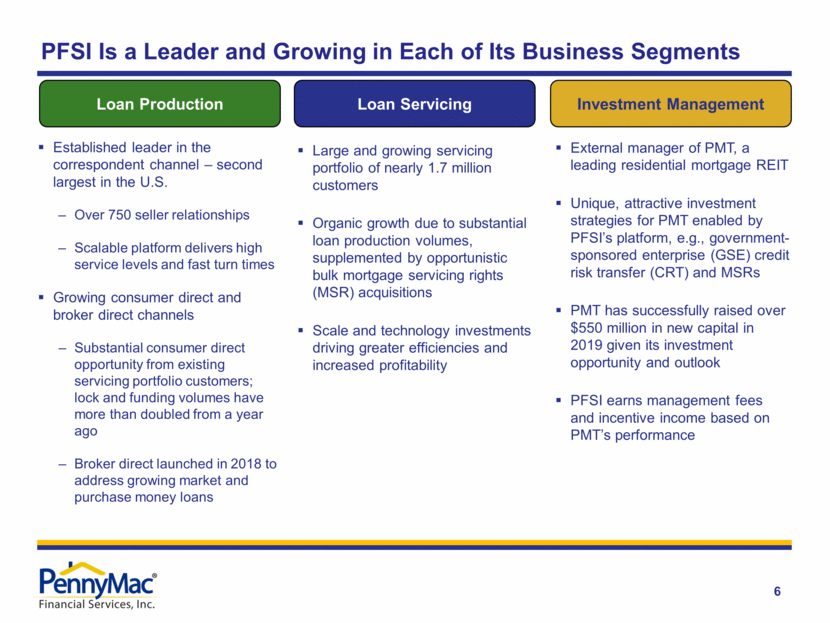
Loan Production Loan Servicing Investment Management Large and growing servicing portfolio of nearly 1.7 million customers Organic growth due to substantial loan production volumes, supplemented by opportunistic bulk mortgage servicing rights (MSR) acquisitions Scale and technology investments driving greater efficiencies and increased profitability External manager of PMT, a leading residential mortgage REIT Unique, attractive investment strategies for PMT enabled by PFSI’s platform, e.g., government-sponsored enterprise (GSE) credit risk transfer (CRT) and MSRs PMT has successfully raised over $550 million in new capital in 2019 given its investment opportunity and outlook PFSI earns management fees and incentive income based on PMT’s performance Established leader in the correspondent channel – second largest in the U.S. Over 750 seller relationships Scalable platform delivers high service levels and fast turn times Growing consumer direct and broker direct channels Substantial consumer direct opportunity from existing servicing portfolio customers; lock and funding volumes have more than doubled from a year ago Broker direct launched in 2018 to address growing market and purchase money loans 6 PFSI Is a Leader and Growing in Each of Its Business Segments
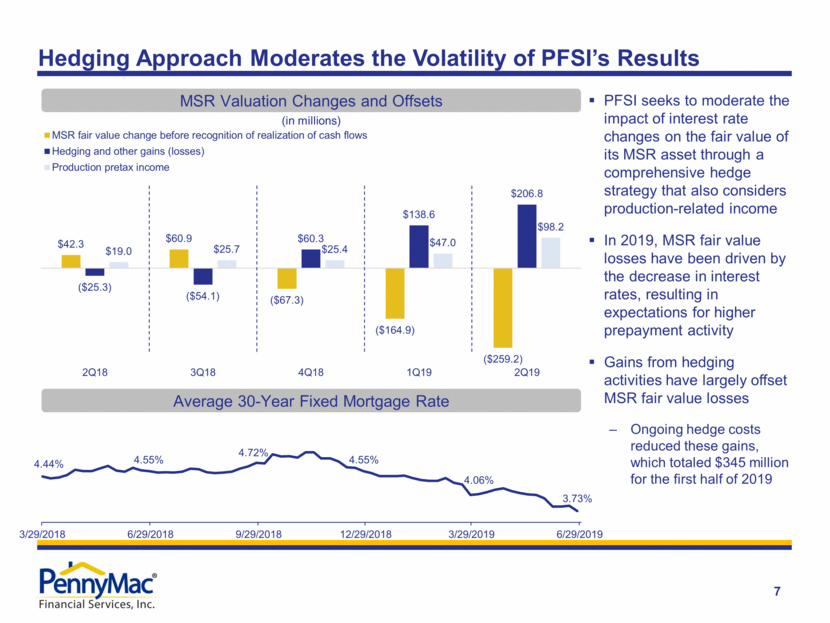
7 Hedging Approach Moderates the Volatility of PFSI’s Results MSR Valuation Changes and Offsets (in millions) PFSI seeks to moderate the impact of interest rate changes on the fair value of its MSR asset through a comprehensive hedge strategy that also considers production-related income In 2019, MSR fair value losses have been driven by the decrease in interest rates, resulting in expectations for higher prepayment activity Gains from hedging activities have largely offset MSR fair value losses Ongoing hedge costs reduced these gains, which totaled $345 million for the first half of 2019 Average 30-Year Fixed Mortgage Rate $42.3 $60.9 ($67.3) ($164.9) ($259.2) ($25.3) ($54.1) $60.3 $138.6 $206.8 $19.0 $25.7 $25.4 $47.0 $98.2 2Q18 3Q18 4Q18 1Q19 2Q19 MSR fair value change before recognition of realization of cash flows Hedging and other gains (losses) Production pretax income 4.44% 4.55% 4.72% 4.55% 4.06% 3.73% 3/29/2018 6/29/2018 9/29/2018 12/29/2018 3/29/2019 6/29/2019
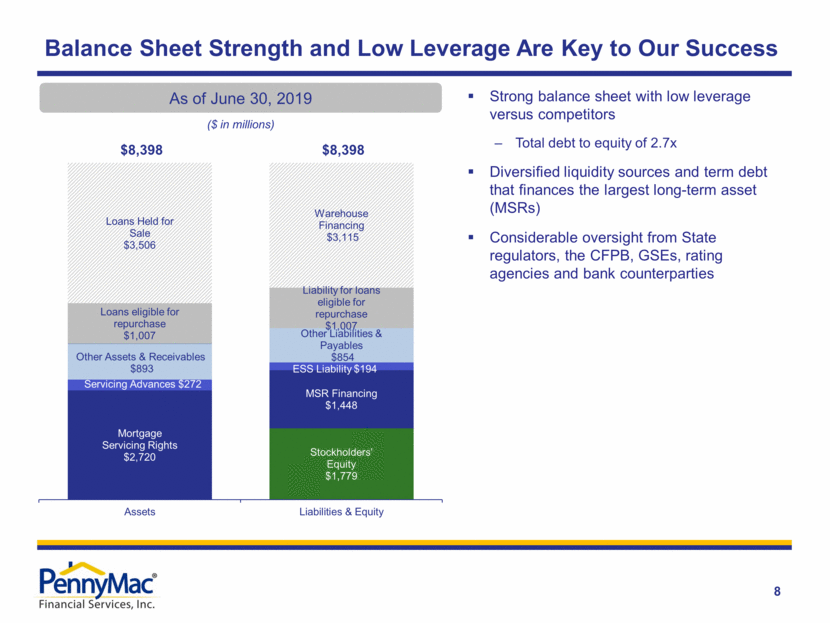
Balance Sheet Strength and Low Leverage Are Key to Our Success 8 Strong balance sheet with low leverage versus competitors Total debt to equity of 2.7x Diversified liquidity sources and term debt that finances the largest long-term asset (MSRs) Considerable oversight from State regulators, the CFPB, GSEs, rating agencies and bank counterparties As of June 30, 2019 ($ in millions) Mortgage Servicing Rights $2,720 Servicing Advances $272 Other Assets & Receivables $893 Loans eligible for repurchase $1,007 Loans Held for Sale $3,506 Stockholders' Equity $1,779 MSR Financing $1,448 ESS Liability $194 Other Liabilities & Payables $854 Liability for loans eligible for repurchase $1,007 Warehouse Financing $3,115 $8,398 $8,398 Assets Liabilities & Equity
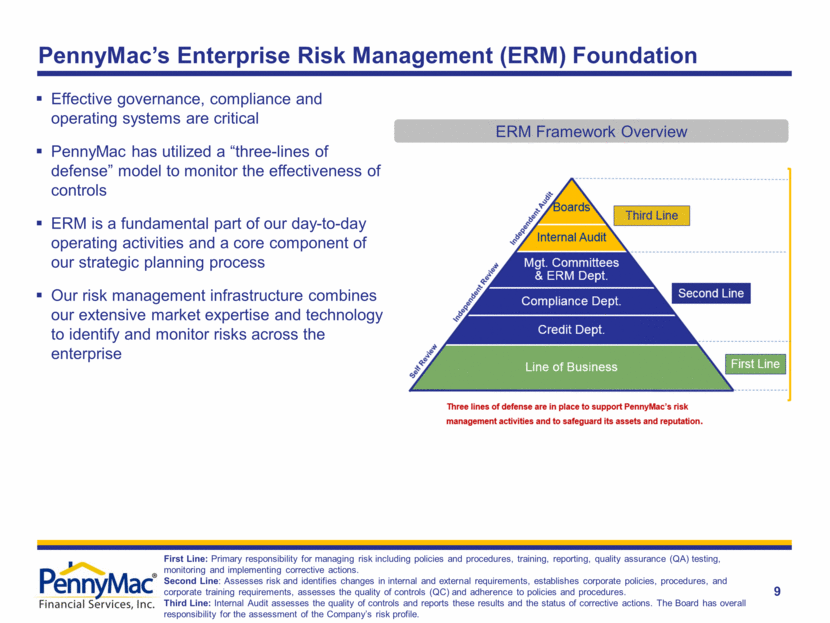
9 PennyMac’s Enterprise Risk Management (ERM) Foundation Effective governance, compliance and operating systems are critical PennyMac has utilized a “three-lines of defense” model to monitor the effectiveness of controls ERM is a fundamental part of our day-to-day operating activities and a core component of our strategic planning process Our risk management infrastructure combines our extensive market expertise and technology to identify and monitor risks across the enterprise ERM Framework Overview First Line: Primary responsibility for managing risk including policies and procedures, training, reporting, quality assurance (QA) testing, monitoring and implementing corrective actions. Second Line: Assesses risk and identifies changes in internal and external requirements, establishes corporate policies, procedures, and corporate training requirements, assesses the quality of controls (QC) and adherence to policies and procedures. Third Line: Internal Audit assesses the quality of controls and reports these results and the status of corrective actions. The Board has overall responsibility for the assessment of the Company’s risk profile.
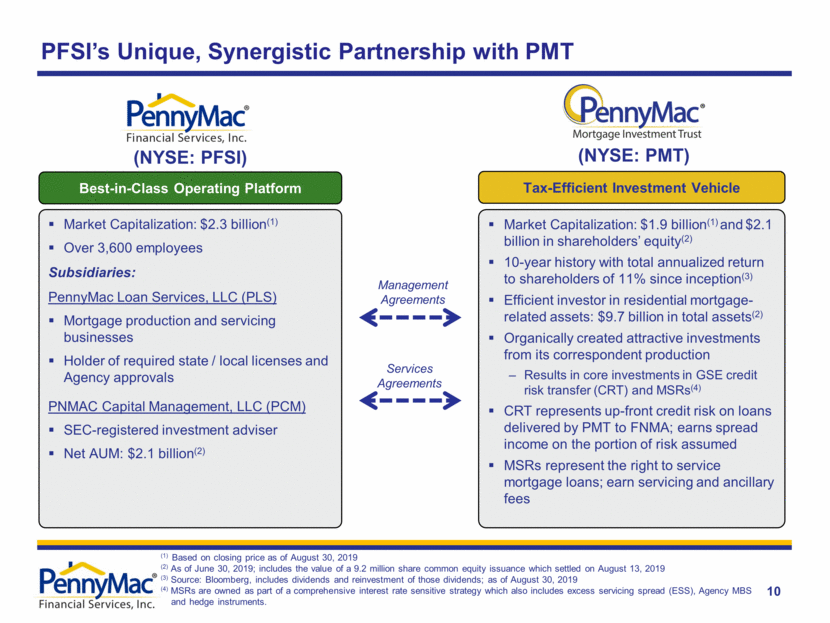
10 PFSI’s Unique, Synergistic Partnership with PMT Management Agreements Services Agreements Best-in-Class Operating Platform Market Capitalization: $2.3 billion(1) Over 3,600 employees Subsidiaries: PennyMac Loan Services, LLC (PLS) Mortgage production and servicing businesses Holder of required state / local licenses and Agency approvals PNMAC Capital Management, LLC (PCM) SEC-registered investment adviser Net AUM: $2.1 billion(2) (NYSE: PFSI) Tax-Efficient Investment Vehicle Market Capitalization: $1.9 billion(1) and $2.1 billion in shareholders’ equity(2) 10-year history with total annualized return to shareholders of 11% since inception(3) Efficient investor in residential mortgage-related assets: $9.7 billion in total assets(2) Organically created attractive investments from its correspondent production Results in core investments in GSE credit risk transfer (CRT) and MSRs(4) CRT represents up-front credit risk on loans delivered by PMT to FNMA; earns spread income on the portion of risk assumed MSRs represent the right to service mortgage loans; earn servicing and ancillary fees (NYSE: PMT) (1) Based on closing price as of August 30, 2019 (2) As of June 30, 2019; includes the value of a 9.2 million share common equity issuance which settled on August 13, 2019 (3) Source: Bloomberg, includes dividends and reinvestment of those dividends; as of August 30, 2019 (4) MSRs are owned as part of a comprehensive interest rate sensitive strategy which also includes excess servicing spread (ESS), Agency MBS and hedge instruments.
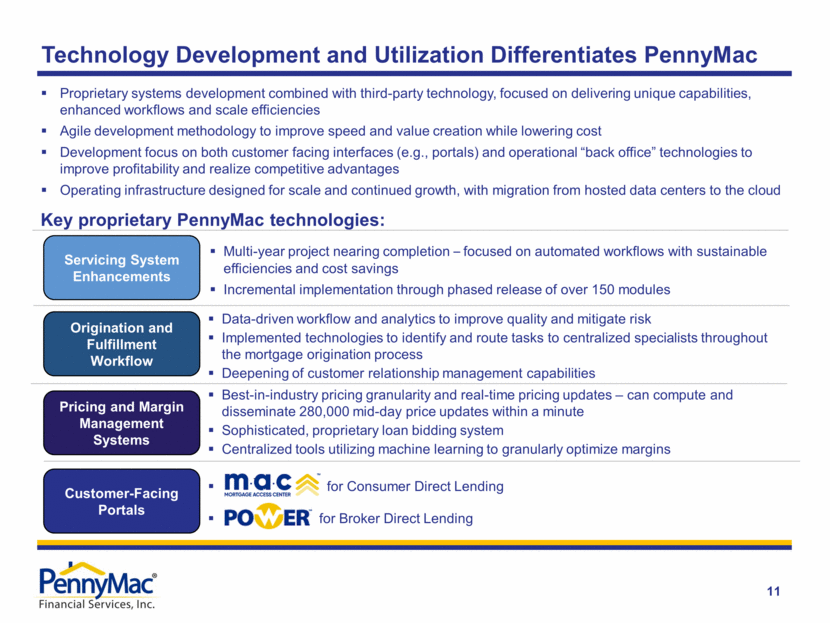
11 Technology Development and Utilization Differentiates PennyMac Origination and Fulfillment Workflow Multi-year project nearing completion – focused on automated workflows with sustainable efficiencies and cost savings Incremental implementation through phased release of over 150 modules Customer-Facing Portals Servicing System Enhancements Key proprietary PennyMac technologies: Data-driven workflow and analytics to improve quality and mitigate risk Implemented technologies to identify and route tasks to centralized specialists throughout the mortgage origination process Deepening of customer relationship management capabilities for Consumer Direct Lending for Broker Direct Lending Pricing and Margin Management Systems Best-in-industry pricing granularity and real-time pricing updates – can compute and disseminate 280,000 mid-day price updates within a minute Sophisticated, proprietary loan bidding system Centralized tools utilizing machine learning to granularly optimize margins Proprietary systems development combined with third-party technology, focused on delivering unique capabilities, enhanced workflows and scale efficiencies Agile development methodology to improve speed and value creation while lowering cost Development focus on both customer facing interfaces (e.g., portals) and operational “back office” technologies to improve profitability and realize competitive advantages Operating infrastructure designed for scale and continued growth, with migration from hosted data centers to the cloud
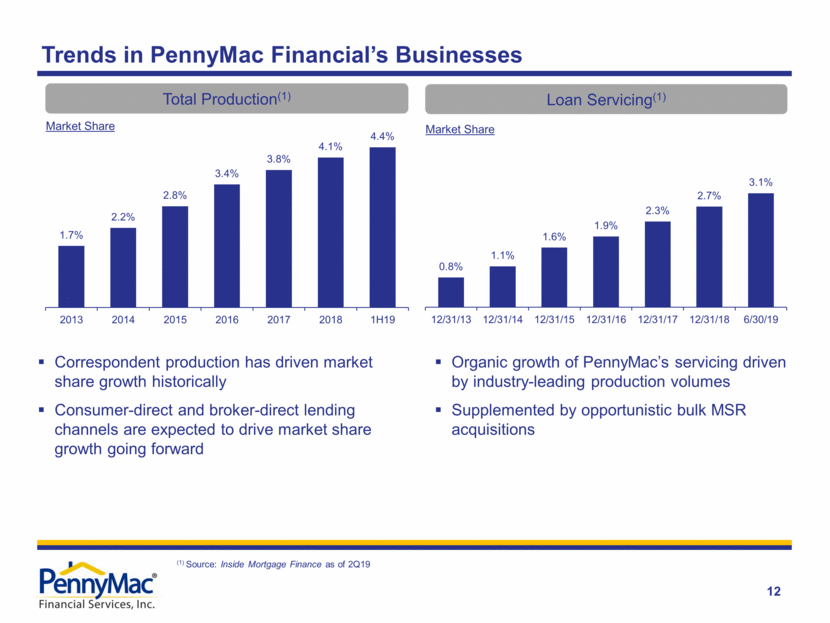
12 Loan Servicing(1) Total Production(1) Trends in PennyMac Financial’s Businesses (1) Source: Inside Mortgage Finance as of 2Q19 Market Share Market Share Correspondent production has driven market share growth historically Consumer-direct and broker-direct lending channels are expected to drive market share growth going forward Organic growth of PennyMac’s servicing driven by industry-leading production volumes Supplemented by opportunistic bulk MSR acquisitions 1.7% 2.2% 2.8% 3.4% 3.8% 4.1% 4.4% 2013 2014 2015 2016 2017 2018 1H19 0.8% 1.1% 1.6% 1.9% 2.3% 2.7% 3.1% 12/31/13 12/31/14 12/31/15 12/31/16 12/31/17 12/31/18 6/30/19
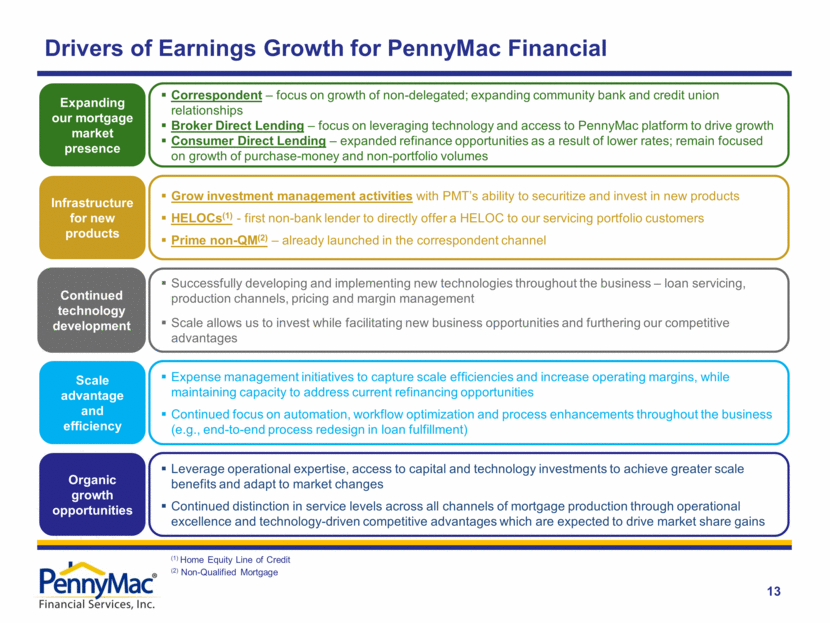
Drivers of Earnings Growth for PennyMac Financial 13 Organic growth opportunities Expanding our mortgage market presence Infrastructure for new products Continued technology development Scale advantage and efficiency Leverage operational expertise, access to capital and technology investments to achieve greater scale benefits and adapt to market changes Continued distinction in service levels across all channels of mortgage production through operational excellence and technology-driven competitive advantages which are expected to drive market share gains Correspondent – focus on growth of non-delegated; expanding community bank and credit union relationships Broker Direct Lending – focus on leveraging technology and access to PennyMac platform to drive growth Consumer Direct Lending – expanded refinance opportunities as a result of lower rates; remain focused on growth of purchase-money and non-portfolio volumes Grow investment management activities with PMT’s ability to securitize and invest in new products HELOCs(1) - first non-bank lender to directly offer a HELOC to our servicing portfolio customers Prime non-QM(2) – already launched in the correspondent channel Successfully developing and implementing new technologies throughout the business – loan servicing, production channels, pricing and margin management Scale allows us to invest while facilitating new business opportunities and furthering our competitive advantages Expense management initiatives to capture scale efficiencies and increase operating margins, while maintaining capacity to address current refinancing opportunities Continued focus on automation, workflow optimization and process enhancements throughout the business (e.g., end-to-end process redesign in loan fulfillment) (1) Home Equity Line of Credit (2) Non-Qualified Mortgage
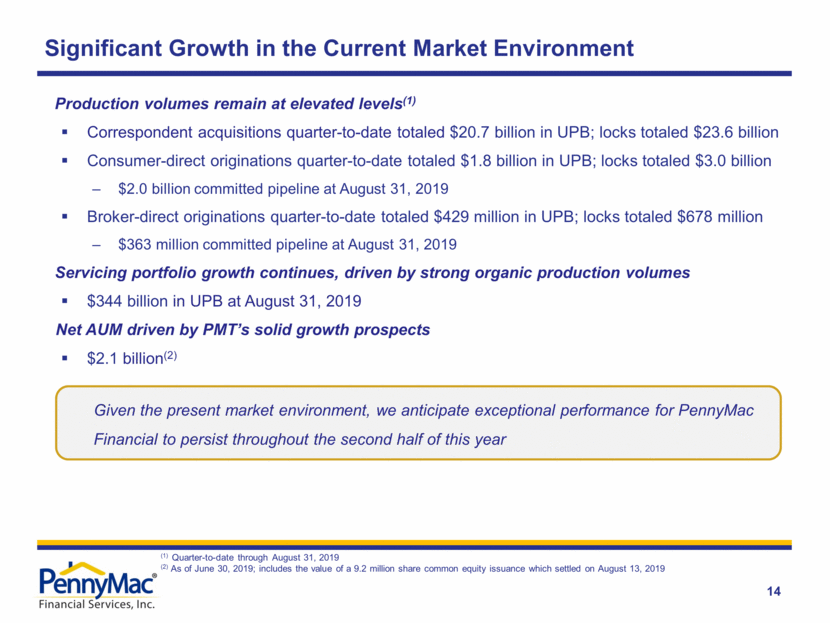
14 Significant Growth in the Current Market Environment Production volumes remain at elevated levels(1) Correspondent acquisitions quarter-to-date totaled $20.7 billion in UPB; locks totaled $23.6 billion Consumer-direct originations quarter-to-date totaled $1.8 billion in UPB; locks totaled $3.0 billion $2.0 billion committed pipeline at August 31, 2019 Broker-direct originations quarter-to-date totaled $429 million in UPB; locks totaled $678 million $363 million committed pipeline at August 31, 2019 Servicing portfolio growth continues, driven by strong organic production volumes $344 billion in UPB at August 31, 2019 Net AUM driven by PMT’s solid growth prospects $2.1 billion(2) (1) Quarter-to-date through August 31, 2019 (2) As of June 30, 2019; includes the value of a 9.2 million share common equity issuance which settled on August 13, 2019 Given the present market environment, we anticipate exceptional performance for PennyMac Financial to persist throughout the second half of this year
