
Nutanix Reports Fourth Quarter and Fiscal 2019 Financial Results
-- Delivers 71% of Billings from Subscriptions and Record 80% Gross Margin, Highlighting the Company’s Shift to Subscription Business Model
-- Grows Deals that Include Offerings Beyond Core HCI to 26%1
-- Expands Customer Base to Over 14,000 with 16% QoQ Growth in Number of Deals Over $1M and Strong QoQ Growth in New Global 2000 Customers
SAN JOSE, Calif.--(BUSINESS WIRE)-- Nutanix, Inc. (Nasdaq: NTNX), a leader in enterprise cloud computing, today announced financial results for its fourth quarter and fiscal year ended July 31, 2019.
This press release features multimedia. View the full release here: https://www.businesswire.com/news/home/20190828005652/en/
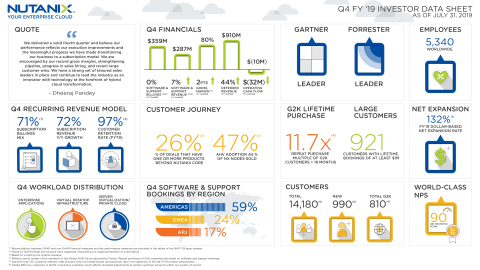
Nutanix Fiscal Q4 2019 Earnings Infographic (Graphic: Business Wire)
Q4 Fiscal 2019 Financial Highlights
- Revenue: $299.9 million, down from $303.7 million in the fourth quarter of fiscal 2018, reflecting the reduction of pass-thru hardware from $35.9 million in the fourth quarter of fiscal 2018 to $13.0 million in the fourth quarter of fiscal 2019, and the revenue compression from the company’s ongoing transition to subscription
- Billings: $371.7 million, down from $395.1 million in the fourth quarter of fiscal 2018, reflecting the reduction of pass-thru hardware from $35.9 million in the fourth quarter of fiscal 2018 to $13.0 million in the fourth quarter of fiscal 2019, and the billings compression from the company’s ongoing transition to subscription
- Software and Support Revenue: $286.9 million, up 7% year-over-year from $267.9 million in the fourth quarter of fiscal 2018, reflecting the revenue compression from the company’s ongoing transition to subscription
- Software and Support Billings: $358.7 million, down slightly year-over-year from $359.2 million in the fourth quarter of fiscal 2018, reflecting the billings compression from the company’s ongoing transition to subscription
- Gross Margin: GAAP gross margin of 77.0%, up from 75.9% in the fourth quarter of fiscal 2018; Non-GAAP gross margin of 80.0%, up from 77.7% in the fourth quarter of fiscal 2018
- Net Loss: GAAP net loss of $194.3 million, compared to a GAAP net loss of $87.4 million in the fourth quarter of fiscal 2018; Non-GAAP net loss of $105.8 million, compared to a non-GAAP net loss of $19.0 million in the fourth quarter of fiscal 2018
- Net Loss Per Share: GAAP net loss per share of $1.04, compared to a GAAP net loss per share of $0.51 in the fourth quarter of fiscal 2018; Non-GAAP net loss per share of $0.57, compared to a non-GAAP net loss per share of $0.11 in the fourth quarter of fiscal 2018
- Cash and Short-term Investments: $908.8 million, down from $934.3 million in the fourth quarter of fiscal 2018
- Deferred Revenue: $910.0 million, up 44% from the fourth quarter of fiscal 2018
- Operating Cash Flow: Use of $9.7 million, compared to generation of $22.7 million in the fourth quarter of fiscal 2018
- Free Cash Flow: Use of $33.3 million, compared to generation of $6.5 million in the fourth quarter of fiscal 2018
Fiscal 2019 Financial Highlights
- Revenue: $1.24 billion, up from $1.16 billion in fiscal 2018, reflecting the reduction of pass-thru hardware from $257.3 million in fiscal 2018 to $105.3 million in fiscal 2019, and the revenue compression from the company’s ongoing transition to subscription
- Billings: $1.51 billion, up from $1.42 billion in fiscal 2018, reflecting the reduction of pass-thru hardware from $257.3 million in fiscal 2018 to $105.3 million in fiscal 2019, and the billings compression from the company’s ongoing transition to subscription
- Software and Support Revenue: $1.13 billion, up 26% year-over-year from $898.1 million in fiscal 2018, reflecting the revenue compression from the company’s ongoing transition to subscription
- Software and Support Billings: $1.41 billion, up 21% year-over-year from $1.16 billion in fiscal 2018, reflecting the billings compression from the company’s ongoing transition to subscription
- Gross Margin: GAAP gross margin of 75.4%, up from 66.6% in fiscal 2018; Non-GAAP gross margin of 78.1%, up from 68.1% in fiscal 2018
- Net Loss: GAAP net loss of $621.2 million, compared to a GAAP net loss of $297.2 million in fiscal 2018; Non-GAAP net loss of $272.9 million, compared to a non-GAAP net loss of $101.5 million in fiscal 2018
- Net Loss Per Share: GAAP net loss per share of $3.43, compared to a GAAP net loss per share of $1.81 in fiscal 2018; Non-GAAP net loss per share of $1.51, compared to a non-GAAP net loss per share of $0.62 in fiscal 2018
- Operating Cash Flow: Generation of $42.2 million, compared to generation of $92.5 million in fiscal 2018
- Free Cash Flow: Use of $76.3 million, compared to generation of $30.2 million in fiscal 2018
Reconciliations between GAAP and non-GAAP financial measures and key performance measures are provided in the tables of this press release.
“We delivered a solid fourth quarter and believe our performance reflects our execution improvements and the meaningful progress we have made transitioning our business to a subscription model,” said Dheeraj Pandey, Chairman, Founder and CEO of Nutanix. “We are encouraged by our record gross margins, strengthening pipeline, progress in sales hiring, and recent large customer wins. We have a strong set of tenured sales leaders in place and continue to lead the industry as an innovator with technology at the forefront of hybrid cloud transformation.”
“We are pleased by our Q4 results, and that the actions we have taken to strengthen lead generation and enhance sales execution are generating positive results. Our subscription transition continues to be ahead of schedule with subscriptions growing from 52% of total billings in the fourth quarter of fiscal 2018 to 71% in the fourth quarter of fiscal 2019,” said Duston Williams, CFO of Nutanix. “In addition, 26%1 of our deals included a product outside our core offering, as new and existing customers increasingly look to Nutanix to guide them on their journey to hybrid cloud.”
Recent Company Highlights
- Continued Accelerated Shift to Subscription Recurring Revenue Model: Fourth quarter subscription billings increased to 71% of total billings, up 6 percentage points from the previous quarter, and subscription revenue reached $195.6 million in the fourth quarter, representing 65% of total revenue.
- Expanded Customer Base: Nutanix ended the fourth quarter of fiscal 2019 with 14,180 end-customers, adding 990 new customers in the quarter, including 31 from the Global 2000. Fourth quarter customer wins included Boardriders, Inc., Daiwa Institute of Research Ltd., Freeport-McMoRan, ICICI Bank, ING Bank Australia Limited, Johns Hopkins University Applied Physics Laboratory, and Noble Energy, Inc.
- General Availability of DX Platform with HPE: Shortly after the close of the fourth quarter, the HPE Proliant DX platform, based on Nutanix software, became generally available to customers.
- Appointed New Sales Leader in EMEA: Promoted longtime Nutanix sales leader Sammy Zoghlami to Senior Vice President of Sales in the EMEA Region.
- Continued AHV Penetration: The company saw the number of NX nodes sold utilizing AHV grow to 47%, up from 35% as of the fourth quarter of fiscal 20181.
- Nutanix Xi Government Cloud Listed as FedRAMP In Process on FedRAMP Marketplace: As announced in a separate release today, the company achieved new In Process designation for Nutanix Xi Government Cloud solutions, a step toward a full FedRAMP Moderate Authorization, which will enable federal government agencies to take advantage of our Xi Government Cloud solutions.
- Certified as Great Place To Work: Nutanix was certified as a Great Place to Work in 2019 by a Great Place to Work Institute survey of US-based Nutanix employees. 87 percent of those surveyed highlighted the company as a great place to work, with more than 90 percent noting that when employees join Nutanix, they are made to feel welcome by the culture.
Q1 Fiscal 2020 Financial Outlook
For the first quarter of fiscal 2020, Nutanix expects:
- Software and support revenue between $290 million and $300 million;
- Software and support billings between $360 million and $370 million;
- Total hardware to be 3% or less of total billings;
- Non-GAAP gross margin of approximately 80%;
- Non-GAAP operating expenses between $385 million and $390 million; and
- Non-GAAP net loss per share of approximately $0.75, using approximately 190 million weighted shares outstanding.
1Based on a trailing four-quarter average.
Supplementary materials to this earnings release, including the company’s fourth quarter and fiscal 2019 investor presentation, can be found at https://ir.nutanix.com/company/financial.
All forward-looking non-GAAP financial measures contained in the section titled "Q1 Fiscal 2020 Financial Outlook" exclude stock-based compensation expense and amortization of intangible assets and may also exclude, as applicable, other special items. The company has not reconciled guidance for software and support billings, non-GAAP gross margin, non-GAAP operating expenses and non-GAAP loss per share to their most directly comparable GAAP measures because such items that impact these measures are not within its control and are subject to constant change. While the actual amounts of such items will have a significant impact on the company’s software and support billings, non-GAAP gross margin, non-GAAP operating expenses and non-GAAP loss per share, a reconciliation of the non-GAAP financial measure guidance to the corresponding GAAP measures is not available without unreasonable effort.
Webcast and Conference Call Information
Nutanix executives will discuss the company’s fourth quarter and fiscal 2019 financial results on a conference call at 4:30 p.m. Eastern Time/1:30 p.m. Pacific Time today. To listen to the call via telephone, dial 1-833-227-5841 in the United States or 1-647-689-4068 from outside the United States. The conference ID is 7478544. This call will be webcast live and available to all interested parties on our Investor Relations website at ir.nutanix.com. Shortly after the conclusion of the conference call, a replay of the audio webcast will be available on the Nutanix Investor Relations website. A telephonic replay will be available for one week by calling 1-800-585-8367 or 1-416-621-4642, and entering the conference ID 7478544.
Non-GAAP Financial Measures and Other Key Performance Measures
To supplement our consolidated financial statements, which are prepared and presented in accordance with GAAP, we use the following non-GAAP financial and other key performance measures: billings, non-GAAP gross margin, non-GAAP operating expenses, non-GAAP net loss, non-GAAP net loss per share, free cash flow, software and support revenue, subscription revenue, software and support billings, subscription billings, and professional services billings. In computing these non-GAAP financial measures and key performance measures, we exclude certain items such as stock-based compensation and the related income tax impact, costs associated with our acquisitions (such as amortization of acquired intangible assets, revaluation of contingent consideration, income tax-related impact, and other acquisition-related costs), amortization of debt discount and issuance costs, other non-recurring transactions and the related tax impact, and the revenue and billings associated with pass-through hardware sales. Billings is a performance measure which our management believes provides useful information to investors because it represents the amounts under binding purchase orders received by us during a given period that have been billed, and we calculate billings by adding the change in deferred revenue between the start and end of the period to total revenue recognized in the same period. Free cash flow is a performance measure that our management believes provides useful information to management and investors about the amount of cash generated by the business after necessary capital expenditures, and we define free cash flow as net cash (used in) provided by operating activities less purchases of property and equipment. Non-GAAP gross margin, non-GAAP operating expenses, non-GAAP net loss, and non-GAAP net loss per share are financial measures which our management believes provide useful information to investors because they provide meaningful supplemental information regarding our performance and liquidity by excluding certain expenses and expenditures such as stock-based compensation expense that may not be indicative of our ongoing core business operating results. Software and support revenue and software and support billings are performance measures that our management believes provide useful information to our management and investors as it allows us to better track the true growth of our software business by excluding the amounts attributable to the pass-through hardware sales that we use to deliver our solutions. Subscription revenue, subscription billings, and professional services billings are performance measures that our management believes provide useful information to our management and investors as it allows us to better track the growth of the subscription-based portion of our business, which is a critical part of our business plan. We use these non-GAAP financial and key performance measures for financial and operational decision-making and as a means to evaluate period-to-period comparisons. However, these non-GAAP financial and key performance measures have limitations as analytical tools and you should not consider them in isolation or as substitutes for analysis of our results as reported under GAAP. Billings, non-GAAP gross margin, non-GAAP operating expenses, non-GAAP net loss, non-GAAP net loss per share, and free cash flow are not substitutes for total revenue, gross margin, operating expenses, net loss, net loss per share, or net cash (used in) provided by operating activities, respectively; subscription revenue, software and support revenue and software and support billings are not substitutes for total revenue; and subscription and professional services billings are not a substitute for subscription and professional services revenue. In addition, other companies, including companies in our industry, may calculate non-GAAP financial measures and key performance measures differently or may use other measures to evaluate their performance, all of which could reduce the usefulness of our non-GAAP financial measures and key performance measures as tools for comparison. We urge you to review the reconciliation of our non-GAAP financial measures and key performance measures to the most directly comparable GAAP financial measures included below in the tables captioned “Reconciliation of Revenue to Billings,” “Disaggregation of Revenue and Billings,” “Reconciliation of Subscription and Professional Services Revenue to Subscription and Professional Services Billings,” “Reconciliation of Software and Support Revenue to Software and Support Billings,” “Reconciliation of GAAP to Non-GAAP Profit Measures,” and “Reconciliation of GAAP Net Cash Provided By Operating Activities to Non-GAAP Free Cash Flow,” and not to rely on any single financial measure to evaluate our business.
Forward-Looking Statements
This press release contains express and implied forward-looking statements, including, but not limited to, statements regarding our business plans, initiatives and objectives, our ability to execute such plans, initiatives and objectives in a timely manner, and the benefits and impact of such plans, initiatives and objectives, the benefits and capabilities of our platform, products, services and technology, our plans and expectations regarding new products, services, product features and technology that are under development or in process, including our intention to seek FedRAMP Moderate Authorization for our Xi Government Cloud solutions, our continued investments in talent, technology, and marketing, and the success and impact of such investments, our plans and timing for, and the success and impact of, our transition to a subscription-based and recurring revenue business model, any impact of the actions we have undertaken to strengthen lead and pipeline generation and enhance sales execution, and anticipated future financial results, including but not limited to our guidance on estimated revenues, software and support revenues, billings, software and support billings, total billings from hardware sales, non-GAAP gross margin, non-GAAP operating expenses and non-GAAP net loss per share for future fiscal periods. These forward-looking statements are not historical facts and instead are based on our current expectations, estimates, opinions, and beliefs. Consequently, you should not rely on these forward-looking statements. The accuracy of such forward-looking statements depends upon future events and involves risks, uncertainties, and other factors beyond our control that may cause these statements to be inaccurate and cause our actual results, performance or achievements to differ materially and adversely from those anticipated or implied by such statements, including, among others: failure to successfully implement or realize the full benefits of, or unexpected difficulties or delays in successfully implementing or realizing the full benefits of, our business plans, initiatives and objectives; failure to develop, or unexpected difficulties or delays in developing, new products, services, product features or technology in a timely or cost-effective basis; delays in achieving FedRAMP Moderate Authorization; delays in or lack of customer or market acceptance of our new products, services, product features or technology; delays in the transition to a subscription-based and recurring revenue business model; failure of or delay in the actions we have undertaken to strengthen lead and pipeline generation and enhance sales execution; the rapid evolution of the markets in which we compete; our ability to sustain or manage future growth effectively; factors that could result in the significant fluctuation of our future quarterly operating results, including, among other things, anticipated changes to our revenue and product mix, including changes as a result of our transition to a subscription-based business model, which will slow revenue growth during such transitions and make forecasting future performance more difficult, the timing and magnitude of orders, shipments and acceptance of our solutions in any given quarter, our ability to attract new and retain existing end-customers, changes in the pricing of certain components of our solutions, and fluctuations in demand and competitive pricing pressures for our solutions; the introduction, or acceleration of adoption of, competing solutions, including public cloud infrastructure; and other risks detailed in our quarterly report on Form 10-Q for the fiscal quarter ended April 30, 2019, filed with the U.S. Securities and Exchange Commission, or the SEC, on June 5, 2019. Additional information will also be set forth in our Form 10-K that will be filed for the fiscal year ended July 31, 2019, which should be read in conjunction with this press release and the financial results included herein. Our SEC filings are available on the Investor Relations section of the company’s website at ir.nutanix.com and on the SEC's website at www.sec.gov. These forward-looking statements speak only as of the date of this press release and, except as required by law, we assume no obligation, and expressly disclaim any obligation, to update, alter or otherwise revise any of these forward-looking statements to reflect actual results or subsequent events or circumstances.
About Nutanix
Nutanix is a global leader in cloud software and hyperconverged infrastructure solutions, making infrastructure invisible so that IT can focus on the applications and services that power their business. Companies around the world use Nutanix Enterprise Cloud OS platform to bring one-click application management and mobility across public, private and distributed edge clouds so they can run any application at any scale with a dramatically lower total cost of ownership. The result is organizations that can rapidly deliver a high-performance IT environment on demand, giving application owners a true cloud-like experience. Learn more at www.nutanix.com or follow us on Twitter @nutanix.
© 2019 Nutanix, Inc. All rights reserved. Nutanix, the Nutanix logo, and all Nutanix product and service names mentioned herein are registered trademarks or trademarks of Nutanix, Inc. in the United States and other countries. All other brand names mentioned herein are for identification purposes only and may be the trademarks of their respective holder(s).
NUTANIX, INC. |
||||||||
CONSOLIDATED BALANCE SHEETS |
||||||||
(Unaudited) |
||||||||
|
As of |
|||||||
|
July 31,
|
|
July 31,
|
|||||
|
(in thousands) |
|||||||
Assets |
|
|
|
|||||
Current assets: |
|
|
|
|||||
Cash and cash equivalents |
$ |
305,975 |
|
|
$ |
396,678 |
|
|
Short-term investments |
628,328 |
|
|
512,156 |
|
|||
Accounts receivable, net |
258,289 |
|
|
245,475 |
|
|||
Deferred commissions—current |
33,691 |
|
|
46,238 |
|
|||
Prepaid expenses and other current assets |
36,818 |
|
|
74,665 |
|
|||
Total current assets |
1,263,101 |
|
|
1,275,212 |
|
|||
Property and equipment, net |
85,111 |
|
|
136,962 |
|
|||
Deferred commissions—non-current |
80,688 |
|
|
107,474 |
|
|||
Intangible assets, net |
45,366 |
|
|
66,773 |
|
|||
Goodwill |
87,759 |
|
|
185,180 |
|
|||
Other assets—non-current |
37,855 |
|
|
14,441 |
|
|||
Total assets |
$ |
1,599,880 |
|
|
$ |
1,786,042 |
|
|
|
|
|
|
|||||
Liabilities and Stockholders’ Equity |
|
|
|
|||||
Current liabilities: |
|
|
|
|||||
Accounts payable |
$ |
65,503 |
|
|
$ |
74,047 |
|
|
Accrued compensation and benefits |
85,398 |
|
|
99,804 |
|
|||
Accrued expenses and other current liabilities |
31,682 |
|
|
28,797 |
|
|||
Deferred revenue—current |
275,648 |
|
|
396,667 |
|
|||
Total current liabilities |
458,231 |
|
|
599,315 |
|
|||
Deferred revenue—non-current |
355,559 |
|
|
513,377 |
|
|||
Convertible senior notes, net |
429,598 |
|
|
458,910 |
|
|||
Other liabilities—non-current |
29,713 |
|
|
27,547 |
|
|||
Total liabilities |
1,273,101 |
|
|
1,599,149 |
|
|||
Stockholders’ equity: |
|
|
|
|||||
Common stock |
4 |
|
|
5 |
|
|||
Additional paid-in capital |
1,355,907 |
|
|
1,835,528 |
|
|||
Accumulated other comprehensive (loss) income |
(1,002 |
) |
|
669 |
|
|||
Accumulated deficit |
(1,028,130 |
) |
|
(1,649,309 |
) |
|||
Total stockholders’ equity |
326,779 |
|
|
186,893 |
|
|||
Total liabilities and stockholders’ equity |
$ |
1,599,880 |
|
|
$ |
1,786,042 |
|
|
NUTANIX, INC. |
||||||||||||||||
CONSOLIDATED STATEMENTS OF OPERATIONS |
||||||||||||||||
(Unaudited) |
||||||||||||||||
|
Three Months Ended
|
|
Fiscal Year Ended
|
|||||||||||||
|
2018 |
|
2019 |
|
2018 |
|
2019 |
|||||||||
|
(in thousands, except share and per share data) |
|||||||||||||||
Revenue: |
|
|
|
|
|
|
|
|||||||||
Product |
$ |
224,650 |
|
|
$ |
186,347 |
|
|
$ |
887,989 |
|
|
$ |
832,419 |
|
|
Support, entitlements and other services |
79,098 |
|
|
113,529 |
|
|
267,468 |
|
|
403,724 |
|
|||||
Total revenue |
303,748 |
|
|
299,876 |
|
|
1,155,457 |
|
|
1,236,143 |
|
|||||
Cost of revenue: |
|
|
|
|
|
|
|
|||||||||
Product (1)(2) |
41,068 |
|
|
28,323 |
|
|
276,127 |
|
|
143,078 |
|
|||||
Support, entitlements and other services (1) |
32,197 |
|
|
40,640 |
|
|
109,903 |
|
|
161,050 |
|
|||||
Total cost of revenue |
73,265 |
|
|
68,963 |
|
|
386,030 |
|
|
304,128 |
|
|||||
Gross profit |
230,483 |
|
|
230,913 |
|
|
769,427 |
|
|
932,015 |
|
|||||
Operating expenses: |
|
|
|
|
|
|
|
|||||||||
Sales and marketing (1)(2) |
183,191 |
|
|
253,843 |
|
|
649,657 |
|
|
909,750 |
|
|||||
Research and development (1) |
97,050 |
|
|
129,169 |
|
|
313,777 |
|
|
500,719 |
|
|||||
General and administrative (1) |
29,472 |
|
|
30,420 |
|
|
86,401 |
|
|
119,587 |
|
|||||
Total operating expenses |
309,713 |
|
|
413,432 |
|
|
1,049,835 |
|
|
1,530,056 |
|
|||||
Loss from operations |
(79,230 |
) |
|
(182,519 |
) |
|
(280,408 |
) |
|
(598,041 |
) |
|||||
Other expense, net |
(4,021 |
) |
|
(4,705 |
) |
|
(9,306 |
) |
|
(15,019 |
) |
|||||
Loss before provision for income taxes |
(83,251 |
) |
|
(187,224 |
) |
|
(289,714 |
) |
|
(613,060 |
) |
|||||
Provision for income taxes |
4,118 |
|
|
7,114 |
|
|
7,447 |
|
|
8,119 |
|
|||||
Net loss |
$ |
(87,369 |
) |
|
$ |
(194,338 |
) |
|
$ |
(297,161 |
) |
|
$ |
(621,179 |
) |
|
Net loss per share attributable to Class A and Class B common stockholders—basic and diluted |
$ |
(0.51 |
) |
|
$ |
(1.04 |
) |
|
$ |
(1.81 |
) |
|
$ |
(3.43 |
) |
|
Weighted average shares used in computing net loss per share attributable to Class A and Class B common stockholders—basic and diluted |
171,197,547 |
|
|
186,370,867 |
|
|
164,091,302 |
|
|
181,030,964 |
|
|||||
(1) Includes the following stock-based compensation expense: |
||||||||||||||||
|
Three Months Ended
|
|
Fiscal Year Ended
|
|||||||||||||
|
2018 |
|
2019 |
|
2018 |
|
2019 |
|||||||||
|
(in thousands) |
|||||||||||||||
Product cost of revenue |
$ |
692 |
|
|
$ |
1,012 |
|
|
$ |
2,580 |
|
|
$ |
3,535 |
|
|
Support, entitlements and other services cost of revenue |
2,789 |
|
|
4,254 |
|
|
8,945 |
|
|
15,326 |
|
|||||
Sales and marketing |
17,301 |
|
|
26,426 |
|
|
65,060 |
|
|
107,751 |
|
|||||
Research and development |
25,350 |
|
|
32,566 |
|
|
74,389 |
|
|
140,519 |
|
|||||
General and administrative |
9,264 |
|
|
9,149 |
|
|
26,894 |
|
|
39,598 |
|
|||||
Total stock-based compensation expense |
$ |
55,396 |
|
|
$ |
73,407 |
|
|
$ |
177,868 |
|
|
$ |
306,729 |
|
|
(2) Includes the following amortization of intangible assets: |
||||||||||||||||
|
Three Months Ended
|
|
Fiscal Year Ended
|
|||||||||||||
|
2018 |
|
2019 |
|
2018 |
|
2019 |
|||||||||
|
(in thousands) |
|||||||||||||||
Product cost of sales |
$ |
2,135 |
|
|
$ |
3,694 |
|
|
$ |
5,641 |
|
|
$ |
14,248 |
|
|
Sales and marketing |
289 |
|
|
651 |
|
|
914 |
|
|
2,528 |
|
|||||
Total amortization of intangible assets |
$ |
2,424 |
|
|
$ |
4,345 |
|
|
$ |
6,555 |
|
|
$ |
16,776 |
|
|
NUTANIX, INC. |
||||||||
CONSOLIDATED STATEMENTS OF CASH FLOWS |
||||||||
(Unaudited) |
||||||||
|
Fiscal Year Ended
|
|||||||
|
2018 |
|
2019 |
|||||
|
(in thousands) |
|||||||
Cash flows from operating activities: |
|
|
|
|||||
Net loss |
$ |
(297,161 |
) |
|
$ |
(621,179 |
) |
|
Adjustments to reconcile net loss to net cash provided by operating activities: |
|
|
|
|||||
Depreciation and amortization |
50,302 |
|
|
77,612 |
|
|||
Stock-based compensation |
177,868 |
|
|
306,729 |
|
|||
Amortization of debt discount and debt issuance costs |
14,685 |
|
|
29,313 |
|
|||
Change in fair value of contingent consideration |
(2,423 |
) |
|
(832 |
) |
|||
Other |
(962 |
) |
|
(2,786 |
) |
|||
Changes in operating assets and liabilities: |
|
|
|
|||||
Accounts receivable, net |
(79,273 |
) |
|
15,704 |
|
|||
Deferred commissions |
(40,852 |
) |
|
(39,333 |
) |
|||
Prepaid expenses and other assets (1) |
(37,374 |
) |
|
(12,037 |
) |
|||
Accounts payable |
(16,469 |
) |
|
13,508 |
|
|||
Accrued compensation and benefits |
27,877 |
|
|
14,406 |
|
|||
Accrued expenses and other liabilities |
34,295 |
|
|
(17,454 |
) |
|||
Deferred revenue |
262,027 |
|
|
278,517 |
|
|||
Net cash provided by operating activities (1) |
92,540 |
|
|
42,168 |
|
|||
Cash flows from investing activities: |
|
|
|
|||||
Maturities of investments |
297,461 |
|
|
588,763 |
|
|||
Purchases of investments |
(716,417 |
) |
|
(468,144 |
) |
|||
Purchases of property and equipment |
(62,372 |
) |
|
(118,452 |
) |
|||
Payments for acquisitions, net of cash and restricted cash acquired |
(22,227 |
) |
|
(19,017 |
) |
|||
Net cash used in investing activities |
(503,555 |
) |
|
(16,850 |
) |
|||
Cash flows from financing activities: |
|
|
|
|||||
Proceeds from sales of shares through employee equity incentive plans, net of repurchases |
72,010 |
|
|
69,210 |
|
|||
Payment of contingent consideration associated with a business combination |
— |
|
|
(1,040 |
) |
|||
Payment of debt in conjunction with business combinations |
(1,696 |
) |
|
(991 |
) |
|||
Proceeds from issuance of convertible senior notes, net |
563,587 |
|
|
(75 |
) |
|||
Proceeds from issuance of warrants |
87,975 |
|
|
— |
|
|||
Payments for the cost of convertible note hedges |
(143,175 |
) |
|
— |
|
|||
Payment of offering costs |
(85 |
) |
|
— |
|
|||
Net cash provided by financing activities |
578,616 |
|
|
67,104 |
|
|||
Net increase in cash, cash equivalents and restricted cash (1) |
$ |
167,601 |
|
|
$ |
92,422 |
|
|
Cash, cash equivalents and restricted cash—beginning of period (1) |
139,497 |
|
|
307,098 |
|
|||
Cash, cash equivalents and restricted cash—end of period (1) |
$ |
307,098 |
|
|
$ |
399,520 |
|
|
Restricted cash (1) (2) |
1,123 |
|
|
2,842 |
|
|||
Cash and cash equivalents—end of period |
$ |
305,975 |
|
|
$ |
396,678 |
|
|
Supplemental disclosures of cash flow information: |
|
|
|
|||||
Cash paid for income taxes |
$ |
10,116 |
|
|
$ |
28,999 |
|
|
Supplemental disclosures of non-cash investing and financing information: |
|
|
|
|||||
Issuance of common stock for acquisitions |
$ |
63,780 |
|
|
$ |
103,305 |
|
|
Purchases of property and equipment included in accounts payable and accrued liabilities |
$ |
13,444 |
|
|
$ |
8,074 |
|
|
Vesting of early exercised stock options |
$ |
681 |
|
|
$ |
183 |
|
|
|
|
|
|
(1) |
During the first quarter of fiscal 2019, we adopted Accounting Standards Update (ASU) No. 2016-18, which requires that the statement of cash flows explain the change during the period in the total of cash, cash equivalents and restricted cash. We adopted the standard retrospectively for the prior period presented. Our adoption of ASU 2016-18 did not have any significant impact on our consolidated statement of cash flows. |
||
(2) |
Included within other assets—non-current in the consolidated balance sheets. |
||
Reconciliation of Revenue to Billings |
||||||||||||||||
(Unaudited) |
||||||||||||||||
|
Three Months Ended
|
|
Fiscal Year Ended
|
|||||||||||||
|
2018 |
|
2019 |
|
2018 |
|
2019 |
|||||||||
|
(in thousands) |
|||||||||||||||
Total revenue |
$ |
303,748 |
|
|
$ |
299,876 |
|
|
$ |
1,155,457 |
|
|
$ |
1,236,143 |
|
|
Change in deferred revenue, net of acquisitions (1) |
91,318 |
|
|
71,782 |
|
|
262,027 |
|
|
278,517 |
|
|||||
Total billings |
$ |
395,066 |
|
|
$ |
371,658 |
|
|
$ |
1,417,484 |
|
|
$ |
1,514,660 |
|
|
|
|
|
|
(1) |
Amount for the fiscal year ended July 31, 2019 excludes approximately $0.3 million of deferred revenue assumed in a business combination. |
||
Disaggregation of Revenue and Billings |
||||||||||||||||
(Unaudited) |
||||||||||||||||
|
Three Months Ended
|
|
Fiscal Year Ended
|
|||||||||||||
|
2018 |
|
2019 |
|
2018 |
|
2019 |
|||||||||
|
(in thousands) |
|||||||||||||||
Disaggregation of Revenue: |
|
|
|
|
|
|
|
|||||||||
Subscription |
$ |
113,977 |
|
|
$ |
195,636 |
|
|
$ |
330,645 |
|
|
$ |
648,415 |
|
|
Non-portable software |
146,966 |
|
|
82,221 |
|
|
543,952 |
|
|
449,131 |
|
|||||
Hardware |
35,860 |
|
|
13,002 |
|
|
257,314 |
|
|
105,321 |
|
|||||
Professional services |
6,945 |
|
|
9,017 |
|
|
23,546 |
|
|
33,276 |
|
|||||
Total revenue |
$ |
303,748 |
|
|
$ |
299,876 |
|
|
$ |
1,155,457 |
|
|
$ |
1,236,143 |
|
|
|
|
|
|
|
|
|
|
|||||||||
Disaggregation of Billings: |
|
|
|
|
|
|
|
|||||||||
Subscription |
$ |
203,482 |
|
|
$ |
263,308 |
|
|
$ |
581,923 |
|
|
$ |
916,000 |
|
|
Non-portable software |
146,966 |
|
|
82,221 |
|
|
543,952 |
|
|
449,131 |
|
|||||
Hardware |
35,860 |
|
|
13,002 |
|
|
257,314 |
|
|
105,321 |
|
|||||
Professional services |
8,758 |
|
|
13,127 |
|
|
34,295 |
|
|
44,208 |
|
|||||
Total billings |
$ |
395,066 |
|
|
$ |
371,658 |
|
|
$ |
1,417,484 |
|
|
$ |
1,514,660 |
|
|
Subscription — Subscription revenue is generated from the sales of software entitlement and support subscriptions, separately purchased software term-based licenses and cloud-based Software as a Service, or SaaS offerings. We recognize revenue from software entitlement and support subscriptions and SaaS offerings ratably over the contractual service period, while revenue from our separately purchased software term-based licenses is generally recognized upon transfer of control to the customer, which is when we make the software available to our customers.
Non-portable software — Non-portable software revenue includes sales of our software operating system when delivered on a configured to order appliance by us, or one of our OEM partners. The software licenses associated with these sales are typically non-portable and have a term equal to the life of the appliance it is delivered on. Revenue from our non-portable software products is generally recognized upon transfer of control to the customer.
Hardware — In transactions where we deliver the hardware appliance, we consider ourselves to be the principal in the transaction and we record revenue and costs of goods sold on a gross basis. We consider the amount allocated to hardware revenue to be equivalent to the cost of the hardware procured. Hardware revenue is generally recognized upon transfer of control to the customer.
Professional services — We also sell professional services with our products. We recognize revenue related to professional services as they are performed.
Reconciliation of Subscription and Professional Services Revenue to Subscription and Professional Services Billings |
||||||||||||||||
(Unaudited) |
||||||||||||||||
|
Three Months Ended
|
|
Fiscal Year Ended
|
|||||||||||||
|
2018 |
|
2019 |
|
2018 |
|
2019 |
|||||||||
|
(in thousands) |
|||||||||||||||
Subscription revenue |
$ |
113,977 |
|
|
$ |
195,636 |
|
|
$ |
330,645 |
|
|
$ |
648,415 |
|
|
Change in subscription deferred revenue, net of acquisitions (1) |
89,505 |
|
|
67,672 |
|
|
251,278 |
|
|
267,585 |
|
|||||
Subscription billings |
$ |
203,482 |
|
|
$ |
263,308 |
|
|
$ |
581,923 |
|
|
$ |
916,000 |
|
|
|
|
|
|
|
|
|
|
|||||||||
Professional services revenue |
$ |
6,945 |
|
|
$ |
9,017 |
|
|
$ |
23,546 |
|
|
$ |
33,276 |
|
|
Change in professional services deferred revenue |
1,813 |
|
|
4,110 |
|
|
10,749 |
|
|
10,932 |
|
|||||
Professional services billings |
$ |
8,758 |
|
|
$ |
13,127 |
|
|
$ |
34,295 |
|
|
$ |
44,208 |
|
|
|
|
|
|
(1) |
Amount for the fiscal year ended July 31, 2019 excludes approximately $0.3 million of deferred revenue assumed in a business combination. |
||
Reconciliation of Software and Support Revenue to Software and Support Billings |
||||||||||||||||
(Unaudited) |
||||||||||||||||
|
Three Months Ended
|
|
Fiscal Year Ended
|
|||||||||||||
|
2018 |
|
2019 |
|
2018 |
|
2019 |
|||||||||
|
(in thousands) |
|||||||||||||||
Software revenue |
$ |
188,790 |
|
|
$ |
173,345 |
|
|
$ |
630,675 |
|
|
$ |
727,098 |
|
|
Hardware revenue |
35,860 |
|
|
13,002 |
|
|
257,314 |
|
|
105,321 |
|
|||||
Product revenue |
224,650 |
|
|
186,347 |
|
|
887,989 |
|
|
832,419 |
|
|||||
Support, entitlements and other services revenue |
79,098 |
|
|
113,529 |
|
|
267,468 |
|
|
403,724 |
|
|||||
Total revenue |
$ |
303,748 |
|
|
$ |
299,876 |
|
|
$ |
1,155,457 |
|
|
$ |
1,236,143 |
|
|
|
|
|
|
|
|
|
|
|||||||||
Total software and support revenue (2) |
$ |
267,888 |
|
|
$ |
286,874 |
|
|
$ |
898,143 |
|
|
$ |
1,130,822 |
|
|
Change in software and support deferred revenue, net of acquisitions (1) |
91,318 |
|
|
71,782 |
|
|
262,027 |
|
|
278,517 |
|
|||||
Software and support billings (2) |
$ |
359,206 |
|
|
$ |
358,656 |
|
|
$ |
1,160,170 |
|
|
$ |
1,409,339 |
|
|
|
|||
(1) |
Amount for the fiscal year ended July 31, 2019 excludes approximately $0.3 million of deferred revenue assumed in a business combination. |
||
(2) |
Software and support revenue and billings include software and support, entitlements and other services revenue and billings. |
||
Reconciliation of GAAP to Non-GAAP Profit Measures |
||||||||||||||||||||||||||||
(Unaudited) |
||||||||||||||||||||||||||||
|
|
GAAP |
|
Non-GAAP Adjustments |
|
Non-GAAP |
||||||||||||||||||||||
|
|
Three Months
|
|
(1) |
(2) |
(3) |
(4) |
(5) |
|
Three Months
|
||||||||||||||||||
|
|
(in thousands, except share and per share data) |
||||||||||||||||||||||||||
Gross profit |
|
$ |
230,913 |
|
|
$ |
5,266 |
|
$ |
3,694 |
|
$ |
— |
|
$ |
— |
|
$ |
— |
|
|
$ |
239,873 |
|
||||
Gross margin |
|
77.0 |
% |
|
1.8 |
% |
1.2 |
% |
— |
|
— |
|
— |
|
|
80.0 |
% |
|||||||||||
Operating expenses: |
|
|
|
|
|
|
|
|
|
|
||||||||||||||||||
Sales and marketing |
|
253,843 |
|
|
(26,426 |
) |
(651 |
) |
— |
|
— |
|
— |
|
|
226,766 |
|
|||||||||||
Research and development |
|
129,169 |
|
|
(32,566 |
) |
— |
|
— |
|
— |
|
— |
|
|
96,603 |
|
|||||||||||
General and administrative |
|
30,420 |
|
|
(9,149 |
) |
— |
|
(156 |
) |
— |
|
— |
|
|
21,115 |
|
|||||||||||
Total operating expenses |
|
413,432 |
|
|
(68,141 |
) |
(651 |
) |
(156 |
) |
— |
|
— |
|
|
344,484 |
|
|||||||||||
Loss from operations |
|
(182,519 |
) |
|
73,407 |
|
4,345 |
|
156 |
|
— |
|
— |
|
|
(104,611 |
) |
|||||||||||
Net loss |
|
$ |
(194,338 |
) |
|
$ |
73,407 |
|
$ |
4,345 |
|
$ |
156 |
|
$ |
7,511 |
|
$ |
3,086 |
|
|
$ |
(105,833 |
) |
||||
Weighted shares outstanding, basic and diluted |
|
186,370,867 |
|
|
|
|
|
|
|
|
186,370,867 |
|
||||||||||||||||
Net loss per share, basic and diluted |
|
$ |
(1.04 |
) |
|
$ |
0.39 |
|
$ |
0.02 |
|
$ |
— |
|
$ |
0.04 |
|
$ |
0.02 |
|
|
$ |
(0.57 |
) |
||||
|
|
|
|
(1) |
Stock-based compensation expense |
||
(2) |
Amortization of intangible assets |
||
(3) |
Other |
||
(4) |
Amortization of debt discount and issuance costs |
||
(5) |
Income tax effect primarily related to stock-based compensation expense |
||
|
|
GAAP |
|
Non-GAAP Adjustments |
|
Non-GAAP |
||||||||||||||||||||||||||||||
|
|
Fiscal Year
|
|
(1) |
|
(2) |
|
(3) |
|
(4) |
|
(5) |
|
(6) |
|
(7) |
|
Fiscal Year
|
||||||||||||||||||
|
|
(in thousands, except share and per share data) |
||||||||||||||||||||||||||||||||||
Gross profit |
|
$ |
932,015 |
|
|
$ |
18,861 |
|
$ |
14,248 |
|
$ |
— |
|
$ |
— |
|
$ |
— |
|
$ |
163 |
|
$ |
— |
|
|
$ |
965,287 |
|
||||||
Gross margin |
|
75.4 |
% |
|
1.5 |
% |
1.2 |
% |
— |
|
— |
|
— |
|
— |
— |
|
|
78.1 |
% |
||||||||||||||||
Operating expenses: |
|
|
|
|
|
|
|
|
|
|
|
|
||||||||||||||||||||||||
Sales and marketing |
|
909,750 |
|
|
(107,751 |
) |
(2,528 |
) |
— |
|
— |
|
— |
|
— |
|
— |
|
|
799,471 |
|
|||||||||||||||
Research and development |
|
500,719 |
|
|
(140,519 |
) |
— |
|
— |
|
— |
|
— |
|
— |
|
— |
|
|
360,200 |
|
|||||||||||||||
General and administrative |
|
119,587 |
|
|
(39,598 |
) |
— |
|
(721 |
) |
832 |
|
— |
|
(204 |
) |
— |
|
|
79,896 |
|
|||||||||||||||
Total operating expenses |
|
1,530,056 |
|
|
(287,868 |
) |
(2,528 |
) |
(721 |
) |
832 |
|
— |
|
(204 |
) |
— |
|
|
1,239,567 |
|
|||||||||||||||
Loss from operations |
|
(598,041 |
) |
|
306,729 |
|
16,776 |
|
721 |
|
(832 |
) |
— |
|
367 |
|
— |
|
|
(274,280 |
) |
|||||||||||||||
Net loss |
|
$ |
(621,179 |
) |
|
$ |
306,729 |
|
$ |
16,776 |
|
$ |
721 |
|
$ |
(832 |
) |
$ |
29,313 |
|
$ |
367 |
|
$ |
(4,752 |
) |
|
$ |
(272,857 |
) |
||||||
Weighted shares outstanding, basic and diluted |
|
181,030,964 |
|
|
|
|
|
|
|
|
|
|
181,030,964 |
|
||||||||||||||||||||||
Net loss per share, basic and diluted |
|
$ |
(3.43 |
) |
|
$ |
1.70 |
|
$ |
0.09 |
|
$ |
— |
|
$ |
— |
|
$ |
0.16 |
|
$ |
— |
|
$ |
(0.03 |
) |
|
$ |
(1.51 |
) |
||||||
|
|
|
|
(1) |
Stock-based compensation expense |
||
(2) |
Amortization of intangible assets |
||
(3) |
Acquisition-related costs |
||
(4) |
Change in fair value of contingent consideration assumed in a business combination |
||
(5) |
Amortization of debt discount and issuance costs |
||
(6) |
Other |
||
(7) |
Income tax effect primarily related to stock-based compensation expense and the partial release of valuation allowance in connection with a business combination and tax effect of a change in law |
||
|
GAAP |
|
Non-GAAP Adjustments |
|
Non-GAAP |
|||||||||||||||||||||||||||
|
|
Three Months
|
|
(1) |
|
(2) |
|
(3) |
|
(4) |
|
(5) |
|
(6) |
|
Three Months
|
||||||||||||||||
|
|
(in thousands, except share and per share data) |
||||||||||||||||||||||||||||||
Gross profit |
|
$ |
230,483 |
|
|
$ |
3,481 |
|
$ |
2,135 |
|
$ |
— |
|
$ |
— |
|
$ |
— |
|
$ |
— |
|
|
$ |
236,099 |
|
|||||
Gross margin |
|
75.9 |
% |
|
1.1 |
% |
0.7 |
% |
— |
|
— |
|
— |
|
— |
|
|
77.7 |
% |
|||||||||||||
Operating expenses: |
|
|
|
|
|
|
|
|
|
|
|
|||||||||||||||||||||
Sales and marketing |
|
183,191 |
|
|
(17,301 |
) |
(289 |
) |
— |
|
— |
|
— |
|
— |
|
|
165,601 |
|
|||||||||||||
Research and development |
|
97,050 |
|
|
(25,350 |
) |
— |
|
— |
|
— |
|
— |
|
— |
|
|
71,700 |
|
|||||||||||||
General and administrative |
|
29,472 |
|
|
(9,264 |
) |
— |
|
(948 |
) |
(714 |
) |
— |
|
— |
|
|
18,546 |
|
|||||||||||||
Total operating expenses |
|
309,713 |
|
|
(51,915 |
) |
(289 |
) |
(948 |
) |
(714 |
) |
— |
|
— |
|
|
255,847 |
|
|||||||||||||
Loss from operations |
|
(79,230 |
) |
|
55,396 |
|
2,424 |
|
948 |
|
714 |
|
— |
|
— |
|
|
(19,748 |
) |
|||||||||||||
Net loss |
|
$ |
(87,369 |
) |
|
$ |
55,396 |
|
$ |
2,424 |
|
$ |
948 |
|
$ |
714 |
|
$ |
7,031 |
|
$ |
1,834 |
|
|
$ |
(19,022 |
) |
|||||
Weighted shares outstanding, basic and diluted |
|
171,197,547 |
|
|
|
|
|
|
|
|
|
171,197,547 |
|
|||||||||||||||||||
Net loss per share, basic and diluted |
|
$ |
(0.51 |
) |
|
$ |
0.32 |
|
$ |
0.02 |
|
$ |
0.01 |
|
$ |
— |
|
$ |
0.04 |
|
$ |
0.01 |
|
|
$ |
(0.11 |
) |
|||||
|
|
|
|
(1) |
Stock-based compensation expense |
||
(2) |
Amortization of intangible assets |
||
(3) |
Change in fair value of contingent consideration assumed in a business combination |
||
(4) |
Acquisition-related costs |
||
(5) |
Amortization of debt discount and debt issuance costs |
||
(6) |
Income tax effect primarily related to stock-based compensation expense and the migration of certain intangible assets |
||
|
|
GAAP |
|
Non-GAAP Adjustments |
|
Non-GAAP |
||||||||||||||||||||||||||
|
|
Fiscal Year
|
|
(1) |
(2) |
(3) |
(4) |
(5) |
(6) |
|
Fiscal Year
|
|||||||||||||||||||||
|
|
(in thousands, except share and per share data) |
||||||||||||||||||||||||||||||
Gross profit |
|
$ |
769,427 |
|
|
$ |
11,525 |
|
$ |
5,641 |
|
$ |
— |
|
$ |
— |
|
$ |
— |
|
$ |
— |
|
|
$ |
786,593 |
|
|||||
Gross margin |
|
66.6 |
% |
|
1.0 |
% |
0.5 |
% |
— |
|
— |
|
— |
|
— |
|
|
68.1 |
% |
|||||||||||||
Operating expenses: |
|
|
|
|
|
|
|
|
|
|
|
|||||||||||||||||||||
Sales and marketing |
|
649,657 |
|
|
(65,060 |
) |
(914 |
) |
— |
|
— |
|
— |
|
— |
|
|
583,683 |
|
|||||||||||||
Research and development |
|
313,777 |
|
|
(74,389 |
) |
— |
|
— |
|
— |
|
— |
|
— |
|
|
239,388 |
|
|||||||||||||
General and administrative |
|
86,401 |
|
|
(26,894 |
) |
— |
|
2,423 |
|
(1,757 |
) |
— |
|
— |
|
|
60,173 |
|
|||||||||||||
Total operating expenses |
|
1,049,835 |
|
|
(166,343 |
) |
(914 |
) |
2,423 |
|
(1,757 |
) |
— |
|
— |
|
|
883,244 |
|
|||||||||||||
Loss from operations |
|
(280,408 |
) |
|
177,868 |
|
6,555 |
|
(2,423 |
) |
1,757 |
|
— |
|
— |
|
|
(96,651 |
) |
|||||||||||||
Net loss |
|
$ |
(297,161 |
) |
|
$ |
177,868 |
|
$ |
6,555 |
|
$ |
(2,423 |
) |
$ |
1,757 |
|
$ |
14,685 |
|
$ |
(2,819 |
) |
|
$ |
(101,538 |
) |
|||||
Weighted shares outstanding, basic and diluted |
|
164,091,302 |
|
|
|
|
|
|
|
|
|
164,091,302 |
|
|||||||||||||||||||
Net loss per share, basic and diluted |
|
$ |
(1.81 |
) |
|
$ |
1.08 |
|
$ |
0.04 |
|
$ |
(0.01 |
) |
$ |
0.01 |
|
$ |
0.09 |
|
$ |
(0.02 |
) |
|
$ |
(0.62 |
) |
|||||
|
|
|
|
(1) |
Stock-based compensation expense |
||
(2) |
Amortization of intangible assets |
||
(3) |
Change in fair value of contingent consideration assumed in a business combination |
||
(4) |
Acquisition-related costs |
||
(5) |
Amortization of debt discount and debt issuance costs |
||
(6) |
Income tax effect primarily related to release of valuation allowance due to acquisitions, stock-based compensation expense and the migration of certain intangible assets |
||
Reconciliation of GAAP Net Cash Provided by Operating Activities to Non-GAAP Free Cash Flow |
||||||||||||||||
(Unaudited) |
||||||||||||||||
|
Three Months Ended
|
|
Fiscal Year Ended
|
|||||||||||||
|
2018 |
|
2019 |
|
2018 |
|
2019 |
|||||||||
|
(in thousands) |
|||||||||||||||
Net cash provided by (used in) operating activities |
$ |
22,736 |
|
|
$ |
(9,656 |
) |
|
$ |
92,540 |
|
|
$ |
42,168 |
|
|
Purchases of property and equipment |
(16,283 |
) |
|
(23,637 |
) |
|
(62,372 |
) |
|
(118,452 |
) |
|||||
Free cash flow |
$ |
6,453 |
|
|
$ |
(33,293 |
) |
|
$ |
30,168 |
|
|
$ |
(76,284 |
) |
|
View source version on businesswire.com: https://www.businesswire.com/news/home/20190828005652/en/
Investor Contact:
Tonya Chin
408-560-2675
[email protected]
Media Contact:
Jennifer Massaro
408-309-6886
[email protected]
Source: Nutanix, Inc.