
Form 10-Q On Deck Capital, Inc. For: Jun 30
UNITED STATES
SECURITIES AND EXCHANGE COMMISSION
Washington, D.C. 20549
FORM 10-Q
(MARK ONE)
ý | QUARTERLY REPORT PURSUANT TO SECTION 13 OR 15(d) OF THE SECURITIES EXCHANGE ACT OF 1934 |
FOR THE QUARTERLY PERIOD ENDED JUNE 30, 2019
OR
¨ | TRANSITION REPORT PURSUANT TO SECTION 13 OR 15(d) OF THE SECURITIES EXCHANGE ACT OF 1934 |
FOR THE TRANSITION PERIOD FROM TO
Commission File Number 001-36779
On Deck Capital, Inc.
(Exact name of registrant as specified in its charter)
Delaware | 42-1709682 |
(State or other jurisdiction of incorporation or organization) | (I.R.S. Employer Identification No.) |
1400 Broadway, 25th Floor
New York, New York 10018
(Address of principal executive offices)
(888) 269-4246
(Registrant’s telephone number, including area code)
Securities registered pursuant to Section 12(b) of the Act:
Title of each class | Trading Symbol(s) | Name of each exchange on which registered |
Common Stock, par value $0.005 per share | ONDK | New York Stock Exchange |
Indicate by check mark whether the registrant (1) has filed all reports required to be filed by Section 13 or 15(d) of the Securities Exchange Act of 1934 during the preceding 12 months (or for such shorter period that the registrant was required to file such reports), and (2) has been subject to such filing requirements for the past 90 days. YES ý NO ¨
Indicate by check mark whether the registrant has submitted electronically every Interactive Data file required to be submitted pursuant to Rule 405 of Regulation S-T (§232.405 of this chapter) during the preceding 12 months (or for such shorter period that the registrant was required to submit such files). YES ý NO ¨
Indicate by check mark whether the registrant is a large accelerated filer, an accelerated filer, a non-accelerated filer, a smaller reporting company, or an emerging growth company. See the definitions of “large accelerated filer,” “accelerated filer,” “smaller reporting company,” and "emerging growth company" in Rule 12b-2 of the Exchange Act.:
Large accelerated filer | ¨ | Accelerated filer | x | |||
Non-accelerated filer | ¨ | Smaller reporting company | ¨ | |||
Emerging growth company | x | |||||
If an emerging growth company, indicate by check mark if the registrant has elected not to use the extended transition period for complying with any new or revised financial accounting standards provided pursuant to Section 13(a) of the Exchange Act. | x | |||||
Indicate by check mark whether the registrant is a shell company (as defined in Rule 12b-2 of the Exchange Act). YES ¨ NO ý
The number of shares of the registrant’s common stock outstanding as of July 31, 2019 was 76,301,387.
On Deck Capital, Inc.
Table of Contents
Page | ||
PART I - FINANCIAL INFORMATION | ||
Item 1. | Financial Statements (Unaudited) | |
Unaudited Condensed Consolidated Balance Sheets | ||
Unaudited Condensed Consolidated Statements of Operations and Comprehensive Income | ||
Unaudited Condensed Consolidated Statements of Changes in Equity and Redeemable Noncontrolling Interest | ||
Unaudited Condensed Consolidated Statements of Cash Flows | ||
Notes to Unaudited Condensed Consolidated Financial Statements | ||
Item 2. | Management’s Discussion and Analysis of Financial Condition and Results of Operations | |
Item 3. | Quantitative and Qualitative Disclosures About Market Risk | |
Item 4. | Controls and Procedures | |
PART II - OTHER INFORMATION | ||
Item 1. | Legal Proceedings | |
Item 1A | Risk Factors | |
Item 2. | Unregistered Sales of Equity Securities and Use of Proceeds | |
Item 3. | Defaults Upon Senior Securities | |
Item 4. | Mine Safety Disclosures | |
Item 5. | Other Information | |
Item 6. | Exhibits | |
Signatures | ||
PART I - FINANCIAL INFORMATION
Item 1. Financial Statements (Unaudited)
ON DECK CAPITAL, INC. AND SUBSIDIARIES
Unaudited Condensed Consolidated Balance Sheets
(in thousands, except share and per share data)
June 30, | December 31, | ||||||
2019 | 2018 | ||||||
Assets | |||||||
Cash and cash equivalents | $ | 58,744 | $ | 59,859 | |||
Restricted cash | 43,336 | 37,779 | |||||
Loans and finance receivables | 1,207,609 | 1,169,407 | |||||
Less: Allowance for credit losses | (145,739 | ) | (140,040 | ) | |||
Loans and finance receivables held for investment, net | 1,061,870 | 1,029,367 | |||||
Property, equipment and software, net | 17,088 | 16,700 | |||||
Other assets | 67,169 | 18,115 | |||||
Total assets | $ | 1,248,207 | $ | 1,161,820 | |||
Liabilities, mezzanine equity and stockholders' equity | |||||||
Liabilities: | |||||||
Accounts payable | $ | 5,819 | $ | 4,011 | |||
Interest payable | 2,687 | 2,385 | |||||
Debt | 841,602 | 816,231 | |||||
Accrued expenses and other liabilities | 65,135 | 36,708 | |||||
Total liabilities | 915,243 | 859,335 | |||||
Commitments and contingencies (Note 12) | |||||||
Mezzanine equity: | |||||||
Redeemable noncontrolling interest | 15,122 | — | |||||
Stockholders’ equity: | |||||||
Common stock—$0.005 par value, 1,000,000,000 shares authorized and 79,338,337 and 78,412,291 shares issued and 76,301,387 and 75,375,341 outstanding at June 30, 2019 and December 31 2018, respectively. | 401 | 396 | |||||
Treasury stock—at cost | (5,656 | ) | (5,656 | ) | |||
Additional paid-in capital | 508,630 | 502,003 | |||||
Accumulated deficit | (186,997 | ) | (196,959 | ) | |||
Accumulated other comprehensive loss | (1,894 | ) | (1,832 | ) | |||
Total On Deck Capital, Inc. stockholders' equity | 314,484 | 297,952 | |||||
Noncontrolling interest | 3,358 | 4,533 | |||||
Total stockholders' equity | 317,842 | 302,485 | |||||
Total liabilities, mezzanine equity and stockholders' equity | $ | 1,248,207 | $ | 1,161,820 | |||
The accompanying notes are an integral part of these condensed consolidated financial statements.
3
ON DECK CAPITAL, INC. AND SUBSIDIARIES
Unaudited Condensed Consolidated Statements of Operations and Comprehensive Income
(in thousands, except share and per share data)
Three Months Ended June 30, | Six Months Ended June 30, | ||||||||||||||
2019 | 2018 | 2019 | 2018 | ||||||||||||
Revenue: | |||||||||||||||
Interest and finance income | $ | 105,641 | $ | 92,209 | $ | 211,440 | $ | 178,438 | |||||||
Other revenue | 4,605 | 3,247 | 8,781 | 7,158 | |||||||||||
Gross revenue | 110,246 | 95,456 | 220,221 | 185,596 | |||||||||||
Cost of revenue: | |||||||||||||||
Provision for credit losses | 42,951 | 33,293 | 86,242 | 69,586 | |||||||||||
Interest expense | 11,381 | 12,245 | 22,713 | 24,117 | |||||||||||
Total cost of revenue | 54,332 | 45,538 | 108,955 | 93,703 | |||||||||||
Net revenue | 55,914 | 49,918 | 111,266 | 91,893 | |||||||||||
Operating expense: | |||||||||||||||
Sales and marketing | 13,307 | 11,432 | 25,267 | 22,030 | |||||||||||
Technology and analytics | 16,681 | 12,799 | 33,487 | 23,806 | |||||||||||
Processing and servicing | 5,609 | 5,041 | 11,098 | 10,262 | |||||||||||
General and administrative | 16,353 | 16,034 | 30,382 | 33,759 | |||||||||||
Total operating expense | 51,950 | 45,306 | 100,234 | 89,857 | |||||||||||
Income (loss) from operations, before provision for income taxes | 3,964 | 4,612 | 11,032 | 2,036 | |||||||||||
Provision for income taxes | 1,796 | — | 3,536 | — | |||||||||||
Net income (loss) | 2,168 | 4,612 | 7,496 | 2,036 | |||||||||||
Less: Net income (loss) attributable to noncontrolling interest | (2,127 | ) | (1,016 | ) | (2,465 | ) | (1,535 | ) | |||||||
Net income (loss) attributable to On Deck Capital, Inc. common stockholders | $ | 4,295 | $ | 5,628 | $ | 9,961 | $ | 3,571 | |||||||
Net income (loss) per share attributable to On Deck Capital, Inc. common stockholders: | |||||||||||||||
Basic | $ | 0.06 | $ | 0.08 | $ | 0.13 | $ | 0.05 | |||||||
Diluted | $ | 0.05 | $ | 0.07 | $ | 0.13 | $ | 0.05 | |||||||
Weighted-average common shares outstanding: | |||||||||||||||
Basic | 76,137,751 | 74,385,446 | 75,840,604 | 74,182,929 | |||||||||||
Diluted | 78,901,601 | 78,288,267 | 79,013,757 | 77,786,748 | |||||||||||
Comprehensive income (loss): | |||||||||||||||
Net income (loss) | $ | 2,168 | $ | 4,612 | $ | 7,496 | $ | 2,036 | |||||||
Other comprehensive income (loss): | |||||||||||||||
Unrealized (loss) on derivative instrument | (124 | ) | — | (866 | ) | — | |||||||||
Foreign currency translation adjustment | 405 | (395 | ) | 771 | (508 | ) | |||||||||
Comprehensive income (loss) | 2,449 | 4,217 | 7,401 | 1,528 | |||||||||||
Less: Comprehensive income (loss) attributable to noncontrolling interests | (58 | ) | (179 | ) | (32 | ) | (229 | ) | |||||||
Less: Net income (loss) attributable to noncontrolling interest | (2,127 | ) | (1,016 | ) | (2,465 | ) | (1,535 | ) | |||||||
Comprehensive income (loss) attributable to On Deck Capital, Inc. common stockholders | $ | 4,634 | $ | 5,412 | $ | 9,898 | $ | 3,292 | |||||||
The accompanying notes are an integral part of these condensed consolidated financial statements.
4
ON DECK CAPITAL, INC. AND SUBSIDIARIES
Unaudited Condensed Consolidated Statements of Changes in Equity and Redeemable Noncontrolling Interest
(in thousands, except share data)
On Deck Capital, Inc.'s stockholders' equity | |||||||||||||||||||||||||||||||||||||||
Common Stock | Additional Paid-in Capital | Accumulated Deficit | Treasury Stock | Accumulated Other Comprehensive Income (Loss) | Total Stockholders' Equity | Noncontrolling interest | Total Equity | Redeemable Noncontrolling Interest | |||||||||||||||||||||||||||||||
Shares | Amount | ||||||||||||||||||||||||||||||||||||||
Balance at December 31, 2017 | 73,822,001 | $ | 386 | $ | 490,200 | $ | (224,047 | ) | $ | (5,656 | ) | $ | (52 | ) | $ | 260,831 | $ | 4,011 | $ | 264,842 | $ | — | |||||||||||||||||
Stock-based compensation | — | — | 3,122 | — | — | — | 3,122 | — | 3,122 | — | |||||||||||||||||||||||||||||
Issuance of common stock through vesting of restricted stock units and option exercises | 246,130 | 2 | 39 | — | — | — | 41 | — | 41 | — | |||||||||||||||||||||||||||||
Employee stock purchase plan | 196,360 | 1 | 918 | — | — | — | 919 | — | 919 | — | |||||||||||||||||||||||||||||
Tax withholding related to vesting of restricted stock units | — | — | (118 | ) | — | — | — | (118 | ) | — | (118 | ) | — | ||||||||||||||||||||||||||
Currency translation adjustment | — | — | — | — | — | (63 | ) | (63 | ) | (50 | ) | (113 | ) | — | |||||||||||||||||||||||||
Net Income (loss) | — | — | — | (2,058 | ) | — | — | (2,058 | ) | (518 | ) | (2,576 | ) | — | |||||||||||||||||||||||||
Other | — | — | — | (1 | ) | — | (3 | ) | (4 | ) | — | (4 | ) | — | |||||||||||||||||||||||||
Balance-March 31, 2018 | 74,264,491 | $ | 389 | $ | 494,161 | $ | (226,106 | ) | $ | (5,656 | ) | $ | (118 | ) | $ | 262,670 | $ | 3,443 | $ | 266,113 | $ | — | |||||||||||||||||
Stock-based compensation | — | — | 2,712 | — | — | — | $ | 2,712 | — | $ | 2,712 | — | |||||||||||||||||||||||||||
Issuance of common stock through vesting of restricted stock units and option exercises | 376,513 | 2 | (2 | ) | — | — | — | — | — | — | — | ||||||||||||||||||||||||||||
Employee stock purchase plan | — | — | 49 | — | — | — | 49 | — | 49 | — | |||||||||||||||||||||||||||||
Tax withholding related to vesting of restricted stock units | — | — | (323 | ) | — | — | — | (323 | ) | — | (323 | ) | — | ||||||||||||||||||||||||||
Investment by noncontrolling interests | — | — | — | — | — | — | — | 3,402 | 3,402 | — | |||||||||||||||||||||||||||||
Currency translation adjustment | — | — | — | — | — | (216 | ) | (216 | ) | (179 | ) | (395 | ) | — | |||||||||||||||||||||||||
Net Income (loss) | — | — | — | 5,628 | — | — | 5,628 | (1,016 | ) | 4,612 | — | ||||||||||||||||||||||||||||
Balance-June 30, 2018 | 74,641,004 | $ | 391 | $ | 496,597 | $ | (220,478 | ) | $ | (5,656 | ) | $ | (334 | ) | $ | 270,520 | $ | 5,650 | $ | 276,170 | $ | — | |||||||||||||||||
5
On Deck Capital, Inc.'s stockholders' equity | |||||||||||||||||||||||||||||||||||||||
Common Stock | Additional Paid-in Capital | Accumulated Deficit | Treasury Stock | Accumulated Other Comprehensive Income (Loss) | Total Stockholders' Equity | Noncontrolling interest | Total Equity | Redeemable Noncontrolling Interest | |||||||||||||||||||||||||||||||
Shares | Amount | ||||||||||||||||||||||||||||||||||||||
Balance at December 31, 2018 | 75,375,341 | $ | 396 | $ | 502,003 | $ | (196,959 | ) | $ | (5,656 | ) | $ | (1,832 | ) | $ | 297,952 | $ | 4,533 | $ | 302,485 | $ | — | |||||||||||||||||
Stock-based compensation | — | — | 2,743 | — | — | — | 2,743 | — | 2,743 | — | |||||||||||||||||||||||||||||
Issuance of common stock through vesting of restricted stock units and option exercises | 264,364 | 2 | 45 | — | — | — | 47 | — | 47 | — | |||||||||||||||||||||||||||||
Employee stock purchase plan | 267,688 | 1 | 1,659 | — | — | — | 1,660 | — | 1,660 | — | |||||||||||||||||||||||||||||
Tax withholding related to vesting of restricted stock units | — | — | (291 | ) | — | — | — | (291 | ) | — | (291 | ) | — | ||||||||||||||||||||||||||
Currency translation adjustment | — | — | — | — | — | 340 | 340 | 26 | 366 | — | |||||||||||||||||||||||||||||
Cash flow hedge | — | — | — | — | — | (742 | ) | (742 | ) | — | (742 | ) | — | ||||||||||||||||||||||||||
Net Income (loss) | — | — | — | 5,666 | — | — | 5,666 | (338 | ) | 5,328 | — | ||||||||||||||||||||||||||||
Balance-March 31, 2019 | 75,907,393 | $ | 399 | $ | 506,159 | $ | (191,293 | ) | $ | (5,656 | ) | $ | (2,234 | ) | $ | 307,375 | $ | 4,221 | $ | 311,596 | $ | — | |||||||||||||||||
Stock-based compensation | — | — | 2,965 | — | — | — | $ | 2,965 | $ | — | $ | 2,965 | — | ||||||||||||||||||||||||||
Issuance of common stock through vesting of restricted stock units and option exercises | 393,994 | 2 | 26 | — | — | — | 28 | — | 28 | — | |||||||||||||||||||||||||||||
Employee stock purchase plan | — | — | 335 | — | — | — | 335 | — | 335 | — | |||||||||||||||||||||||||||||
Tax withholding related to vesting of restricted stock units | — | — | (844 | ) | — | — | — | (844 | ) | — | (844 | ) | — | ||||||||||||||||||||||||||
Fair value of redeemable noncontrolling interest resulting from business combination | — | — | — | — | — | — | — | — | — | 16,444 | |||||||||||||||||||||||||||||
Currency translation adjustment | — | — | — | — | — | 463 | 463 | (49 | ) | 414 | (9 | ) | |||||||||||||||||||||||||||
Cash flow hedge | — | — | — | — | — | (124 | ) | (124 | ) | — | (124 | ) | — | ||||||||||||||||||||||||||
Other | — | — | (11 | ) | 1 | — | 1 | (9 | ) | — | (9 | ) | — | ||||||||||||||||||||||||||
Net Income (loss) | — | — | — | 4,295 | — | — | 4,295 | (814 | ) | 3,481 | (1,313 | ) | |||||||||||||||||||||||||||
Balance-June 30, 2019 | 76,301,387 | $ | 401 | $ | 508,630 | $ | (186,997 | ) | $ | (5,656 | ) | $ | (1,894 | ) | $ | 314,484 | $ | 3,358 | $ | 317,842 | $ | 15,122 | |||||||||||||||||
The accompanying notes are an integral part of these condensed consolidated financial statements.
6
ON DECK CAPITAL, INC. AND SUBSIDIARIES
Unaudited Condensed Consolidated Statements of Cash Flows
(in thousands)
Six Months Ended June 30, | |||||||
2019 | 2018 | ||||||
Cash flows from operating activities | |||||||
Net income (loss) | $ | 7,496 | $ | 2,036 | |||
Adjustments to reconcile net income (loss) to net cash provided by operating activities: | |||||||
Provision for credit losses | 86,242 | 69,586 | |||||
Depreciation and amortization | 3,574 | 4,218 | |||||
Amortization of debt issuance costs | 1,573 | 3,756 | |||||
Stock-based compensation | 6,331 | 6,004 | |||||
Amortization of net deferred origination costs | 35,277 | 26,499 | |||||
Changes in servicing rights, at fair value | 69 | 188 | |||||
Unfunded loan commitment reserve | 452 | 640 | |||||
Gain on lease termination | — | (1,481 | ) | ||||
Loss on disposal of fixed assets | 1,537 | 5,668 | |||||
Amortization of intangibles | 189 | — | |||||
Changes in operating assets and liabilities: | |||||||
Other assets | (9,595 | ) | (1,999 | ) | |||
Accounts payable | 1,499 | 1,413 | |||||
Interest payable | 302 | 244 | |||||
Accrued expenses and other liabilities | 1,613 | 1,992 | |||||
Net cash provided by operating activities | 136,559 | 118,764 | |||||
Cash flows from investing activities | |||||||
Purchases of property, equipment and software | (1,360 | ) | (695 | ) | |||
Capitalized internal-use software | (4,220 | ) | (2,464 | ) | |||
Originations of term loan, lines of credit and finance receivable, excluding rollovers into new originations | (1,029,348 | ) | (1,009,626 | ) | |||
Payments of net deferred origination costs | (33,505 | ) | (29,958 | ) | |||
Principal repayments of term loans, lines of credit and finance receivables | 946,025 | 865,537 | |||||
Purchase of loans | — | (801 | ) | ||||
Acquisition of shares in business combination | (3,004 | ) | $ | — | |||
Net cash used in investing activities | (125,412 | ) | (178,007 | ) | |||
Cash flows from financing activities | |||||||
Investments by noncontrolling interests | — | 3,403 | |||||
Tax withholding related to vesting of restricted stock units | (1,135 | ) | (441 | ) | |||
Proceeds from exercise of stock options and warrants | 71 | 39 | |||||
Issuance of common stock under employee stock purchase plan | 1,281 | 668 | |||||
Proceeds from the issuance of debt | 355,840 | 407,184 | |||||
Payments of debt issuance costs | (2,812 | ) | (3,748 | ) | |||
Repayments of debt principal | (359,392 | ) | (342,828 | ) | |||
Net cash (used in) provided by financing activities | (6,147 | ) | 64,277 | ||||
Effect of exchange rate changes on cash and cash equivalents | (558 | ) | (1,407 | ) | |||
Net increase in cash, cash equivalents and restricted cash | 4,442 | 3,627 | |||||
Cash, cash equivalents, and restricted cash at beginning of year | 97,638 | 114,824 | |||||
Cash, cash equivalents, and restricted cash at end of period | $ | 102,080 | $ | 118,451 | |||
7
Six Months Ended June 30, | |||||||
2019 | 2018 | ||||||
Reconciliation to amounts on consolidated balance sheets | |||||||
Cash and cash equivalents | $ | 58,744 | $ | 74,262 | |||
Restricted cash | 43,336 | 44,189 | |||||
Total cash, cash equivalents and restricted cash | $ | 102,080 | $ | 118,451 | |||
Supplemental disclosure of other cash flow information | |||||||
Cash paid for interest | $ | 20,038 | $ | 21,445 | |||
Supplemental disclosures of non-cash investing and financing activities | |||||||
Stock-based compensation included in capitalized internal-use software | $ | 109 | $ | 130 | |||
Unpaid principal balance of term loans rolled into new originations | $ | 198,319 | $ | 167,687 | |||
The accompanying notes are an integral part of these condensed consolidated financial statements.
8
ON DECK CAPITAL, INC. AND SUBSIDIARIES
Notes to Unaudited Condensed Consolidated Financial Statements
1. Organization and Summary of Significant Accounting Policies
On Deck Capital, Inc.’s principal activity is providing financing to small businesses located throughout the United States as well as Canada and Australia, through term loans and lines of credit, and additionally in Canada through merchant cash advances. We use technology and analytics to aggregate data about a business and then quickly and efficiently analyze the creditworthiness of the business using our proprietary credit-scoring model. We originate most of the loans in our portfolio and also purchase loans from an issuing bank partner. We subsequently transfer most of our loan volume into one of our wholly-owned subsidiaries for financing purposes.
In October 2018, we announced the launch of ODX, a wholly-owned subsidiary that helps banks digitize their small business lending process. ODX offers a combination of software, analytic insights, and professional services that allow banks to bring their small business lending process online.
In April 2019, we combined our Canadian operations with Evolocity Financial Group, or Evolocity, to create a new holding company in which we own a 58.5% majority interest. We have accounted for this transaction as a business combination and have consolidated the financial position and results of operations of the holding company. The noncontrolling interest has been classified as mezzanine equity because it was deemed to be a redeemable noncontrolling interest. See Note 2 for further discussion.
Basis of Presentation and Principles of Consolidation
We prepare our consolidated financial statements and footnotes in accordance with accounting principles generally accepted in the United States of America, or GAAP, as contained in the Financial Accounting Standards Board, or FASB, Accounting Standards Codification, or ASC. All intercompany transactions and accounts have been eliminated in consolidation. When used in these notes to consolidated financial statements, the terms "we," "us," "our" or similar terms refer to On Deck Capital, Inc. and its consolidated subsidiaries.
Use of Estimates
The preparation of financial statements in conformity with GAAP requires us to make estimates and assumptions that affect the reported amounts in the consolidated financial statements and accompanying notes. Significant estimates include allowance for credit losses, stock-based compensation expense, capitalized software development costs, interest rate cap, the useful lives of long-lived assets, our effective income tax rate and valuation allowance for deferred tax assets. We base our estimates on historical experience, current events and other factors we believe to be reasonable under the circumstances. These estimates and assumptions are inherently subjective in nature; actual results may differ from these estimates and assumptions.
Recently Adopted Accounting Standards
In August 2017, the FASB issued ASU 2017-12, Derivatives and Hedging: Targeted Improvements to Accounting for Hedging Activities, which improves the financial reporting of hedging relationships to better portray the economic results of an entity's risk management activities in its financial statements and make certain targeted improvements to simplify the application of the hedge accounting guidance. The amendments in this update better align an entity's risk management activities and financial reporting for hedging relationships through changes to both the designation and measurement guidance for qualifying hedging relationships and presentation of hedge results. The effective date for the standard is for fiscal years beginning after December 15, 2018. We elected to early adopt this ASU in fiscal year 2018. See Note 10 for a discussion of our derivatives.
In February 2016, the FASB issued ASU 2016-02, Leases, which creates ASC 842, Leases, and supersedes ASC 840, Leases. ASU 2016-02 requires lessees to recognize a right-of-use asset and lease liability for all leases with terms of more than 12 months. The new standard is effective for annual reporting periods beginning after December 15, 2018, including interim periods within that reporting period. In July 2018, the FASB issued ASU No. 2018-11, Leases (Topic 842): Targeted Improvements. We elected the prospective transition option provided by the ASU that would not require earlier periods to be restated upon adoption. We elected the package of practical expedients afforded under the standard which permit an entity not to: (i) reassess whether existing or expired contracts are or contain a lease, (ii) reassess the lease classification, and (iii) reassess any initial direct costs for any existing leases. Our operating lease commitments, which were primarily real estate leases, were recognized as a $37.5 million lease liability when we adopted the new standard. The balance, which is included in Other Liabilities on the Consolidated Balance Sheet, is $36.5 million at June 30, 2019. We simultaneously recognized a $37.5 million right-of-use asset when we adopted the standard. Our right-of-use asset was partially offset by $10.1 million of existing deferred rent and lease incentives resulting in a net right-of-use asset of $27.6 million which is included in Other Assets on the Consolidated Balance Sheet. At June 30, 2019 the balance was $26.7 million. Our total operating lease cost for the three months ended June 30, 2019 was $1.5 million and allocated
9
within operating expenses. The weighted average remaining lease term was 6.8 years and we utilized a weighted average discount rate of approximately 7%.
Recent Accounting Pronouncements Not Yet Adopted
In June 2016, the FASB issued ASU 2016-13, Measurement of Credit Losses on Financial Instruments. ASU 2016-13 will change the impairment model and how entities measure credit losses for most financial assets. The standard requires entities to use the new expected credit loss impairment model which will replace the incurred loss model used today. The new guidance will be effective for annual reporting periods beginning after December 15, 2019. Early adoption is permitted, although we do not intend to do so. We are currently assessing the impact that the adoption of this guidance will have on our consolidated financial statements.
In January 2017, the FASB issued ASU 2017-04, Intangibles-Goodwill and Other: Simplifying the Test for Goodwill Impairment, which eliminates the requirement to determine the fair value of individual assets and liabilities of a reporting unit to measure goodwill impairment. Under the amendments in the new ASU, goodwill impairment testing will be performed by comparing the fair value of the reporting unit with its carrying amount and recognizing an impairment charge for the amount by which the carrying amount exceeds the reporting unit’s fair value. The new standard will become effective for annual reporting periods beginning after December 12, 2019. Early adoption is permitted, although we do not intend to do so. We are currently evaluating the impact the new standard may have on our disclosures, but we do not expect it to have a material impact.
In August 2018, the FASB issued ASU 2018-13, Fair Value Measurement (Topic 820): Disclosure Framework-Changes to the Disclosure Requirements for Fair Value Measurement, which modifies disclosure requirements for fair value measurements under ASC 820, Fair Value Measurement. The new guidance will be effective for annual reporting periods beginning after December 15, 2019. We are currently evaluating the impact the new standard may have on our disclosures, but we do not expect it to have a material impact.
Revision of Prior Period Financial Statements
During the second quarter of 2019, we identified an immaterial error in our historical financial statements relating to the accrual of commissions on a portion of our renewal loans. The aggregate amount of the under-accrual was $2.4 million, approximately 90% of which relates to 2015 and subsequent periods, and represents less than 1%, of our total stockholders’ equity at March 31, 2019. The amount of the error in each of the impacted annual and interim periods was less than 1% of total commissions paid for such period.
In accordance with the SEC’s SAB No. 99, “Materiality,” and SAB No. 108, “Considering the Effects of Prior Year Misstatements when Quantifying Misstatements in Current Year Financial Statements,” we evaluated the error and concluded that the impact was not material to our financial statements for any prior annual or interim period. Accordingly, we have revised our previously reported financial information to correct the immaterial error contained in our Quarterly Report on Form 10-Q for the three-months ended and six-months ended June 30, 2018. We will also revise previously reported financial information for this immaterial error in our future filings, as applicable.
A summary of revisions to certain previously reported financial information is presented in Note 11.
2. Business Combination
On April 1, 2019, we combined our Canadian operations with Evolocity Financial Group, or Evolocity, a Montreal-based online small business lender. The purpose of the transaction was to accelerate the growth of our Canadian operations and to enable us to provide a broader range of financing options to Canadian small businesses nationwide. In the transaction, Evolocity contributed its business to a holding company, and we contributed our Canadian business plus cash to that holding company such that we own a 58.5% majority interest in the holding company. The remainder is owned by former Evolocity stockholders. The Company has accounted for this transaction as a business combination.
The transaction has a preliminary purchase price for accounting purposes of approximately $16.7 million. Our provisional valuation of the assets acquired and liabilities assumed, including but not limited to loans, intangible assets and goodwill, is preliminary and the fair values are subject to change within the measurement period of up to one year from the business combination date. Goodwill arising from the business combination is not amortized, but is subject to impairment testing at least annually or more frequently if there is an indicator of impairment.
10
The following table summarizes the preliminary fair value of the assets acquired and liabilities assumed in connection with the business combination (in thousands):
Fair Value | |||
Loans and finance receivables | $ | 37,454 | |
Intangibles and other assets (1) | 2,860 | ||
Debt and other liabilities | (34,437 | ) | |
Goodwill (1) | 10,844 | ||
Net assets acquired | $ | 16,721 | |
(1) Goodwill, and Intangibles and other assets were included in Other Assets on the Consolidated Balance Sheet as of June 30, 2019.
We consolidate the financial position and results of operations of the holding company.
As part of this business combination, the noncontrolling interest was deemed to be a redeemable noncontrolling interest. These interests are classified as mezzanine equity and measured at the greater of fair value at the end of each reporting period or the historical cost basis of the noncontrolling interest adjusted for cumulative earnings allocations.
3. Net Income (Loss) Per Common Share
Basic and diluted net income (loss) per common share is calculated as follows (in thousands, except share and per share data):
Three Months Ended June 30, | Six Months Ended June 30, | ||||||||||||||
2019 | 2018 | 2019 | 2018 | ||||||||||||
Numerator: | |||||||||||||||
Net Income (loss) | $ | 2,168 | $ | 4,612 | $ | 7,496 | $ | 2,036 | |||||||
Less: Net income (loss) attributable to noncontrolling interest | (2,127 | ) | (1,016 | ) | (2,465 | ) | (1,535 | ) | |||||||
Net income (loss) attributable to On Deck Capital, Inc. common stockholders | $ | 4,295 | $ | 5,628 | $ | 9,961 | $ | 3,571 | |||||||
Denominator: | |||||||||||||||
Weighted-average common shares outstanding, basic | 76,137,751 | 74,385,446 | 75,840,604 | 74,182,929 | |||||||||||
Net income (loss) per common share, basic | $ | 0.06 | $ | 0.08 | $ | 0.13 | $ | 0.05 | |||||||
Effect of dilutive securities | 2,763,850 | 3,902,821 | 3,173,153 | 3,603,819 | |||||||||||
Weighted-average common shares outstanding, diluted | 78,901,601 | 78,288,267 | 79,013,757 | 77,786,748 | |||||||||||
Net income (loss) per common share, diluted | $ | 0.05 | $ | 0.07 | $ | 0.13 | $ | 0.05 | |||||||
Anti-dilutive securities excluded | 6,747,782 | 5,174,846 | 5,591,794 | 5,351,219 | |||||||||||
The difference between basic and diluted net income per common share has been calculated using the Treasury Stock Method based on the assumed exercise of outstanding stock options, the vesting of restricted stock units, or RSUs, performance restricted stock units, or PRSUs, and the issuance of stock under our employee stock purchase plan. Changes in the average market price of our stock can impact when stock equivalents are considered dilutive or anti-dilutive. The following common share equivalent securities have been included in the calculation of dilutive weighted-average common shares outstanding:
Three Months Ended June 30, | Six Months Ended June 30, | ||||||||||
Dilutive Common Share Equivalents | 2019 | 2018 | 2019 | 2018 | |||||||
Weighted-average common shares outstanding | 76,137,751 | 74,385,446 | 75,840,604 | 74,182,929 | |||||||
RSUs and PRSUs | 489,080 | 1,018,066 | 755,731 | 768,172 | |||||||
Stock options | 2,274,770 | 2,860,430 | 2,413,951 | 2,830,587 | |||||||
Employee stock purchase plan | — | 24,325 | 3,471 | 5,060 | |||||||
Total dilutive common share equivalents | 78,901,601 | 78,288,267 | 79,013,757 | 77,786,748 | |||||||
11
The following common share equivalent securities were excluded from the calculation of diluted net income per share attributable to common stockholders. Their effect would have been antidilutive for the three and six months ended June 30, 2019 and 2018.
Three Months Ended June 30, | Six Months Ended June 30, | ||||||||||
2019 | 2018 | 2019 | 2018 | ||||||||
Anti-Dilutive Common Share Equivalents | |||||||||||
Warrants to purchase common stock | — | 22,000 | — | 22,000 | |||||||
RSUs and PRSUs | 2,361,583 | 429,942 | 1,633,192 | 600,632 | |||||||
Stock options | 4,176,551 | 4,722,904 | 3,958,602 | 4,728,587 | |||||||
Employee stock purchase plan | 209,648 | — | — | — | |||||||
Total anti-dilutive common share equivalents | 6,747,782 | 5,174,846 | 5,591,794 | 5,351,219 | |||||||
4. Interest Income
Interest income was comprised of the following components for the three and six months ended June 30, 2019 and 2018 (in thousands):
Three Months Ended June 30, | Six Months Ended June 30, | ||||||||||||||
2019 | 2018 | 2019 | 2018 | ||||||||||||
Interest and finance income | $ | 122,799 | $ | 106,090 | $ | 246,234 | $ | 204,845 | |||||||
Amortization of net deferred origination costs | (17,451 | ) | (13,913 | ) | (35,344 | ) | (26,459 | ) | |||||||
Interest and finance income, net | 105,348 | 92,177 | 210,890 | 178,386 | |||||||||||
Interest on deposits and investments | 293 | 32 | 550 | 52 | |||||||||||
Total interest and finance income | $ | 105,641 | $ | 92,209 | $ | 211,440 | $ | 178,438 | |||||||
5. Loans and Finance Receivables Held for Investment and Allowance for Credit Losses
Loans and finance receivables held for investment consisted of the following as of June 30, 2019 and December 31, 2018 (in thousands):
June 30, 2019 | December 31, 2018 | ||||||
Term loans | $ | 936,053 | $ | 956,755 | |||
Lines of credit | 238,105 | 188,199 | |||||
Other loans and finance receivables (1) | 10,964 | — | |||||
Total Unpaid Principal Balance | 1,185,122 | 1,144,954 | |||||
Net deferred origination costs | 22,487 | 24,453 | |||||
Total loans and finance receivables held for investment | $ | 1,207,609 | $ | 1,169,407 | |||
(1) | Includes secured equipment loans and merchant cash advances. |
As part of the business combination with Evolocity, on April 1, 2019 we purchased $37.5 million of term loans and finance receivables. During the six months ended June 30, 2018, we paid $0.8 million to purchase term loans that we previously sold to a third party. No loans from third parties were purchased during 2019.
We include both loans we originate and loans funded by our issuing bank partner and later purchased by us as part of our originations. During the three months ended June 30, 2019 and 2018 we purchased loans from our issuing bank partner in the amount of $95.5 million and $109.3 million, respectively. During the six months ended June 30, 2019 and 2018 we purchased loans from our issuing bank partner in the amount of $207.1 million and $248.5 million, respectively.
12
The change in the allowance for credit losses for the three and six months ended June 30, 2019 and 2018 consisted of the following (in thousands):
Three Months Ended June 30, | Six Months Ended June 30, | ||||||||||||||
2019 | 2018 | 2019 | 2018 | ||||||||||||
Balance at beginning of period | $ | 147,406 | $ | 118,921 | $ | 140,040 | $ | 109,015 | |||||||
Recoveries of previously charged off amounts | 4,523 | 3,206 | 8,437 | 6,551 | |||||||||||
Loans and finance receivables charged off | (49,141 | ) | (31,362 | ) | (88,980 | ) | (61,094 | ) | |||||||
Provision for credit losses | 42,951 | 33,293 | 86,242 | 69,586 | |||||||||||
Allowance for credit losses at end of period | $ | 145,739 | $ | 124,058 | $ | 145,739 | $ | 124,058 | |||||||
When loans and finance receivables are charged off, we typically continue to attempt to recover amounts from the respective borrowers and guarantors, including, when we deem it appropriate, through formal legal action. Alternatively, we may sell previously charged-off loans to a third-party debt collector. The proceeds from these sales are recorded as a component of the recoveries of loans previously charged off. We did not sell any previously charged-off loans for the three and six months ended June 30, 2019. For the three and six months ended June 30, 2018 loans sold accounted for $0.2 million and $0.7 million of recoveries of loans previously charged off.
As of June 30, 2019 and December 31, 2018, our off-balance sheet credit exposure related to the undrawn line of credit balances was $282.2 million and $264.2 million, respectively. The related reserve on unfunded loan commitments was $6.3 million and $5.9 million as of June 30, 2019 and December 31, 2018, respectively. Net adjustments to the liability for unfunded loan commitments are included in general and administrative expense.
The following table contains information, on a combined basis, regarding the unpaid principal balance we originated related to non-delinquent, paying and non-paying delinquent loans and finance receivables as of June 30, 2019 and December 31, 2018 (in thousands):
June 30, 2019 | December 31, 2018 | ||||||
Current loans and finance receivables | $ | 1,060,465 | $ | 1,031,449 | |||
Delinquent: paying (accrual status) | 52,735 | 54,427 | |||||
Delinquent: non-paying (non-accrual status) | 71,922 | 59,078 | |||||
Total | $ | 1,185,122 | $ | 1,144,954 | |||
The portion of the allowance for credit losses attributable to current loans and finance receivables was $70.5 million and $85.7 million as of June 30, 2019 and December 31, 2018, respectively, while the portion of the allowance for credit losses attributable to delinquent loans and finance receivables was $75.3 million and $54.3 million as of June 30, 2019 and December 31, 2018, respectively.
The following table shows an aging analysis of the unpaid principal balance related to loans and finance receivables by delinquency status as of June 30, 2019 and December 31, 2018 (in thousands):
June 30, 2019 | December 31, 2018 | ||||||
By delinquency status: | |||||||
Current loans and finance receivables | $ | 1,060,465 | $ | 1,031,449 | |||
1-14 calendar days past due | 23,798 | 27,655 | |||||
15-29 calendar days past due | 15,518 | 14,665 | |||||
30-59 calendar days past due | 23,931 | 21,470 | |||||
60-89 calendar days past due | 18,162 | 19,031 | |||||
90 + calendar days past due | 43,248 | 30,684 | |||||
Total unpaid principal balance | $ | 1,185,122 | $ | 1,144,954 | |||
13
6. Debt
The following table summarizes our outstanding debt as of June 30, 2019 and December 31, 2018 (in thousands):
Outstanding | |||||||||||||
Type | Maturity Date | Weighted Average Interest Rate at June 30, 2019 | June 30, 2019 | December 31, 2018 | |||||||||
Debt: | |||||||||||||
OnDeck Asset Securitization Trust II | Securitization | April 2022 | (1) | 3.8% | $ | 225,000 | $ | 225,000 | |||||
OnDeck Account Receivables Trust 2013-1 | Revolving | March 2022 | (2) | 4.2% | 111,827 | 117,664 | |||||||
Receivable Assets of OnDeck, LLC | Revolving | September 2021 | (3) | 4.8% | 101,453 | 113,631 | |||||||
OnDeck Asset Funding II LLC | Revolving | August 2022 | (4) | 5.4% | 110,202 | 109,568 | |||||||
Prime OnDeck Receivable Trust II | Revolving | March 2022 | (5) | 4.4% | 108,949 | 108,816 | |||||||
Loan Assets of OnDeck, LLC | Revolving | October 2022 | (6) | 4.2% | 98,469 | 100,000 | |||||||
Corporate Debt | Revolving | January 2021 | 5.4% | 20,000 | — | ||||||||
Other Agreements | Various | Various | (7) | 6.8% | (8) | 72,909 | (9) | 47,318 | |||||
4.6% | 848,809 | 821,997 | |||||||||||
Deferred debt issuance cost | (7,207 | ) | (5,766 | ) | |||||||||
Total Debt | $ | 841,602 | $ | 816,231 | |||||||||
(1) | The period during which new loans may be purchased under this securitization transaction expires in March 2020. |
(2) | The period during which new borrowings may be made under this facility expires in March 2021. |
(3) | The period during which new borrowings of Class A revolving loans may be made under this debt facility expires in December 2020. The $19.7 million of Class B borrowing capacity matures in December 2019. |
(4) | The period during which new borrowings may be made under this facility expires in August 2021. |
(5) | The period during which new borrowings may be made under this facility expires in March 2021. |
(6) | The period during which new borrowings may be made under this debt facility expires in April 2022. |
(7) | The periods during which new borrowings may be made under the various agreements expire between September 2019 and June 2020. Maturity dates range from September 2019 through December 2022. |
(8) | Weighted average interest rate as of June 30, 2019 reflects the credit facilities assumed as a part of the combination with Evolocity Financial Group. |
(9) | Outstanding amounts as of June 30, 2019 reflects the credit facilities assumed as a part of the combination with Evolocity Financial Group. |
Certain of our loans held for investment are pledged as collateral for borrowings in our funding debt facilities. These loans totaled $1.0 billion and $1.0 billion as of June 30, 2019 and December 31, 2018, respectively. Our corporate debt facility is collateralized by substantially all of our assets.
7. Fair Value of Financial Instruments
Assets and Liabilities Measured at Fair Value on a Recurring Basis Using Significant Unobservable Inputs
We evaluate our financial assets and liabilities subject to fair value measurements on a recurring basis to determine the appropriate level at which to classify them for each reporting period. Our interest rate cap is reported at fair value utilizing Level 2 inputs. The fair value is determined using third party valuations that are based on discounted cash flow analysis using observed market inputs.
14
The following tables present information about our assets and liabilities that are measured at fair value on a recurring basis as of June 30, 2019 and December 31, 2018 (in thousands):
June 30, 2019 | |||||||||||||||
Level 1 | Level 2 | Level 3 | Total | ||||||||||||
Assets: | |||||||||||||||
Interest rate cap | — | 41 | — | 41 | |||||||||||
Total assets | $ | — | $ | 41 | $ | — | $ | 41 | |||||||
December 31, 2018 | |||||||||||||||
Level 1 | Level 2 | Level 3 | Total | ||||||||||||
Assets: | |||||||||||||||
Interest rate cap | $ | — | $ | 1,253 | $ | — | $ | 1,253 | |||||||
Total assets | $ | — | $ | 1,253 | $ | — | $ | 1,253 | |||||||
There were no transfers between levels for the three months ended June 30, 2019 and December 31, 2018.
Assets and Liabilities Disclosed at Fair Value
Because our loans and finance receivables and fixed-rate debt are not measured at fair value, we are required to disclose their fair value in accordance with ASC 825. Due to the lack of transparency and comparable loans and finance receivables, we utilize an income valuation technique to estimate fair value. We utilize industry-standard modeling, such as discounted cash flow models, to arrive at an estimate of fair value and may utilize third-party service providers to assist in the valuation process. This determination requires significant judgments to be made. The following tables summarize the carrying value and fair value of our loans held for investment and fixed-rate debt (in thousands):
June 30, 2019 | |||||||||||||||||||
Carrying Value | Fair Value | Level 1 | Level 2 | Level 3 | |||||||||||||||
Assets: | |||||||||||||||||||
Loans and finance receivables, net | $ | 1,061,870 | $ | 1,191,009 | $ | — | $ | — | $ | 1,191,009 | |||||||||
Total assets | $ | 1,061,870 | $ | 1,191,009 | $ | — | $ | — | $ | 1,191,009 | |||||||||
Liabilities: | |||||||||||||||||||
Fixed-rate debt | $ | 240,238 | $ | 236,026 | $ | — | $ | — | $ | 236,026 | |||||||||
Total fixed-rate debt | $ | 240,238 | $ | 236,026 | $ | — | $ | — | $ | 236,026 | |||||||||
December 31, 2018 | |||||||||||||||||||
Carrying Value | Fair Value | Level 1 | Level 2 | Level 3 | |||||||||||||||
Assets: | |||||||||||||||||||
Loans and finance receivables, net | $ | 1,029,367 | $ | 1,155,464 | $ | — | $ | — | $ | 1,155,464 | |||||||||
Total assets | $ | 1,029,367 | $ | 1,155,464 | $ | — | $ | — | $ | 1,155,464 | |||||||||
Liabilities: | |||||||||||||||||||
Fixed-rate debt | $ | 232,972 | $ | 226,965 | $ | — | $ | — | $ | 226,965 | |||||||||
Total fixed-rate debt | $ | 232,972 | $ | 226,965 | $ | — | $ | — | $ | 226,965 | |||||||||
15
8. Income Taxes
For interim periods, the income tax provision is comprised of tax on ordinary income provided at the most recent estimated annual effective tax rate, adjusted for the tax effect of discrete items. We use an estimated annual effective tax rate which is based on expected annual income and statutory tax rates to determine our quarterly provision for income taxes. Certain significant or unusual items are separately recognized in the quarter in which they occur and can be a source of variability in the effective tax rates from quarter to quarter.
Our provision for income taxes for the three and six months ended June 30, 2019 was $1.8 million and $3.5 million, representing an estimated quarterly effective income tax rate of 45% for the three months ended June 30, 2019 and a year to date effective income tax rate of 32%. The effective income tax rate for the full year 2018 was 0% due to the availability of net operating loss carryforwards. A valuation allowance of $37.6 million was recorded against our net deferred tax assets of approximately $42.7 million as of June 30, 2019 resulting in a net deferred tax asset of approximately $5.0 million.
9. Stock-Based Compensation and Employee Benefit Plans
Options
The following is a summary of option activity for the six months ended June 30, 2019:
Number of Options | Weighted- Average Exercise Price | Weighted- Average Remaining Contractual Term (in years) | Aggregate Intrinsic Value (in thousands) | ||||||||||
Outstanding at January 1, 2019 | 7,932,782 | $ | 5.86 | — | — | ||||||||
Exercised | (389,335 | ) | $ | 2.63 | — | — | |||||||
Expired | (508,557 | ) | $ | 11.24 | — | — | |||||||
Outstanding at June 30, 2019 | 7,034,890 | $ | 5.65 | 5.5 | $ | 9,043 | |||||||
Exercisable at June 30, 2019 | 6,093,122 | $ | 5.63 | 5.1 | $ | 9,043 | |||||||
Vested or expected to vest as of June 30, 2019 | 6,984,662 | $ | 5.65 | 5.5 | $ | 9,043 | |||||||
Total compensation cost related to nonvested option awards not yet recognized as of June 30, 2019 was $1.9 million and will be recognized over a weighted-average period of 2.1 years. The aggregate intrinsic value of employee options exercised during the six months ended June 30, 2019 and 2018 was $1.4 million and $2.0 million, respectively.
16
Restricted Stock Units
The following table is a summary of activity in RSUs and PRSUs for the six months ended June 30, 2019:
Number of RSUs and PRSUs | Weighted-Average Grant Date Fair Value | |||||
Unvested at January 1, 2019 | 3,307,561 | $ | 6.00 | |||
RSUs and PRSUs granted | 1,984,378 | $ | 5.64 | |||
RSUs and PRSUs vested | (585,312 | ) | $ | 6.57 | ||
RSUs and PRSUs forfeited/expired | (294,195 | ) | $ | 5.78 | ||
Unvested at June 30, 2019 | 4,412,432 | $ | 5.78 | |||
Expected to vest after June 30, 2019 | 3,594,305 | $ | 5.76 | |||
As of June 30, 2019, there was $16 million of unrecognized compensation cost related to unvested RSUs and PRSUs, which is expected to be recognized over a weighted-average period of 2.8 years.
Stock-based compensation expense related to stock options, RSUs, PRSUs and the employee stock purchase plan are included in the following line items in our accompanying consolidated statements of operations for the three months and six months ended June 30, 2019 and 2018 (in thousands):
Three Months Ended June 30, | Six Months Ended June 30, | ||||||||||||||
2019 | 2018 | 2019 | 2018 | ||||||||||||
Sales and marketing | $ | 474 | $ | 505 | $ | 1,033 | $ | 1,040 | |||||||
Technology and analytics | 889 | 657 | 1,717 | 1,253 | |||||||||||
Processing and servicing | 49 | 94 | 139 | 201 | |||||||||||
General and administrative | 1,836 | 1,538 | 3,442 | 3,510 | |||||||||||
Total | $ | 3,248 | $ | 2,794 | $ | 6,331 | $ | 6,004 | |||||||
10. Derivatives and Hedging
We are subject to interest rate risk in connection with borrowings under our debt agreements which are subject to variable interest rates. In December 2018 we entered into an interest rate cap, which is a derivative instrument, to manage our interest rate risk on a portion of our variable-rate debt. We do not use derivatives for speculative purposes. The interest rate cap is designated as a cash flow hedge. In exchange for our up-front premium, we would receive variable amounts from a counterparty if interest rates rise above the strike rate on the contract. The interest rate cap agreement is for a notional amount of $300 million and has a maturity date of January 2021.
For derivatives designated and that qualify as cash flow hedges of interest rate risk, the changes in the fair value of the derivative are recorded in Accumulated Other Comprehensive Income, or AOCI, and subsequently reclassified into interest expense in the same period(s) during which the hedged transaction affects earnings. Gains and losses on the derivative representing hedge components excluded from the assessment of effectiveness are recognized over the life of the hedge on a systematic and rational basis, as documented at hedge inception in accordance with our accounting policy election. The earnings recognition of excluded components is presented in interest expense. Amounts reported in AOCI related to derivatives will be reclassified to interest expense as interest payments are made on our variable-rate debt. We estimate that $1.0 million will be reclassified as an increase to interest expense over the next 12 months.
The table below presents the fair value of our derivative financial instruments as well as their classification on the Balance Sheet as of June 30, 2019 and December 31, 2018 (in thousands):
Derivative Type | Classification | June 30, 2019 | December 31, 2018 | |||||||
Assets: | ||||||||||
Interest rate cap agreement | Other Assets | $ | 41 | $ | 1,253 | |||||
17
The table below presents the effect of cash flow hedge accounting on AOCI as of June 30, 2019 and December 31, 2018 (in thousands):
June 30, 2019 | December 31, 2018 | ||||||
Amount Recognized in OCI on Derivative: | |||||||
Interest rate cap agreement | $ | 866 | $ | 456 | |||
The table below presents the effect of our derivative financial instruments on the Statement of Operations and Comprehensive Income as of three and six months ended June 30, 2019 and 2018 (in thousands):
Location and Amount of Gain or (Loss) Recognized in Income on Cash Flow Hedging Relationships | ||||||||||||||||
Three Months Ended June 30, | Six Months Ended June 30, | |||||||||||||||
2019 | 2018 | 2019 | 2018 | |||||||||||||
Interest expense | $ | (204 | ) | $ | — | $ | (338 | ) | $ | — | ||||||
11. Revision of Prior Period Financial Statements
We revised prior period financial statements to correct an immaterial error related to the channel attribution of certain loans and the commissions associated with those loans. Commissions become due upon the closing of a loan. Those commissions are capitalized as a component of the loan balance and are amortized as an adjustment to interest income over the life of the loan. A summary of those revisions is as follows:
Revised Consolidated Balance Sheet as of December 31, 2018 (in thousands):
As Reported | Adjustment | As Revised | |||||||||
Loans and finance receivables | $ | 1,169,157 | $ | 250 | $ | 1,169,407 | |||||
Total assets | $ | 1,161,570 | $ | 250 | $ | 1,161,820 | |||||
Accrued expenses and other liabilities | $ | 34,654 | $ | 2,054 | $ | 36,708 | |||||
Total liabilities | $ | 857,281 | $ | 2,054 | $ | 859,335 | |||||
Accumulated deficit | $ | (195,155 | ) | $ | (1,804 | ) | $ | (196,959 | ) | ||
Total On Deck Capital, Inc. stockholders' equity | $ | 299,756 | $ | (1,804 | ) | $ | 297,952 | ||||
Total stockholders' equity | $ | 304,289 | $ | (1,804 | ) | $ | 302,485 | ||||
Revised Consolidated Statements of Operations and Comprehensive Income (in thousands):
Three Months Ended June 30, 2018 | Six Months Ended June 30, 2018 | ||||||||||
As Reported | Adjustment | As Revised | As Reported | Adjustment | As Revised | ||||||
Interest and finance income | $92,371 | $(162) | $92,209 | $178,740 | $(302) | $178,438 | |||||
Gross revenue | $95,618 | $(162) | $95,456 | $185,898 | $(302) | $185,596 | |||||
Net revenue | $50,080 | (1) | $(162) | $49,918 | $92,195 | (1) | $(302) | $91,893 | |||
Income (loss) from operations, before provision for income taxes | $4,774 | (1) | $(162) | $4,612 | $2,338 | (1) | $(302) | $2,036 | |||
Net income (loss) | $4,774 | $(162) | $4,612 | $2,338 | $(302) | $2,036 | |||||
(1) Includes a prior period reclassification to include interest expense as funding costs.
There was no impact to earnings per share for any period presented.
18
Revised Consolidated Statements of Cash Flows
We revised our condensed consolidated statement of cash flows for the six months ended June 30, 2018 to reflect the correction of the error, which had no impact to net cash provided by operating activities, net cash used in investing activities and net cash provided by financing activities in the period.
12. Commitments and Contingencies
Concentrations of Credit Risk
Financial instruments that potentially subject us to significant concentrations of credit risk consist principally of cash, cash equivalents, restricted cash and loans. We hold cash, cash equivalents and restricted cash in accounts at regulated domestic financial institutions in amounts that exceed or may exceed FDIC insured amounts and at non-U.S. financial institutions where deposited amounts may be uninsured. We believe these institutions to be of acceptable credit quality and we have not experienced any related losses to date.
We are exposed to default risk on loans we originate and hold and that we purchase from our issuing bank partner. We perform an evaluation of each customer's financial condition and during the term of the customer's loan(s), we have the contractual right to limit a customer's ability to take working capital loans or other financing from other lenders that may cause a material adverse change in the financial condition of the customer.
Contingencies
From time to time we are subject to legal proceedings and claims in the ordinary course of business. The results of such matters cannot be predicted with certainty. However, we believe that the final outcome of any such current matters will not result in a material adverse effect on our consolidated financial condition, consolidated results of operations or consolidated cash flows.
13. Subsequent Events
On July 19, 2019, we increased the commitment under our corporate revolving debt facility by $20 million to an aggregate commitment amount of $105 million. The facility's interest rate of 1-month LIBOR plus 3.0% and the final maturity date in January 2021 did not change.
19
Item 2. | Management’s Discussion and Analysis of Financial Condition and Results of Operations |
You should read the following discussion and analysis of our financial condition and results of operations together with our unaudited condensed consolidated financial statements and the related notes, and other financial information included elsewhere in this report. Some of the information contained in this discussion and analysis, including information with respect to our plans and strategy for our business, includes forward-looking statements that involve risks and uncertainties. You should review the “Cautionary Note Regarding Forward-Looking Statements” and Part II - Item 1A. Risk Factors sections of this report for a discussion of important factors that could cause actual results to differ materially from the results described in, or implied by, the forward-looking statements contained in the following discussion and analysis.
20
CAUTIONARY NOTE REGARDING FORWARD-LOOKING STATEMENTS
This report contains forward-looking statements within the meaning of the Private Securities Litigation Reform Act of 1995 and other legal authority. These forward-looking statements concern our operations, economic performance, financial condition, goals, beliefs, future growth strategies, objectives, plans and current expectations.
Forward-looking statements appear throughout this report including in Part I - Item 2. Management’s Discussion and Analysis of Financial Condition and Results of Operations, Part II - Item 1. Legal Proceedings and Part II - Item 1A. Risk Factors. Forward-looking statements can generally be identified by words such as “will,” “enables,” “expects,” "intends," "may," “allows,” "plan," “continues,” “believes,” “anticipates,” “estimates” or similar expressions.
Forward-looking statements are neither historical facts nor assurances of future performance. They are based only on our current beliefs, expectations and assumptions regarding the future of our business, anticipated events and trends, the economy and other future conditions. As such, they are subject to inherent uncertainties, risks and changes in circumstances that are difficult to predict and in many cases outside our control. Therefore, you should not rely on any of these forward-looking statements. Our expected results may not be achieved, and actual results may differ materially from our expectations.
Important factors that could cause or contribute to such differences include risks relating to: (1) our ability to achieve consistent profitability in the future in light of our prior loss history and competition; (2) our growth strategies, including the introduction of new products or features, expanding our platform to other lenders through ODX, maintaining ODX’s current clients or losing a significant ODX client, expansion into international markets, offering equipment financing and our ability to effectively manage and fund our growth; (3) possible future acquisitions of complementary assets, businesses, technologies or products with the goal of growing our business, and the integration of any such acquisitions including Evolocity Financial Group; (4) any material reduction in our interest rate spread and our ability to successfully mitigate this risk through interest rate hedging or raising interest rates or other means; (5) worsening economic conditions that may result in decreased demand for our loans or services and increase our customers’ default rates; (6) supply and demand driven changes in credit and increases in the availability of capital for our competitors that negatively impacts our loan pricing; (7) our ability to accurately assess creditworthiness and forecast and reserve for loan losses; (8) our ability to prevent or discover security breaches, disruption in service and comparable events that could compromise confidential information held in our data systems or adversely impact our ability to service our loans; (9) incorrect or fraudulent information provided to us by customers causing us to misjudge their qualifications to receive a loan; (10) the effectiveness of our efforts to identify, manage and mitigate our credit, market, liquidity, operational and other risks associated with our business and strategic objectives; (11) our ability to continue to innovate or respond to evolving technological changes and protect our intellectual property; (12) our reputation and possible adverse publicity about us or our industry; (13) failure of operating controls, including customer or partner experience degradation, and related legal expenses, increased regulatory cost, significant fraud losses and vendor risk; (14) changes in federal or state laws or regulations, or judicial decisions involving licensing or supervision of commercial lenders, interest rate limitations, the enforceability of choice of law provisions in loan agreements, the validity of bank sponsor partnerships, the use of brokers or other significant changes; (15) risks associated with pursuing a bank charter, either de novo or in a transaction, and risks associated with either failing to obtain or obtaining a bank charter; and other risks, including those described in Part I - Item 1A. Risk Factors in our Annual Report on Form 10-K for the year ended December 31, 2018, Part II - Item 1A. Risk Factors in this report and other documents that we file with the Securities and Exchange Commission, or SEC, from time to time which are or will be available on the SEC website at www.sec.gov.
Except as required by law, we undertake no duty to update any forward-looking statements. Readers are also urged to carefully review and consider all of the information in this report, as well as the other documents we make available through the SEC’s website.
In this report, when we use the terms “OnDeck,” the “Company,” “we,” “us” or “our,” we are referring to On Deck Capital, Inc. and its consolidated subsidiaries, and when we use the term "ODX" we are referring to our wholly-owned subsidiary ODX, LLC, in each case unless the context requires otherwise.
OnDeck, the OnDeck logo, OnDeck Score, OnDeck Marketplace, ODX and other trademarks or service marks of OnDeck appearing in this report are the property of OnDeck. Trade names, trademarks and service marks of other companies appearing in this report are the property of their respective holders, including FICO®, a registered trademark of Fair Issac Corporation and Chase Business Quick Capital®, a registered trademark of JPMorgan Chase Bank, National Association. We have generally omitted the ® and TM designations, as applicable, for the trademarks used in this report.
21
Overview
We are a leading online small business lender. We make it efficient and convenient for small businesses to access financing. Enabled by our proprietary technology and analytics, we aggregate and analyze thousands of data points from dynamic, disparate data sources to assess the creditworthiness of small businesses rapidly and accurately. Small businesses can apply for financing on our website in minutes and, using our loan decision process, including our proprietary OnDeck Score®, we can make a funding decision immediately and, if approved, fund as fast as 24 hours. We have originated more than $12 billion of loans since we made our first loan in 2007.
We have offered term loans since we made our first loan in 2007, lines of credit since 2013 and this year have begun offering equipment finance loans and, in Canada, merchant cash advances through Evolocity Financial Group with whom we combined operations on April 1, 2019. Our term loans range from $5,000 to $500,000, have maturities of 3 to 36 months and feature fixed dollar repayments. Our lines of credit range from $6,000 to $100,000, and are generally repayable within 6 or 12 months of the date of the most recent draw. We are generally targeting equipment finance loans from $5,000 to $150,000, with maturities of 2 to 5 years as we develop this offering, although we may offer larger loans in cases we deem appropriate. Qualified customers may have multiple financings with us concurrently, which we believe provides opportunities for repeat business, as well as increased value to our customers.
We originate loans throughout the United States, Canada and Australia, although, to date, the majority of our revenue has been generated in the United States. These loans are originated through our direct marketing channel, including direct mail, our outbound sales team, our social media and other online marketing channels; referrals from our strategic partner channel, including small business-focused service providers, payment processors, and other financial institutions; and through independent funding advisor program partners, or FAPs, who advise small businesses on available funding options.
We generate the majority of our revenue through interest income and fees earned on the loans we make to our customers. We earn interest on the balance outstanding and lines of credit are subject to a monthly fee unless the customer makes a qualifying minimum draw, in which case the fee is waived for the first six months. The balance of our other revenue primarily comes from our servicing and other fee income, most of which consists of marketing fees from our issuing bank partner, fees generated by ODX, and monthly fees earned from lines of credit.
We rely on a diversified set of funding sources for the loans we make to our customers. Our primary source of this financing has historically been debt facilities with various financial institutions and securitizations. We have also used proceeds from operating cash flow to fund loans in the past and continue to finance a portion of our outstanding loans with these funds. As of June 30, 2019, we had $848.8 million of debt principal outstanding and $1.2 billion total borrowing capacity.
Recent Developments
On April 1, 2019, we combined our Canadian operations with Evolocity Financial Group, or Evolocity, a Montreal-based online small business lender. The purpose of the transaction was to accelerate the growth of our Canadian operations and to enable us to provide a broader range of financing options to Canadian small businesses nationwide. In the transaction, Evolocity contributed its business to a holding company, and we contributed our Canadian business plus cash to that holding company such that we own a 58.5% majority interest in the holding company. The remainder is owned by former Evolocity stockholders. The financial position and results of operations of Evolocity as of and for the three months ended June 30, 2019 are included in our consolidated financial statements and other financial data contained within this quarterly report on Form 10-Q.
On July 29, 2019 we made several important announcments. We announced that our Board of Directors authorized the repurchase of up to $50 million of common stock with the shares to be retained in Treasury and available for possible reissuance. Any share repurchases under the program will be made from time to time in the open market, in privately negotiated transactions or otherwise. The timing and amount of any share repurchases will be subject to market conditions and other factors as we may determine. The repurchase authorization expires August 31, 2020, however, we may suspend, modify or discontinue the program at any time in our discretion without prior notice.
We also announced that JPMorgan Chase Bank, National Association, informed us that effective August 3, 2019, they no longer intend to originate new small business loans through our platform. We will continue to service the loans they previously originated through our platform and be entitled to receive related servicing revenue for up to two years. We recorded a charge of approximately $0.9 million during the three months ended June 30, 2019 related to the impairment of certain capitalized software built for and dedicated to their originations.
Additionally, we announced that we decided to pursue obtaining a bank charter, either de novo or through a transaction.
22
Key Financial and Operating Metrics
We regularly monitor a number of metrics in order to measure our current performance and project our future performance. These metrics aid us in developing and refining our growth strategies and making strategic decisions.
As of or for the Three Months Ended June 30, | As of or for the Six Months Ended June 30, | ||||||||||||||
2019 | 2018 | 2019 | 2018 | ||||||||||||
(dollars in thousands) | (dollars in thousands) | ||||||||||||||
Originations | $ | 591,848 | $ | 586,728 | $ | 1,227,354 | $ | 1,177,313 | |||||||
Portfolio Yield (a) | 35.0 | % | 36.1 | % | 35.3 | % | 35.8 | % | |||||||
Cost of Funds Rate | 5.5 | % | 6.6 | % | 5.4 | % | 6.7 | % | |||||||
Net Interest Margin (a) | 29.0 | % | 28.2 | % | 29.3 | % | 28.1 | % | |||||||
Provision Rate | 7.3 | % | 5.7 | % | 7.0 | % | 5.9 | % | |||||||
Reserve Ratio | 12.3 | % | 12.1 | % | 12.3 | % | 12.1 | % | |||||||
15+ Day Delinquency Ratio | 8.5 | % | 6.8 | % | 8.5 | % | 6.8 | % | |||||||
Net Charge-off Rate | 15.1 | % | 11.2 | % | 13.6 | % | 11.1 | % | |||||||
Efficiency Ratio (a) | 47.1 | % | 47.5 | % | 45.5 | % | 48.4 | % | |||||||
Adjusted Efficiency Ratio* (a) | 44.2 | % | 43.1 | % | 42.6 | % | 41.7 | % | |||||||
Return on Assets (a) | 1.4 | % | 2.2 | % | 1.6 | % | 0.7 | % | |||||||
Adjusted Return On Assets* (a) | 2.2 | % | 3.7 | % | 2.5 | % | 3.1 | % | |||||||
Return on Equity (a) | 5.5 | % | 8.4 | % | 6.5 | % | 2.7 | % | |||||||
Adjusted Return On Equity* (a) | 8.8 | % | 14.7 | % | 9.8 | % | 12.1 | % | |||||||
(a) The prior period metrics have been updated to reflect the impact of the revision. We believe the impact of the revision to each affected KPI is not meaningful with no impact being greater than 20 basis points. See Note 1 of Notes to Unaudited Condensed Consolidated Financial Statements.
*Non-GAAP measure. Refer to "Non-GAAP Financial Measures" below for an explanation and reconciliation to GAAP.
Originations
Originations represent the total principal amount of Loans made during the period plus the total amount advanced on other finance receivables. Many of our repeat term loan customers renew their term loans before their existing term loan is fully repaid. In accordance with industry practice, originations of such repeat term loans are presented as the full renewal loan principal, rather than the net funded amount, which would be the renewal term loan’s principal net of the Unpaid Principal Balance on the existing term loan. Loans referred to, and funded by, our issuing bank partner and later purchased by us are included as part of our originations.
Unpaid Principal Balance represents the total amount of principal outstanding on Loans held for investment, plus outstanding advances relating to other finance receivables and the amortized cost of loans purchased from other than our issuing bank partner at the end of the period. It excludes net deferred origination costs, allowance for credit losses and any loans sold or held for sale at the end of the period.
Portfolio Yield
Portfolio Yield is the rate of return we achieve on Loans and finance receivables outstanding during a period. It is calculated as annualized Interest and finance income on Loans and finance receivables including amortization of net deferred origination costs divided by average loans and finance receivables. Annualization is based on 365 days per year and is calendar day-adjusted. Loans and finance receivables represents the sum of term loans, lines of credit, equipment finance loans and finance receivables. Portfolio Yield replaces our previous metric, Loan Yield in order to include other finance receivables.
Net deferred origination costs in Loans and finance receivables held for investment and loans held for sale consist of deferred origination fees and costs. Deferred origination fees include fees paid up front to us by customers when Loans and finance receivables are originated and decrease the carrying value of Loans and finance receivables, thereby increasing Portfolio Yield. Deferred origination costs are limited to costs directly attributable to originating loans and finance receivables such as commissions,
23
vendor costs and personnel costs directly related to the time spent by the personnel performing activities related to originations and increase the carrying value of loans and finance receivables, thereby decreasing Portfolio Yield.
Recent pricing trends are discussed under the subheading “Key Factors Affecting Our Performance - Pricing.”
Cost of Funds Rate
Cost of Funds Rate is calculated as interest expense divided by average debt outstanding for the period. For periods of less than one year, the metric is annualized based on four quarters per year and is not business day or calendar day-adjusted.
Net Interest Margin
Net Interest Margin is calculated as annualized net interest and finance income divided by average Interest Earning Assets. Net interest and finance income represents Interest and finance receivable income less Interest expense during the period. Annualization is based on 365 days per year and is calendar day-adjusted. Interest and finance receivable income is net of fees on loans held for investment and loans held for sale. Interest expense is the interest expense, fees, and amortization of deferred debt issuance costs we incur in connection with our debt facilities. Interest Earning Assets represents the sum of Loans and finance receivables plus Cash and cash equivalents plus Restricted cash.
Reserve Ratio
Reserve Ratio is our allowance for credit losses at the end of the period divided by the Unpaid Principal Balance at the end of the period.
Provision Rate
Provision Rate equals the provision for credit losses for the period divided by originations for the period. Because we reserve for probable credit losses inherent in the portfolio upon origination, this rate is significantly impacted by the expectation of credit losses for the period’s originations volume. This rate is also impacted by changes in loss expectations for loans and finance receivables originated prior to the commencement of the period. All other things equal, an increased volume of loan rollovers and line of credit repayments and re-borrowings in a period will reduce the Provision Rate.
The Provision Rate is not directly comparable to the net cumulative lifetime charge-off ratio because (i) the Provision Rate reflects estimated losses at the time of origination while the net cumulative lifetime charge-off ratio reflects actual charge-offs, (ii) the Provision Rate includes provisions for losses on Loans and finance receivables while the net cumulative lifetime charge-off ratio reflects only charge-offs related to term loans and (iii) the Provision Rate for a period reflects the provision for losses related to all loans and finance receivables held for investment while the net cumulative lifetime charge-off ratio reflects lifetime charge-offs of term loans related to a particular cohort of term loans.
15+ Day Delinquency Ratio
15+ Day Delinquency Ratio equals the aggregate Unpaid Principal Balance for our Loans that are 15 or more calendar days contractually passed due and for our finance receivables that are 15 or more payments behind schedule as a percentage of the Unpaid Principal Balance at the end of the period. The Unpaid Principal Balance for our loans and finance receivables that are 15 or more calendar days or payments past due includes Loans and finance receivables that are paying and non-paying. Because term and line of credit loans require daily and weekly repayments, excluding weekends and holidays, they may be deemed delinquent more quickly than loans from traditional lenders that require only monthly payments. 15+ Day Delinquency Ratio is not annualized, but reflects balances at the end of the period.
Net Charge-off Rate
Net Charge-off Rate is calculated as our annualized net charge-offs for the period divided by the average Unpaid Principal Balance outstanding during the period. Net charge-offs are charged-off loans and finance receivables in the period, net of recoveries of prior charged-off loans and finance receivables in the period. For periods of less than one year, the metric is annualized based on four quarters per year and is not business day or calendar day-adjusted.
Efficiency Ratio
Efficiency Ratio is a measure of operating efficiency and is calculated as Total operating expense for the period divided by Gross revenue for the period.
Adjusted Efficiency Ratio
Adjusted Efficiency Ratio is non-GAAP measure calculated as total operating expense divided by gross revenue for the period, adjusted to exclude (a) stock-based compensation expense and (b) items management deems to be non-representative of operating results or trends, all as shown in the non-GAAP reconciliation presentation of this metric. We believe Adjusted Efficiency Ratio is useful because it provides investors and others with a supplemental operating efficiency metric to present our operating
24
efficiency across multiple periods without the effects of stock-based compensation, which is a non-cash expense based on equity grants made to participants in our equity plans at specified prices and times but which does not necessarily reflect how our business is performing, and items which may only affect our operating results periodically. Our use of Adjusted Efficiency Ratio has limitations as an analytical tool and you should not consider it in isolation, as a substitute for or superior to our Efficiency Ratio, which is the most comparable GAAP metric. See Item 2. Management’s Discussion and Analysis of Financial Condition and Results of Operations—Non-GAAP Financial Measures for a discussion and reconciliation.
Return on Assets
Return on Assets is calculated as annualized net income (loss) attributable to On Deck Capital, Inc. common stockholders for the period divided by average total assets for the period. For periods of less than one year, the metric is annualized based on four quarters per year and is not business day or calendar day-adjusted.
Adjusted Return on Assets
Adjusted Return on Assets is a non-GAAP measure calculated as Adjusted Net Income (Loss) for the period divided by average total assets for the period. For periods of less than one year, the metric is annualized based on four quarters per year and is not business day or calendar day-adjusted. We believe Adjusted Return on Assets is useful because it provides investors and others with a supplemental metric to assess our performance across multiple periods without the effects of stock-based compensation, which is a non-cash expense based on equity grants made to participants in our equity plans at specified prices and times but which does not necessarily reflect how our business is performing, and items which may only affect our operating results periodically, all as shown in the non-GAAP reconciliation presentation of this metric. Our use of Adjusted Return on Assets has limitations as an analytical tool and you should not consider it in isolation, as a substitute for or superior to Return on Assets, which is the most comparable GAAP metric. See Item 2. Management’s Discussion and Analysis of Financial Condition and Results of Operations—Non-GAAP Financial Measures for a discussion and reconciliation.
Return on Equity
Return on Equity is calculated as annualized net income (loss) attributable to On Deck Capital, Inc. common stockholders for the period divided by average total On Deck Capital, Inc. stockholders’ equity for the period. For periods of less than one year, the metric is annualized based on four quarters per year and is not business day or calendar day-adjusted.
Adjusted Return on Equity
Adjusted Return on Equity is a non-GAAP measure calculated as Adjusted Net Income (Loss) attributable to On Deck Capital, Inc. common stockholders for the period divided by average total On Deck Capital, Inc. stockholders’ equity for the period. For periods of less than one year, the metric is annualized based on four quarters per year and is not business day or calendar day-adjusted. We believe Adjusted Return on Equity is useful because it provides investors with a supplemental metric to assess our performance across multiple periods without the effects of stock-based compensation, which is a non-cash expense based on equity grants made to participants in our equity plans at specified prices and times but which does not necessarily reflect how our business is performing, and items which may only affect our operating results periodically, all as shown in the non-GAAP reconciliation presentation of this metric. Our use of Adjusted Return on Equity has limitations as an analytical tool and you should not consider it in isolation, as a substitute or superior to Return on Equity, which is the most comparable GAAP metric. See Item 2. Management’s Discussion and Analysis of Financial Condition and Results of Operations—Non-GAAP Financial Measures for a discussion and reconciliation of Adjusted Net Income (Loss) to net income (loss).
25
On Deck Capital, Inc. and Subsidiaries
Consolidated Average Balance Sheets
(in thousands)
Three Months Ended June 30, | Six Months Ended June 30, | ||||||||||||||
2019 | 2018 | 2019 | 2018 | ||||||||||||
Assets | |||||||||||||||
Cash and cash equivalents | $ | 51,530 | $ | 55,516 | $ | 48,356 | $ | 50,128 | |||||||
Restricted cash | 45,677 | 54,859 | 47,258 | 55,251 | |||||||||||
Loans and finance receivables | 1,206,503 | 1,025,337 | 1,205,250 | 1,003,845 | |||||||||||
Less: Allowance for credit losses | (146,612 | ) | (121,899 | ) | (146,002 | ) | (118,290 | ) | |||||||
Loans and finance receivables held for investment, net | 1,059,891 | 903,438 | 1,059,248 | 885,555 | |||||||||||
Property, equipment and software, net | 17,413 | 17,182 | 17,064 | 19,248 | |||||||||||
Other assets | 58,022 | 15,783 | 48,404 | 14,773 | |||||||||||
Total assets | $ | 1,232,533 | $ | 1,046,778 | $ | 1,220,330 | $ | 1,024,955 | |||||||
Liabilities, mezzanine equity and stockholders' equity | |||||||||||||||
Liabilities: | |||||||||||||||
Accounts payable | $ | 5,120 | $ | 3,627 | $ | 5,121 | $ | 3,269 | |||||||
Interest payable | 2,812 | 2,519 | 2,718 | 2,407 | |||||||||||
Debt | 834,582 | 737,099 | 835,926 | 717,662 | |||||||||||
Accrued expenses and other liabilities | 63,690 | 31,400 | 59,792 | 32,257 | |||||||||||
Total liabilities | 906,204 | 774,645 | 903,557 | 755,595 | |||||||||||
Mezzanine equity: | |||||||||||||||
Redeemable noncontrolling interest (1) | 11,634 | — | 6,647 | — | |||||||||||
Stockholders’ equity: | |||||||||||||||
Total On Deck Capital, Inc. stockholders' equity | 310,858 | 266,711 | 305,990 | 264,585 | |||||||||||
Noncontrolling interest | 3,837 | 5,422 | 4,136 | 4,775 | |||||||||||
Total stockholders' equity | 314,695 | 272,133 | 310,126 | 269,360 | |||||||||||
Total liabilities, mezzanine equity and stockholders' equity | $ | 1,232,533 | $ | 1,046,778 | $ | 1,220,330 | $ | 1,024,955 | |||||||
Memo: | |||||||||||||||
Unpaid Principal Balance | $ | 1,183,056 | $ | 1,006,133 | $ | 1,180,831 | $ | 985,321 | |||||||
Interest Earning Assets | $ | 1,303,709 | $ | 1,135,713 | $ | 1,300,864 | $ | 1,109,224 | |||||||
Loans and Finance Receivables | $ | 1,206,503 | $ | 1,025,337 | $ | 1,205,250 | $ | 1,003,845 | |||||||
(1) The six months ended balance only includes a balance for three months related to the Evolocity business combination which occurred on April 1, 2019.
Average Balance Sheet line items for the period represent the average of the balance at the beginning of the first month of the period and the end of each month in the period.
Non-GAAP Financial Measures
We believe that the non-GAAP metrics can provide useful supplemental measures for period-to-period comparisons of our core business and useful supplemental information to investors and others in understanding and evaluating our operating results.
26
However, non-GAAP metrics are not calculated in accordance with GAAP, and should not be considered an alternative to any measures of financial performance calculated and presented in accordance with GAAP. Other companies may calculate these non-GAAP metrics differently than we do. The reconciliations below reconcile each of our non-GAAP metrics to their most comparable respective GAAP metric.
Adjusted Net Income (Loss) and Adjusted Net Income (Loss) per Share
Adjusted Net Income (Loss) represents net income (loss) attributable to OnDeck adjusted to exclude the items shown in the table below. Stock-based compensation includes employee compensation as well as compensation to third-party service providers. Adjusted Net Income (Loss) per Share is calculated by dividing Adjusted Net Income (Loss) by the weighted average common shares outstanding during the period.
Our use of Adjusted Net Income (Loss) has limitations as an analytical tool, and you should not consider it in isolation or as a substitute for analysis of our results as reported under GAAP. Some of these limitations are:
• | Adjusted Net Income (Loss) does not reflect the potentially dilutive impact of stock-based compensation; and |
• | Adjusted Net Income (Loss) excludes charges we are required to incur in connection with real estate dispositions, severance obligations, debt extinguishment costs and sales tax refunds. |
The following tables present reconciliations of net income (loss) to Adjusted Net Income (Loss) and net income (loss) per share to Adjusted Net Income (Loss) per Share for each of the periods indicated:
Three Months Ended June 30, | Six Months Ended June 30, | ||||||||||||||
2019 | 2018 | 2019 | 2018 | ||||||||||||
(in thousands, except shares and per share data) | (in thousands, except shares and per share data) | ||||||||||||||
Reconciliation of Net Income (Loss) Attributable to OnDeck to Adjusted Net Income (Loss) | |||||||||||||||
Net income (loss) attributable to On Deck Capital, Inc. common stockholders | $ | 4,295 | $ | 5,628 | $ | 9,961 | $ | 3,571 | |||||||
Adjustments (after tax): | |||||||||||||||
Stock-based compensation expense | 2,581 | 2,794 | 5,017 | 6,004 | |||||||||||
Real estate disposition charges | — | — | — | 4,187 | |||||||||||
Severance and executive transition expenses | — | — | — | 911 | |||||||||||
Debt extinguishment costs | — | 1,384 | — | 1,384 | |||||||||||
Adjusted Net Income (Loss) | $ | 6,876 | $ | 9,806 | $ | 14,978 | $ | 16,057 | |||||||
Adjusted Net Income (Loss) per share: | |||||||||||||||
Basic | $ | 0.09 | $ | 0.13 | $ | 0.20 | $ | 0.22 | |||||||
Diluted | $ | 0.09 | $ | 0.13 | $ | 0.19 | $ | 0.21 | |||||||
Weighted-average common shares outstanding: | |||||||||||||||
Basic | 76,137,751 | 74,385,446 | 75,840,604 | 74,182,929 | |||||||||||
Diluted | 78,901,601 | 78,288,267 | 79,013,757 | 77,786,748 | |||||||||||
Below are reconciliations of the Adjusted Net income (loss) per basic and diluted share to the most directly comparable measures calculated in accordance with GAAP.
27
Three Months Ended June 30, | Six Months Ended June 30, | ||||||||||||||
2019 | 2018 | 2019 | 2018 | ||||||||||||
(per share) | (per share) | ||||||||||||||
Reconciliation of Net Income (Loss) per Basic Share to Adjusted Net Income (Loss) per Basic Share | |||||||||||||||
Net income (loss) per basic share attributable to On Deck Capital, Inc. common stockholders | $ | 0.06 | $ | 0.08 | $ | 0.13 | $ | 0.05 | |||||||
Add / (Subtract): | |||||||||||||||
Stock-based compensation expense | 0.03 | 0.04 | 0.07 | 0.08 | |||||||||||
Real estate disposition charges | — | — | — | 0.06 | |||||||||||
Severance and executive transition expenses | — | — | — | 0.01 | |||||||||||
Debt extinguishment costs | — | 0.01 | — | 0.02 | |||||||||||
Adjusted Net Income (Loss) per Basic Share | $ | 0.09 | $ | 0.13 | $ | 0.20 | $ | 0.22 | |||||||
Three Months Ended June 30, | Six Months Ended June 30, | ||||||||||||||
2019 | 2018 | 2019 | 2018 | ||||||||||||
(per share) | (per share) | ||||||||||||||
Reconciliation of Net Income (Loss) per Diluted Share to Adjusted Net Income (Loss) per Diluted Share | |||||||||||||||
Net income (loss) per diluted share attributable to On Deck Capital, Inc. common stockholders | $ | 0.05 | $ | 0.07 | $ | 0.13 | $ | 0.05 | |||||||
Add / (Subtract): | |||||||||||||||
Stock-based compensation expense | 0.04 | 0.04 | 0.06 | 0.08 | |||||||||||
Real estate disposition charges | — | — | — | 0.05 | |||||||||||
Severance and executive transition expenses | — | — | — | 0.01 | |||||||||||
Debt extinguishment costs | — | 0.02 | — | 0.02 | |||||||||||
Adjusted Net Income (Loss) per Diluted Share | $ | 0.09 | $ | 0.13 | $ | 0.19 | $ | 0.21 | |||||||
28
Adjusted Efficiency Ratio
Adjusted Efficiency Ratio is non-GAAP measure calculated as total operating expense divided by gross revenue for the period, adjusted to exclude (a) stock-based compensation expense and (b) items management deems to be non-representative of operating results or trends.
Three Months Ended June 30, | Six Months Ended June 30, | ||||||||||||||
2019 | 2018 | 2019 | 2018 | ||||||||||||
(in thousands) | (in thousands) | ||||||||||||||
Reconciliation of Efficiency Ratio to Adjusted Efficiency Ratio | |||||||||||||||
Total operating expense | $ | 51,950 | $ | 45,306 | $ | 100,234 | $ | 89,857 | |||||||
Gross revenue | $ | 110,246 | $ | 95,456 | $ | 220,221 | $ | 185,596 | |||||||
Efficiency Ratio | 47.1 | % | 47.5 | % | 45.5 | % | 48.4 | % | |||||||
Adjustments (pre-tax): | |||||||||||||||
Stock-based compensation expense | $ | 3,249 | $ | 2,794 | $ | 6,331 | $ | 6,004 | |||||||
Real estate disposition charges | — | — | — | 4,187 | |||||||||||
Severance and executive transition expenses | — | — | — | 911 | |||||||||||
Debt extinguishment costs | — | 1,384 | — | 1,384 | |||||||||||
Operating expenses less noteworthy items | $ | 48,701 | $ | 41,128 | $ | 93,903 | $ | 77,371 | |||||||
Gross revenue | $ | 110,246 | $ | 95,456 | $ | 220,221 | $ | 185,596 | |||||||
Adjusted Efficiency Ratio | 44.2 | % | 43.1 | % | 42.6 | % | 41.7 | % | |||||||
Adjusted Return on Assets
Adjusted Return on Assets represents net income (loss) attributable to OnDeck adjusted to exclude the items shown in the table below divided by average total assets.
Three Months Ended June 30, | Six Months Ended June 30, | ||||||||||||||
2019 | 2018 | 2019 | 2018 | ||||||||||||
(in thousands) | (in thousands) | ||||||||||||||
Reconciliation of Return on Assets to Adjusted Return on Assets | |||||||||||||||
Net income (loss) attributable to On Deck Capital, Inc. common stockholders | $ | 4,295 | $ | 5,628 | $ | 9,961 | $ | 3,571 | |||||||
Average total assets | $1,232,533 | $1,046,778 | $1,220,330 | $1,024,955 | |||||||||||
Return on Assets | 1.4 | % | 2.2 | % | 1.6 | % | 0.7 | % | |||||||
Adjustments (after tax): | |||||||||||||||
Stock-based compensation expense | $ | 2,581 | $ | 2,794 | $ | 5,017 | $ | 6,004 | |||||||
Real estate disposition charges | — | — | — | 4,187 | |||||||||||
Severance and executive transition expenses | — | — | — | 911 | |||||||||||
Debt extinguishment costs | — | 1,384 | — | 1,384 | |||||||||||
Adjusted Net Income (Loss) | $ | 6,876 | $ | 9,806 | $ | 14,978 | $ | 16,057 | |||||||
Average total assets | $1,232,533 | $1,046,778 | $1,220,330 | $1,024,955 | |||||||||||
Adjusted Return on Assets | 2.2 | % | 3.7 | % | 2.5 | % | 3.1 | % | |||||||
29
Adjusted Return on Equity
Adjusted Return on Equity represents net income (loss) attributable to OnDeck adjusted to exclude the items shown in the table below divided by average total On Deck Capital, Inc. stockholders' equity.
Three Months Ended June 30, | Six Months Ended June 30, | ||||||||||||||
2019 | 2018 | 2019 | 2018 | ||||||||||||
(in thousands) | (in thousands) | ||||||||||||||
Reconciliation of Return on Equity to Adjusted Return on Equity | |||||||||||||||
Net income (loss) attributable to On Deck Capital, Inc. common stockholders | $ | 4,295 | $ | 5,628 | $ | 9,961 | $ | 3,571 | |||||||
Average OnDeck stockholders' equity | $ | 310,858 | $ | 266,711 | $ | 305,990 | $ | 264,585 | |||||||
Return on Equity | 5.5 | % | 8.4 | % | 6.5 | % | 2.7 | % | |||||||
Adjustments (after tax): | |||||||||||||||
Stock-based compensation expense | $ | 2,581 | $ | 2,794 | $ | 5,017 | $ | 6,004 | |||||||
Real estate disposition charges | — | — | — | 4,187 | |||||||||||
Severance and executive transition expenses | — | — | — | 911 | |||||||||||
Debt extinguishment costs | — | 1,384 | — | 1,384 | |||||||||||
Adjusted Net Income (Loss) | $ | 6,876 | $ | 9,806 | $ | 14,978 | $ | 16,057 | |||||||
Average total On Deck Capital, Inc. stockholders' equity | $ | 310,858 | $ | 266,711 | $ | 305,990 | $ | 264,585 | |||||||
Adjusted Return on Equity | 8.8 | % | 14.7 | % | 9.8 | % | 12.1 | % | |||||||
30
Key Factors Affecting Our Performance
2019 Strategic Priorities
Our primary focus remains to prudently grow our business while increasing profitability. The core elements of our growth strategy include:
•Expanding the scale and efficiency of our U.S. lending franchise;
•Investing in growth adjacencies, including ODX, equipment finance and international; and
•Innovating on our core strengths in risk, technology and funding.
We recently announced the expansion of our strategic priorities to include:
•Increasing our capital efficiencies, including a common stock repurchase program of up to $50 million; and
•Actively pursuing a bank charter, either de novo or through a transaction.
We plan to continue to invest significant resources to accomplish these goals. We anticipate that our total operating expense will continue to increase in absolute dollars through 2019 relative to 2018. These investments are intended to contribute to our long-term growth, but they may affect our near-term financial results.
In October 2018, we announced the launch of ODX, a wholly-owned subsidiary that helps banks digitize their small business lending process. ODX offers a combination of software, analytic insights, and professional services that allow banks to bring their small business lending process online. We believe ODX can help banks improve customer experiences, increase portfolio growth, and reduce processing costs. We expect ODX results to reflect a period of net investment as it builds its infrastructure and capabilities to grow existing and develop additional bank relationships.
Originations
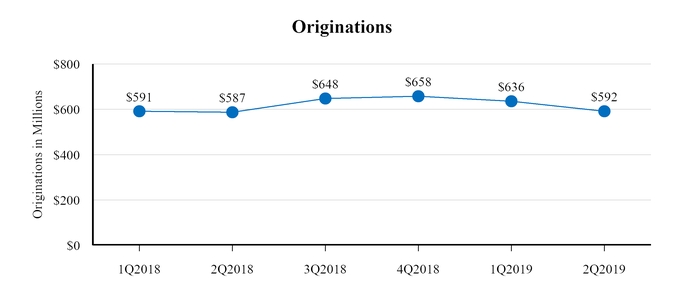
During the three months ended June 30, 2019 and 2018, we originated $592 million and $587 million of loans, respectively. The increase in originations in the three months ended June 30, 2019 relative to the same period in 2018 was partly driven by the addition of new customers, including those originated as part of our business combination with Evolocity, the continued growth of our line of credit originations, and an increase in the volume of renewals from existing customers. The above-mentioned increase of originations was primarily due to growth in our strategic partner channel which was partially offset by a decline in the FAP channel and to a lesser extent, the direct channel. The average term loan size was $52 thousand at June 30, 2019, down from an average term loan size of $55 thousand at June 30, 2018.
Originations decreased approximately $44 million or 6.9% as compared to the first quarter of 2019. Originations decreased across all origination channels; most significantly in our FAP channel followed by our strategic partner channel. We believe the decrease is in large part driven by more intense competition for small business customers. Within the direct channel, we believe competition increased from public companies that have entered or expanded their presence in the small business lending space. Within the strategic partner and FAP channels, competition from smaller, non-public lending companies has intensified.
31
We anticipate that our future growth will continue to depend in part on attracting new customers. As we continue to aggregate data on existing customers and prospective customers, we seek to use that data to optimize our marketing spending and business development efforts to retain existing customers as well as to identify and attract prospective customers. We have historically relied on all three of our channels for customer acquisition. We plan to continue investing in direct marketing, increasing our brand awareness and growing our strategic partnerships.
The following table summarizes the percentage of loans and finance receivables made to all customers originated by our three distribution channels for the periods indicated. From time to time management may proactively adjust our originations channel mix based on market conditions. Our direct channel remains our largest channel as a percentage of origination dollars. Our strategic partner channel increased as a percentage of originations from the second quarter of 2018 compared to the second quarter of 2019, while our direct and FAP channel percentage of originations decreased.
Three Months Ended June 30, | Six Months Ended June 30, | ||||||||||
Percentage of Originations (Dollars) | 2019 | 2018 | 2019 | 2018 | |||||||
Direct | 42 | % | 44 | % | 42 | % | 45 | % | |||
Strategic Partner | 32 | % | 27 | % | 31 | % | 26 | % | |||
Funding Advisor | 26 | % | 29 | % | 27 | % | 29 | % | |||
We originate term loans and lines of credit to customers who are new to OnDeck as well as to existing customers. New originations are defined as new term loan originations plus all line of credit draws in the period, including subsequent draws on existing lines of credit. Renewal originations include term loans only. We believe our ability to increase adoption of our loans within our existing customer base will be important to our future growth. A component of our future growth will include increasing the length of our customer life cycle by expanding our loan offerings and features. In the three months ended June 30, 2019 and 2018 originations from our repeat customers were 53% and 50% respectively, of total originations to all customers. We believe our significant number of repeat customers is primarily due to our high levels of customer service and continued improvement in our loan features and services. Repeat customers generally show improvements in several key metrics. We believe the decrease in volume from new customers is indicative of the increased competition for new customers. From our 2016 customer cohort, customers who took at least three loans grew their revenue and bank balance, respectively, on average by 35% and 40% from their initial loan to their third loan. Similarly, from our 2017 customer cohort, customers who took at least three loans grew their revenue and bank balance, respectively, on average by 30% and 41%. In the six months ended June 30, 2019, 30% of our origination volume from repeat customers was due to unpaid principal balance rolled from existing loans directly into such repeat originations. In order for a current customer to qualify for a renewal term loan while a term loan payment obligation remains outstanding, the customer must pass the following standards:
• | the business must be approximately 50% paid down on its existing loan; |
• | the business must be current on its outstanding OnDeck loan with no material delinquency history; and |
• | the business must be fully re-underwritten and determined to be of adequate credit quality. |
The extent to which we generate repeat business from our customers will be an important factor in our continued revenue growth and our visibility into future revenue. In conjunction with repeat borrowing activity, many of our customers also tend to increase their subsequent loan size compared to their initial loan size.
The following table summarizes the percentage of loans originated by new and repeat customers. Loans from cross-selling efforts are classified in the table as repeat loans.
Three Months Ended June 30, | Six Months Ended June 30, | ||||||||||
Percentage of Originations (Dollars) | 2019 | 2018 | 2019 | 2018 | |||||||
New | 47 | % | 50 | % | 48 | % | 49 | % | |||
Repeat | 53 | % | 50 | % | 52 | % | 51 | % | |||
32
Loans
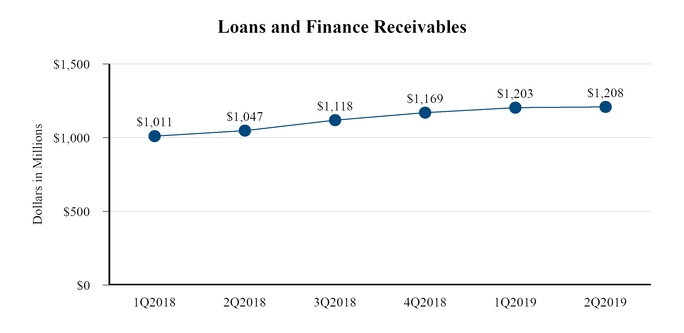
Loans and finance receivables held for investment consist of term loans, lines of credit, finance receivables and secured equipment finance loans that require daily, weekly or monthly repayments. We have both the ability and intent to hold these loans to maturity. Loans and finance receivables held for investment are carried at amortized cost. The amortized cost of a loan and finance receivable is the unpaid principal balance plus net deferred origination costs. Net deferred origination costs are comprised of certain direct origination costs, net of all loan origination fees received. Loan and finance receivable origination fees include fees charged to the borrower related to origination that increase the loan yield. Loan origination costs are limited to direct costs attributable to originating a loan, including commissions and personnel costs directly related to the time spent by those individuals performing activities related to origination. Direct origination costs in excess of origination fees received are included in the loan and finance receivable balance and for term loans and finance receivables are amortized over the life of the term loan using the effective interest method, while for lines of credit principal amounts drawn are amortized using the straight line method over an average of 12 months. Loans and finance receivables held for investment increased from $1.0 billion at June 30, 2018 to $1.2 billion at June 30, 2019, reflecting the increase in originations over the period as well as the addition of the portfolio acquired as a result of combining our Canadian operations with Evolocity.
Pricing
Customer pricing is determined primarily based on credit risk assessment generated by our proprietary data and analytics engine and cash flow assessments of the customer's ability to repay the loan. Our decision structure also considers the OnDeck Score, FICO® Score, loan type (term loan or line of credit), term loan duration, customer type (new or repeat) and origination channel. OnDeck assesses credit risk across several dimensions, including assessing the stability and credit worthiness of both the business and the personal guarantor and of the borrower's industry. Some of the most important factors assessed relate to the borrower's ability to pay, overall levels of indebtedness, cash flow and business outlook, and their personal and commercial credit history. These factors are assessed against certain minimum requirements in our underwriting standards, as well as through multivariate regressions and statistical models. In addition, general market conditions may broadly influence pricing industry-wide. Loans originated through the direct and strategic partner channels are generally priced lower than loans originated through the funding advisor channel due to the commission structure of the FAP program as well as the relative higher risk profile of the borrowers in the FAP channel.
As of the three months ended June 30, 2019, our customers pay between 0.005 and 0.043 cents per month in interest for every dollar they borrow under one of our term loans. Historically, our term loans have been primarily quoted in Cents on Dollar, or COD, which reflects the monthly interest paid by a customer to us per dollar borrowed for a loan. Lines of credit have been historically quoted in APR. As of the three months ended June 30, 2019, the APRs of our term loans outstanding ranged from 12.7% to 99.4% and the APRs of our lines of credit outstanding ranged from 19.9% to 61.9%.
33
We believe that our product pricing has historically fallen between traditional bank loans to small businesses and certain non-bank small business financing alternatives such as merchant cash advances.
For the Year | For the Quarter | |||||||||
2016 | 2017 | 2018 | Q1 2018 | Q2 2018 | Q3 2018 | Q4 2018 | Q1 2019 | Q2 2019 | ||
Weighted Average Term Loan "Cents on Dollar" Borrowed, per Month | 1.82¢ | 1.95¢ | 2.14¢ | 2.08¢ | 2.15¢ | 2.17¢ | 2.17¢ | 2.19¢ | 2.10¢ | |
Weighted Average APR - Term Loans and Lines of Credit | 41.4% | 43.7% | 46.9% | 46.0% | 47.2% | 47.5% | 47.0% | 46.9% | 45.4% | |
The pricing increases in 2017 and 2018 were primarily a reflection of past and expected future increases in the underlying market interest rates that we, like many other lenders in the market, were passing on to our customers. Additionally, in 2017 and 2018 we increased our originations in the funding advisor channel, which typically have higher APRs than the direct and strategic partner channels. The decrease in COD and APR over the first half of 2019 compared to the fourth quarter of 2018 reflected increased competition and the decrease in originations in the funding advisor channel. Additionally, the decrease in COD and APR from the first to second quarter in 2019 was primarily driven by our shift in strategy to offer longer term loans at a lower yields to select customers with higher credit scores.
We consider Portfolio Yield as a key pricing measure. Portfolio Yield is the rate of return we earn on loans and finance receivables outstanding during a period. Our Portfolio Yield differs from APR in that it takes into account deferred origination fees and deferred origination costs. Deferred origination fees include fees paid up front to us by customers when loans are originated and decrease the carrying value of loans, thereby increasing the Portfolio Yield. Deferred origination costs are limited to costs directly attributable to originating loans and finance receivables such as commissions, vendor costs and personnel costs directly related to the time spent performing activities related to originations and increase the carrying value of loans and finance receivables, thereby decreasing the Portfolio Yield. Our decision to hold more delinquent loans on balance sheet for collection rather than sell those loans to third parties reduces Portfolio Yield.
Portfolio Yield | ||||||||||||||||||||
For the Year | For the Quarter | |||||||||||||||||||
2016 | 2017 | 2018 | Q1 2018 | Q2 2018 | Q3 2018 | Q4 2018 | Q1 2019 | Q2 2019 | ||||||||||||
33.1% | 33.7% | 36.2% | 35.5 | % | 36.1 | % | 36.4 | % | 36.5 | % | 35.6% | 35.0% | ||||||||
In addition to individual loan pricing, and the number of days in a period, there are many other factors that can affect Portfolio Yield, including:
• | Channel Mix - In general, loans originated from the strategic partner channel have lower Portfolio Yields than loans from the direct and funding advisor channel. This is primarily due to the strategic partner channel's higher commissions as compared to the direct channel, and lower pricing as compared to the funding advisor channel. |
• | Term Mix - In general, term loans with longer durations have lower annualized interest rates. Despite lower Portfolio Yields, total revenues from customers with longer loan durations are typically higher than the revenue of customers with shorter-term, higher Portfolio Yield loans because total payback is typically higher compared to a shorter length term for the same principal loan amount. Following the introduction of our 24-month and 36-month term loans, the average length of new term loan originations had increased from 10.8 months for the year ended December 31, 2014 to 13.3 months for the year ended December 31, 2016. As part of our 2017 credit tightening, when appropriate, the offered duration of term loans to certain customers was shortened to control duration risk. For the three months ended June 30, 2019, the average length of new term loan originations was 12.3 months which increased from 11.4 months for the three months ended March 31, 2019 and 11.3 months for the three months ended June 30, 2018. The increase in average term length reflects the increased booking rate of longer term loans with larger balances of higher credit quality loans as our credit policy has recently been further optimized for loans with those specific characteristics. |
• | Customer Type Mix - In general, loans originated from repeat customers historically have had lower Portfolio Yields than loans from new customers. This is primarily because repeat customers typically have a higher OnDeck Score and are therefore deemed to be lower risk. In addition, repeat customers are more likely to be approved for longer terms than new customers given their established payment history and lower risk profiles. Finally, origination fees can be reduced or waived for repeat customers, contributing to lower Portfolio Yields. |
34
• | Loan Mix - In general, lines of credit have lower Portfolio Yields than term loans. For the three months ended June 30, 2019, the weighted average line of credit APR was 34.4%, compared to 48.4% for term loans. Draws by line of credit customers increased to 22.8% of total originations for the three months ended June 30, 2019 from 20.7% in three months ended June 30, 2018. |
Interest Expense
We obtain outside financing principally through debt facilities and securitizations with a diverse group of banks, insurance companies and other institutional lenders. Interest expense consist of the interest expense we incur on our debt, certain fees and the amortization of deferred debt issuance costs incurred in connection with obtaining this debt, such as banker fees, origination fees and legal fees and, in applicable periods, certain costs associated with our interest rate hedging activity. Cost of Funds Rate is calculated as interest expense divided by average debt outstanding for the period. Our Cost of Funds Rate decreased to 5.5% for the three months ended June 30, 2019 as compared to 6.6% for the three months ended June 30, 2018. The decrease in our Cost of Funds Rate was driven by the decrease in our weighted average interest rate on debt outstanding. That decrease was attributable to decreases in interest rate spread (the applicable percentage rate above the benchmark interest rate charged by the lender) which was partially offset by an increase in benchmark rates.
Credit Performance
Credit performance refers to how credit losses on a portfolio of loans and finance receivables perform relative to expectations. Generally speaking, perfect credit performance is a loan that is repaid in full and in accordance with the terms of the agreement, meaning that all amounts due were repaid in full and on time. However, no portfolio is without risk and a certain amount of losses are expected. In this respect, credit performance must be assessed relative to pricing and expectations. Because a certain degree of losses are expected, pricing will be determined with the goal of allowing for estimated losses while still generating the desired rate of return after taking into account those estimated losses. When a portfolio has higher than estimated losses, the desired rate of return may not be achieved, and that portfolio would be considered to have underperformed. Conversely, if the portfolio incurred lower than estimated losses, resulting in a higher than expected rate of return, the portfolio would be considered to have overperformed.
We originate and price our loans and finance receivables expecting that we will incur a degree of losses. When we originate our loans and finance receivables, we record a provision for estimated credit losses. As we gather more data as the portfolio performs, we may increase or decrease that reserve as deemed necessary to reflect our latest loss estimate. Some portions of our portfolio may be performing better than expected while other portions may perform below expectations. The net result of the underperforming and overperforming portfolio segments determines if we require an overall increase or decrease to our reserve related to the existing portfolio. A net decrease to the reserve related to the existing portfolio reduces provision expense, while a net increase to the loan reserve increases provision expense.
In accordance with our strategy to expand the range of our loan offerings, over time, we have expanded the offerings of our term loans by making available longer terms and larger amounts. When we begin to offer a new type of loan, we typically extrapolate our existing data to create an initial version of a credit model to permit us to underwrite and price the new type of loan. Thereafter, we begin to collect actual performance data on these new loans which allows us to refine our credit model based on actual data as opposed to extrapolated data. It often takes several quarters after we begin offering a new type of loan for that loan to be originated in sufficient volume to generate a critical mass of performance data. In addition, for loans with longer terms, it takes longer to acquire significant amounts of data because the loans take longer to season.
Each loan cohort is unique. A loan cohort refers to loans originated in the same specified time period. For a variety of reasons, one cohort may exhibit different performance characteristics over time compared to other cohorts at similar months of seasoning.
We evaluate and track portfolio credit performance primarily through four key financial metrics: 15+Day Delinquency Ratio; Net Charge-off Rate; Reserve Ratio; and Provision Rate.
35
Net Charge-off Rate
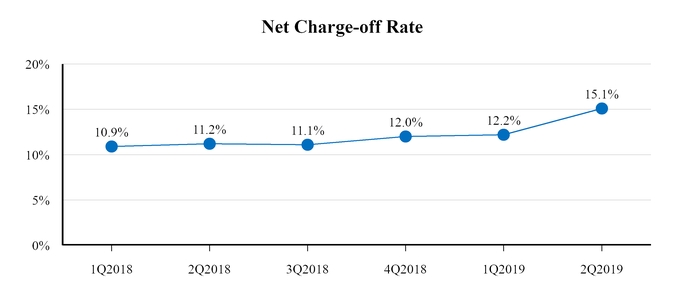
Our Net Charge-off Rate, which is calculated as our annualized net charge-offs for the period divided by the average Unpaid Principal Balance outstanding, increased from 11.2% in three months ended June 30, 2018 to 15.1% in three months ended June 30, 2019, driven by credit expansion, channel mix changes and changes in small business sentiment and behavior. Since 2018, we have held delinquent loans longer as we expanded our pre-charge-off collection efforts to maximize returns. While collections on those more severely delinquent loans have proven to be successful and have increased our recoveries and profitability, some portion of those loans ultimately remain uncollectible. Allowing several quarters to continue collection efforts delayed charge-off of some loans which have now accumulated. This quarter's increase net charge-off rate reflects the increased charge-off rate as some of those accumulated loans are charged-off. In addition, the Net Charge-off Rate in the three months ended March 31, 2018 was unusually low by historical standards reflecting our decision to tighten our credit policies in the first half of 2017.
Historical Charge-Offs
We illustrate below our historical loan losses by providing information regarding our net lifetime charge-off ratios by cohort. Net lifetime charge-offs are the unpaid principal balance charged off less recoveries of loans previously charged off. A given cohort’s net lifetime charge-off ratio is the cohort’s net lifetime charge-offs through June 30, 2019 divided by the cohort’s total original loan volume. Repeat loans in the denominator include the full renewal loan principal, rather than the net funded amount, which is the renewal loan’s principal net of the unpaid principal balance on the existing loan. Loans are typically charged off after 90 days of nonpayment and 30 days of inactivity. The chart immediately below includes all term loan originations, including, if applicable, loans sold through OnDeck Marketplace or held for sale on our balance sheet.
36
Net Charge-off Ratios by Cohort Through June 30, 2019
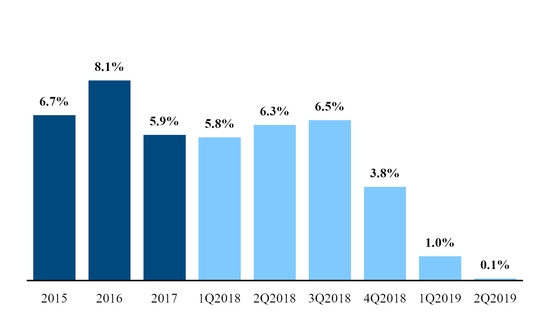
For the Year | For the Quarter | |||||||||
2015 | 2016 | 2017 | Q1 2018 | Q2 2018 | Q3 2018 | Q4 2018 | Q1 2019 | Q2 2019 | ||
Principal Outstanding as of June 30, 2019 by Period of Origination | —% | —% | 0.3% | 1.1% | 3.2% | 10.2% | 26.4% | 56.0% | 86.6% | |
The following chart displays the historical lifetime cumulative net charge-off ratio by cohort for the origination periods shown. The chart reflects all term loan originations, including, if applicable, loans sold through OnDeck Marketplace or held for sale on our balance sheet. The data is shown as a static pool for each cohort, illustrating how the cohort has performed given equivalent months of seasoning.
Given that the originations in the first and second quarter of 2019 cohorts are relatively unseasoned as of June 30, 2019, these cohorts reflect low lifetime charge-off ratios in the total loans chart below. Further, given our loans are typically charged off after 90 days of nonpayment and 30 days of inactivity, all cohorts reflect minimal charge offs for the first three months in the chart below.
37
Net Cumulative Lifetime Charge-off Ratios
All Loans
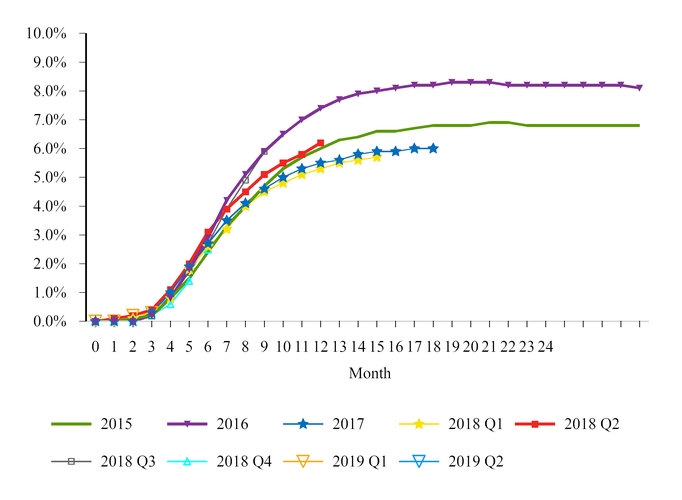
For the Year | For the Quarter | ||||||||||||||||||||||||||||||
Originations | 2015 | 2016 | 2017 | 2018 | Q1 2018 | Q2 2018 | Q3 2018 | Q4 2018 | Q1 2019 | Q2 2019 | |||||||||||||||||||||
All term loans (in millions) | $ | 1,704 | $ | 2,052 | $ | 1,697 | $ | 1,972 | $ | 469 | $ | 465 | $ | 520 | $ | 517 | $ | 486 | $ | 457 | |||||||||||
Weighted average term (months) at origination | 12.4 | 13.2 | 12.1 | 11.8 | 11.8 | 11.8 | 11.9 | 11.8 | 11.7 | 12.2 | |||||||||||||||||||||
Loans we originated in 2016 demonstrated higher than historical net cumulative lifetime charge-off ratios, which were primarily related to lower credit quality loans of longer terms and larger sizes. In response and as part of our focus on achieving profitability, during the first and second quarters of 2017 we broadly tightened our credit policies to eliminate originations of loans with expected negative unit economics and to reduce those with expected marginal unit economics.
By design, the broad credit tightening resulted in a significant decline in originations for the second quarter of 2017 and a significant decline in the net cumulative lifetime charge-off ratios for loans originated in that quarter. Subsequent cohorts have incorporated measured and targeted credit optimization designed to bring our net cumulative charge-off ratios in line with business model objectives. Loans originated after the third quarter of 2018 are not yet seasoned enough for meaningful comparison.
38
15+ Day Delinquency Ratio
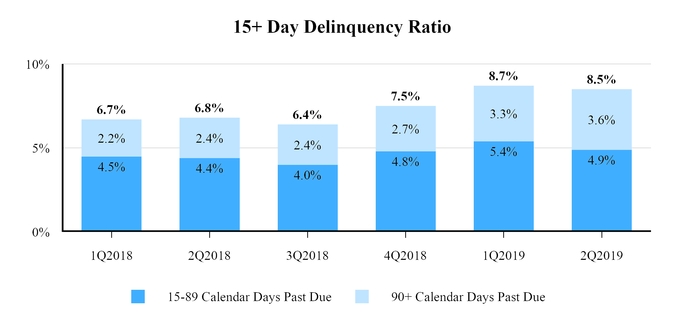
The 15+ Day Delinquency Ratio is the aggregate Unpaid Principal Balance for our portfolio that is 15 or more calendar days past due as of the end of the period as a percentage of the Unpaid Principal Balance.
The 15+ Day Delinquency ratio increased from 6.8% at June 30, 2018 to 8.5% at June 30, 2019 driven by our decision in 2018 to hold and collect delinquent loans longer, credit tests we performed in 2018, and a normalizing credit environment in 2019. The increase in loans 15-89 days past due was primarily driven by the credit testing we performed in 2018, while the increase in loans 90+ days past due primarily reflects the change in our collection strategy.
The decrease in the second quarter of 2019 of the percentage of 90+ days past due loans as compared to the first quarter of 2019 reflects the charge-off of delinquent loans accumulated over the past several quarters as we expanded our internal collection efforts and the increase in delinquencies which resulted from our credit expansion in the third and fourth quarter of 2018. The decrease of the percentage of 15-89 days past due loans over the same period reflects the improved credit performance of our more current cohorts.
39
Reserve Ratio
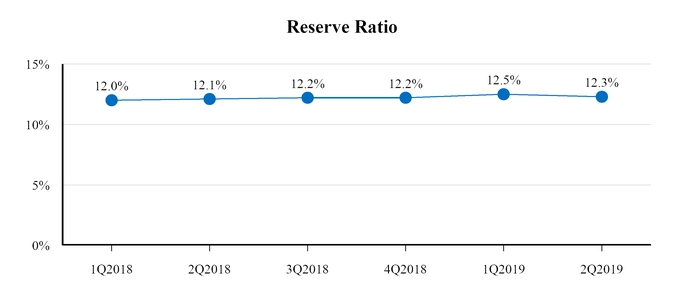
The Reserve Ratio, which is the allowance for credit losses divided by the Unpaid Principal Balance as of a specific date, is a comprehensive measurement of our allowance for credit losses because it presents, as a percentage, the portion of the total Unpaid Principal Balance for which an allowance has been recorded. Our Reserve Ratio increased from 12.1% at June 30, 2018, to 12.3% at June 30, 2019. The increase in the Reserve Ratio reflects higher delinquencies including a greater proportion of late stage delinquencies, ongoing credit testing, and a normalizing credit environment in 2019.
Provision Rate
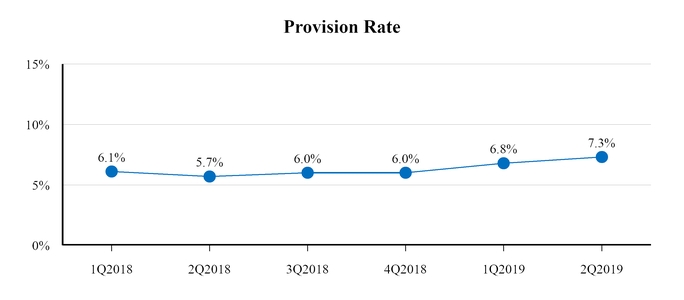
The Provision Rate is the provision for credit losses divided by the new originations volume of loans and finance receivables held for investment. Originations include the full renewal loan principal of repeat loans, rather than the net funded amount.
Our Provision Rate increased in the second quarter of 2019 to 7.3% from 5.7% in the second quarter of 2018. This increase in Provision Rate was primarily driven by the deterioration of loans originated in the second half of 2018, and a normalizing credit environment.
40
Economic Conditions
Changes in the overall economy may impact our business in several ways, including demand for our loans, credit performance, and interest expense.
• | Demand for Our Loans. Generally, we believe a strong economic climate tends to increase demand for our loans as consumer spending increases and small businesses seek to expand and more potential customers may meet our underwriting requirements, although some small businesses may generate enough additional cash flow that they no longer require a loan. In that climate, traditional lenders may also approve loans for a higher percentage of our potential customers. |
• | Credit Performance. In a strong economic climate, our customers may experience improved cash flow and liquidity, which may result in lower loan losses. In a weakening economic climate or recession, the opposite may occur. We factor economic conditions into our loan underwriting analysis and reserves for loan losses, but changes in economic conditions, particularly sudden changes, may affect our actual loan losses. These effects may be partially mitigated by the short-term nature and repayment structure of our loans, which should allow us to react more quickly than if the terms of our loans were longer. |
• | Loan Losses. Our underwriting process is designed to limit our loan losses to levels consistent with our risk tolerance and financial model. Our 2017 loan loss levels were also higher than our financial targets largely because we were taking corrective action throughout the first half of the year to address the higher 2016 loan losses. Our 2018 loan loss levels are consistent with our financial targets. Our overall loan losses are affected by a variety of factors, including external factors such as prevailing economic conditions, general small business sentiment and unusual events such as natural disasters, as well as internal factors such as the accuracy of our loan decisioning, the effectiveness of our underwriting process and the introduction of new loan types or features with which we have less experience to draw upon when forecasting their loss rates. Our loan loss rates may vary in the future. |
• | Interest Expense. Changes in monetary and fiscal policy may affect generally prevailing interest rates. Interest rates may also change for reasons unrelated to economic conditions. To the extent that interest rates rise, our interest expense will increase and the spread between our Portfolio Yield and our Cost of Funds Rate may narrow to the extent we cannot correspondingly increase the interest rates we charge our customers or reduce the credit spreads in our borrowing facilities. |
Customer Acquisition Costs
Our customer acquisition costs, or CACs, differ depending upon the acquisition channel. CACs in our direct channel include the commissions paid to our internal sales force and expenses associated with items such as direct mail, and online marketing activities. CACs in our strategic partner channel and FAP channel include commissions paid. CACs in all channels include new originations. For our United States portfolio, the FAP channel had the highest CAC per unit and our strategic partner channel had the lowest CAC per unit for both the three months ended June 30, 2019 and June 30, 2018.
The total amount of U.S. CACs decreased both in aggregate and for each of the three individual acquisition channels for the three months ended June 30, 2019 as compared to the three months ended June 30, 2018. Our U.S. CACs evaluated as a percentage of originations increased for our direct and FAP channel, and decreased slightly for our strategic partner channel period over period. The decrease in absolute dollars was primarily attributable to a decrease in U.S. CACs in our FAP channel driven by a decrease in external commissions and origination volume.
Increased competition for customer response could require us to incur higher customer acquisition costs and make it more difficult for us to grow our originations in both unit and volume for both new as well as repeat customers.
Components of Our Results of Operations
Revenue
Interest and Finance Income. We generate revenue primarily through interest and origination fees earned on the term loans and lines of credit we originate. Interest income in applicable periods also includes interest income earned on loans held for sale from the time the loan is originated until it is ultimately sold. Interest income also includes miscellaneous interest income such as interest earned on invested cash. We also generate revenue through finance income on our Canadian merchant cash advances.
Our interest and origination fee revenue is amortized over the term of the loan or finance receivable using the effective interest method. Origination fees collected but not yet recognized as revenue are netted with direct origination costs and recorded
41
as a component of loans and finance receivables held for investment or loans held for sale, as appropriate, on our consolidated balance sheets and recognized over the term of the loan or finance receivable. Direct origination costs include costs directly attributable to originating a loan or finance receivable, including commissions, vendor costs and personnel costs directly related to the time spent by those individuals performing activities related to loan origination.
Other Revenue. Other revenue includes fees generated by ODX, marketing fees earned from our issuing bank partner, monthly fees charged to customers for our line of credit, and referral fees from other lenders.
Cost of Revenue
Provision for Credit Losses. Provision for credit losses consists of amounts charged to income during the period to maintain an allowance for credit losses, or ALLL, estimated to be adequate to provide for probable credit losses inherent in our existing loan and finance receivable portfolio. Our ALLL represents our estimate of the credit losses inherent in our portfolio of loans and finance receivables and is based on a variety of factors, including the composition and quality of the portfolio, loan specific information gathered through our collection efforts, delinquency levels, our historical charge-off and loss experience and general economic conditions. In general, we expect our aggregate provision for credit losses to increase in absolute dollars as the amount of term loans and lines of credit we originate and hold for investment increases.
Interest Expense. Interest expense consists of the interest expense we incur on our debt, certain fees and the amortization of deferred debt issuance costs incurred in connection with obtaining this debt, such as banker fees, origination fees and legal fees and, in applicable periods, certain costs associated with our interest rate hedging activity. Our interest expense and Cost of Funds Rate will vary based on a variety of external factors, such as credit market conditions, general interest rate levels and spreads, as well as OnDeck-specific factors, such as origination volume and credit quality. We expect interest expense will increase in absolute dollars as we increase borrowings to fund portfolio growth.
Operating Expense
Operating expense consists of sales and marketing, technology and analytics, processing and servicing, and general and administrative expenses. Salaries and personnel-related costs, including benefits, bonuses, stock-based compensation expense and occupancy, comprise a significant component of each of these expense categories. All operating expense categories also include an allocation of overhead, such as rent and other overhead, which is based on employee headcount. We believe that continuing to invest in our business is essential to growing the business and maintaining our competitive position, and therefore, we expect the absolute dollars of operating expenses to increase.
Sales and Marketing. Sales and marketing expense consists of salaries and personnel-related costs of our sales and marketing and business development employees, as well as direct marketing and advertising costs, online and offline CACs (such as direct mail, paid search and search engine optimization costs), public relations, promotional event programs and sponsorships, corporate communications and allocated overhead.
Technology and Analytics. Technology and analytics expense consists primarily of the salaries and personnel-related costs of our engineering and product employees as well as our credit and analytics employees who develop our proprietary credit-scoring models. Additional expenses include third-party data acquisition expenses, professional services, consulting costs, expenses related to the development of new types of loans and technologies and maintenance of existing technology assets, amortization of capitalized internal-use software costs related to our technology platform and allocated overhead.
Processing and Servicing. Processing and servicing expense consists primarily of salaries and personnel related costs of our credit analysis, underwriting, funding, fraud detection, customer service and collections employees. Additional expenses include vendor costs associated with third-party credit checks, lien filing fees and other costs to evaluate, close and fund loans and overhead costs.
General and Administrative. General and administrative expense consists primarily of salary and personnel-related costs for our executive, finance and accounting, legal and people operations employees. Additional expenses include a provision for the unfunded portion of our lines of credit, consulting and professional fees, insurance, legal, travel, gain or loss on foreign exchange and other corporate expenses. These expenses also include costs associated with compliance with the Sarbanes-Oxley Act and other regulations governing public companies, directors’ and officers’ liability insurance and increased accounting costs.
Provision for Income Taxes
Our provision for income taxes includes tax expense for our global operations, including the tax expense incurred by our non-U.S. entities, and our annual effective tax rate is an estimated, blended rate of all jurisdictions; federal, state and foreign. We expect to incur U.S. income tax expense for the remainder of 2019 and thereafter as we currently estimate that we will be profitable and will fully utilize our net operating losses. We may release portions of our valuation allowance in 2019 and thereafter if our actual or forecasted profitability levels are deemed sufficient to support the realizability of the net deferred tax assets.
42
Through December 31, 2018, we had not been required to pay any material U.S. federal or state income taxes nor any foreign income taxes because of accumulated net operating losses. As of December 31, 2018, we had approximately $3.7 million of federal net operating loss carryforwards and approximately $14.9 million of state net operating loss carryforwards available to reduce future taxable income, unless limited due to historical or future ownership changes. The federal net operating loss carryforwards will begin to expire at various dates beginning in 2028. We expect to use a significant portion of our U.S. net operating losses in 2018 and to fully utilize all remaining net U.S. operating losses in 2019.
Results of Operations
The following table sets forth our consolidated statements of operations data for each of the periods indicated.
Comparison of the three months ended June 30, 2019 and 2018
Three Months Ended June 30, | ||||||||||||||||||||
2019 | 2018 | Period-to-Period Change | ||||||||||||||||||
Amount | Percentage of Gross Revenue | Amount | Percentage of Gross Revenue | Amount | Percentage | |||||||||||||||
(dollars in thousands) | ||||||||||||||||||||
Revenue: | ||||||||||||||||||||
Interest and finance income | $ | 105,641 | 95.8 | % | $ | 92,209 | 96.6 | % | $ | 13,432 | 14.6 | % | ||||||||
Other revenue | 4,605 | 4.2 | 3,247 | 3.4 | 1,358 | 41.8 | ||||||||||||||
Gross revenue | 110,246 | 100.0 | 95,456 | 100.0 | 14,790 | 15.5 | ||||||||||||||
Cost of revenue: | ||||||||||||||||||||
Provision for credit losses | 42,951 | 39.0 | 33,293 | 34.9 | 9,658 | 29.0 | ||||||||||||||
Interest expense | 11,381 | 10.3 | 12,245 | 12.8 | (864 | ) | (7.1 | ) | ||||||||||||
Total cost of revenue | 54,332 | 49.3 | 45,538 | 47.7 | 8,794 | 19.3 | ||||||||||||||
Net revenue | 55,914 | 50.7 | 49,918 | 52.3 | 5,996 | 12.0 | ||||||||||||||
Operating expense: | ||||||||||||||||||||
Sales and marketing | 13,307 | 12.1 | 11,432 | 12.0 | 1,875 | 16.4 | ||||||||||||||
Technology and analytics | 16,681 | 15.1 | 12,799 | 13.4 | 3,882 | 30.3 | ||||||||||||||
Processing and servicing | 5,609 | 5.1 | 5,041 | 5.3 | 568 | 11.3 | ||||||||||||||
General and administrative | 16,353 | 14.8 | 16,034 | 16.8 | 319 | 2.0 | ||||||||||||||
Total operating expense | 51,950 | 47.1 | 45,306 | 47.5 | 6,644 | 14.7 | ||||||||||||||
Income (loss) from operations, before provision for income taxes | 3,964 | 3.6 | 4,612 | 4.8 | (648 | ) | (14.1 | ) | ||||||||||||
Provision for income taxes | 1,796 | 1.6 | — | — | 1,796 | — | ||||||||||||||
Net income (loss) | $ | 2,168 | 2.0 | % | $ | 4,612 | 4.8 | % | $ | (2,444 | ) | (53.0 | )% | |||||||
Net income (loss)
For the three months ended June 30, 2019, net income decreased to $2.2 million from $4.6 million for the three months ended June 30, 2018 while adjusted net income, a non-GAAP measure, decreased to $6.9 million from $9.8 million over the same period. These decreases were primarily attributable to a 19.3% increase in cost of revenue and a 14.7% increase in operating expenses, partially offset by a 15.5% increase in revenue. Basic earnings per share decreased from $0.08 per share to $0.06 per share. Similarly, our Return on Assets decreased to 1.4% from 2.2% and our Return on Equity decreased to 5.5% from 8.4%. Our adjusted Return on Assets, a non-GAAP measure, decreased to 2.2% from 3.7% and our adjusted Return on Equity, a non-GAAP measure, decreased to 8.8% from 14.7%. See Item 2. Management’s Discussion and Analysis of Financial Condition and Results of Operations-Non-GAAP Financial Measures for a discussion and reconciliation of Non-GAAP measures.
Revenue
43
Three Months Ended June 30, | ||||||||||||||||||||
2019 | 2018 | Period-to-Period Change | ||||||||||||||||||
Amount | Percentage of Gross Revenue | Amount | Percentage of Gross Revenue | Amount | Percentage | |||||||||||||||
(dollars in thousands) | ||||||||||||||||||||
Revenue: | ||||||||||||||||||||
Interest and finance income | $ | 105,641 | 95.8 | % | $ | 92,209 | 96.6 | % | $ | 13,432 | 14.6 | % | ||||||||
Other revenue | 4,605 | 4.2 | 3,247 | 3.4 | 1,358 | 41.8 | ||||||||||||||
Gross revenue | $ | 110,246 | 100.0 | % | $ | 95,456 | 100.0 | % | $ | 14,790 | 15.5 | % | ||||||||
Gross revenue increased by $14.8 million, or 15.5%, from $95.5 million to $110.2 million. This growth was in part attributable to a $13.4 million, or 14.6%, increase in interest income, which was primarily driven by a higher portfolio balance as evidenced by an 18% increase in Average Loans and Finance Receivables from $1.0 billion to $1.2 billion.
Other revenue increased by $1.4 million, or 41.8%, primarily attributable to an increase in referral fees from other lenders and ODX revenue, and partially offset by a decrease in marketing fees from our issuing bank partner.
Cost of Revenue
Three Months Ended June 30, | ||||||||||||||||||||
2019 | 2018 | Period-to-Period Change | ||||||||||||||||||
Amount | Percentage of Gross Revenue | Amount | Percentage of Gross Revenue | Amount | Percentage | |||||||||||||||
(dollars in thousands) | ||||||||||||||||||||
Cost of revenue: | ||||||||||||||||||||
Provision for credit losses | $ | 42,951 | 39.0 | % | $ | 33,293 | 34.9 | % | $ | 9,658 | 29.0 | % | ||||||||
Interest expense | 11,381 | 10.3 | 12,245 | 12.8 | (864 | ) | (7.1 | ) | ||||||||||||
Total cost of revenue | $ | 54,332 | 49.3 | % | $ | 45,538 | 47.7 | % | $ | 8,794 | 19.3 | % | ||||||||
Total cost of revenue increased by $8.8 million, or 19.3%, from $45.5 million to $54.3 million. Provision for credit losses increased by $9.7 million, or 29.0%, from $33.3 million to $43.0 million. In accordance with GAAP, we recognize revenue on loans and finance receivables over their term, but provide for probable credit losses on the loans and finance receivables at the time they are originated. We then periodically adjust our estimate of those probable credit losses based on actual performance and changes in loss estimates. Our provision for credit losses as a percentage of originations, or the Provision Rate, increased from 5.7% to 7.3%. The increase in Provision Rate was primarily driven by the deterioration of loans originated in the second half of 2018, and a normalizing credit environment.
Interest expense decreased by $0.9 million, or 7.1%, from $12.2 million to $11.4 million. As a percentage of gross revenue, interest expense decreased from 12.8% to 10.3%. The decrease in interest expense was primarily attributable to decreases in interest rate spread (the applicable percentage rate above the benchmark interest rate charged by the lender) and was partially offset by increases in Average Debt outstanding and benchmark rates. The Average Debt Outstanding during the second quarter of 2019 was $834.6 million, up 13.2%, from $737.1 million during the second quarter of 2018, while our Cost of Funds Rate decreased from 6.6% to 5.5%.
Operating Expense
Total operating expense increased by $6.6 million, or 14.7%, from $45.3 million to $52.0 million. At June 30, 2019, we had 726 employees compared to 587 at December 31, 2018. Approximately half of the headcount increase reflects the additional Evolocity employees, with the majority of the other half attributable to Technology and Analytics employees. We increased our headcount and personnel-related costs across our business in order to support our growth strategy and expect headcount to further increase in the remainder of 2019 reflecting our investment in growth initiatives.
Given our focus on growth and profitability, we evaluate trends in our efficiency ratio as a key measure of our progress. Our efficiency ratio for the quarter ended June 30, 2019 was 47.1% which was an improvement from 47.5% for the quarter ended June 30, 2018. Our Adjusted Efficiency Ratio, a non-GAAP measure, increased from 43.1% for the quarter ended June 30, 2018
44
to 44.2% for the quarter ended June 30, 2019. See Item 2. Management’s Discussion and Analysis of Financial Condition and Results of Operations-Non-GAAP Financial Measures for a discussion and reconciliation of Adjusted Efficiency Ratio.
Sales and Marketing
Three Months Ended June 30, | ||||||||||||||||||||
2019 | 2018 | Period-to-Period Change | ||||||||||||||||||
Amount | Percentage of Gross Revenue | Amount | Percentage of Gross Revenue | Amount | Percentage | |||||||||||||||
(dollars in thousands) | ||||||||||||||||||||
Sales and marketing | $ | 13,307 | 12.1 | % | $ | 11,432 | 12.0 | % | $ | 1,875 | 16.4 | % | ||||||||
Sales and marketing expense increased by $1.9 million, or 16.4%, from $11.4 million to $13.3 million. The increase was primarily attributable to a $1.3 million increase in personnel-related costs due to an increase in head count as well as the additional personnel related to our business combination with Evolocity. For the three months ended June 30, 2019, our direct marketing and other marketing spend increased by $0.4 million. Additionally, the prior period quarter benefited from a $0.2 million credit to occupancy expense related to lease terminations.
Technology and Analytics
Three Months Ended June 30, | ||||||||||||||||||||
2019 | 2018 | Period-to-Period Change | ||||||||||||||||||
Amount | Percentage of Gross Revenue | Amount | Percentage of Gross Revenue | Amount | Percentage | |||||||||||||||
(dollars in thousands) | ||||||||||||||||||||
Technology and analytics | $ | 16,681 | 15.1 | % | $ | 12,799 | 13.4 | % | $ | 3,882 | 30.3 | % | ||||||||
Technology and analytics expense increased by $3.9 million, or 30.3%, from $12.8 million to $16.7 million. The increase was primarily attributable to $2.9 million of additional personnel-related costs as we continue to invest in our strategic initiatives and build our internal capabilities for the future. The increase also included higher software license related costs of $0.5 million and an impairment of our capitalized software assets of $0.9 million, partially offset by a decrease of $0.5 million in technology related consulting expenses.
Processing and Servicing
Three Months Ended June 30, | ||||||||||||||||||||
2019 | 2018 | Period-to-Period Change | ||||||||||||||||||
Amount | Percentage of Gross Revenue | Amount | Percentage of Gross Revenue | Amount | Percentage | |||||||||||||||
(dollars in thousands) | ||||||||||||||||||||
Processing and servicing | $ | 5,609 | 5.1 | % | $ | 5,041 | 5.3 | % | $ | 568 | 11.3 | % | ||||||||
Processing and servicing expense increased by $0.6 million, or 11.3%, from $5.0 million to $5.6 million. The increase was driven by an increase personnel related expenses of $0.1 million and an increase in other processing expenses of $0.4 million.
45
General and Administrative
Three Months Ended June 30, | ||||||||||||||||||||
2019 | 2018 | Period-to-Period Change | ||||||||||||||||||
Amount | Percentage of Gross Revenue | Amount | Percentage of Gross Revenue | Amount | Percentage | |||||||||||||||
(dollars in thousands) | ||||||||||||||||||||
General and administrative | $ | 16,353 | 14.8 | % | $ | 16,034 | 16.8 | % | $ | 319 | 2.0 | % | ||||||||
General and administrative expense increased by $0.3 million, or 2.0%, from $16.0 million to $16.4 million. The increase was primarily attributable to increases in personnel-related costs of $1.6 million due to an increase in headcount as well as the additional personnel related to our business combination with Evolocity partially offset by a decrease in spend on professional fees during the three months ended June 30, 2019. The prior year period included a debt extinguishment charge of $1.4 million with no corresponding charge in the current year period.
Provision for Income Taxes
Three Months Ended June 30, | ||||||||||||||||||||
2019 | 2018 | Period-to-Period Change | ||||||||||||||||||
Amount | Percentage of Gross Revenue | Amount | Percentage of Gross Revenue | Amount | Percentage | |||||||||||||||
(dollars in thousands) | ||||||||||||||||||||
Provision for Income Taxes | $ | 1,796 | 1.6 | % | $ | — | — | % | $ | 1,796 | — | % | ||||||||
During the three months ended June 30, 2019 we recorded a provision for income taxes of $1.8 million, representing a quarterly effective tax rate of 45.3%. The increase in the effective tax rate from approximately 24% in the first quarter of 2019 was driven by the timing of losses of our foreign subsidiaries combined with our revised forecast of 2019 U.S. taxable income. Through December 31, 2018, we had not been required to pay any material U.S. federal or state income taxes nor any foreign income taxes because of accumulated net operating losses.
46
Comparison of the six months ended June 30, 2019 and 2018
Six Months Ended June 30, | ||||||||||||||||||||
2019 | 2018 | Period-to-Period Change | ||||||||||||||||||
Amount | Percentage of Gross Revenue | Amount | Percentage of Gross Revenue | Amount | Percentage | |||||||||||||||
(dollars in thousands) | ||||||||||||||||||||
Revenue: | ||||||||||||||||||||
Interest and finance income | $ | 211,440 | 96.0 | % | $ | 178,438 | 96.1 | % | $ | 33,002 | 18.5 | % | ||||||||
Other revenue | 8,781 | 4.0 | 7,158 | 3.9 | 1,623 | 22.7 | ||||||||||||||
Gross revenue | 220,221 | 100.0 | 185,596 | 100.0 | 34,625 | 18.7 | ||||||||||||||
Cost of revenue: | ||||||||||||||||||||
Provision for credit losses | 86,242 | 39.2 | 69,586 | 37.5 | 16,656 | 23.9 | ||||||||||||||
Interest expense | 22,713 | 10.3 | 24,117 | 13.0 | (1,404 | ) | (5.8 | ) | ||||||||||||
Total cost of revenue | 108,955 | 49.5 | 93,703 | 50.5 | 15,252 | 16.3 | ||||||||||||||
Net revenue | 111,266 | 50.5 | 91,893 | 49.5 | 19,373 | 21.1 | ||||||||||||||
Operating expense: | ||||||||||||||||||||
Sales and marketing | 25,267 | 11.5 | 22,030 | 11.9 | 3,237 | 14.7 | ||||||||||||||
Technology and analytics | 33,487 | 15.2 | 23,806 | 12.8 | 9,681 | 40.7 | ||||||||||||||
Processing and servicing | 11,098 | 5.0 | 10,262 | 5.5 | 836 | 8.1 | ||||||||||||||
General and administrative | 30,382 | 13.8 | 33,759 | 18.2 | (3,377 | ) | (10.0 | ) | ||||||||||||
Total operating expense | 100,234 | 45.5 | 89,857 | 48.4 | 10,377 | 11.5 | ||||||||||||||
Income (loss) from operations, before provision for income taxes | 11,032 | 5.0 | 2,036 | 1.1 | 8,996 | 441.8 | ||||||||||||||
Provision for income taxes | 3,536 | 1.6 | — | — | 3,536 | — | ||||||||||||||
Net income (loss) | $ | 7,496 | 3.4 | % | $ | 2,036 | 1.1 | % | $ | 5,460 | 268.2 | % | ||||||||
Net income (loss)
For the six months ended June 30, 2019, net income increased to $7.5 million from $2.0 million for the six months ended June 30, 2018 while adjusted net income, a non-GAAP measure, decreased to $15.0 million from $16.1 million over the same period. Basic earnings per share increased from $0.05 per share to $0.13 per share. Similarly, our Return on Assets increased to 1.6% from 0.7% while our Return on Equity increased to 6.5% from 2.7%. Our adjusted Return on Assets, a non-GAAP measure, decreased to 2.5% from 3.1% while our adjusted Return on Equity, a non-GAAP measure, decreased to 9.8% from 12.1%. See Item 2. Management’s Discussion and Analysis of Financial Condition and Results of Operations-Non-GAAP Financial Measures for a discussion and reconciliation of Non-GAAP measures.
47
Revenue
Six Months Ended June 30, | ||||||||||||||||||||
2019 | 2018 | Period-to-Period Change | ||||||||||||||||||
Amount | Percentage of Gross Revenue | Amount | Percentage of Gross Revenue | Amount | Percentage | |||||||||||||||
(dollars in thousands) | ||||||||||||||||||||
Revenue: | ||||||||||||||||||||
Interest and finance income | $ | 211,440 | 96.0 | % | $ | 178,438 | 96.1 | % | $ | 33,002 | 18.5 | % | ||||||||
Other revenue | 8,781 | 4.0 | 7,158 | 3.9 | 1,623 | 22.7 | ||||||||||||||
Gross revenue | $ | 220,221 | 100.0 | % | $ | 185,596 | 100.0 | % | $ | 34,625 | 18.7 | % | ||||||||
Gross revenue increased by $34.6 million, or 18.7%, from $185.6 million to $220.2 million. This growth was in part attributable to a $33.0 million, or 18.5%, increase in interest income, which was primarily driven by the higher balance of loans being held on our balance sheet as evidenced by the 17.7% increase in Average Loans and Finance Receivables from $1.0 billion to $1.2 billion.
Other revenue increased by $1.6 million, or 22.7%, primarily attributable to an increase in referral fees from other lenders and ODX revenue, partially offset by a decrease in marketing fees from our issuing bank partner.
Cost of Revenue
Six Months Ended June 30, | ||||||||||||||||||||
2019 | 2018 | Period-to-Period Change | ||||||||||||||||||
Amount | Percentage of Gross Revenue | Amount | Percentage of Gross Revenue | Amount | Percentage | |||||||||||||||
(dollars in thousands) | ||||||||||||||||||||
Cost of revenue: | ||||||||||||||||||||
Provision for credit losses | $ | 86,242 | 39.2 | % | $ | 69,586 | 37.5 | % | $ | 16,656 | 23.9 | % | ||||||||
Interest expense | 22,713 | 10.3 | 24,117 | 13.0 | (1,404 | ) | (5.8 | ) | ||||||||||||
Total cost of revenue | $ | 108,955 | 49.5 | % | $ | 93,703 | 50.5 | % | $ | 15,252 | 16.3 | % | ||||||||
Total cost of revenue increased by $15.3 million, or 16.3% from $93.7 million to $109.0 million. Provision for credit losses increased by $16.7 million, or 23.9%, from $69.6 million to $86.2 million. In accordance with GAAP, we recognize revenue on loans and finance receivables over their term, but provide for probable credit losses on the loans and finance receivables at the time they are originated. We then periodically adjust our estimate of those probable credit losses based on actual performance and changes in loss estimates. Our provision for credit losses as a percentage of originations, or the Provision Rate, increased from 5.9% to 7.0%. The increase in Provision Rate was primarily driven by the deterioration of loans originated in the second half of 2018, and a normalizing credit environment.
Interest expense decreased by $1.4 million, or 5.8%, from $24.1 million to $22.7 million. As a percentage of gross revenue, interest expense decreased from 13.0% to 10.3%. The decrease in interest expense was primarily attributable to decreases in interest rate spread (the applicable percentage rate above the benchmark interest rate charged by the lender) and was partially offset by increases in Average Debt outstanding and benchmark rates. The Average Debt Outstanding during the six months ended 2019 was $835.9 million up 16.5% from $717.7 million during the six months ended 2018, while our Cost of Funds Rate decreased from 6.7% to 5.4%.
48
Operating Expense
Total operating expense increased by $10.4 million, or 11.5%, from $89.9 million to $100.2 million. At June 30, 2019, we had 726 employees compared to 587 at December 31, 2018. Approximately half of the headcount increase reflects the additional Evolocity employees, with the majority of the other half attributable to Technology and Analytics employees. We increased our headcount and personnel-related costs across our business in order to support our growth strategy and expect headcount to further increase in the remainder of 2019 reflecting investment in growth initiatives.
Given our focus on growth and profitability, we evaluate trends in our efficiency ratio as a key measure of our progress. Our efficiency ratio for the six months ended June 30, 2019 decreased to 45.5% from 48.4% for the six months ended June 30, 2018. Our Adjusted Efficiency Ratio, a non-GAAP measure, increased from 41.7% for the six months ended June 30, 2018 to 42.6% for the six months ended June 30, 2019. See Item 2. Management’s Discussion and Analysis of Financial Condition and Results of Operations-Non-GAAP Financial Measures for a discussion and reconciliation of Adjusted Efficiency Ratio.
Sales and Marketing
Six Months Ended June 30, | ||||||||||||||||||||
2019 | 2018 | Period-to-Period Change | ||||||||||||||||||
Amount | Percentage of Gross Revenue | Amount | Percentage of Gross Revenue | Amount | Percentage | |||||||||||||||
(dollars in thousands) | ||||||||||||||||||||
Sales and marketing | $ | 25,267 | 11.5 | % | $ | 22,030 | 11.9 | % | $ | 3,237 | 14.7 | % | ||||||||
Sales and marketing expense increased by $3.2 million, or 14.7%, from $22.0 million to $25.3 million. The increase was primarily attributable to a $2.0 million increase in personnel-related costs as well as a $0.3 million increase in general marketing spend. Additionally, the prior period benefited from a $0.6 million credit to our occupancy expense related to lease terminations.
Technology and Analytics
Six Months Ended June 30, | ||||||||||||||||||||
2019 | 2018 | Period-to-Period Change | ||||||||||||||||||
Amount | Percentage of Gross Revenue | Amount | Percentage of Gross Revenue | Amount | Percentage | |||||||||||||||
(dollars in thousands) | ||||||||||||||||||||
Technology and analytics | $ | 33,487 | 15.2 | % | $ | 23,806 | 12.8 | % | $ | 9,681 | 40.7 | % | ||||||||
Technology and analytics expense increased by $9.7 million, or 40.7%, from $23.8 million to $33.5 million. The increase was primarily attributable to $6.6 million of additional personnel-related costs as we continue to invest in our strategic initiatives and build our internal capabilities for the future. Additionally, we incurred an increase in software license expenditures, and other software expenses during the six months ended June 30, 2019.
Processing and Servicing
Six Months Ended June 30, | ||||||||||||||||||||
2019 | 2018 | Period-to-Period Change | ||||||||||||||||||
Amount | Percentage of Gross Revenue | Amount | Percentage of Gross Revenue | Amount | Percentage | |||||||||||||||
(dollars in thousands) | ||||||||||||||||||||
Processing and servicing | $ | 11,098 | 5.0 | % | $ | 10,262 | 5.5 | % | $ | 836 | 8.1 | % | ||||||||
Processing and servicing expense increased by $0.8 million, or 8.1%, from $10.3 million to $11.1 million. The increase was primarily attributable to a $0.8 million increase in costs related to our in-house collection initiatives. Additionally, the prior period benefited from a $0.4 million credit to our occupancy expense related to lease terminations. Our increases in expense were slightly offset by a $0.3 million decrease in personnel-related costs.
49
General and Administrative
Six Months Ended June 30, | ||||||||||||||||||||
2019 | 2018 | Period-to-Period Change | ||||||||||||||||||
Amount | Percentage of Gross Revenue | Amount | Percentage of Gross Revenue | Amount | Percentage | |||||||||||||||
(dollars in thousands) | ||||||||||||||||||||
General and administrative | $ | 30,382 | 13.8 | % | $ | 33,759 | 18.2 | % | $ | (3,377 | ) | (10.0 | )% | |||||||
General and administrative expense decreased by $3.4 million, or 10.0%, from $33.8 million to $30.4 million. The decrease was primarily attributable to additional expenses incurred during the six months ended June 30, 2018, including a $5.7 million charge for asset disposals related to our 2018 lease terminations as well as a $1.4 million debt extinguishment costs in the six months ended 2018. The decrease in expense was partially offset by a $2.4 million increase in personnel related charges due to an expansion of headcount which included the addition of the Evolocity subsidiary.
Provision for Income Taxes
Six Months Ended June 30, | ||||||||||||||||||||
2019 | 2018 | Period-to-Period Change | ||||||||||||||||||
Amount | Percentage of Gross Revenue | Amount | Percentage of Gross Revenue | Amount | Percentage | |||||||||||||||
(dollars in thousands) | ||||||||||||||||||||
Provision for income taxes | $ | 3,536 | 1.6 | % | $ | — | — | % | $ | 3,536 | — | % | ||||||||
During the six months ended June 30, 2019 we recorded a provision for income taxes of $3.5 million, representing a year to date effective tax rate of 32.1%. Through December 31, 2018, we were not required to pay any material U.S. federal or state income taxes nor any foreign income taxes because of accumulated net operating losses.
Liquidity and Capital Resources
During the second quarter of 2019, we originated $592 million of loans and during the six months ended June 30, 2019, we originated $1.2 billion of loans utilizing a diversified set of funding sources, including cash on hand, third-party lenders (through debt facilities and securitization), and the cash generated by our operating, investing and financing activities.
Cash on Hand
At June 30, 2019, we had approximately $59 million of cash on hand to fund our future operations which was comparable to December 31, 2018.
50
Current Debt Facilities
The following table summarizes our debt facilities as of June 30, 2019.
Maturity Date | Weighted Average Interest Rate | Borrowing Capacity | Principal Outstanding | ||||||||
(in millions) | |||||||||||
Debt: | |||||||||||
OnDeck Asset Securitization Trust II LLC | April 2022 | (1) | 3.8% | $ | 225.0 | $ | 225.0 | ||||
OnDeck Account Receivables Trust 2013-1 LLC | March 2022 | (2) | 4.2% | 180.0 | 111.8 | ||||||
Receivable Assets of OnDeck, LLC | September 2021 | (3) | 4.8% | 119.7 | 101.5 | ||||||
OnDeck Asset Funding II LLC | August 2022 | (4) | 5.4% | 175.0 | 110.2 | ||||||
Prime OnDeck Receivable Trust II, LLC | March 2022 | (5) | 4.4% | 180.0 | 108.9 | ||||||
Loan Assets of OnDeck, LLC | October 2022 | (6) | 4.2% | 150.0 | 98.5 | ||||||
Corporate Debt | January 2021 | 5.4% | 85.0 | (7) | 20.0 | ||||||
Other Agreements | Various | (8) | 6.8% | (9) | 113.7 | (10) | 72.9 | ||||
Total Debt | 4.6% | $ | 1,228.4 | $ | 848.8 | ||||||
(1) | The period during which new loans may be purchased under this securitization transaction expires in March 2020. |
(2) | The period during which new borrowings may be made under this facility expires in March 2021. |
(3) | The period during which new borrowings of Class A revolving loans may be made under this debt facility expires in December 2020. The $19.7 million of Class B borrowing capacity matures in December 2019. |
(4) | The period during which new borrowings may be made under this facility expires in August 2021. |
(5) | The period during which new borrowings may be made under this facility expires in March 2021. |
(6) | The period during which new borrowings may be made under this debt facility expires in April 2022. |
(7) | On July 19, 2019, the Company entered into an agreement which increased the commitment under its corporate revolving debt facility by $20 million, refer to Note 13 of Notes to Consolidated Financial Statements for additional information. |
(8) | The periods during which new borrowings may be made under the various agreements expire between September 2019 and June 2020. Maturity dates range from September 2019 through December 2022. |
(9) | Weighted Average Interest Rate as of June 30, 2019 reflects the credit facilities assumed as a part of the combination with Evolocity. |
(10) | Outstanding amounts as of June 30, 2019 reflects the credit facilities assumed as a part of the combination with Evolocity. |
Our ability to fully utilize the available capacity of our debt facilities may also be impacted by provisions that limit concentration risk and eligibility.
Cash and Cash Equivalents, Loans (Net of Allowance for Credit Losses), and Cash Flows
The following table summarizes our cash and cash equivalents, loans (net of ALLL) and cash flows:
As of or for the Six Months Ended June 30, | |||||||
2019 | 2018 | ||||||
(in thousands) | |||||||
Cash and cash equivalents | $ | 58,744 | $ | 74,262 | |||
Restricted cash | $ | 43,336 | $ | 44,189 | |||
Loans and finance receivables held for investment, net | $ | 1,061,870 | $ | 922,731 | |||
Cash provided by (used in): | |||||||
Operating activities | $ | 136,559 | $ | 118,764 | |||
Investing activities | $ | (125,412 | ) | $ | (178,007 | ) | |
Financing activities | $ | (6,147 | ) | $ | 64,277 | ||
Our cash and cash equivalents at June 30, 2019 were held primarily for working capital purposes. We may, from time to time, use excess cash and cash equivalents to fund our lending activities. We do not enter into investments for trading or speculative purposes. Our policy is to invest cash in excess of our immediate working capital requirements in short-term investments, deposit accounts or other arrangements designed to preserve the principal balance and maintain adequate liquidity. Our excess cash may
51
be invested primarily in overnight sweep accounts, money market instruments or similar arrangements that provide competitive returns consistent with our polices and market conditions.
Our restricted cash represents funds held in accounts as reserves on certain debt facilities and as collateral for issuing bank partner transactions. We have no ability to draw on such funds as long as they remain restricted under the applicable arrangements but have the ability to use these funds to finance loan originations, subject to meeting borrowing base requirements. Our policy is to invest restricted cash held in debt facility related accounts in investments designed to preserve the principal balance and provide liquidity. Accordingly, such cash is invested primarily in money market instruments that offer daily purchase and redemption and provide competitive returns consistent with our policies and market conditions.
Cash Flows
Operating Activities
For the six months ended June 30, 2019, net cash provided by operating activities was $136.6 million, which was primarily the result of interest payments from our customers of $245.8 million, less $86.3 million utilized to pay our operating expenses and $20.0 million we used to pay the interest on our debt. During that same period, accounts payable and accrued expenses and other liabilities increased by approximately $3.1 million.
For the six months ended June 30, 2018, net cash provided by our operating activities was $118.8 million, which was primarily the result of our cash received from our customers, including interest payments of $211.3 million, less $70.7 million utilized to pay our operating expenses and $21.4 million we used to pay the interest on our debt. During that same period, accounts payable and accrued expenses and other liabilities increased by approximately $3.4 million.
Investing Activities
Our investing activities have consisted primarily of funding our term loan, line of credit and finance receivable originations, including payment of associated direct costs and receipt of associated fees, offset by customer repayments of term loans, lines of credit and finance receivables, purchases of property, equipment and software, capitalized internal-use software development costs and, historically, proceeds from the sale of term loans which were not specifically identified at origination as a loan held for sale. Purchases of property, equipment and software and capitalized internal-use software development costs may vary from period to period due to the timing of the expansion of our operations, the addition of employee headcount and the development cycles of our internal-use technology.
For the six months ended June 30, 2019, net cash used to fund our investing activities was $125.4 million, and consisted primarily of $83.3 million of loan originations in excess of loan repayments received, $33.5 million of origination costs paid in excess of fees collected and $5.6 million for the purchase of property, equipment and software and capitalized internal-use software development costs.
For the six months ended June 30, 2018, net cash used to fund our investing activities was $178.0 million, and consisted primarily of $144.1 million of loan originations in excess of loan repayments received, $30.0 million of origination costs paid in excess of fees collected and $3.2 million for the purchase of property, equipment and software and capitalized internal-use software development costs.
Financing Activities
Our financing activities have consisted primarily of net borrowings from our securitization facility and our revolving debt facilities.
For the six months ended June 30, 2019, net cash used in our financing activities was $6.1 million and consisted primarily of $3.6 million in net additional debt repaid on our debt facilities and $2.8 million of payments of debt issuance costs. These uses of cash were partially offset by $1.3 million of cash received from the issuance of common stock under the employee stock purchase plan.
For the six months ended June 30, 2018, net cash provided by our financing activities was $64.3 million and consisted primarily of $64.4 million in net additional debt drawn down from our debt facilities and $3.7 million of payments of debt issuance costs. These uses of cash were partially offset by $3.4 million of net cash received from noncontrolling interest, and $0.7 million of cash received from the issuance of common stock under the employee stock purchase plan.
Operating and Capital Expenditure Requirements
We require substantial liquidity to fund our current operating and capital expenditure requirements. We expect these requirements to increase as we pursue our growth strategy.
Our originations for the three months ended June 30, 2019 and 2018 were $592 million and $587 million, respectively. Our originations for the six months ended June 30, 2019 and 2018 were $1.23 billion and $1.18 billion, respectively.
52
Our strategy is to continue to grow in a disciplined manner while remaining highly focused on credit quality and operating leverage. We expect our originations to grow in 2019 as compared to 2018. Because we will remain focused on credit quality, we are also prepared to forgo lending opportunities that do not meet our credit, underwriting and pricing standards. In addition, despite the continuing competition for customer response, we intend to allocate resources to continue to optimize marketing and customer acquisition costs based on targeted returns on investment rather than spending inefficiently in these areas to achieve incremental growth.
We estimate that at June 30, 2019, approximately $352 million of our own cash had been invested in our loan portfolio, approximately one-half of which was used to fund our portfolio's residual value. Investing in our portfolio's residual value is a requirement of our funding model and will remain a use of cash so long as we continue to grow loan balances.
We expect to use cash flow generated from operations for various corporate purposes including to fund a portion of our lending activities including funding residual growth. In addition, we may also finance residual growth through our available liquidly sources such as our corporate line of credit or by introducing additional subordinated notes in our debt facilities.
As of June 30, 2019, $87 million of our capacity is scheduled to expire before June 30, 2020. In order to maintain and grow our current rate of loan originations over the next twelve months, we will be required to secure additional funding. We plan to do this through one or more of the following sources: new asset-backed securitization transactions, new debt facilities and extensions and increases to existing debt facilities. Historically we have been successful in accessing the asset-backed loan market on terms acceptable to us, and we anticipate that we will be able to do so into the foreseeable future. However, if we deem the cost of accessing the asset-backed loan market to be in excess of an appropriate rate, we may elect to use available cash, OnDeck Marketplace, or other financing options available to us. Furthermore, we could decide to alter the types of loans we originate, such that more loans are eligible for credit facilities, or we could decide to slow down the rate of originations. We are currently in various stages of discussions with multiple potential funding sources. While we expect to be able to obtain additional capacity on market terms, there can be no assurance that we will be successful.
In addition to pursuing funding as described above, although it is not currently anticipated, depending upon the circumstances we may seek additional equity financing. The sale or issuance of equity may result in dilution to our stockholders, and those securities may have rights senior to those of our common stock. If we raise additional funds through the issuance of additional debt, the agreements governing such debt could contain covenants that would restrict our operations and such debt would rank senior to shares of our common stock.
Our Board of Directors authorized the repurchase of up to $50 million of common stock with the shares to be retained in Treasury and available for possible reissuance. Any share repurchases under the program will be made from time to time in the open market, in privately negotiated transactions or otherwise. The timing and amount of any share repurchases will be subject to market conditions and other factors as we may determine. The repurchase authorization expires August 31, 2020, however, we may suspend, modify or discontinue the program at any time in our discretion without prior notice.
We believe that our cash from operations, available capacity under our revolving lines of credit (and expected extensions or replacements of those lines), and existing cash balances, together with additional financing we expect to be able to obtain on market terms, are sufficient to meet both our existing operating and capital expenditure requirements and our currently planned growth for at least the next 12 months.
Contractual Obligations
Other than as described under the subheading "Liquidity and Capital Resources," and in Note 5 and Note 10 of Notes to Unaudited Condensed Consolidated Financial Statements, there have been no material changes in our commitments under contractual obligations from those disclosed in our Annual Report on Form 10-K for the year ended December 31, 2018.
Off-Balance Sheet Arrangements
As of June 30, 2019, we did not have any off-balance sheet arrangements, as defined in Item 303(a)(4)(ii) of Regulation S-K, such as the use of unconsolidated subsidiaries, structured finance, special purpose entities or variable interest entities.
Critical Accounting Policies and Significant Judgments and Estimates
There have been no material changes to our critical accounting policies and estimates as compared to those described in our Annual Report on Form 10-K for the year ended December 31, 2018.
Our management’s discussion and analysis of our financial condition and results of operations is based on our consolidated financial statements, which have been prepared in accordance with GAAP. The preparation of these consolidated financial statements requires us to make estimates and assumptions that affect the reported amounts of assets and liabilities, disclosure of
53
contingent assets and liabilities at the date of the consolidated financial statements, and the reported amounts of revenue and expenses during the reported period. In accordance with GAAP, we base our estimates on historical experience and on various other assumptions that we believe are reasonable under the circumstances. Actual results may differ from these estimates under different assumptions or conditions.
Recently Issued Accounting Pronouncements and JOBS Act Election
Recent Accounting Pronouncements Not Yet Adopted
Refer to Note 1, Organization and Summary of Significant Accounting Policies, contained in the Notes to Unaudited Condensed Consolidated Financial Statements in Item 1 of Part I of this report for a full description of the recent accounting pronouncements and our expectation of their impact, if any, on our results of operations and financial conditions
JOBS Act
We became a public company in December 2014, and since that time we have met the definition of an “emerging growth company” under the JOBS Act. We have irrevocably elected to opt out of the extended transition period for complying with new or revised accounting standards pursuant to Section 107(b) of the JOBS Act. Our emerging growth company status will expire effective December 31, 2019.
Item 3. | Quantitative and Qualitative Disclosures About Market Risk |
There have been no material changes from the information previously reported under "Part II, Item 7A" of our Annual Report on Form 10-K for the year ended December 31, 2018
54
Item 4. | Controls and Procedures |
Disclosure Controls and Procedures
As required by Rule 13a-15 under the Exchange Act, management has evaluated, with the participation of our Chief Executive Officer and Chief Financial Officer, the effectiveness of our disclosure controls and procedures as of the end of the period covered by this report. Disclosure controls and procedures refer to controls and other procedures designed to ensure that information required to be disclosed in the reports we file or submit under the Exchange Act are recorded, processed, summarized, and reported within the time periods specified in the rules and forms of the SEC. Disclosure controls and procedures include, without limitation, controls and procedures designed to ensure that information required to be disclosed by us in our reports that we file or submit under the Exchange Act are accumulated and communicated to our management, including our Chief Executive Officer and Chief Financial Officer, as appropriate, to allow timely decisions regarding our required disclosure. In designing and evaluating our disclosure controls and procedures, management recognizes that any controls and procedures, no matter how well designed and operated, can provide only reasonable assurance of achieving the desired control objectives, and management was required to apply its judgment in evaluating and implementing possible controls and procedures.
Based on the foregoing evaluation, our Chief Executive Officer and Chief Financial Officer have concluded that, as of June 30, 2019, the end of the period covered by this report, our disclosure controls and procedures were effective at a reasonable assurance level.
Changes in Internal Control over Financial Reporting
There were no changes in our internal control over financial reporting during the quarter ended June 30, 2019 that have materially affected, or are reasonably likely to materially affect, our internal control over financial reporting.
PART II - OTHER INFORMATION
Item 1. | Legal Proceedings |
From time to time we are subject to legal proceedings and claims in the ordinary course of our business. The results of such matters cannot be predicted with certainty. However, we believe that the final outcome of any such current matters will not result in a material adverse effect on our consolidated financial condition, consolidated results of operations or consolidated cash flows.
Item 1A. | Risk Factors |
Our current and prospective investors should carefully consider the following risks, in addition to those described in "Part I, Item 1A. Risk Factors" in our Annual Report on Form 10-K for the year ended December 31, 2018, and other documents that we file with the SEC from time to time which are available on the SEC website at www.sec.gov, and all other information contained in this report, including our unaudited condensed consolidated financial statements and the related notes, “Management’s Discussion and Analysis of Financial Condition and Results of Operations” and the “Cautionary Note Regarding Forward-Looking Statements,” before making investment decisions regarding our securities. The risks and uncertainties described below supplement, or to the extent inconsistent, supersede those in our above-mentioned Annual Report on Form 10-K. In addition, the risks and uncertainties below and in our above-mentioned Annual Report on Form 10-K are not the only ones we face, but include the most significant factors then known by us. Additional risks and uncertainties that we are unaware of, or that we currently believe are not material, also may become important factors that affect us. If any of these risks materialize, our business, financial condition and results of operations could be materially harmed. In that case, the trading price of our securities could decline, and you may lose some or all of your investment.
55
Although we have decided to pursue obtaining a bank charter, there can be no assurances when we would obtain a bank charter, if at all, and whether we may do so either de novo or through a transaction.
On July 29, 2019, we announced that after careful consideration and analysis, we have decided to pursue obtaining a bank charter, either de novo or through a transaction.
There can be no assurances when we would obtain a bank charter, if at all, and whether we may do so either de novo or through a transaction. Since our formation, we have not been a bank, have not been regulated as a bank and do not have experience operating or managing a bank. Obtaining a bank charter is subject to significant regulatory requirements and consents, and we will not be able to obtain a bank charter, either de novo or through a transaction, without complying with applicable laws and regulations and obtaining required governmental approvals and consents. For example, if we were to attempt to acquire a commercial bank and become a bank holding company, we would be required to obtain the approval of federal and/or state bank regulatory agencies. Such approval process is time consuming, requires the submission of extensive information, is subject to considerations of safety and soundness, management capabilities and public convenience and needs, among other factors, and may be subject to regulatory delays. We may not receive any such required approvals and consents or we may not receive them in a timely manner, including as a result of factors or matters beyond our control.
Obtaining a bank charter, either de novo or through a transaction, would subject our business to significant new regulatory requirements that may significantly limit our operations and control the manner in which we conduct our business, which could have a material adverse effect on our business, financial condition and operating results.
U.S. banks and their holding companies are subject to extensive supervision and regulation by a number of governmental agencies, including one or more of the Board of Governors of the Federal Reserve System, the Office of the Comptroller of the Currency, the Federal Deposit Insurance Corporation, or the FDIC, and the Consumer Financial Protection Bureau and/or state banking supervisors. The statutes establishing these agencies and related regulations, which are generally intended to protect bank depositors and customers rather than stockholders, govern a comprehensive range of matters including:
• | ownership and control of stockholders; |
• | acquisition of other companies and businesses; |
• | permissible investments and activities; |
• | maintenance of adequate capital levels; |
• | sales practices; |
• | anti-money laundering requirements; |
• | an insolvency regime for insured depository institutions and the powers of the FDIC as receiver of insolvent insured depository institutions; |
• | restrictions on repurchases of stock, dividends or other distributions by banking organizations; |
• | restrictions on engaging in proprietary trading and investing in or sponsoring certain investment funds; |
• | deposit insurance provided by the FDIC; |
• | supervision and examination; |
• | limitations on transactions between banks and their affiliates; |
• | requirements of depository institutions to meet the credit needs of their local communities; and |
• | enforcement actions and civil and criminal penalties for violations of banking statutes and regulations. |
These and other regulations may significantly limit our operations and control the manner in which we conduct our business, including our lending practices, capital structure, investment practices, ability to effect stock repurchases (or pay dividends) and the scope of our activities, which could have a material adverse effect on our business, financial condition, operating results.
In addition, banks and bank holding companies generally are subject to rigorous capital requirements and are examined on a regular basis for their general safety and soundness and compliance with various federal and state legal regimes, including, but not limited to, the Dodd-Frank Act, the Community Reinvestment Act, the Truth in Lending Act, the Gramm-Leach-Bliley Act, the Equal Credit Opportunity Act, the Fair Credit Reporting Act and the Bank Secrecy Act, as amended by the USA PATRIOT Act of 2001. Any compliance failures (including actions by a banking organization prior to our acquisition of it if we were to
56
complete a transaction), or any failure by us or our subsidiaries to maintain satisfactory examination ratings or capital levels for any reason, could result in substantial penalties, requirements, and/or restrictions on our ability to conduct business. In addition, future legislation and government policy could adversely affect our operating results. We also would likely incur additional costs associated with such legal and regulatory compliance, which could adversely affect our operating results.
We cannot predict the impact our recent announcement regarding JPMorgan Chase Bank, National Association, or JPM, may have on our business or the business of ODX, but the impact could be material.
On July 29, 2019, we announced that effective August 3, 2019, JPM no longer intends to originate new small business loans through our platform hosting the Chase Business Quick Capital® program. We will continue to act as servicer for up to two years with respect to JPM’s loans previously originated through our platform. We took a $0.9 million impairment charge for the quarter ended June 30, 2019 for the remaining capitalized technology supporting JPM originations. We cannot predict the impact this announcement may have on our business or the business of ODX. For example, depending on how third parties react, it could make it more difficult for ODX to:
• | convert potential clients in its pipeline into actual clients (and even if they become actual clients, it could be more time consuming and expensive to do so); |
• | retain an existing client; |
• | attract potential clients willing to consider ODX’s solutions; |
• | attract and/or to retain qualified employees necessary to support ODX’s business and growth plans and/ or remain competitive. |
Any one or more of the foregoing could materially and adversely impact ODX’s opportunities and business prospects.
Adverse impacts at ODX could also impact OnDeck Capital, Inc. by requiring greater investment in ODX both in amount and duration. Similarly, OnDeck Capital, Inc. could find it more difficult to attract and/or retain qualified employees necessary to support its business and growth plans, which could negatively impact our consolidated financial results.
Item 2. | Unregistered Sales of Equity Securities and Use of Proceeds |
None.
Item 3. | Defaults Upon Senior Securities |
None.
Item 4. | Mine Safety Disclosures |
None.
57
Item 5. | Other Information |
None.
SIGNATURES
Pursuant to the requirements of Section 13 or 15(d) of the Securities Exchange Act of 1934, the registrant has duly caused this report to be signed on its behalf by the undersigned, thereunto duly authorized.
On Deck Capital, Inc. | |
/s/ Kenneth A. Brause | |
Kenneth A. Brause Chief Financial Officer (Principal Financial Officer) | |
Date: August 7, 2019 | |
/s/ Nicholas Sinigaglia | |
Nicholas Sinigaglia Chief Accounting Officer (Principal Accounting Officer) | |
Date: August 7, 2019 | |
58
Exhibit Index
Exhibit Number | Description | Filed / Incorporated by Reference from Form * | Incorporated by Reference from Exhibit Number | Date Filed | ||||
8-K | 3.1 | 12/22/2014 | ||||||
10-Q | 3.2 | 11/6/2018 | ||||||
S-1 | 4.1 | 11/10/2014 | ||||||
10.1+ | Filed Herewith.** | |||||||
Filed herewith. | ||||||||
Filed herewith. | ||||||||
Filed herewith. | ||||||||
Filed herewith. | ||||||||
101.INS | XBRL Instance Document | Filed herewith. | ||||||
101.SCH | XBRL Taxonomy Extension Schema Document | Filed herewith. | ||||||
101.CAL | XBRL Taxonomy Extension Calculation Linkbase Document | Filed herewith. | ||||||
101.DEF | XBRL Taxonomy Extension Definition Linkbase Document | Filed herewith. | ||||||
101.LAB | XBRL Taxonomy Extension Labels Linkbase Document | Filed herewith. | ||||||
101.PRE | XBRL Taxonomy Extension Presentation Linkbase Document | Filed herewith. | ||||||
* | All exhibits incorporated by reference to the Registrant's Form S-1 or S-1/A registration statements relate to Registration No. 333-200043 |
** | Supersedes Exhibit 10.4 filed with the Form 10-K for the year ended December 31, 2018 filed on March 1, 2019 |
59
Exhibit 10.1
ON DECK CAPITAL, INC.
2014 EMPLOYEE STOCK PURCHASE PLAN
(as amended and restated)
1.Purpose. The purpose of the Plan is to provide employees of the Company and its Designated Companies with an opportunity to purchase Common Stock through accumulated Contributions. The Company intends for the Plan to have two components: a Code Section 423 Component (“423 Component”) and a non-Code Section 423 Component (“Non-423 Component”). The Company’s intention is to have 423 Component of the Plan qualify as an “employee stock purchase plan” under Section 423 of the Code. The provisions of the 423 Component, accordingly, will be construed so as to extend and limit Plan participation in a uniform and nondiscriminatory basis consistent with the requirements of Section 423 of the Code. In addition, this Plan authorizes the grant of an option to purchase shares of Common Stock under the Non-423 Component that does not qualify as an “employee stock purchase plan” under Section 423 of the Code; such an option will be granted pursuant to rules, procedures or sub-plans adopted by the Administrator designed to achieve tax, securities laws or other objectives for Eligible Employees and the Company. Except as otherwise provided herein, the Non-423 Component will operate and be administered in the same manner as the 423 Component.
2. Definitions.
(a) “Administrator” means the Board or any Committee designated by the Board to administer the Plan pursuant to Section 14.
(b) “Affiliate” means any entity, other than a Subsidiary, in which the Company has an equity or other ownership interest.
(c) “Applicable Laws” means the requirements relating to the administration of equity-based awards under U.S. state corporate laws, U.S. federal and state securities laws, the Code, any stock exchange or quotation system on which the Common Stock is listed or quoted and the applicable laws of any foreign country or jurisdiction where options are, or will be, granted under the Plan.
(d) “Board” means the Board of Directors of the Company.
(e) “Change in Control” means the occurrence of any of the following events:
(i) A change in the ownership of the Company which occurs on the date that any one person, or more than one person acting as a group (“Person”), acquires ownership of the stock of the Company that, with the stock held by such Person, constitutes more than 50% of the total voting power of the stock of the Company; provided, however, that for this subsection, the acquisition of additional stock by any one Person, who prior to such acquisition is considered to own more than 50% of the total voting power of the stock of the Company will not
be considered a Change in Control. Further, if the stockholders of the Company immediately before such change in ownership continue to retain immediately after the change in ownership, in substantially the same proportions as their ownership of shares of the Company’s voting stock immediately prior to the change in ownership, direct or indirect beneficial ownership of 50% or more of the total voting power of the stock of the Company, such event shall not be considered a Change in Control under this clause (i). For this purpose, indirect beneficial ownership shall include, without limitation, an interest resulting from ownership of the voting securities of one or more corporations or other business entities which own the Company, as the case may be, either directly or through one or more subsidiary corporations or other business entities; or
(ii) A change in the effective control of the Company which occurs on the date a majority of members of the Board is replaced during any 12 month period by Directors whose appointment or election is not endorsed by a majority of the members of the Board prior to the appointment or election. For this clause (ii), if any Person is in effective control of the Company, the acquisition of additional control of the Company by the same Person will not be considered a Change in Control; or
(iii) A change in the ownership of a substantial portion of the Company’s assets which occurs on the date that any Person acquires (or has acquired during the 12 month period ending on the date of the most recent acquisition by such person or persons) assets from the Company that have a total gross fair market value equal to or more than 50% of the total gross fair market value of all of the assets of the Company immediately prior to such acquisition or acquisitions; provided, however, that for this clause (iii), the following will not constitute a change in the ownership of a substantial portion of the Company’s assets:
(1) the sale of the assets of the OnDeck Marketplace business,
(2) a transfer to an entity controlled by the Company’s stockholders immediately after the transfer, or
(3) a transfer of assets by the Company to:
(A) a stockholder of the Company (immediately before the asset transfer) in exchange for or with respect to the Company's stock,
(B) an entity, 50% or more of the total value or voting power of which is owned, directly or indirectly, by the Company,
(C) a Person, that owns, directly or indirectly, 50% or more of the total value or voting power of all the outstanding stock of the Company, or
(D) an entity, at least 50% of the total value or voting power of which is owned, directly or indirectly, by a Person described in clauses (A) to (C).
For this definition, gross fair market value means the value of the assets of the Company, or the value of the assets being disposed of, determined without regard to any liabilities associated with such assets. For this definition, Persons will be acting as a group if
2
they are owners of a corporation that enters into a merger, consolidation, purchase or acquisition of stock, or similar business transaction with the Company.
Notwithstanding the foregoing, a transaction will not be deemed a Change in Control unless the transaction qualifies as a change in control event within the meaning of Code Section 409A, as it has been and may be amended from time to time, and any proposed or final Treasury Regulations and Internal Revenue Service guidance that has been promulgated or may be promulgated thereunder from time to time.
Further and for the avoidance of doubt, a transaction will not constitute a Change in Control if: (i) its sole purpose is to change the state of the Company’s incorporation, or (ii) its sole purpose is to create a holding company that will be owned in substantially the same proportions by the Persons who held the Company’s securities immediately before such transaction.
(f) “Code” means the U.S. Internal Revenue Code of 1986, as amended. Reference to a specific section of the Code or U.S. Treasury Regulation thereunder will include such section or regulation, any valid regulation or other official applicable guidance promulgated under such section, and any comparable provision of any future legislation or regulation amending, supplementing or superseding such section or regulation.
(g) “Committee” means a committee of the Board appointed in accordance with Section 14 hereof.
(h) “Common Stock” means the common stock of the Company.
(i) “Company” means On Deck Capital, Inc., a Delaware corporation, or any successor thereto.
(j) “Compensation” means an Eligible Employee’s base straight time gross earnings and commissions (to the extent such commissions are an integral, recurring part of compensation) but exclusive of payments for incentive compensation, bonuses and other similar compensation and payments for overtime and shift premium. The Administrator, in its discretion, may, on a uniform and nondiscriminatory basis, establish a different definition of Compensation for a subsequent Offering Period.
(k) “Contributions” means the payroll deductions and other additional payments that the Company may permit to be made by a Participant to fund the exercise of options granted pursuant to the Plan.
(l) “Designated Company” means any Subsidiary or Affiliate that has been designated by the Administrator from time to time in its sole discretion as eligible to participate in the Plan. For purposes of the 423 Component, only the Company and its Subsidiaries may be Designated Companies, provided, however that at any given time, a Subsidiary that is a Designated Company under the 423 Component shall not be a Designated Company under the Non-423 Component.
(m) “Director” means a member of the Board.
3
(n) “Eligible Employee” means any individual who is a common law employee providing services to the Company or a Designated Company and is customarily employed for at least twenty (20) hours per week and more than five (5) months in any calendar year by the Employer, or any lesser number of hours per week and/or number of months in any calendar year established by the Administrator (if required under applicable local law) for purposes of any separate Offering or for Eligible Employee participating in the Non-423 Component. For purposes of the Plan, the employment relationship will be treated as continuing intact while the individual is on sick leave or other leave of absence that the Employer approves or is legally protected under Applicable Laws. Where the period of leave exceeds three (3) months and the individual’s right to reemployment is not guaranteed either by statute or by contract, the employment relationship will be deemed to have terminated three (3) months and one (1) day following the commencement of such leave. The Administrator, in its discretion, from time to time may, prior to an Enrollment Date for all options to be granted on such Enrollment Date in an Offering, determine (on a uniform and nondiscriminatory basis or as otherwise permitted by Treasury Regulation Section 1.423‑2) that the definition of Eligible Employee will or will not include an individual if he or she: (i) has not completed at least two (2) years of service since his or her last hire date (or such lesser period of time as may be determined by the Administrator in its discretion), (ii) customarily works not more than twenty (20) hours per week (or such lesser period of time as may be determined by the Administrator in its discretion), (iii) customarily works not more than five (5) months per calendar year (or such lesser period of time as may be determined by the Administrator in its discretion), (iv) is a highly compensated employee within the meaning of Section 414(q) of the Code, or (v) is a highly compensated employee within the meaning of Section 414(q) of the Code with compensation above a certain level or is an officer or subject to the disclosure requirements of Section 16(a) of the Exchange Act, provided the exclusion is applied with respect to each Offering in an identical manner to all highly compensated individuals of the Employer whose Employees are participating in that Offering. Each exclusion shall be applied with respect to an Offering in a manner complying with U.S. Treasury Regulation Section 1.423‑2(e)(2)(ii).
(o) “Employer” means the employer of the applicable Eligible Employee(s).
(p) “Enrollment Date” means the first Trading Day of each Offering Period.
(q) “Exchange Act” means the U.S. Securities Exchange Act of 1934, as amended, including the rules and regulations promulgated thereunder.
(r) “Exercise Date” means the first Trading Day on or after May 15 and November 15 of each Purchase Period with respect to Offering Periods that commence after the Restatement Effective Date.
(s) “Fair Market Value” means, as of any date and unless the Administrator determines otherwise, the value of Common Stock determined as follows:
(i) If the Common Stock is listed on any established stock exchange or a national market system, including without limitation the New York Stock Exchange, NASDAQ Global Select Market, the NASDAQ Global Market or the NASDAQ Capital Market of
4
The NASDAQ Stock Market, its Fair Market Value will be the closing sales price for such stock as quoted on such exchange or system on the date of determination (or the closing bid, if no sales were reported), as reported in The Wall Street Journal or such other source as the Administrator deems reliable;
(ii) If the Common Stock is regularly quoted by a recognized securities dealer but selling prices are not reported, its Fair Market Value will be the mean between the high bid and low asked prices for the Common Stock on the date of determination (or if no bids and asks were reported on that date, as applicable, on the last Trading Day such bids and asks were reported), as reported in The Wall Street Journal or such other source as the Administrator deems reliable;
(iii) In the absence of an established market for the Common Stock, the Fair Market Value thereof will be determined in good faith by the Administrator; or
(iv) For purposes of the Enrollment Date of the first Offering Period under the Plan, the Fair Market Value will be the initial price to the public as set forth in the final prospectus included within the registration statement on Form S-1 filed with the Securities and Exchange Commission for the initial public offering of the Common Stock (the “Registration Statement”).
(t) “Fiscal Year” means the fiscal year of the Company.
(u) “New Exercise Date” means a new Exercise Date if the Administrator shortens any Offering Period then in progress.
(v) “Offering” means an offer under the Plan of an option that may be exercised during an Offering Period as further described in Section 4. For purposes of the Plan, the Administrator may designate separate Offerings under the Plan (the terms of which need not be identical) in which Employees of one or more Employers will participate, even if the dates of the applicable Offering Periods of each such Offering are identical and the provisions of the Plan will separately apply to each Offering. To the extent permitted by U.S. Treasury Regulation Section 1.423‑2(a)(1), the terms of each Offering need not be identical provided that the terms of the Plan and an Offering together satisfy U.S. Treasury Regulation Section 1.423‑2(a)(2) and (a)(3).
(w) “Offering Periods” means the periods of approximately six (6) months during which an option granted pursuant to the Plan may be exercised, (i) commencing on the first Trading Day on or after May 15 and November 15 of each year and terminating on the first Trading Day on or after November 15 and May 15, approximately six (6) months later. The duration and timing of Offering Periods may be changed pursuant to Sections 4 and 19.
(x) “Parent” means a “parent corporation,” whether now or hereafter existing, as defined in Section 424(e) of the Code.
(y) “Participant” means an Eligible Employee that participates in the Plan.
5
(z) “Plan” means this On Deck Capital, Inc. 2014 Employee Stock Purchase Plan.
(aa) “Purchase Period” means the approximately six (6) month period commencing after one Exercise Date and ending with the next Exercise Date, except that the first Purchase Period of any Offering Period will commence on the Enrollment Date and end with the next Exercise Date. Unless the Administrator provides otherwise, the Purchase Period will have the same duration and coincide with the length of the Offering Period.
(bb) “Purchase Price” means an amount equal to eighty-five percent (85%) of the Fair Market Value of a share of Common Stock on the Enrollment Date or on the Exercise Date, whichever is lower; provided however, that the Purchase Price may be determined for subsequent Offering Periods by the Administrator subject to compliance with Section 423 of the Code (or any successor rule or provision or any other Applicable Law, regulation or stock exchange rule) or pursuant to Section 19.
(cc) “Restatement Effective Date” means the effective date of the amendment and restatement of the Plan on [July 31], 2019.
(dd) “Subsidiary” means a “subsidiary corporation,” whether now or hereafter existing, as defined in Section 424(f) of the Code.
(ee) “Trading Day” means a day on which the national stock exchange upon which the Common Stock is listed is open for trading.
(ff) “U.S. Treasury Regulations” means the Treasury regulations of the Code. Reference to a specific Treasury Regulation or Section of the Code shall include such Treasury Regulation or Section, any valid regulation promulgated under such Section, and any comparable provision of any future legislation or regulation amending, supplementing or superseding such Section or regulation.
3. Eligibility.
(a) Eligibility. Any Eligible Employee on a given Enrollment Date subsequent to the first Offering Period will be eligible to participate in the Plan, subject to the requirements of Section 5.
(b) Non-U.S. Employees. Eligible Employees who are citizens or residents of a non-U.S. jurisdiction (without regard to whether they also are citizens or residents of the United States or resident aliens (within the meaning of Section 7701(b)(1)(A) of the Code)) may be excluded from participation in the Plan or an Offering if the participation of such Eligible Employees is prohibited under the laws of the applicable jurisdiction or if complying with the laws of the applicable jurisdiction would cause the Plan or an Offering to violate Section 423 of the Code. In the case of the Non-423 Component, Eligible Employee may be excluded from participation in the Plan or an Offering if the Administrator has determined that participation of such Eligible Employee is not advisable or practicable.
6
(c) Limitations. Any provisions of the Plan to the contrary notwithstanding, no Eligible Employee will be granted an option under the Plan (i) to the extent that, immediately after the grant, such Eligible Employee (or any other person whose stock would be attributed to such Eligible Employee pursuant to Section 424(d) of the Code) would own capital stock of the Company or any Parent or Subsidiary of the Company and/or hold outstanding options to purchase such stock possessing five percent (5%) or more of the total combined voting power or value of all classes of the capital stock of the Company or of any Parent or Subsidiary of the Company, or (ii) to the extent that his or her rights to purchase stock under all employee stock purchase plans (as defined in Section 423 of the Code) of the Company or any Parent or Subsidiary of the Company accrues at a rate, which exceeds twenty-five thousand dollars ($25,000) worth of stock (determined at the Fair Market Value of the stock at the time such option is granted) for each calendar year in which such option is outstanding at any time, as determined in accordance with Section 423 of the Code and the regulations thereunder.
4. Offering Periods. As of the Restatement Effective Date, the Plan will be implemented by consecutive Offering Periods with a new Offering Period commencing on the first Trading Day on or after May 15 and November 15 each year, or on such other date as the Administrator will determine, except that the first Offering Period following the Restatement Effective Date will commence on September 16, 2019 (i.e., the first Trading Day on or after September 15, 2019) and end on May 15, 2020. The Administrator will have the power to change the duration of Offering Periods (including the commencement dates thereof) with respect to future Offerings without stockholder approval if such change is announced prior to the scheduled beginning of the first Offering Period to be affected thereafter; provided, however, that no Offering Period may last more than twenty-seven (27) months.
5. Participation. An Eligible Employee may participate in the Plan pursuant to Section 3(a) by (i) submitting to the Company’s stock administration office (or its designee), on or before a date determined by the Administrator prior to an applicable Enrollment Date, a properly completed subscription agreement authorizing Contributions in the form provided by the Administrator for such purpose, or (ii) following an electronic or other enrollment procedure determined by the Administrator.
6. Contributions.
(a) At the time a Participant enrolls in the Plan pursuant to Section 5, he or she will elect to have Contributions (in the form of payroll deductions or otherwise, to the extent permitted by the Administrator) made on each pay day during the Offering Period in an amount not exceeding fifteen percent (15%) of the Compensation, which he or she receives on each pay day during the Offering Period; provided, however, that should a pay day occur on an Exercise Date, a Participant will have any payroll deductions made on such day applied to his or her account under the subsequent Purchase Period or Offering Period. The Administrator, in its sole discretion, may permit all Participants in a specified Offering to contribute amounts to the Plan through payment by cash, check or other means set forth in the subscription agreement prior to each Exercise Date of each Purchase Period. A Participant’s subscription agreement will remain in effect for successive Offering Periods unless terminated as provided in Section 10 hereof.
7
(b) In the event Contributions are made in the form of payroll deductions, such payroll deductions for a Participant will commence on the first pay day following the Enrollment Date and will end on the last pay day prior to the Exercise Date of such Offering Period to which such authorization is applicable, unless sooner terminated by the Participant as provided in Section 10 hereof; provided, however, that for the first Offering Period, payroll deductions will commence on the first pay day on or following the end of the Enrollment Window.
(c) All Contributions made for a Participant will be credited to his or her account under the Plan and Contributions will be made in whole percentages only. A Participant may not make any additional payments into such account.
(d) A Participant may discontinue his or her participation in the Plan as provided in Section 10. If permitted by the Administrator, as determined in its sole discretion, for an Offering Period, a Participant may decrease (but may not increase) the rate of his or her Contributions once during the Offering Period by (i) properly completing and submitting to the Company’s stock administration office (or its designee), on or before a date determined by the Administrator prior to an applicable Exercise Date, a new subscription agreement authorizing the change in Contribution rate in the form provided by the Administrator for such purpose, or (ii) following an electronic or other procedure prescribed by the Administrator. If a Participant has not followed such procedures to change the rate of Contributions, the rate of his or her Contributions will continue at the originally elected rate throughout the Offering Period and future Offering Periods (unless terminated as provided in Section 10). The Administrator may, in its sole discretion, limit the nature and/or number of Contribution rate changes that may be made by Participants during any Offering Period, and may establish such other conditions or limitations as it deems appropriate for Plan administration. Any change in payroll deduction rate made pursuant to this Section 6(d) will be effective as of the first full payroll period following five (5) business days after the date on which the change is made by the Participant (unless the Administrator, in its sole discretion, elects to process a given change in payroll deduction rate more quickly).
(e) Notwithstanding the foregoing, to the extent necessary to comply with Section 423(b)(8) of the Code and Section 3(d), a Participant’s Contributions may be decreased to zero percent (0%) at any time during a Purchase Period. Subject to Section 423(b)(8) of the Code and Section 3(c) hereof, Contributions will recommence at the rate originally elected by the Participant effective as of the beginning of the first Purchase Period scheduled to end in the following calendar year, unless terminated by the Participant as provided in Section 10.
(f) Notwithstanding any provisions to the contrary in the Plan, the Administrator may allow Eligible Employees to participate in the Plan via cash contributions instead of payroll deductions if (i) payroll deductions are not permitted under applicable local law, (ii) the Administrator determines that cash contributions are permissible under Section 423 of the Code and (iii) for Participants participating in the Non-423 Component.
(g) At the time the option is exercised, in whole or in part, or at the time some or all of the Common Stock issued under the Plan is disposed of (or any other time that a taxable event related to the Plan occurs), the Participant must make adequate provision for the Company’s or Employer’s federal, state, local or any other tax liability payable to any authority including taxes imposed by jurisdictions outside of the U.S., national insurance, social security or
8
other tax withholding obligations, if any, which arise upon the exercise of the option or the disposition of the Common Stock (or any other time that a taxable event related to the Plan occurs). At any time, the Company or the Employer may, but will not be obligated to, withhold from the Participant’s compensation the amount necessary for the Company or the Employer to meet applicable withholding obligations, including any withholding required to make available to the Company or the Employer any tax deductions or benefits attributable to sale or early disposition of Common Stock by the Eligible Employee. In addition, the Company or the Employer may, but will not be obligated to, withhold from the proceeds of the sale of Common Stock or any other method of withholding the Company or the Employer deems appropriate to the extent permitted by U.S. Treasury Regulation Section 1.423‑2(f).
7. Grant of Option. On the Enrollment Date of each Offering Period, each Eligible Employee participating in such Offering Period will be granted an option to purchase on each Exercise Date during such Offering Period (at the applicable Purchase Price) up to a number of shares of Common Stock determined by dividing such Eligible Employee’s Contributions accumulated prior to such Exercise Date and retained in the Eligible Employee’s account as of the Exercise Date by the applicable Purchase Price; provided that in no event will an Eligible Employee be permitted to purchase during each Purchase Period more than 10,000 shares of Common Stock (subject to any adjustment pursuant to Section 18) and provided further that such purchase will be subject to the limitations set forth in Sections 3(c) and 13. The Eligible Employee may accept the grant of such option (i) with respect to the first Offering Period by submitting a properly completed subscription agreement in accordance with the requirements of Section 5 on or before the last day of the Enrollment Window, and (ii) with respect to any subsequent Offering Period under the Plan, by electing to participate in the Plan in accordance with the requirements of Section 5. The Administrator may, for future Offering Periods, increase or decrease, in its absolute discretion, the maximum number of shares of Common Stock that an Eligible Employee may purchase during each Purchase Period of an Offering Period. Exercise of the option will occur as provided in Section 8, unless the Participant has withdrawn pursuant to Section 10. The option will expire on the last day of the Offering Period.
8. Exercise of Option.
(a) Unless a Participant withdraws from the Plan as provided in Section 10, his or her option for the purchase of shares of Common Stock will be exercised automatically on the Exercise Date, and the maximum number of full shares subject to the option will be purchased for such Participant at the applicable Purchase Price with the accumulated Contributions from his or her account. No fractional shares of Common Stock will be purchased; any Contributions accumulated in a Participant’s account, which are not sufficient to purchase a full share will be retained in the Participant’s account for the subsequent Purchase Period or Offering Period, subject to earlier withdrawal by the Participant as provided in Section 10. Any other funds left over in a Participant’s account after the Exercise Date will be returned to the Participant. During a Participant’s lifetime, a Participant’s option to purchase shares hereunder is exercisable only by him or her.
(b) If the Administrator determines that, on a given Exercise Date, the number of shares of Common Stock with respect to which options are to be exercised may exceed (i) the number of shares of Common Stock that were available for sale under the Plan on the
9
Enrollment Date of the applicable Offering Period, or (ii) the number of shares of Common Stock available for sale under the Plan on such Exercise Date, the Administrator may in its sole discretion (x) provide that the Company will make a pro rata allocation of the shares of Common Stock available for purchase on such Enrollment Date or Exercise Date, as applicable, in as uniform a manner as will be practicable and as it will determine in its sole discretion to be equitable among all Participants exercising options to purchase Common Stock on such Exercise Date, and continue all Offering Periods then in effect or (y) provide that the Company will make a pro rata allocation of the shares available for purchase on such Enrollment Date or Exercise Date, as applicable, in as uniform a manner as will be practicable and as it will determine in its sole discretion to be equitable among all participants exercising options to purchase Common Stock on such Exercise Date, and terminate any or all Offering Periods then in effect pursuant to Section 19. The Company may make a pro rata allocation of the shares available on the Enrollment Date of any applicable Offering Period pursuant to the preceding sentence, notwithstanding any authorization of additional shares for issuance under the Plan by the Company’s stockholders subsequent to such Enrollment Date.
9. Delivery. As soon as reasonably practicable after each Exercise Date on which a purchase of shares of Common Stock occurs, the Company will arrange the delivery to each Participant of the shares purchased upon exercise of his or her option in a form determined by the Administrator (in its sole discretion) and pursuant to rules established by the Administrator. The Company may permit or require that shares be deposited directly with a broker designated by the Company or to a designated agent of the Company, and the Company may utilize electronic or automated methods of share transfer. The Company may require that shares be retained with such broker or agent for a designated period of time and/or may establish other procedures to permit tracking of disqualifying dispositions of such shares. No Participant will have any voting, dividend, or other stockholder rights with respect to shares of Common Stock subject to any option granted under the Plan until such shares have been purchased and delivered to the Participant as provided in this Section 9.
10. Withdrawal.
(a) A Participant may withdraw all but not less than all the Contributions credited to his or her account and not yet used to exercise his or her option under the Plan at any time by (i) submitting to the Company’s stock administration office (or its designee) a written notice of withdrawal in the form determined by the Administrator for such purpose (which may be similar to the form attached hereto as Exhibit B), or (ii) following an electronic or other withdrawal procedure determined by the Administrator. All of the Participant’s Contributions credited to his or her account will be paid to such Participant promptly after receipt of notice of withdrawal and such Participant’s option for the Offering Period will be automatically terminated, and no further Contributions for the purchase of shares will be made for such Offering Period. If a Participant withdraws from an Offering Period, Contributions will not resume at the beginning of the succeeding Offering Period, unless the Participant re-enrolls in the Plan in accordance with the provisions of Section 5.
(b) A Participant’s withdrawal from an Offering Period will not have any effect upon his or her eligibility to participate in any similar plan that may hereafter be adopted by the Company or in succeeding Offering Periods that commence after the termination of the Offering Period from which the Participant withdraws.
10
11. Termination of Employment. Once a Participant ceases to be an Eligible Employee, for any reason, he or she will be deemed to have elected to withdraw from the Plan and the Contributions credited to such Participant’s account during the Offering Period but not yet used to purchase shares of Common Stock under the Plan will be returned to such Participant, and such Participant’s option will be automatically terminated. A Participant whose employment transfers between entities through a termination with an immediate rehire (with no break in service) by the Company or a Designated Company shall not be treated as terminated under the Plan; however, if a Participant transfers from an Offering under the 423 Component to the Non-423 Component, the exercise of the option shall be qualified under the 423 Component only to the extent it complies with Section 423 of the Code.
12. Interest. No interest will accrue on the Contributions of a participant in the Plan, except as may be required by Applicable Law, as determined by the Company, and if so required by the laws of a particular jurisdiction, shall apply to all Participants in the relevant Offering under the 423 Component, except to the extent otherwise permitted by U.S. Treasury Regulation Section 1.423‑2(f).
13. Stock.
(a) Subject to adjustment upon changes in capitalization of the Company as provided in Section 18 hereof, the maximum number of shares of Common Stock that will be made available for sale under the Plan will be 1,800,000 shares of Common Stock, plus an annual increase to be added on the first day of each Fiscal Year beginning with the 2016 Fiscal Year equal to the least of (i) 1,800,000 shares of Common Stock, (ii) one percent (1%) of the outstanding shares of Common Stock on such date, or (iii) an amount determined by the Administrator.
(b) Until the shares are issued (as evidenced by the appropriate entry on the books of the Company or of a duly authorized transfer agent of the Company), a Participant will only have the rights of an unsecured creditor with respect to such shares, and no right to vote or receive dividends or any other rights as a stockholder will exist with respect to such shares.
(c) Shares of Common Stock to be delivered to a Participant under the Plan will be registered in the name of the Participant or in the name of the Participant and his or her spouse.
14. Administration. The Plan will be administered by the Board or a Committee appointed by the Board, which Committee will be constituted to comply with Applicable Laws. The Administrator will have full and exclusive discretionary authority to construe, interpret and apply the terms of the Plan, to designate separate Offerings under the Plan, to designate Subsidiaries and Affiliates as participating in the 423 Component or Non-423 Component, to determine eligibility, to adjudicate all disputed claims filed under the Plan and to establish such procedures that it deems necessary for the administration of the Plan (including, without limitation, to adopt such procedures and sub-plans as are necessary or appropriate to permit the participation in the Plan by employees who are foreign nationals or employed outside the U.S., the terms of which sub-plans may take precedence over other provisions of this Plan, with the exception of Section 13(a) hereof, but unless otherwise superseded by the terms of such sub-plan, the provisions of this Plan shall govern the operation of such sub-plan). Unless otherwise determined by the Administrator, the
11
Employees eligible to participate in each sub-plan will participate in a separate Offering or in the Non-423 Component. Without limiting the generality of the foregoing, the Administrator is specifically authorized to adopt rules and procedures regarding eligibility to participate, the definition of Compensation, handling of Contributions, making of Contributions to the Plan (including, without limitation, in forms other than payroll deductions), establishment of bank or trust accounts to hold Contributions, payment of interest, conversion of local currency, obligations to pay payroll tax, determination of beneficiary designation requirements, withholding procedures and handling of stock certificates that vary with applicable local requirements. The Administrator also is authorized to determine that, to the extent permitted by U.S. Treasury Regulation Section 1.423‑2(f), the terms of an option granted under the Plan or an Offering to citizens or residents of a non-U.S. jurisdiction will be less favorable than the terms of options granted under the Plan or the same Offering to employees resident solely in the U.S. Every finding, decision and determination made by the Administrator will, to the full extent permitted by law, be final and binding upon all parties.
15. Transferability. Neither Contributions credited to a Participant’s account nor any rights with regard to the exercise of an option or to receive shares of Common Stock under the Plan may be assigned, transferred, pledged or otherwise disposed of in any way (other than by will, the laws of descent and distribution) by the Participant. Any such attempt at assignment, transfer, pledge or other disposition will be without effect, except that the Company may treat such act as an election to withdraw funds from an Offering Period in accordance with Section 10 hereof.
16. Use of Funds. The Company may use all Contributions received or held by it under the Plan for any corporate purpose, and the Company will not be obligated to segregate such Contributions except under Offerings or for Participants in the Non-423 Component for which Applicable Laws require that Contributions to the Plan by Participants be segregated from the Company’s general corporate funds and/or deposited with an independent third party. Until shares of Common Stock are issued, Participants will only have the rights of an unsecured creditor with respect to such shares.
17. Reports. Individual accounts will be maintained for each Participant in the Plan. Statements of account will be given to participating Eligible Employees at least annually, which statements will set forth the amounts of Contributions, the Purchase Price, the number of shares of Common Stock purchased and the remaining cash balance, if any.
12
18. | Adjustments, Dissolution, Liquidation, Merger or Change in Control. |
(a) Adjustments. In the event that any dividend or other distribution (whether in the form of cash, Common Stock, other securities, or other property), recapitalization, stock split, reverse stock split, reorganization, merger, consolidation, split-up, spin-off, combination, repurchase, or exchange of Common Stock or other securities of the Company, or other change in the corporate structure of the Company affecting the Common Stock occurs, the Administrator, in order to prevent dilution or enlargement of the benefits or potential benefits intended to be made available under the Plan, will, in such manner as it may deem equitable, adjust the number and class of Common Stock that may be delivered under the Plan, the Purchase Price per share and the number of shares of Common Stock covered by each option under the Plan that has not yet been exercised, and the numerical limits of Sections 7 and 13.
(b) Dissolution or Liquidation. In the event of the proposed dissolution or liquidation of the Company, any Offering Period then in progress will be shortened by setting a New Exercise Date, and will terminate immediately prior to the consummation of such proposed dissolution or liquidation, unless provided otherwise by the Administrator. The New Exercise Date will be before the date of the Company’s proposed dissolution or liquidation. The Administrator will notify each Participant in writing or electronically, prior to the New Exercise Date, that the Exercise Date for the Participant’s option has been changed to the New Exercise Date and that the Participant’s option will be exercised automatically on the New Exercise Date, unless prior to such date the Participant has withdrawn from the Offering Period as provided in Section 10 hereof.
(c) Merger or Change in Control. In the event of a merger or Change in Control, each outstanding option will be assumed or an equivalent option substituted by the successor corporation or a Parent or Subsidiary of the successor corporation. In the event that the successor corporation refuses to assume or substitute for the option, the Offering Period with respect to which such option relates will be shortened by setting a New Exercise Date on which such Offering Period shall end. The New Exercise Date will occur before the date of the Company’s proposed merger or Change in Control. The Administrator will notify each Participant in writing or electronically prior to the New Exercise Date, that the Exercise Date for the Participant’s option has been changed to the New Exercise Date and that the Participant’s option will be exercised automatically on the New Exercise Date, unless prior to such date the Participant has withdrawn from the Offering Period as provided in Section 10 hereof.
19. Amendment or Termination.
(a) The Administrator, in its sole discretion, may amend, suspend, or terminate the Plan, or any part thereof, at any time and for any reason. If the Plan is terminated, the Administrator, in its discretion, may elect to terminate all outstanding Offering Periods either immediately or upon completion of the purchase of shares of Common Stock on the next Exercise Date (which may be sooner than originally scheduled, if determined by the Administrator in its discretion), or may elect to permit Offering Periods to expire in accordance with their terms (and subject to any adjustment pursuant to Section 18). If the Offering Periods are terminated prior to expiration, all amounts then credited to Participants’ accounts that have not been used to purchase shares of Common Stock will be returned to the Participants (without interest thereon, except as
13
otherwise required under Applicable Laws, as further set forth in Section 12 hereof) as soon as administratively practicable.
(b) Without stockholder consent and without limiting Section 19(a), the Administrator will be entitled to change the Offering Periods or Purchase Periods, designate separate Offerings, limit the frequency and/or number of changes in the amount withheld during an Offering Period, establish the exchange ratio applicable to amounts withheld in a currency other than U.S. dollars, permit Contributions in excess of the amount designated by a Participant in order to adjust for delays or mistakes in the Company’s processing of properly completed Contribution elections, establish reasonable waiting and adjustment periods and/or accounting and crediting procedures to ensure that amounts applied toward the purchase of Common Stock for each Participant properly correspond with Contribution amounts, and establish such other limitations or procedures as the Administrator determines in its sole discretion advisable that are consistent with the Plan.
(c) In the event the Administrator determines that the ongoing operation of the Plan may result in unfavorable financial accounting consequences, the Administrator may, in its discretion and, to the extent necessary or desirable, modify, amend or terminate the Plan to reduce or eliminate such accounting consequence including, but not limited to:
(i) amending the Plan to conform with the safe harbor definition under the Financial Accounting Standards Board Accounting Standards Codification Topic 718 (or any successor thereto), including with respect to an Offering Period underway at the time;
(ii) altering the Purchase Price for any Offering Period or Purchase Period including an Offering Period or Purchase Period underway at the time of the change in Purchase Price;
(iii) shortening any Offering Period or Purchase Period by setting a New Exercise Date, including an Offering Period or Purchase Period underway at the time of the Administrator action;
(iv) reducing the maximum percentage of Compensation a Participant may elect to set aside as Contributions; and
(v) reducing the maximum number of Shares a Participant may purchase during any Offering Period or Purchase Period.
Such modifications or amendments will not require stockholder approval or the consent of any Plan Participants.
20. Notices. All notices or other communications by a Participant to the Company under or in connection with the Plan will be deemed to have been duly given when received in the form and manner specified by the Company at the location, or by the person, designated by the Company for the receipt thereof.
21. Conditions Upon Issuance of Shares. Shares of Common Stock will not be issued with respect to an option unless the exercise of such option and the issuance and delivery of such shares pursuant thereto will comply with all applicable provisions of law, domestic or foreign,
14
including, without limitation, the Securities Act of 1933, as amended, the Exchange Act, the rules and regulations promulgated thereunder, and the requirements of any stock exchange upon which the shares may then be listed, and will be further subject to the approval of counsel for the Company with respect to such compliance.
As a condition to the exercise of an option, the Company may require the person exercising such option to represent and warrant at the time of any such exercise that the shares are being purchased only for investment and without any present intention to sell or distribute such shares if, in the opinion of counsel for the Company, such a representation is required by any of the aforementioned applicable provisions of law.
22. Code Section 409A. The 423 Component of the Plan is exempt from the application of Code Section 409A and any ambiguities herein will be interpreted to so be exempt from Code Section 409A. In furtherance of the foregoing and notwithstanding any provision in the Plan to the contrary, if the Administrator determines that an option granted under the Plan may be subject to Code Section 409A or that any provision in the Plan would cause an option under the Plan to be subject to Code Section 409A, the Administrator may amend the terms of the Plan and/or of an outstanding option granted under the Plan, or take such other action the Administrator determines is necessary or appropriate, in each case, without the Participant’s consent, to exempt any outstanding option or future option that may be granted under the Plan from or to allow any such options to comply with Code Section 409A, but only to the extent any such amendments or action by the Administrator would not violate Code Section 409A. Notwithstanding the foregoing, the Company shall have no liability to a Participant or any other party if the option to purchase Common Stock under the Plan that is intended to be exempt from or compliant with Code Section 409A is not so exempt or compliant or for any action taken by the Administrator with respect thereto. The Company makes no representation that the option to purchase Common Stock under the Plan is compliant with Code Section 409A.
23. Term of Plan. The Plan will become effective upon the earlier to occur of its adoption by the Board or its approval by the stockholders of the Company. It will continue in effect for a term of twenty (20) years, unless sooner terminated under Section 19.
24. Stockholder Approval. The Plan will be subject to approval by the stockholders of the Company within twelve (12) months after the date the Plan is adopted by the Board. Such stockholder approval will be obtained in the manner and to the degree required under Applicable Laws.
25. Governing Law. The Plan shall be governed by, and construed in accordance with, the laws of the State of New York (except its choice-of-law provisions).
26. No Right to Employment. Participation in the Plan by a Participant shall not be construed as giving a Participant the right to be retained as an employee of the Company or a Subsidiary or Affiliate, as applicable. Furthermore, the Company or a Subsidiary or Affiliate may dismiss a Participant from employment at any time, free from any liability or any claim under the Plan.
15
27. Severability. If any provision of the Plan is or becomes or is deemed to be invalid, illegal, or unenforceable for any reason in any jurisdiction or as to any Participant, such invalidity, illegality or unenforceability shall not affect the remaining parts of the Plan, and the Plan shall be construed and enforced as to such jurisdiction or Participant as if the invalid, illegal or unenforceable provision had not been included.
28. Compliance with Applicable Laws. The terms of this Plan are intended to comply with all Applicable Laws and will be construed accordingly.
16
EXHIBIT A
ON DECK CAPITAL, INC.
2014 EMPLOYEE STOCK PURCHASE PLAN
SUBSCRIPTION AGREEMENT
_____ Original Application Offering Date:
_____ Change in Payroll Deduction Rate
1.____________________ hereby elects to participate in the On Deck Capital, Inc. 2014 Employee Stock Purchase Plan (the “Plan”) and subscribes to purchase shares of the Company’s Common Stock in accordance with this Subscription Agreement and the Plan.
2. I hereby authorize payroll deductions from each paycheck in the amount of ____% of my Compensation on each payday (from 0 to 15%) during the Offering Period in accordance with the Plan. (Please note that no fractional percentages are permitted.)
3. I understand that said payroll deductions will be accumulated for the purchase of shares of Common Stock at the applicable Purchase Price determined in accordance with the Plan. I understand that if I do not withdraw from an Offering Period, any accumulated payroll deductions will be used to automatically exercise my option and purchase Common Stock under the Plan.
4. I have received a copy of the complete Plan and its accompanying prospectus. I understand that my participation in the Plan is in all respects subject to the terms of the Plan.
5. Shares of Common Stock purchased for me under the Plan should be issued in the name(s) of _____________ (Eligible Employee or Eligible Employee and Spouse only).
6. I understand that if I dispose of any shares received by me pursuant to the Plan within two (2) years after the Offering Date (the first day of the Offering Period during which I purchased such shares) or one (1) year after the Exercise Date, I will be treated for federal income tax purposes as having received ordinary income at the time of such disposition in an amount equal to the excess of the fair market value of the shares at the time such shares were purchased by me over the price that I paid for the shares. I hereby agree to notify the Company in writing within thirty (30) days after the date of any disposition of my shares and I will make adequate provision for Federal, state or other tax withholding obligations, if any, which arise upon the disposition of the Common Stock. The Company may, but will not be obligated to, withhold from my compensation the amount necessary to meet any applicable withholding obligation including any withholding necessary to make available to the Company any tax deductions or benefits attributable to sale or early disposition of Common Stock by me. If I dispose of such shares at any time after the expiration of the two (2)-year and one (1)-year holding periods, I understand that I will be treated for federal income tax purposes as having received income only at the time of such disposition, and that such income will be taxed as ordinary income only to the extent of an amount equal to the lesser of (a) the excess of the fair market value of the shares at the time of such disposition over the purchase price which I
17
paid for the shares, or (b) 15% of the fair market value of the shares on the first day of the Offering Period. The remainder of the gain, if any, recognized on such disposition will be taxed as capital gain.
7. I hereby agree to be bound by the terms of the Plan. The effectiveness of this Subscription Agreement is dependent upon my eligibility to participate in the Plan.
Employee’s Social
Security Number:
Employee’s Address:
I UNDERSTAND THAT THIS SUBSCRIPTION AGREEMENT WILL REMAIN IN EFFECT THROUGHOUT SUCCESSIVE OFFERING PERIODS UNLESS TERMINATED BY ME.
Dated:
Signature of Employee
18
EXHIBIT B
ON DECK CAPITAL, INC.
2014 EMPLOYEE STOCK PURCHASE PLAN
NOTICE OF WITHDRAWAL
The undersigned participant in the Offering Period of the On Deck Capital, Inc. 2014 Employee Stock Purchase Plan that began on ____________, ______ (the “Enrollment Date”) hereby notifies the Company that he or she hereby withdraws from the Offering Period. He or she hereby directs the Company to pay to the undersigned as promptly as practicable all the payroll deductions credited to his or her account with respect to such Offering Period. The undersigned understands and agrees that his or her option for such Offering Period will be automatically terminated. The undersigned understands further that no further payroll deductions will be made for the purchase of shares in the current Offering Period and the undersigned will be eligible to participate in succeeding Offering Periods only by delivering to the Company a new Subscription Agreement.
Name and Address of Participant:
Signature:
Date:
19
Exhibit 31.1
CERTIFICATION OF CHIEF EXECUTIVE OFFICER PURSUANT TO
SECURITIES EXCHANGE ACT RULES 13a-14(a) AND 15d-14(a), AS ADOPTED PURSUANT
TO SECTION 302 OF THE SARBANES-OXLEY ACT OF 2002
I, Noah Breslow, certify that:
1. | I have reviewed this Quarterly Report on Form 10-Q of On Deck Capital, Inc.; |
2. | Based on my knowledge, this report does not contain any untrue statement of a material fact or omit to state a material fact necessary to make the statements made, in light of the circumstances under which such statements were made, not misleading with respect to the period covered by this report; |
3. | Based on my knowledge, the financial statements, and other financial information included in this report, fairly present in all material respects the financial condition, results of operations and cash flows of the registrant as of, and for, the periods presented in this report; |
4. | The registrant's other certifying officer and I are responsible for establishing and maintaining disclosure controls and procedures (as defined in Exchange Act Rules 13a-15(e) and 15d-15(e)) and internal control over financial reporting (as defined in Exchange Act Rules 13a-15(f) and 15d-15(f)) for the registrant and have: |
a. | Designed such disclosure controls and procedures, or caused such disclosure controls and procedures to be designed under our supervision, to ensure that material information relating to the registrant, including its consolidated subsidiaries, is made known to us by others within those entities, particularly during the period in which this report is being prepared; |
b. | Designed such internal control over financial reporting, or caused such internal control over financial reporting to be designed under our supervision, to provide reasonable assurance regarding the reliability of financial reporting and the preparation of financial statements for external purposes in accordance with generally accepted accounting principles; |
c. | Evaluated the effectiveness of the registrant's disclosure controls and procedures and presented in this report our conclusions about the effectiveness of the disclosure controls and procedures, as of the end of the period covered by this report based on such evaluation; and |
d. | Disclosed in this report any change in the registrant's internal control over financial reporting that occurred during the registrant's most recent fiscal quarter (the registrant's fourth fiscal quarter in the case of an annual report) that has materially affected, or is reasonably likely to materially affect, the registrant's internal control over financial reporting; and |
5. | The registrant's other certifying officer and I have disclosed, based on our most recent evaluation of internal control over financial reporting, to the registrant's auditors and the audit committee of the registrant's board of directors (or persons performing the equivalent functions): |
a. | All significant deficiencies and material weaknesses in the design or operation of internal control over financial reporting which are reasonably likely to adversely affect the registrant's ability to record, process, summarize and report financial information; and |
b. | Any fraud, whether or not material, that involves management or other employees who have a significant role in the registrant's internal control over financial reporting. |
Date: August 7, 2019
/s/ Noah Breslow | |
Noah Breslow Chief Executive Officer | |
Exhibit 31.2
CERTIFICATION OF CHIEF FINANCIAL OFFICER PURSUANT TO
SECURITIES EXCHANGE ACT RULES 13a-14(a) AND 15d-14(a), AS ADOPTED PURSUANT
TO SECTION 302 OF THE SARBANES-OXLEY ACT OF 2002
I, Kenneth A. Brause, certify that:
1. | I have reviewed this Quarterly Report on Form 10-Q of On Deck Capital, Inc.; |
2. | Based on my knowledge, this report does not contain any untrue statement of a material fact or omit to state a material fact necessary to make the statements made, in light of the circumstances under which such statements were made, not misleading with respect to the period covered by this report; |
3. | Based on my knowledge, the financial statements, and other financial information included in this report, fairly present in all material respects the financial condition, results of operations and cash flows of the registrant as of, and for, the periods presented in this report; |
4. | The registrant's other certifying officer and I are responsible for establishing and maintaining disclosure controls and procedures (as defined in Exchange Act Rules 13a-15(e) and 15d-15(e)) and internal control over financial reporting (as defined in Exchange Act Rules 13a-15(f) and 15d-15(f)) for the registrant and have: |
a. | Designed such disclosure controls and procedures, or caused such disclosure controls and procedures to be designed under our supervision, to ensure that material information relating to the registrant, including its consolidated subsidiaries, is made known to us by others within those entities, particularly during the period in which this report is being prepared; |
b. | Designed such internal control over financial reporting, or caused such internal control over financial reporting to be designed under our supervision, to provide reasonable assurance regarding the reliability of financial reporting and the preparation of financial statements for external purposes in accordance with generally accepted accounting principles; |
c. | Evaluated the effectiveness of the registrant's disclosure controls and procedures and presented in this report our conclusions about the effectiveness of the disclosure controls and procedures, as of the end of the period covered by this report based on such evaluation; and |
d. | Disclosed in this report any change in the registrant's internal control over financial reporting that occurred during the registrant's most recent fiscal quarter (the registrant's fourth fiscal quarter in the case of an annual report) that has materially affected, or is reasonably likely to materially affect, the registrant's internal control over financial reporting; and |
5. | The registrant's other certifying officer and I have disclosed, based on our most recent evaluation of internal control over financial reporting, to the registrant's auditors and the audit committee of the registrant's board of directors (or persons performing the equivalent functions): |
a. | All significant deficiencies and material weaknesses in the design or operation of internal control over financial reporting which are reasonably likely to adversely affect the registrant's ability to record, process, summarize and report financial information; and |
b. | Any fraud, whether or not material, that involves management or other employees who have a significant role in the registrant's internal control over financial reporting. |
Date: August 7, 2019
/s/ Kenneth A. Brause | |
Kenneth A. Brause Chief Financial Officer | |
Exhibit 32.1
CERTIFICATION OF CHIEF EXECUTIVE OFFICER PURSUANT TO
18 U.S.C. SECTION 1350, AS ADOPTED PURSUANT TO
SECTION 906 OF THE SARBANES-OXLEY ACT OF 2002
I, Noah Breslow, hereby certify, as of the date hereof, pursuant to 18 U.S.C. Section 1350, as adopted pursuant to Section 906 of the Sarbanes-Oxley Act of 2002, in my capacity as Chief Executive Officer of On Deck Capital, Inc. (the "Company"), that, to my knowledge, the Quarterly Report of the Company on Form 10-Q for the fiscal quarter ended June 30, 2019 as filed with the Securities and Exchange Commission (the "Report") fully complies with the requirements of Section 13(a) or 15(d) of the Securities Exchange Act of 1934 and that the information contained in the Report fairly presents, in all material respects, the financial condition and results of operations of the Company.
Date: August 7, 2019
/s/ Noah Breslow | |
Noah Breslow Chief Executive Officer | |
Exhibit 32.2
CERTIFICATION OF CHIEF FINANCIAL OFFICER PURSUANT TO
18 U.S.C. SECTION 1350, AS ADOPTED PURSUANT TO
SECTION 906 OF THE SARBANES-OXLEY ACT OF 2002
I, Kenneth A. Brause, hereby certify, as of the date hereof, pursuant to 18 U.S.C. Section 1350, as adopted pursuant to Section 906 of the Sarbanes-Oxley Act of 2002, in my capacity as Chief Financial Officer of On Deck Capital, Inc. (the "Company"), that, to my knowledge, the Quarterly Report of the Company on Form 10-Q for the fiscal quarter ended June 30, 2019 as filed with the Securities and Exchange Commission (the "Report") fully complies with the requirements of Section 13(a) or 15(d) of the Securities Exchange Act of 1934 and that the information contained in the Report fairly presents, in all material respects, the financial condition and results of operations of the Company.
Date: August 7, 2019
/s/ Kenneth A. Brause | |
Kenneth A. Brause Chief Financial Officer | |