
Form 8-K TPI COMPOSITES, INC For: Aug 07
UNITED STATES
SECURITIES AND EXCHANGE COMMISSION
Washington, D.C. 20549
_____________________
Form 8-K
_____________________
CURRENT REPORT
Pursuant to Section 13 or 15(d) of the Securities Exchange Act of 1934
Date of Report (Date of earliest event Reported): August 7, 2019

TPI Composites, Inc.
(Exact Name of Registrant as Specified in Charter)
| Delaware | 001-37839 | 20-1590775 |
| (State or Other Jurisdiction of Incorporation) | (Commission File Number) | (I.R.S. Employer Identification Number) |
| 8501 N. Scottsdale Rd, Gainey Center II, Suite 100, Scottsdale, Arizona 85253 |
| (Address of Principal Executive Offices) (Zip Code) |
480-305-8910
(Registrant's telephone number, including area code)
Not applicable
(Former name or former address, if changed since last report)
| Check the appropriate box below if the Form 8-K filing is intended to simultaneously satisfy the filing obligation of the registrant under any of the following provisions: | ||
| [ ] | Written communications pursuant to Rule 425 under the Securities Act (17 CFR 230.425) | |
| [ ] | Soliciting material pursuant to Rule 14a-12 under the Exchange Act (17 CFR 240.14a-12) | |
| [ ] | Pre-commencement communications pursuant to Rule 14d-2(b) under the Exchange Act (17 CFR 240.14d-2(b)) | |
| [ ] | Pre-commencement communications pursuant to Rule 13e-4(c) under the Exchange Act (17 CFR 240.13e-4(c)) | |
Securities registered pursuant to Section 12(b) of the Act:
| Title of each class | Trading Symbol(s) | Name of each exchange on which registered |
| Common Stock, par value $0.01 | TPIC | NASDAQ Global Market |
Indicate by check mark whether the registrant is an emerging growth company as defined in Rule 405 of the Securities Act of 1933 (17 CFR §230.405) or Rule 12b-2 of the Securities Exchange Act of 1934 (17 CFR §240.12b-2). Emerging growth company [ X ]
If an emerging growth company, indicate by check mark if the registrant has elected not to use the extended transition period for complying with any new or revised financial accounting standards provided pursuant to Section 13(a) of the Exchange Act. [ X ]
Item 2.02. Results of Operations and Financial Condition.
On August 7, 2019, TPI Composites, Inc. (the Company) issued a press release announcing its financial results for the three months ended June 30, 2019. A copy of the Company’s press release is furnished herewith as Exhibit 99.1 to this current report on Form 8-K and is incorporated by reference herein. The Company also posted a presentation to its website at www.tpicomposites.com under the tab “Investors” providing information regarding its results of operations and financial condition for the three months ended June 30, 2019. The information contained in the presentation is incorporated by reference herein. The presentation is being furnished herewith as Exhibit 99.2 to this current report on Form 8-K. The Company’s website and the information contained therein is not part of this disclosure. The information in Item 2.02 of this current report on Form 8-K (including the exhibits attached hereto) is being furnished and shall not be deemed “filed” for the purposes of Section 18 of the Securities Exchange Act of 1934, as amended, or otherwise subject to the liabilities of that Section. The information in Item 2.02 of this current report on Form 8-K (including the exhibits attached hereto) shall not be incorporated by reference into any registration statement or other document pursuant to the Securities Act of 1933, as amended.
Item 9.01. Financial Statements and Exhibits.
(d) Exhibits
SIGNATURE
Pursuant to the requirements of the Securities Exchange Act of 1934, the registrant has duly caused this report to be signed on its behalf by the undersigned hereunto duly authorized.
| TPI Composites, Inc. | ||
| Date: August 7, 2019 | By: | /s/ Bryan Schumaker |
| Bryan Schumaker | ||
| Chief Financial Officer | ||
EXHIBIT 99.1
TPI Composites, Inc. Announces Second Quarter 2019 Earnings Results
SCOTTSDALE, Ariz., Aug. 07, 2019 (GLOBE NEWSWIRE) -- TPI Composites, Inc. (Nasdaq: TPIC), the only independent manufacturer of composite wind blades with a global footprint, today reported financial results for the second quarter ended June 30, 2019.
Highlights
For the quarter ended June 30, 2019:
- Net sales of $330.8 million
- Total billings of $304.5 million
- Net income of $1.8 million or $0.05 per share
- EBITDA of $11.7 million
- Adjusted EBITDA of $19.5 million
| KPIs | Q2'19 | Q2'18 | |||
| Sets1 | 716 | 576 | |||
| Estimated megawatts2 | 2,029 | 1,544 | |||
| Utilization3 | 70 | % | 72 | % | |
| Dedicated manufacturing lines4 | 54 | 52 | |||
| Manufacturing lines installed5 | 50 | 40 | |||
| Manufacturing lines in operation6 | 30 | 26 | |||
| Manufacturing lines in startup7 | 13 | 7 | |||
| Manufacturing lines in transition8 | 7 | 7 | |||
- Number of wind blade sets (which consist of three wind blades) invoiced worldwide during the period.
- Estimated megawatts of energy capacity to be generated by wind blade sets invoiced during the period.
- Utilization represents the percentage of wind blades invoiced during the period compared to the total potential capacity of wind blade manufacturing lines installed during the period.
- Number of wind blade manufacturing lines that are dedicated to our customers under long-term supply agreements at the end of the period.
- Number of wind blade manufacturing lines installed and either in operation, startup or transition at the end of the period.
- Number of wind blade manufacturing lines in operation represents the number of wind blade manufacturing lines installed less the number of manufacturing lines in startup and in transition.
- Number of wind blade manufacturing lines in a startup phase during the pre-production and production ramp-up period.
- Number of wind blade manufacturing lines that were being transitioned to a new wind blade model during the period.
“We delivered solid operational and financial performance in the second quarter through our continued focus on execution, operating efficiency and commitment to our customer and supplier relationships,” said Steve Lockard, CEO of TPI Composites. “During the quarter, we successfully mitigated challenges we encountered earlier this year in an efficient and cost-effective manner, and we continue to grow our infrastructure, improve our operations and strengthen our team and capabilities. Specifically, we stabilized the workforce and production in Matamoros, completed negotiations to sell the remaining Senvion blades directly to their customer, while also mutually agreeing with Senvion to terminate our two-line supply agreement, and made significant progress in our consolidation and restructuring efforts. We performed and recovered well in the second quarter from the challenges we encountered in the first quarter, and we remain confident and committed to our overall business model and strategy.”
“Early in July we announced that we acquired certain intellectual property and hired a team of engineering resources from the EUROS group, based in Berlin, Germany. This team of approximately 20 technical experts focuses on blade design, tooling, materials and process technology development, which will strengthen our technical capabilities in support of our global operations and growth. Additionally, last week we reached an agreement with Nordex to transition multiple existing lines in Turkey to longer blades and at the same time extended the contract by two years through 2022. These changes will result in an increase to our potential revenue under contract of approximately $180 million over the new term of the deal.”
“The fundamentals of our business remain strong as we continue to partner with our customers to support their global production needs. On the EV front, we are investing heavily in our relationship with Proterra, and we continue to deploy resources to accelerate our diversification efforts with existing and new development programs. As it relates to our wind business, we continue to invest alongside our customers through cost sharing and collaborative teamwork to keep pace with the rapid expansion and development anticipated over the next several years. As LCOE continues to trend down, the strong global wind market and growing demand for decarbonization give us confidence in the underlying long-term economics of our business and the wind industry, despite the near-term volatility increased transitions may create in our quarterly and annual results.”
“Due to a faster pace of transitions than originally anticipated for 2020 and the resulting impact on contribution margin and transition costs, we are revising our 2020 net sales target to $1.6 billion to $1.8 billion from $1.7 billion to $1.9 billion and our 2020 adjusted EBITDA target to $140 million to $160 million from $170 million to $190 million. However, with 52 wind blade lines currently under contract and more expected to follow as the tariff and trade picture clears up, a growing average MW per year per line of about 300MW and ramping of 18 new lines globally, we are progressing well toward our goal of establishing 18GW of global wind blade capacity over the next few years. Even with ongoing blade model transitions, running at about 80% utilization we expect to produce about 15GW of blades per year and achieve our target to double our wind related revenue to $2 billion per year. With an estimated 70GW global combined onshore and offshore wind market we expect to have 20% to 25% global market share,” concluded Mr. Lockard.
Second Quarter 2019 Financial Results
Net sales for the quarter increased by $100.2 million or 43.4% to $330.8 million compared to $230.6 million in the same period in 2018. Total billings increased by $67.1 million or 28.3% to $304.5 million for the three months ended June 30, 2019 compared to $237.4 million in the same period in 2018. Net sales of wind blades were $301.8 million for the quarter as compared to $206.4 million in the same period in 2018. The increase was primarily driven by a 23% increase in the number of wind blades produced and a higher average sales price due to the mix of wind blade models produced year over year. The impact of the fluctuating U.S. dollar against the Euro in our Turkey operations and the Chinese Renminbi in our China operations on consolidated net sales and total billings for the three months ended June 30, 2019 was a net decrease of 2.7% and 2.9%, respectively, as compared to 2018.
Total cost of goods sold for the quarter was $308.2 million and included $14.7 million related to 13 lines in startup in our plants in Mexico and China and the startup of new wind blade models for a customer in Turkey and $8.2 million related to the seven lines in transition during the quarter. This compares to total cost of goods sold of $215.6 million for the same period in 2018, which included $17.3 million related to startup costs in our new plants in Turkey and Mexico, the startup costs related to a new customer in Taicang, China and transition costs related to the seven lines in transition during the quarter. Cost of goods sold as a percentage of net sales remained consistent during the three months ended June 30, 2019 as compared to the same period in 2018, driven primarily by the impact of savings in raw material costs and foreign currency fluctuations, offset by the extended startup of our Newton, Iowa transportation facility, a significant increase in underutilized labor in Matamoros, Mexico and a $5.6 million increase in startup and transition costs. The impact of the fluctuating U.S. dollar against the Euro, Turkish Lira, Chinese Renminbi and Mexican Peso decreased consolidated cost of goods sold by 5.0% for three months ended June 30, 2019 as compared to 2018.
General and administrative expenses for the three months ended June 30, 2019 totaled $9.2 million, down from $11.0 million for the same period in 2018. The decrease was primarily driven by lower incentive compensation and a reduction in the performance assumptions related to certain of our share-based plans. As a percentage of net sales, general and administrative expenses were 2.8% for the three months ended June 30, 2019, down from 4.8% in the same period in 2018.
Net income for the quarter was $1.8 million as compared to a net loss of $4.1 million in the same period in 2018. The increase was primarily due to the reasons set forth above. Diluted earnings per share was $0.05 for the three months ended June 30, 2019, compared to a net loss per share of $0.12 for the three months ended June 30, 2018.
EBITDA for the quarter increased to $11.7 million, compared to $10.1 million during the same period in 2018. Adjusted EBITDA for the quarter increased to $19.5 million compared to $13.5 million during the same period in 2018. Adjusted EBITDA margin increased slightly to 5.9% compared to 5.8% during the same period in 2018.
Capital expenditures were $19.0 million for the quarter compared to $30.6 million during the same period in 2018. Our capital expenditures have been primarily related to machinery and equipment for new facilities and expansion or improvements at existing facilities.
We ended the quarter with $58.7 million of cash and cash equivalents and net debt was $91.0 million as compared to net debt of $53.2 million at December 31, 2018, and we had negative free cash flow during the quarter of $8.5 million.
2019 Guidance:
- Net sales and total billings of between $1.45 billion and $1.5 billion
- Adjusted EBITDA of between $80 million and $85 million
- Loss per share of between $0.18 and $0.23
- Sets invoiced of between 3,180 and 3,220
- Average sales price per blade of between $135,000 and $140,000
- Estimated megawatts of sets delivered of approximately 9,300 to 9,400
- Dedicated manufacturing lines at year end to be between 52 and 55
- Manufacturing lines installed at year end to be 48
- Manufacturing lines in operation at year end to be between 24 to 26
- Manufacturing lines in startup during the year to be approximately 14
- Manufacturing lines in transition during the year to be approximately 10
- Line utilization (based on 50 lines in Q1 & Q2 and 48 lines in Q3 & Q4) of approximately 80%
- Startup costs of between $47 million and $49 million
- Transition costs of between $19 million and $21 million
- Capital expenditures to be between $95 million and $100 million (approx. 85% growth related)
- Depreciation and amortization of between $37 million and $38 million
- Interest expense of between $8.0 million and $8.5 million
- Share-based compensation expense of between $7 million and $8 million
Conference Call and Webcast Information
TPI Composites will host an investor conference call this afternoon, Wednesday, August 7, 2019 at 5:00pm ET. Interested parties are invited to listen to the conference call which can be accessed live over the phone by dialing 1-877-407-9208, or for international callers, 1-201-493-6784. A replay will be available two hours after the call and can be accessed by dialing 1-844-512-2921, or for international callers, 1-412-317-6671. The passcode for the live call and the replay is 13692478. The replay will be available until August 14, 2019. Interested investors and other parties may also listen to a simultaneous webcast of the conference call by logging onto the Investors section of the Company’s website at www.tpicomposites.com. The online replay will be available for a limited time beginning immediately following the call.
About TPI Composites, Inc.
TPI Composites, Inc. is the only independent manufacturer of composite wind blades for the wind energy market with a global manufacturing footprint. TPI delivers high-quality, cost-effective composite solutions through long term relationships with leading OEMs in the wind and transportation markets. TPI is headquartered in Scottsdale, Arizona and operates factories in the U.S., China, Mexico, Turkey and India. TPI operates additional engineering development centers in Denmark and Germany.
Forward-Looking Statements
This release contains forward-looking statements which are made pursuant to safe harbor provisions of the Private Securities Litigation Reform Act of 1995. These forward-looking statements include statements, among other things, concerning: effects on our financial statements and our financial outlook; our business strategy, including anticipated trends and developments in and management plans for our business and the wind industry and other markets in which we operate; our projected annual revenue growth; competition; future financial results, operating results, revenues, gross margin, operating expenses, profitability, products, projected costs, warranties, our ability to improve our operating margins, and capital expenditures. These forward-looking statements are often characterized by the use of words such as “estimate,” “expect,” “anticipate,” “project,” “plan,” “intend,” “seek,” “believe,” “forecast,” “foresee,” “likely,” “may,” “should,” “goal,” “target,” “might,” “will,” “could,” “predict,” “continue” and the negative or plural of these words and other comparable terminology. Forward-looking statements are only predictions based on our current expectations and our projections about future events. You should not place undue reliance on these forward-looking statements. We undertake no obligation to update any of these forward-looking statements for any reason. These forward-looking statements involve known and unknown risks, uncertainties and other factors that may cause our actual results, levels of activity, performance or achievements to differ materially from those expressed or implied by these statements. These factors include, but are not limited to, the matters discussed in “Risk Factors,” in our Annual Report on Form 10-K and other reports that we will file with the SEC.
Non-GAAP Definitions
This press release includes unaudited non-GAAP financial measures, including total billings, EBITDA, adjusted EBITDA, net cash/debt and free cash flow. We define total billings as total amounts billed from products and services that we are entitled to payment under the terms of our long-term supply agreements or other contractual arrangements. We define EBITDA as net income/loss plus interest expense (including losses on extinguishment of debt and net of interest income), income taxes and depreciation and amortization. We define adjusted EBITDA as EBITDA plus share-based compensation expense plus or minus any gains or losses from foreign currency remeasurement, plus or minus any gains or losses from the sale of assets. We define net cash/debt as the total unrestricted cash and cash equivalents less the total principal amount of debt outstanding. We define free cash flow as net cash flow generated from operating activities less capital expenditures. We present non-GAAP measures when we believe that the additional information is useful and meaningful to investors. Non-GAAP financial measures do not have any standardized meaning and are therefore unlikely to be comparable to similar measures presented by other companies. The presentation of non-GAAP financial measures is not intended to be a substitute for, and should not be considered in isolation from, the financial measures reported in accordance with GAAP. See below for a reconciliation of certain non-GAAP financial measures to the comparable GAAP measures as well as our Investor Presentation which can be found in the Investors section at www.tpicomposites.com.
Investor Relations
480-315-8742
[email protected]
| TPI COMPOSITES, INC. AND SUBSIDIARIES | |||||||||||||||
| TABLE ONE - CONDENSED CONSOLIDATED STATEMENTS OF OPERATIONS | |||||||||||||||
| (UNAUDITED) | |||||||||||||||
| Three Months Ended June 30, | Six Months Ended June 30, | ||||||||||||||
| (in thousands, except per share data) | 2019 | 2018 | 2019 | 2018 | |||||||||||
| Net sales | $ | 330,771 | $ | 230,610 | $ | 630,551 | $ | 484,591 | |||||||
| Cost of sales | 285,319 | 198,235 | 568,357 | 409,223 | |||||||||||
| Startup and transition costs | 22,901 | 17,324 | 41,079 | 32,059 | |||||||||||
| Total cost of goods sold | 308,220 | 215,559 | 609,436 | 441,282 | |||||||||||
| Gross profit | 22,551 | 15,051 | 21,115 | 43,309 | |||||||||||
| General and administrative expenses | 9,208 | 10,989 | 17,193 | 22,152 | |||||||||||
| Realized loss on sale of assets | 4,972 | - | 7,207 | - | |||||||||||
| Restructuring charges | 3,874 | - | 3,874 | - | |||||||||||
| Income (loss) from operations | 4,497 | 4,062 | (7,159 | ) | 21,157 | ||||||||||
| Other income (expense): | |||||||||||||||
| Interest income | 31 | 43 | 82 | 84 | |||||||||||
| Interest expense | (2,274 | ) | (2,715 | ) | (4,273 | ) | (6,053 | ) | |||||||
| Loss on extinguishment of debt | - | (3,397 | ) | - | (3,397 | ) | |||||||||
| Realized loss on foreign currency remeasurement | (967 | ) | (765 | ) | (4,769 | ) | (4,776 | ) | |||||||
| Miscellaneous income | 1,016 | 674 | 1,718 | 1,492 | |||||||||||
| Total other expense | (2,194 | ) | (6,160 | ) | (7,242 | ) | (12,650 | ) | |||||||
| Income (loss) before income taxes | 2,303 | (2,098 | ) | (14,401 | ) | 8,507 | |||||||||
| Income tax (provision) benefit | (475 | ) | (1,955 | ) | 4,125 | (3,912 | ) | ||||||||
| Net income (loss) | $ | 1,828 | $ | (4,053 | ) | $ | (10,276 | ) | $ | 4,595 | |||||
| Weighted-average common shares outstanding: | |||||||||||||||
| Basic | 35,033 | 34,164 | 34,970 | 34,107 | |||||||||||
| Diluted | 36,369 | 34,164 | 34,970 | 35,766 | |||||||||||
| Net income (loss) per common share: | |||||||||||||||
| Basic | $ | 0.05 | $ | (0.12 | ) | $ | (0.29 | ) | $ | 0.13 | |||||
| Diluted | $ | 0.05 | $ | (0.12 | ) | $ | (0.29 | ) | $ | 0.13 | |||||
| Non-GAAP Measures (unaudited): | |||||||||||||||
| Total billings | $ | 304,469 | $ | 237,355 | $ | 583,940 | $ | 461,056 | |||||||
| EBITDA | $ | 11,671 | $ | 10,101 | $ | 7,574 | $ | 31,075 | |||||||
| Adjusted EBITDA | $ | 19,547 | $ | 13,477 | $ | 22,472 | $ | 40,850 | |||||||
| TPI COMPOSITES, INC. AND SUBSIDIARIES | |||||||
| TABLE TWO - CONDENSED CONSOLIDATED BALANCE SHEETS | |||||||
| (UNAUDITED) | |||||||
| June 30, | December 31, | ||||||
| (in thousands) | 2019 | 2018 | |||||
| Current assets: | |||||||
| Cash and cash equivalents | $ | 58,664 | $ | 85,346 | |||
| Restricted cash | 2,122 | 3,555 | |||||
| Accounts receivable | 154,191 | 176,815 | |||||
| Contract assets | 157,315 | 116,708 | |||||
| Prepaid expenses and other current assets | 46,740 | 26,038 | |||||
| Inventories | 9,738 | 5,735 | |||||
| Total current assets | 428,770 | 414,197 | |||||
| Noncurrent assets: | |||||||
| Property, plant, and equipment, net | 181,416 | 159,423 | |||||
| Operating lease right of use assets | 130,512 | - | |||||
| Other noncurrent assets | 47,262 | 31,235 | |||||
| Total assets | $ | 787,960 | $ | 604,855 | |||
| Current liabilities: | |||||||
| Accounts payable and accrued expenses | $ | 239,909 | $ | 199,078 | |||
| Accrued warranty | 42,834 | 36,765 | |||||
| Current maturities of long-term debt | 33,780 | 27,058 | |||||
| Current operating lease liabilities | 17,362 | - | |||||
| Contract liabilities | 2,596 | 7,143 | |||||
| Total current liabilities | 336,481 | 270,044 | |||||
| Noncurrent liabilities: | |||||||
| Long-term debt, net of debt issuance costs and | |||||||
| current maturities | 115,157 | 110,565 | |||||
| Noncurrent operating lease liabilities | 119,273 | - | |||||
| Other noncurrent liabilities | 5,017 | 3,289 | |||||
| Total liabilities | 575,928 | 383,898 | |||||
| Total stockholders' equity | 212,032 | 220,957 | |||||
| Total liabilities and stockholders' equity | $ | 787,960 | $ | 604,855 | |||
| Non-GAAP Measure (unaudited): | |||||||
| Net debt | $ | (91,048 | ) | $ | (53,155 | ) | |
| TPI COMPOSITES, INC. AND SUBSIDIARIES | ||||||||||||||||
| TABLE THREE - CONDENSED CONSOLIDATED STATEMENTS OF CASH FLOWS | ||||||||||||||||
| (UNAUDITED) | ||||||||||||||||
| Three Months Ended June 30, | Six Months Ended June 30, | |||||||||||||||
| (in thousands) | 2019 | 2018 | 2019 | 2018 | ||||||||||||
| Net cash provided by (used in) operating activities | $ | 10,573 | $ | 5,567 | $ | (1,518 | ) | $ | 2,535 | |||||||
| Net cash used in investing activities | (19,030 | ) | (30,596 | ) | (37,739 | ) | (42,310 | ) | ||||||||
| Net cash provided by (used in) financing activities | (10,629 | ) | 2,202 | 10,446 | 6,692 | |||||||||||
| Impact of foreign exchange rates on cash, cash equivalents and restricted cash | (297 | ) | (839 | ) | 696 | (453 | ) | |||||||||
| Cash, cash equivalents and restricted cash, beginning of period | 80,644 | 142,567 | 89,376 | 152,437 | ||||||||||||
| Cash, cash equivalents and restricted cash, end of period | $ | 61,261 | $ | 118,901 | $ | 61,261 | $ | 118,901 | ||||||||
| Non-GAAP Measure (unaudited): | ||||||||||||||||
| Free cash flow | $ | (8,457 | ) | $ | (25,029 | ) | $ | (39,257 | ) | $ | (39,775 | ) | ||||
| TPI COMPOSITES, INC. AND SUBSIDIARIES | |||||||||||||||
| TABLE FOUR - RECONCILIATION OF NON-GAAP MEASURES | |||||||||||||||
| (UNAUDITED) | |||||||||||||||
| Total billings is reconciled as follows: | Three Months Ended June 30, | Six Months Ended June 30, | |||||||||||||
| (in thousands) | 2019 | 2018 | 2019 | 2018 | |||||||||||
| Net sales | $ | 330,771 | $ | 230,610 | $ | 630,551 | $ | 484,591 | |||||||
| Change in gross contract assets | (26,691 | ) | (1,356 | ) | (43,747 | ) | (25,752 | ) | |||||||
| Foreign exchange impact | 389 | 8,101 | (2,864 | ) | 2,217 | ||||||||||
| Total billings | $ | 304,469 | $ | 237,355 | $ | 583,940 | $ | 461,056 | |||||||
| EBITDA and adjusted EBITDA are reconciled as follows: | Three Months Ended June 30, | Six Months Ended June 30, | |||||||||||||
| (in thousands) | 2019 | 2018 | 2019 | 2018 | |||||||||||
| Net income (loss) | $ | 1,828 | $ | (4,053 | ) | $ | (10,276 | ) | $ | 4,595 | |||||
| Adjustments: | |||||||||||||||
| Depreciation and amortization | 7,125 | 6,130 | 17,784 | 13,202 | |||||||||||
| Interest expense (net of interest income) | 2,243 | 2,672 | 4,191 | 5,969 | |||||||||||
| Loss on extinguishment of debt | - | 3,397 | - | 3,397 | |||||||||||
| Income tax provision (benefit) | 475 | 1,955 | (4,125 | ) | 3,912 | ||||||||||
| EBITDA | 11,671 | 10,101 | 7,574 | 31,075 | |||||||||||
| Share-based compensation expense | 1,937 | 2,611 | 2,922 | 4,999 | |||||||||||
| Realized loss on foreign currency remeasurement | 967 | 765 | 4,769 | 4,776 | |||||||||||
| Realized loss on sale of assets | 4,972 | - | 7,207 | - | |||||||||||
| Adjusted EBITDA | $ | 19,547 | $ | 13,477 | $ | 22,472 | $ | 40,850 | |||||||
| Free cash flow is reconciled as follows: | Three Months Ended June 30, | Six Months Ended June 30, | |||||||||||||
| (in thousands) | 2019 | 2018 | 2019 | 2018 | |||||||||||
| Net cash provided by (used in) operating activities | $ | 10,573 | $ | 5,567 | $ | (1,518 | ) | $ | 2,535 | ||||||
| Less capital expenditures | (19,030 | ) | (30,596 | ) | (37,739 | ) | (42,310 | ) | |||||||
| Free cash flow | $ | (8,457 | ) | $ | (25,029 | ) | $ | (39,257 | ) | $ | (39,775 | ) | |||
| Net debt is reconciled as follows: | June 30, | December 31, | |||||||||||||
| (in thousands) | 2019 | 2018 | |||||||||||||
| Cash and cash equivalents | $ | 58,664 | $ | 85,346 | |||||||||||
| Less total debt, net of debt issuance costs | (148,937 | ) | (137,623 | ) | |||||||||||
| Less debt issuance costs | (775 | ) | (878 | ) | |||||||||||
| Net debt | $ | (91,048 | ) | $ | (53,155 | ) | |||||||||
EXHIBIT 99.2

Q2 2019 Earnings Call

Q2 2019 Earnings Call Legal Disclaimer This presentation contains forward - looking statements within the meaning of the federal securities law. All statements other tha n statements of historical facts contained in this presentation, including statements regarding our future results of operations and financial position, business strategy and p lan s and objectives of management for future operations, are forward - looking statements. In many cases, you can identify forward - looking statements by terms such as “may,” “should,” “ex pects,” “plans,” “anticipates,” “could,” “intends,” “target,” “projects,” “contemplates,” “believes,” “estimates,” “predicts,” “potential” or “continue” or the negative of these te rms or other similar words. Forward - looking statements contained in this presentation include, but are not limited to, statements about: (i) growth of the wind energy market and ou r a ddressable market; (ii) the potential impact of the increasing prevalence of auction - based tenders in the wind energy market and increased competition from solar energy on our gros s margins and overall financial performance; (iii) our future financial performance, including our net sales, cost of goods sold, gross profit or gross margin, operating expens es, ability to generate positive cash flow, and ability to achieve or maintain profitability; (iv) changes in domestic or international government or regulatory policy, including witho ut limitation, changes in trade policy; (v) the sufficiency of our cash and cash equivalents to meet our liquidity needs; (vi) our ability to attract and retain customers for our products, and to optimize product pricing; (vii) our ability to effectively manage our growth strategy and future expenses, including our startup and transition costs; (viii) competition from other win d b lade and wind blade turbine manufacturers; (ix) the discovery of defects in our products; (x) our ability to successfully expand in our existing wind energy markets and into new in ternational wind energy markets; (xi) our ability to successfully open new manufacturing facilities and expand existing facilities on time and on budget; (xii) the impact of the acc elerated pace of new product and wind blade model introductions on our business and our results of operations; (xiii) our ability to successfully expand our transportation bus ine ss and execute upon our strategy of entering new markets outside of wind energy; (xiv) worldwide economic conditions and their impact on customer demand; (xv) our ability to maintain , p rotect and enhance our intellectual property; (xvi) our ability to comply with existing, modified or new laws and regulations applying to our business, including the imposition of n ew taxes, duties or similar assessments on our products; (xvii) the attraction and retention of qualified employees and key personnel; (xviii) our ability to maintain good working r ela tionships with our employees, and avoid labor disruptions, strikes and other disputes with labor unions that represent certain of our employees; (xix) our ability to procure adequate s upp lies of raw materials and components to fulfill our wind blade volume commitments to our customers and (xx) the potential impact of one or more of our customers becoming bankrupt or ins olvent, or experiencing other financial problems. These forward - looking statements are only predictions. These statements relate to future events or our future financial performa nce and involve known and unknown risks, uncertainties and other important factors that may cause our actual results, levels of activity, performance or achievements to materially differ from any future results, levels of activity, performance or achievements expressed or implied by these forward - looking statements. Because forward - looking statements are inh erently subject to risks and uncertainties, some of which cannot be predicted or quantified, you should not rely on these forward - looking statements as guarantees of future even ts. Further information on the factors, risks and uncertainties that could affect our financial results and the forward - looking statements in this presentation are included in ou r filings with the Securities and Exchange Commission and will be included in subsequent periodic and current reports we make with the Securities and Exchange Commission from time to time, including in our Annual Report on Form 10 - K for the year ended December 31, 2018. The forward - looking statements in this presentation represent our views as of the date of this presentation. We anticipate that subsequent events and developments will cause our views to change. However, while we may elect to update these forward - looking statements at some point in the future, we undertak e no obligation to update any forward - looking statement to reflect events or developments after the date on which the statement is made or to reflect the occurrence of una nti cipated events except to the extent required by applicable law. You should, therefore, not rely on these forward - looking statements as representing our views as of any date aft er the date of this presentation. Our forward - looking statements do not reflect the potential impact of any future acquisitions, mergers, dispositions, joint ventures, or investme nts we may make. This presentation includes unaudited non - GAAP financial measures including total billings, EBITDA, adjusted EBITDA, net cash (de bt) and free cash flow. We define total billings as the total amounts we have invoiced our customers for products and services for which we are entitled to payment under the ter ms of our long - term supply agreements or other contractual agreements. We define EBITDA as net income (loss) plus interest expense (including losses on the extinguishment o f d ebt and net of interest income), income taxes and depreciation and amortization. We define Adjusted EBITDA as EBITDA plus any share - based compensation expense, plus or minus any gains or losses from foreign currency remeasurement and any gains or losses on the sale of assets. We define net cash (debt) as the total principal amount of debt out standing less unrestricted cash and cash equivalents. We define free cash flow as net cash flow generated from operating activities less capital expenditures. We pres ent non - GAAP measures when we believe that the additional information is useful and meaningful to investors. Non - GAAP financial measures do not have any standardized meaning a nd are therefore unlikely to be comparable to similar measures presented by other companies. The presentation of non - GAAP financial measures is not intended to be a substitut e for, and should not be considered in isolation from, the financial measures reported in accordance with GAAP. See the appendix for the reconciliations of certain non - GAAP fina ncial measures to the comparable GAAP measures. This presentation also contains estimates and other information concerning our industry that are based on industry publicatio ns, surveys and forecasts. This information involves a number of assumptions and limitations, and we have not independently verified the accuracy or completeness of the information . August 7, 2019 2

Q2 2019 Earnings Call Agenda • Q2 2019 Highlights • Q2 2019 Financial Highlights • Guidance for 2019 and 2020 Targets • Q&A • Appendix – Non - GAAP Information August 7, 2019 3

Q2 2019 Highlights

Q2 2019 Earnings Call Q2 2019 Highlights Q2 2019 Highlights • Operating results and year - over - year compared to 201 8: • Net sales were up 43.4% to $330.8 million for the quarter • Total billings were up 28.3% to $304.5 million for the quarter • N et income for the quarter was $ 1.8 million compared to a net loss of $4.1 million in 2018 • Adjusted EBITDA for the quarter was $19.5 million or 5.9% of net sales • Reached agreement with Nordex to transition multiple existing lines in Turkey to longer blades and extended the end of the contract from 2020 to 2022. • Acquired a team of engineering resources from the EUROS group, based in Berlin, Germany. The team of approximately 20 technical experts focuses on blade design, tooling, materials and process technology development. It will strengthen our technical capabilities in support of our global operations and growth and the experience and skills of this engineering team will enable us to offer complete blade solutions where valuable. • Completed negotiations and signed an agreement to sell the remaining Senvion blades in our inventory to Senvion’s customer to enable them to complete a project in Australia. Net Sales and Adjusted EBITDA ($ in millions) Sets invoiced 576 716 Est. MW 1,544 2,029 Dedicated lines (1) 52 54 Lines installed (2) 40 50 (1) Number of wind blade manufacturing lines dedicated to our customers under long - term supply agreement s at the end of the period. (2) Number of wind blade manufacturing lines installed that are either in operation, startup or transition at the end of the period. $231 $331 $13 $20 $0 $200 $400 2Q18 2Q19 2Q18 2Q19 Net Sales Adjusted EBITDA August 7, 2019 5

Q2 2019 Earnings Call Existing Contracts Provide for ~$6.2 Billion in Potential Revenue through 2023 (1) Long - term Supply Agreements (1) Long - term supply agreements provide for estimated minimum aggregate volume commitments from our customers of approximately $ 3.5 billion and encourage our customers to purchase additional volume up to, in the aggregate, an estimated total potential revenue of approximately $6.2 billion through the end of 2023 (1) Note: Our contracts with certain of our customers are subject to termination or reduction on short notice, generally with substantial penalties, and contain l iqu idated damages provisions, which may require us to make unanticipated payments to our customers or our customers to make payments to us. (1) As of August 7, 2019. The chart depicts the term of the longest contract in each location . 2019 2020 2021 2022 2023 China India Iowa Mexico Turkey August 7, 2019 6

Q2 2019 Financial Highlights

Q2 2019 Earnings Call ($ in millions, except per share data and KPIs) Q2 ’19 Q2 ’18 ∆ YTD ’19 YTD ’18 ∆ Select Financial Data Net Sales $ 330.8 $ 230.6 43.4% $ 630.6 $ 484.6 30.1% Total Billings $ 304.5 $ 237.4 28.3% $ 583.9 $ 461.1 26.7% Net Income (Loss) $ 1.8 $ (4.1) 145.1% $ (10.3) $ 4.6 -323.6% Diluted Earnings (Loss) Per Share $ 0.05 $ (0.12) $ 0.17 $ (0.29) $ 0.13 $ (0.42) Adjusted EBITDA (1) $ 19.5 $ 13.5 45.0% $ 22.5 $ 40.9 -45.0% Adjusted EBITDA Margin 5.9% 5.8% 10 bps 3.6% 8.4% -480 bps Net Debt (1) $ (91.0) $ (17.4) $ (73.7) $ (91.0) $ (17.4) $ (73.7) Free Cash Flow (1) $ (8.5) $ (25.0) $ 16.6 $ (39.3) $ (39.8) $ 0.5 Capital Expenditures $ 19.0 $ 30.6 $ (11.6) $ 37.7 $ 42.3 $ (4.6) Key Performance Indicators (KPIs) Sets Invoiced 716 576 140 1,378 1,145 233 Estimated Megawatts 2,029 1,544 485 3,890 3,008 882 Utilization 70% 72% -200 bps 68% 72% -400 bps Dedicated Wind Blade Manufacturing Lines 54 52 2 lines 54 52 2 lines Wind Blade Manufacturing Lines Installed 50 40 10 lines 50 40 10 lines Wind Blade Manufacturing Lines in Operation 30 26 4 lines 28 26 2 lines Wind Blade Manufacturing Lines in Startup 13 7 6 lines 14 7 7 lines Wind Blade Manufacturing Lines in Transition 7 7 0 lines 8 7 1 line Q2 2019 Financial Highlights (1) (unaudited) (1) See Appendix for reconciliations of non - GAAP financial data August 7, 2019 8

Q2 2019 Earnings Call Income Statement Summary (1) (unaudited) (1) See Appendix for reconciliations of non - GAAP financial data August 7, 2019 9 2019 2018 $ % 2019 2018 $ % (in thousands, except per share data) Net sales 330,771$ 230,610$ 100,161$ 43.4% 630,551$ 484,591$ 145,960$ 30.1% Cost of sales 285,319$ 198,235$ 87,084$ 43.9% 568,357$ 409,223$ 159,134$ 38.9% Startup and transition costs 22,901$ 17,324$ 5,577$ 32.2% 41,079$ 32,059$ 9,020$ 28.1% Total cost of goods sold 308,220$ 215,559$ 92,661$ 43.0% 609,436$ 441,282$ 168,154$ 38.1% Cost of goods sold % 93.2% 93.5% -30 bps 96.7% 91.1% 560 bps Gross profit 22,551$ 15,051$ 7,500$ 49.8% 21,115$ 43,309$ (22,194)$ -51.2% Gross profit (loss) % 6.8% 6.5% 30 bps 3.3% 8.9% -560 bps General and administrative expenses 9,208$ 10,989$ (1,781)$ -16.2% 17,193$ 22,152$ (4,959)$ -22.4% General and administrative expenses % 2.8% 4.8% -200 bps 2.7% 4.6% -190 bps Realized loss on sale of assets 4,972$ -$ 4,972$ NM 7,207$ -$ 7,207$ NM Restructuring charges 3,874$ -$ 3,874$ NM 3,874$ -$ 3,874$ NM Income (loss) from operations 4,497$ 4,062$ 435$ 10.7% (7,159)$ 21,157$ (28,316)$ -133.8% Income (loss) before income taxes 2,303$ (2,098)$ 4,401$ 209.8% (14,401)$ 8,507$ (22,908)$ -269.3% Net income (loss) 1,828$ (4,053)$ 5,881$ 145.1% (10,276)$ 4,595$ (14,871)$ -323.6% Weighted-average common shares outstanding: Basic 35,033 34,164 34,970 34,107 Diluted 36,369 34,164 34,970 35,766 Net income (loss) per common share: Basic 0.05$ (0.12)$ 0.17$ (0.29)$ 0.13$ (0.42)$ Diluted 0.05$ (0.12)$ 0.17$ (0.29)$ 0.13$ (0.42)$ Non-GAAP Metrics Total billings 304,469$ 237,355$ 67,114$ 28.3% 583,940$ 461,056$ 122,884$ 26.7% EBITDA (1) 11,671$ 10,101$ 1,570$ 15.5% 7,574$ 31,075$ (23,501)$ -75.6% EBITDA margin 3.5% 4.4% -90 bps 1.2% 6.4% -520 bps Adjusted EBITDA (1) 19,547$ 13,477$ 6,070$ 45.0% 22,472$ 40,850$ (18,378)$ -45.0% Adjusted EBITDA margin 5.9% 5.8% 10 bps 3.6% 8.4% -480 bps Three Months Ended June 30, Change Six Months Ended June 30, Change
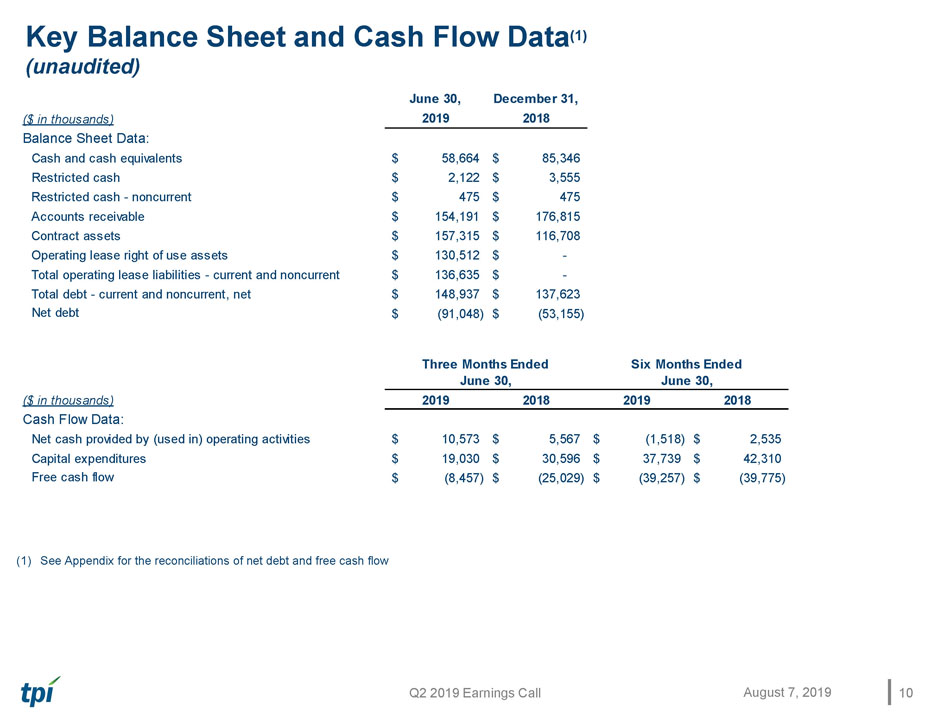
Q2 2019 Earnings Call Key Balance Sheet and Cash Flow Data (1) (unaudited) (1) See Appendix for the reconciliation s of net debt and free cash flow August 7, 2019 10 June 30, December 31, ($ in thousands) 2019 2018 Balance Sheet Data: Cash and cash equivalents 58,664$ 85,346$ Restricted cash 2,122$ 3,555$ Restricted cash - noncurrent 475$ 475$ Accounts receivable 154,191$ 176,815$ Contract assets 157,315$ 116,708$ Operating lease right of use assets 130,512$ -$ Total operating lease liabilities - current and noncurrent 136,635$ -$ Total debt - current and noncurrent, net 148,937$ 137,623$ Net debt (1) (91,048)$ (53,155)$ ($ in thousands) 2019 2018 2019 2018 Cash Flow Data: Net cash provided by (used in) operating activities 10,573$ 5,567$ (1,518)$ 2,535$ Capital expenditures 19,030$ 30,596$ 37,739$ 42,310$ Free cash flow (1) (8,457)$ (25,029)$ (39,257)$ (39,775)$ Three Months Ended June 30, Six Months Ended June 30,

Guidance for 2019 and Targets for 2020

Q2 2019 Earnings Call EBITDA Guidance Bridges ($ in millions) 12 August 7, 2019

Q2 2019 Earnings Call 2019 Guidance Metrics and 2020 Targets Note: All references to lines refers to wind blade manufacturing lines 2019 Guidance Updated 2019 Guidance Previous 2020 Target Updated 2020 Target Previous Total Billings $1.45B – $1.5B $1.45B – $1.5B $1.6B – $1.8B $1.7B – $1.9B Net Sales $1.45B – $1.5B $1.45B – $1.5B $1.6B – $1.8B $1.7B – $1.9B Adjusted EBITDA $80M – $85M $80M – $85M $140M – $160M $170M – $190M Earnings (Loss) per Share ($0.18) – ($0.23) ($0.03) – ($0.09) Sets 3,180 – 3,220 3,200 – 3,300 Average Selling Price per Blade $135K – $140K $135K – $140K Non - Blade Billings $100M – $105M $100M – $105M G&A Costs as a % of Billings (incl. SBC and loss on sale of receivables) 4.0% – 4.25% 4.0% – 4.25% Estimated MW 9,300 – 9,400 9,400 – 9,700 Dedicated Lines - EOY 52 – 55 60 – 63 Share - Based Compensation $7M – $8M $7M – $8M Depreciation & Amortization $37M – $38M $41M – $42M Net Interest Expense $8.0M – $8.5M $8.5M – $9.5M Capital Expenditures $95M – $100M $95M – $100M Effective Tax Rate NM NM August 7, 2019 13

Q2 2019 Earnings Call 2019 Startup and Transition Guidance Metrics Q1A Q2A Q3F Q4F 2019 Guidance Updated 2019 Guidance Previous Lines Installed – end of period (1) 49 50 48 48 48 48 - 50 Lines in Startup – during period 13 13 10 3 14 14 Lines in Transition – during period 5 7 8 2 10 10 Startup Costs $16.1M $14.7M $10.5M – $11.5M $5.7M – $6.7M $47.0M – $49.0M $43.0M – $45.0M Transition Costs $2.1M $8.2M $7.7M – $8.7M $1.0M – $2.0M $19.0M – $21.0M $22.1M – $24.0M Line Utilization % (based on 50 lines in Q1/Q2 and 48 lines in Q3/Q4) 64% 70% 88% - 90% 96% - 98% 79% - 80% 80% - 82% Sets 662 716 865 – 885 937 - 957 3,180 – 3,220 3,200 – 3,300 Note: All references to lines refers to wind blade manufacturing lines (1) Senvion lines get deinstalled at the end of Q2 August 7, 2019 14

Q&A

Appendix – Non - GAAP Information This presentation includes unaudited non - GAAP financial measures including total billings, EBITDA, adjusted EBITDA, net cash (de bt) and free cash flow. We define total billings as the total amounts we have invoiced our customers for products and services fo r w hich we are entitled to payment under the terms of our long - term supply agreements or other contractual agreements. We define EBITDA as net income (loss) plus interest expense (including losses on the extinguishment of debt and net of interest income), income taxes an d depreciation and amortization. We define Adjusted EBITDA as EBITDA plus any share - based compensation expense, plus or minus any gains or losses from foreign currency remeasurement and any gains or losses on the sale of assets. We define net cash (de bt) as the total principal amount of debt outstanding less unrestricted cash and cash equivalents. We define free cash flow as net c ash flow generated from operating activities less capital expenditures. We present non - GAAP measures when we believe that the additional information is useful and meaningful to investors. Non - GAAP financial measures do not have any standardized meaning and are therefore unlikely to be comparable to similar measures presented by other companies. The presentation of non - GAAP financial measures is not intended to be a substitute for, and should not be considered in isolation from, the financial measures repor ted in accordance with GAAP. See below for a reconciliation of certain non - GAAP financial measures to the comparable GAAP measures.

Q2 2019 Earnings Call Non - GAAP Reconciliations (unaudited) Net sales is reconciled to total billings as follows: Net income (loss) is reconciled to EBITDA and adjusted EBITDA as follows: August 7, 2019 17 ($ in thousands) 2019 2018 2019 2018 Net income (loss) 1,828$ (4,053)$ (10,276)$ 4,595$ Adjustments: Depreciation and amortization 7,125 6,130 17,784 13,202 Interest expense (net of interest income) 2,243 2,672 4,191 5,969 Loss on extinguishment of debt - 3,397 - 3,397 Income tax provision (benefit) 475 1,955 (4,125) 3,912 EBITDA 11,671 10,101 7,574 31,075 Share-based compensation expense 1,937 2,611 2,922 4,999 Realized loss on foreign currency remeasurement 967 765 4,769 4,776 Realized loss on sale of assets 4,972 — 7,207 - Adjusted EBITDA 19,547$ 13,477$ 22,472$ 40,850$ Three Months Ended June 30, Six Months Ended June 30, ($ in thousands) 2019 2018 2019 2018 Net sales 330,771$ 230,610$ 630,551$ 484,591$ Change in gross contract assets (26,691) (1,356) (43,747) (25,752) Foreign exchange impact 389 8,101 (2,864) 2,217 Total billings 304,469$ 237,355$ 583,940$ 461,056$ Three Months Ended June 30, Six Months Ended June 30,

Q2 2019 Earnings Call Non - GAAP Reconciliations (continued) (unaudited) Net debt is reconciled as follows: Free cash flow is reconciled as follows: August 7, 2019 18 June 30, December 31, June 30, ($ in thousands) 2019 2018 2018 Cash and cash equivalents 58,664$ 85,346$ 113,995$ Less total debt, net of debt issuance costs (148,937) (137,623) (129,860) Less debt issuance costs (775) (878) (1,515) Net debt (91,048)$ (53,155)$ (17,380)$ ($ in thousands) 2019 2018 2019 2018 Net cash provided by (used in) operating activities 10,573$ 5,567$ (1,518)$ 2,535$ Less capital expenditures (19,030) (30,596) (37,739) (42,310) Free cash flow (8,457)$ (25,029)$ (39,257)$ (39,775)$ Six Months Ended June 30, Three Months Ended June 30,

Q2 2019 Earnings Call Non - GAAP Reconciliations (continued) (unaudited) A reconciliation of the low end and high end ranges of projected net loss to projected EBITDA and projected adjusted EBITDA is as follows: August 7, 2019 19 ($ in thousands) Low End High End Projected net loss (8,000)$ (6,250)$ Adjustments: Projected depreciation and amortization 37,000 38,000 Projected interest expense (net of interest income) 8,000 8,500 Projected income tax provision 14,500 15,250 Projected EBITDA 51,500 55,500 Projected share-based compensation expense 7,000 8,000 Projected realized loss on foreign currency remeasurement 9,500 9,500 Projected loss on sale of assets 12,000 12,000 Projected Adjusted EBITDA 80,000$ 85,000$ (1) All figures presented are projected estimates for the full year ending December 31, 2019. 2019 Adjusted EBITDA Guidance Range (1)
