Form 8-K YETI Holdings, Inc. For: May 31
UNITED STATES
SECURITIES AND EXCHANGE COMMISSION
Washington, D.C. 20549
FORM 8-K
CURRENT REPORT
PURSUANT TO SECTION 13 OR 15(d) OF THE
SECURITIES EXCHANGE ACT OF 1934
Date of Report (Date of earliest event reported): May 31, 2019
YETI Holdings, Inc.
(Exact name of registrant as specified in its charter)
|
Delaware |
|
001-38713 |
|
45-5297111 |
|
(State or other jurisdiction |
|
(Commission |
|
(IRS Employer |
|
of incorporation) |
|
File Number) |
|
Identification No.) |
7601 Southwest Parkway
Austin, Texas 78735
(Address of principal executive offices, including zip code)
(Registrant's telephone number, including area code): (512) 394-9384
Not applicable
(Former name or former address, if changed since last report)
Check the appropriate box below if the Form 8-K filing is intended to simultaneously satisfy the filing obligation of the registrant under any of the following provisions (see General Instruction A.2. below):
|
☐ |
Written communications pursuant to Rule 425 under the Securities Act (17 CFR 230.425) |
|
|
|
|
☐ |
Soliciting material pursuant to Rule 14a-12 under the Exchange Act (17 CFR 240.14a-12) |
|
|
|
|
☐ |
Pre-commencement communications pursuant to Rule 14d-2(b) under the Exchange Act (17 CFR 240.14d-2(b)) |
|
|
|
|
☐ |
Pre-commencement communications pursuant to Rule 13e-4(c) under the Exchange Act (17 CFR 240.13e-4(c)) |
Securities registered pursuant to Section 12(b) of the Act:
|
Title of each class |
Trading symbol(s) |
Name of each exchange on which registered |
|
Common stock, par value $0.01 |
YETI |
New York Stock Exchange |
Indicate by check mark whether the registrant is an emerging growth company as defined in Rule 405 of the Securities Act of 1933 (§230.405 of this chapter) or Rule 12b-2 of the Securities Exchange Act of 1934 (§240.12b-2 of this chapter). Emerging growth company ☒
If an emerging growth company, indicate by check mark if the registrant has elected not to use the extended transition period for complying with any new or revised financial accounting standards provided pursuant to Section 13(a) of the Exchange Act. ☐
Item 7.01 Regulation FD Disclosure
On May 31, 2019, YETI Holdings, Inc. (“YETI” or the “Company”) announced that members of the Company’s management will be participating in three conferences during June 2019 – the William Blair 39th Annual Growth Stock Conference in Chicago, IL on June 5, 2019; the Baird 2019 Global Consumer, Technology & Services Conference in New York City, NY on June 6, 2019; and the Jefferies 2019 Consumer Conference in Nantucket, MA on June 18, 2019. The press release and the presentation materials for these conferences are being furnished with this Current Report on Form 8-K as Exhibit 99.1 and Exhibit 99.2, respectively, and are incorporated herein by reference. Members of the Company’s management may use all or portions of these materials from time to time with or when making presentations to the investment community. The presentation materials are posted and may be found in the investor relations page of the Company’s website, at http://www.investors.yeti.com.
The information contained in this report, including Exhibit 99.1 and Exhibit 99.2, shall not be deemed “filed” for purposes of Section 18 of the Securities Exchange Act of 1934, as amended (the “Exchange Act”), or otherwise subject to the liability of that section. The information in this report shall not be incorporated by reference in any filing under the Securities Act of 1933, as amended, or the Exchange Act, except as shall be expressly set forth by specific reference in such a filing.
Item 9.01 Financial Statements and Exhibits
(d) Exhibits
|
Exhibit |
|
|
|
No. |
|
Description |
|
99.1 |
|
Press release issued by YETI Holdings, Inc., dated May 31, 2019. |
|
99.2 |
|
2
SIGNATURE
Pursuant to the requirements of the Securities Exchange Act of 1934, the registrant has duly caused this report to be signed on its behalf by the undersigned hereunto duly authorized.
|
|
YETI Holdings, Inc. |
|
|
|
|
|
|
Date: May 31, 2019 |
By: |
/s/ Paul C. Carbone |
|
|
|
Paul C. Carbone |
|
|
|
Senior Vice President and Chief Financial Officer |
3
Exhibit 99.1

YETI Announces Participation in June 2019 Conferences
Austin, Texas, May 31, 2019 – YETI Holdings, Inc. (“YETI” or the “Company”) (NYSE: YETI) today announced that the Company will be participating in three conferences during June 2019 – the William Blair 39th Annual Growth Stock Conference in Chicago, IL on June 5; the Baird 2019 Global Consumer, Technology & Services Conference in New York City, NY on June 6; and the Jefferies 2019 Consumer Conference in Nantucket, MA on June 18. Details include:
William Blair 39th Annual Growth Stock Conference
|
· |
Date: Wednesday, June 5, 2019 |
|
· |
Location: Loews Chicago Hotel – Chicago |
|
· |
Presentation Time: 9:20AM CT |
|
· |
Webcast Access: http://wsw.com/webcast/blair55/yeti/ |
Baird 2019 Global Consumer, Technology & Services Conference
|
· |
Date: Thursday, June 6, 2019 |
|
· |
Location: InterContinental New York Barclay – New York City |
|
· |
Presentation Time: 7:55AM ET |
|
· |
Webcast Access: http://wsw.com/webcast/baird55/yeti/ |
Jefferies 2019 Consumer Conference
|
· |
Date: Tuesday, June 18, 2019 |
|
· |
Location: White Elephant – Nantucket, MA |
|
· |
Presentation Time: 11:00AM ET |
|
· |
Webcast Access: http://wsw.com/webcast/jeff119/yeti/ |
About YETI Holdings, Inc.
YETI is a designer, marketer, retailer, and distributor of a variety of innovative, branded, premium products to a wide-ranging customer base. Our mission is to ensure that each YETI product delivers exceptional performance and durability in any environment, whether in the remote wilderness, at the beach, or anywhere else life takes our customers. By consistently delivering high-performing products, we have built a following of engaged brand loyalists throughout the United States, Canada, Japan, Australia, and elsewhere, ranging from serious outdoor enthusiasts to individuals who simply value products of uncompromising quality and design. Our relationship with customers continues to thrive and deepen as a result of our innovative new product introductions, expansion and enhancement of existing product families, and multifaceted branding activities.
Investor Relations Contact:
Tom Shaw, CFA, 512-271-6332
Media Contact:
YETI Holdings, Inc. Media Hotline
Exhibit 99.2
| INVESTOR PRESENTATION | JUNE 2019 |
| 2 Disclaimer We are not making any representations or warranties, express or implied, with respect to the information (financial, business, legal or otherwise) contained in this presentation. No person has been authorized to give any information other than that contained in this presentation. Forward-Looking Statements This presentation, as well as other written or oral communications made from time to time by us, may contain certain forward-looking information. Forward-looking statements refer to our current expectations and projections relating to our financial condition, results of operations, plans, objectives, strategies, future performance, and business. You can identify forward-looking statements by the fact that they do not relate strictly to historical or current facts. Forward- looking statements include statements containing words such as ‘‘anticipate,’’ ‘‘assume,’’ ‘‘believe,’’ ‘‘can,’’ have,’’ ‘‘contemplate,’’ ‘‘continue,’’ ‘‘could,’’ ‘‘design,’’ ‘‘due,’’ ‘‘estimate,’’ ‘‘expect,’’ ‘‘forecast,’’ ‘‘goal,’’ ‘‘intend,’’ ‘‘likely,’’ ‘‘may,’’ ‘‘might,’’ ‘‘objective,’’ ‘‘plan,’’ ‘‘predict,’’ ‘‘project,’’ ‘‘potential,’’ ‘‘seek,’’ ‘‘should,’’ ‘‘target,’’ “will,’’ ‘‘would,’’ and other words and terms of similar meaning in connection with any discussion of the timing or nature of future operational performance or other events. For example, all statements made relating to growth strategies, the estimated and projected costs, expenditures, and growth rates, plans and objectives for future operations, growth, or initiatives, or strategies are forward-looking statements. Important factors to consider and evaluate in such forward-looking statements include, but are not limited to those set forth under the caption “Risk Factors” and elsewhere the reports we file with the Securities and Exchange Commission, including: our ability to maintain and strengthen our brand and generate and maintain ongoing demand for our products; our ability to successfully design and develop new products; our ability to effectively manage our growth; our ability to expand into additional consumer markets, and our success in doing so; the success of our international expansion plans; our ability to compete effectively in the outdoor and recreation market and protect our brand; the level of customer spending for our products, which is sensitive to general economic conditions and other factors; problems with, or loss of, our third-party contract manufacturers and suppliers, or an inability to obtain raw materials; fluctuations in the cost and availability of raw materials, equipment, labor, and transportation and subsequent manufacturing delays or increased costs; our ability to accurately forecast demand for our products and our results of operations; our relationships with our national, regional, and independent partners, who account for a significant portion of our sales; the impact of natural disasters and failures of our information technology on our operations and the operations of our manufacturing partners; our ability to attract and retain skilled personnel and senior management, and to maintain the continued efforts of our management and key employees; and the impact of our indebtedness on our ability to invest in the ongoing needs of our business. These forward-looking statements are made based upon detailed assumptions and reflect management’s current expectations and beliefs. While we believe that these assumptions underlying the forward-looking statements are reasonable, we caution that it is very difficult to predict the impact of known factors, and it is impossible for us to anticipate all factors that could affect actual results. Non-GAAP Financial Measures We present Adjusted EBITDA, Adjusted Net Income and Adjusted Net Income per Diluted Share to help us describe our operating performance. We define Adjusted EBITDA as net (loss) income before interest expense, net, provision (benefit) for income taxes and depreciation and amortization, adjusted for the impact of certain other items, including: non-cash stock-based compensation expense; asset impairment charges; accelerated amortization of deferred financing fees and loss from early extinguishment of debt resulting from the early prepayment of debt; investments in new retail locations and international market expansion; transition to Cortec majority ownership; transition to the ongoing senior management team; and transition to a public company. The expenses incurred related to these transitional events include: management fees and contingent consideration related to the transition to Cortec majority ownership; severance, recruiting, and relocation costs related to the transition to our ongoing senior management team; consulting fees, recruiting fees, salaries and travel costs related to members of our Board of Directors, fees associated with Sarbanes-Oxley Act compliance, and incremental audit and legal fees in connection with our transition to a public company. We define Adjusted Net Income as net (loss) income before non-cash stock-based compensation expense; asset impairment charges; accelerated amortization of deferred financing fees and loss from early extinguishment of debt resulting from the early prepayment of debt; investments in new retail locations and international market expansion; transition to Cortec majority ownership; transition to the ongoing senior management team; and transition to a public company as well as including the tax impact of adjusting items. Adjusted EBITDA is not defined by accounting principles generally accepted in the United States, or GAAP, and may not be comparable to similarly titled measures reported by other entities. We use Adjusted EBITDA, Adjusted Net Income and Adjusted Net Income per Diluted Share as a measure of profitability. Adjusted EBITDA, Adjusted Net Income and Adjusted Net Income per Diluted Share have limitations as a profitability measure in that it does not include the interest expense on our debts, our provisions for income taxes, and the effect of our expenditures for capital assets and certain intangible assets. Our presentation of Adjusted EBITDA, Adjusted Net Income and Adjusted Net Income per Diluted Share should not be construed as a basis to infer that our future results will be unaffected by extraordinary, unusual or non-recurring items. See Appendix for reconciliation of Adjusted EBITDA to net (loss) income and Adjusted Net Income to net (loss) income. |
| 3 3 3 |

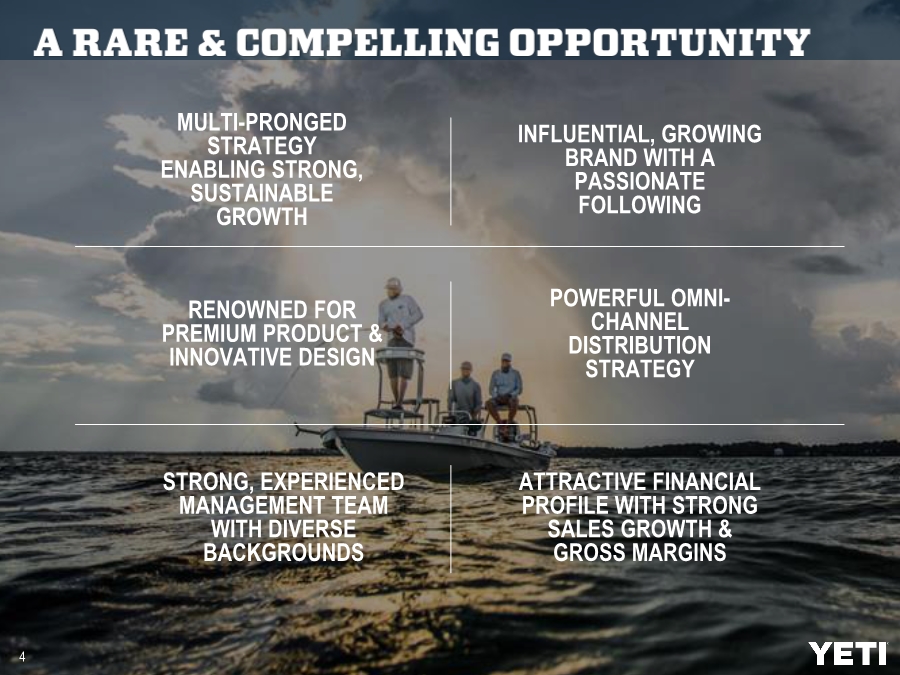
| 4 MULTI-PRONGED STRATEGY ENABLING STRONG, SUSTAINABLE GROWTH RENOWNED FOR PREMIUM PRODUCT & INNOVATIVE DESIGN ATTRACTIVE FINANCIAL PROFILE WITH STRONG SALES GROWTH & GROSS MARGINS INFLUENTIAL, GROWING BRAND WITH A PASSIONATE FOLLOWING POWERFUL OMNI- CHANNEL DISTRIBUTION STRATEGY STRONG, EXPERIENCED MANAGEMENT TEAM WITH DIVERSE BACKGROUNDS |
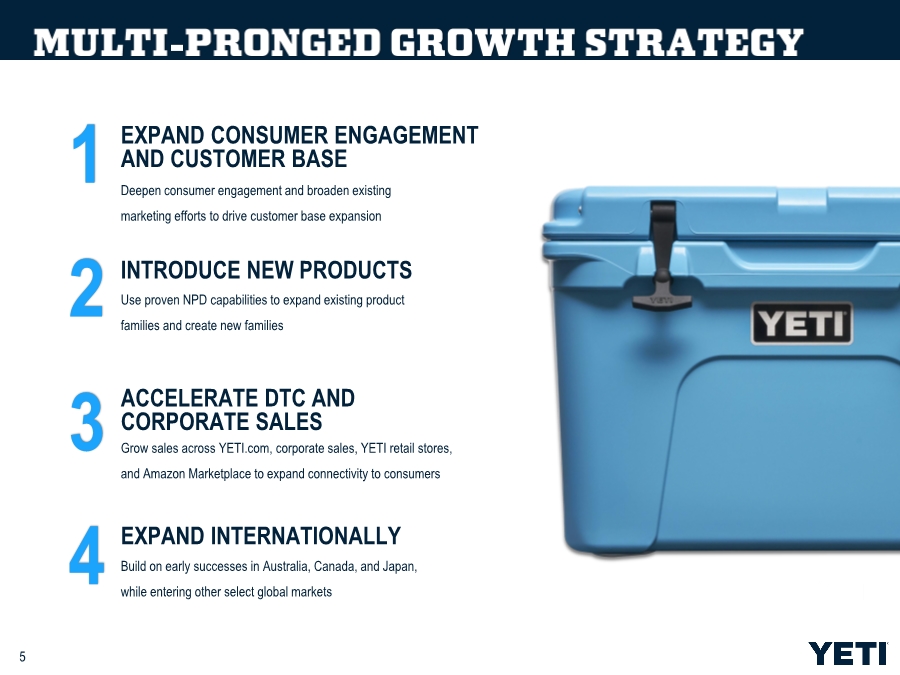
| 5 Deepen consumer engagement and broaden existing marketing efforts to drive customer base expansion 1 Use proven NPD capabilities to expand existing product families and create new families 2 Grow sales across YETI.com, corporate sales, YETI retail stores, and Amazon Marketplace to expand connectivity to consumers 3 Build on early successes in Australia, Canada, and Japan, while entering other select global markets 4 EXPAND CONSUMER ENGAGEMENT AND CUSTOMER BASE INTRODUCE NEW PRODUCTS ACCELERATE DTC AND CORPORATE SALES EXPAND INTERNATIONALLY |
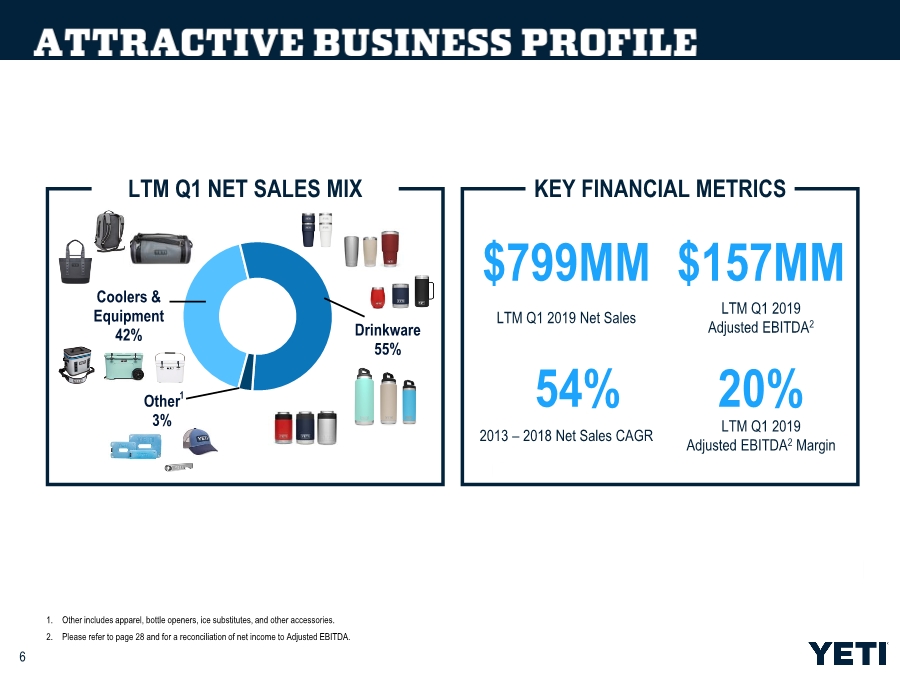
| Coolers & Equipment 42% Drinkware 55% Other 3% 1 1. Other includes apparel, bottle openers, ice substitutes, and other accessories. 2. Please refer to page 28 and for a reconciliation of net income to Adjusted EBITDA. $799MM LTM Q1 2019 Net Sales $157MM LTM Q1 2019 Adjusted EBITDA2 2013 – 2018 Net Sales CAGR 20% LTM Q1 2019 Adjusted EBITDA2 Margin 6 54% LTM Q1 NET SALES MIX KEY FINANCIAL METRICS |
| 7 |

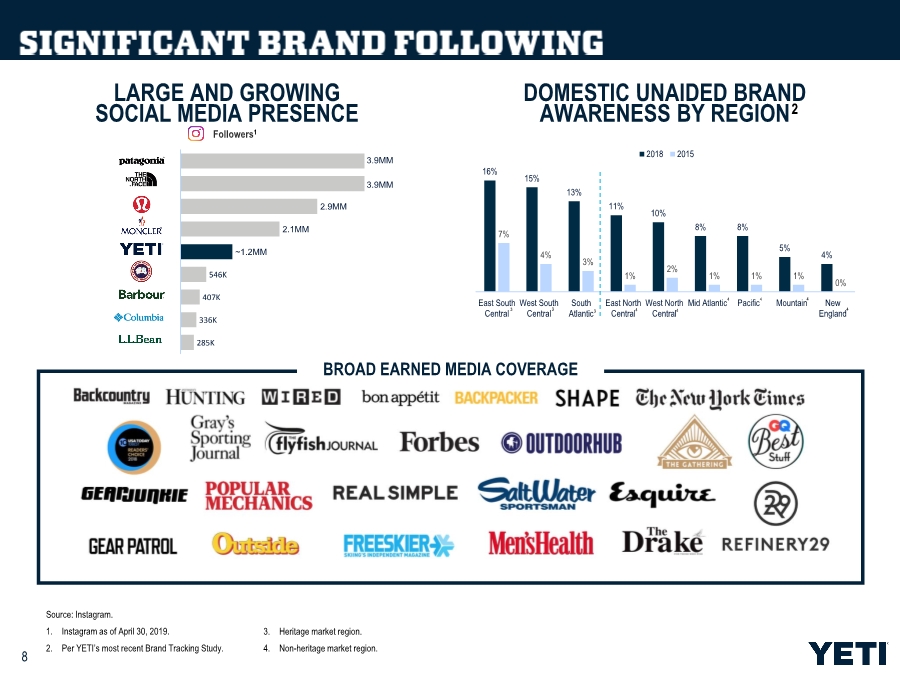
| 8 LARGE AND GROWING SOCIAL MEDIA PRESENCE BROAD EARNED MEDIA COVERAGE Source: Instagram. 1. Instagram as of April 30, 2019. 2. Per YETI’s most recent Brand Tracking Study. 285K 336K 407K 546K ~1.2MM 2.1MM 2.9MM 3.9MM 3.9MM 16% 15% 13% 11% 10% 8% 8% 5% 4% 7% 4% 3% 1% 2% 1% 1% 1% 0% East South Central West South Central South Atlantic East North Central West North Central Mid Atlantic Pacific Mountain New England 2018 2015 3 3 3 4 4 4 4 4 4 DOMESTIC UNAIDED BRAND AWARENESS BY REGION Followers1 2 3. Heritage market region. 4. Non-heritage market region. |
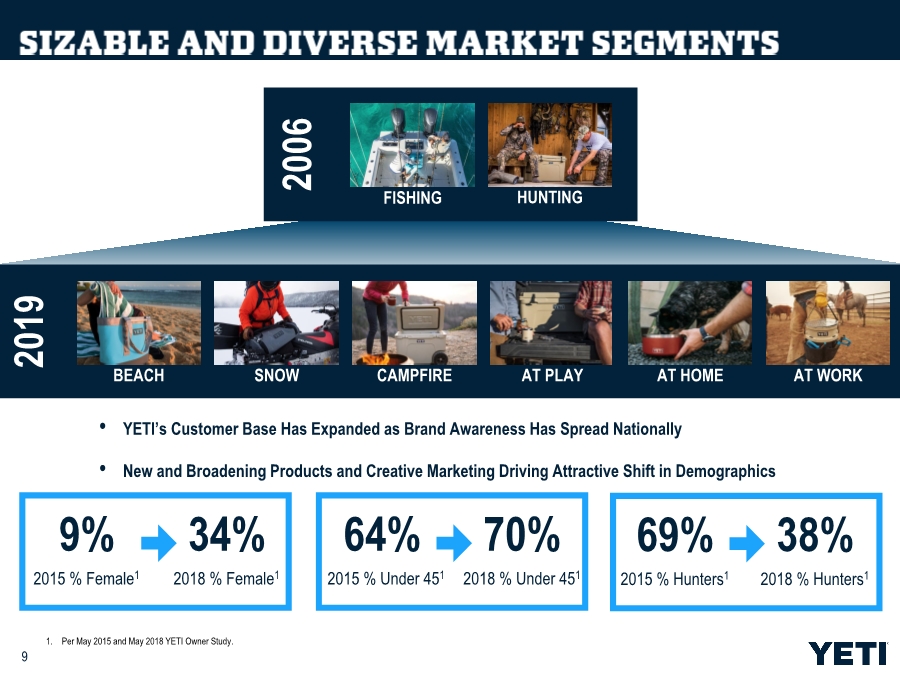
| 9 2006 • YETI’s Customer Base Has Expanded as Brand Awareness Has Spread Nationally • New and Broadening Products and Creative Marketing Driving Attractive Shift in Demographics 2019 FISHING HUNTING BEACH SNOW CAMPFIRE AT PLAY AT HOME AT WORK 69% 2015 % Hunters1 38% 2018 % Hunters1 64% 2015 % Under 451 70% 2018 % Under 451 9% 2015 % Female1 34% 2018 % Female1 1. Per May 2015 and May 2018 YETI Owner Study. |
| 10 FROM FLY FISHING TO COMPETITIVE SURFING, THEY EMBODY THE YETI LIFE FISHING | HUNTING | OUTDOOR | FOOD | RANCH & RODEO |

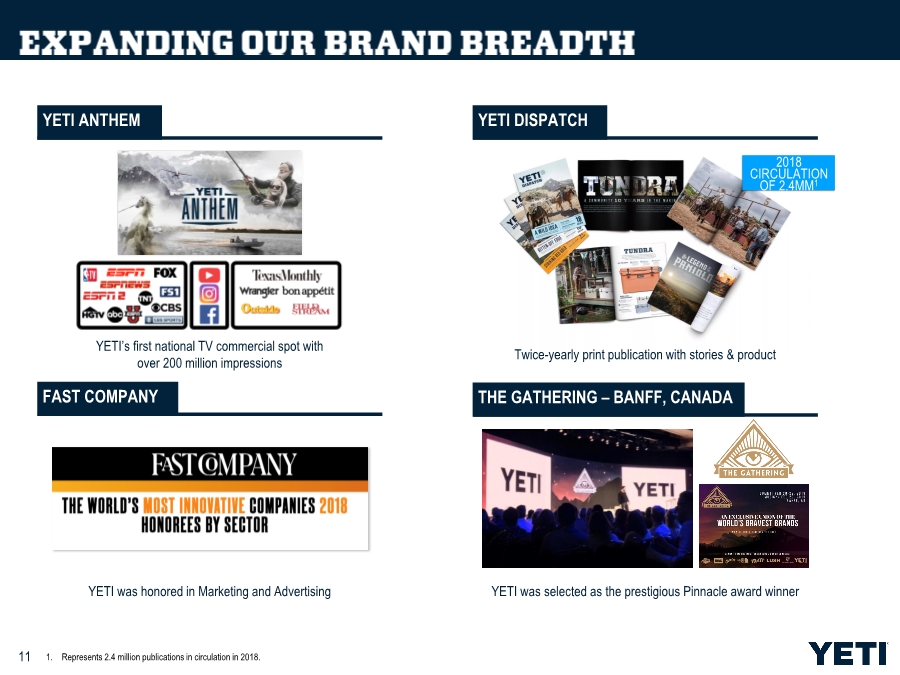
| 11 YETI ANTHEM YETI’s first national TV commercial spot with over 200 million impressions THE GATHERING – BANFF, CANADA Twice-yearly print publication with stories & product FAST COMPANY YETI was honored in Marketing and Advertising YETI was selected as the prestigious Pinnacle award winner YETI DISPATCH 2018 CIRCULATION OF 2.4MM1 1. Represents 2.4 million publications in circulation in 2018. |
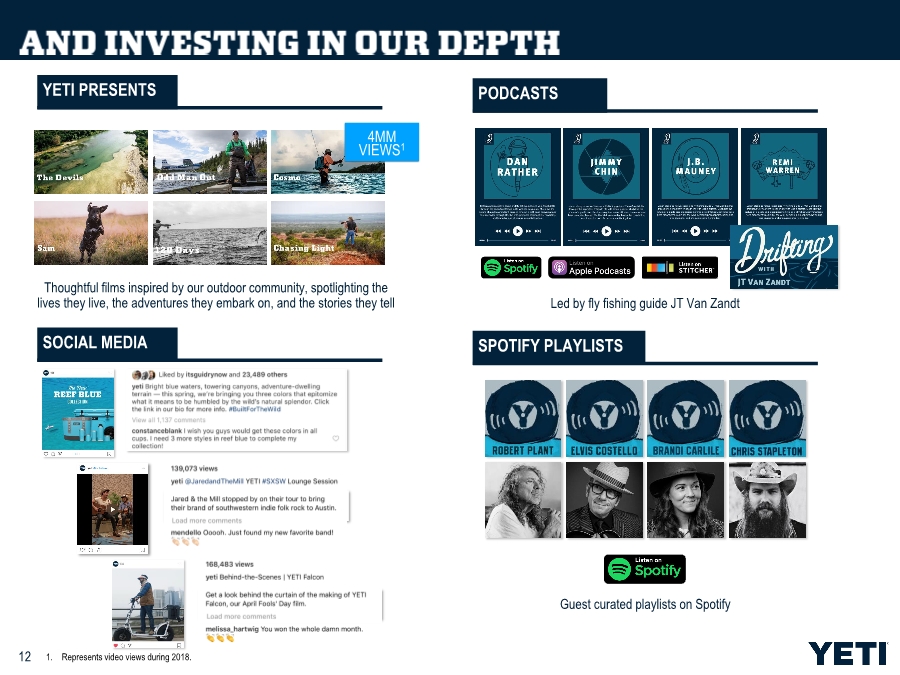
| 12 YETI PRESENTS Thoughtful films inspired by our outdoor community, spotlighting the lives they live, the adventures they embark on, and the stories they tell Guest curated playlists on Spotify PODCASTS 4MM VIEWS1 SOCIAL MEDIA SPOTIFY PLAYLISTS Led by fly fishing guide JT Van Zandt 1. Represents video views during 2018. |
| 13 |

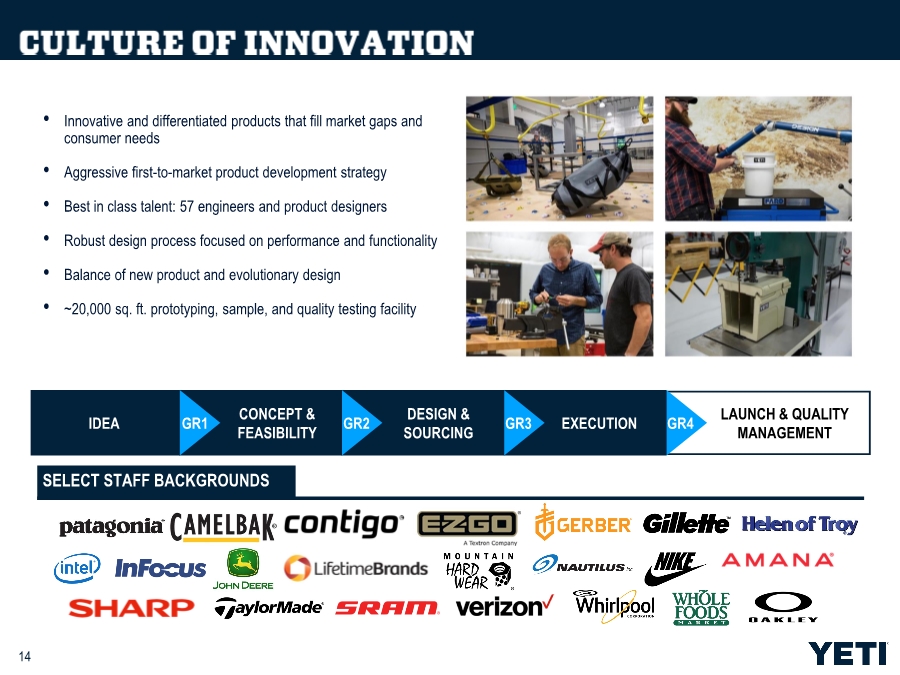
| 14 • Innovative and differentiated products that fill market gaps and consumer needs • Aggressive first-to-market product development strategy • Best in class talent: 57 engineers and product designers • Robust design process focused on performance and functionality • Balance of new product and evolutionary design • ~20,000 sq. ft. prototyping, sample, and quality testing facility IDEA EXECUTION CONCEPT & FEASIBILITY DESIGN & SOURCING LAUNCH & QUALITY MANAGEMENT GR1 GR2 GR3 GR4 SELECT STAFF BACKGROUNDS |
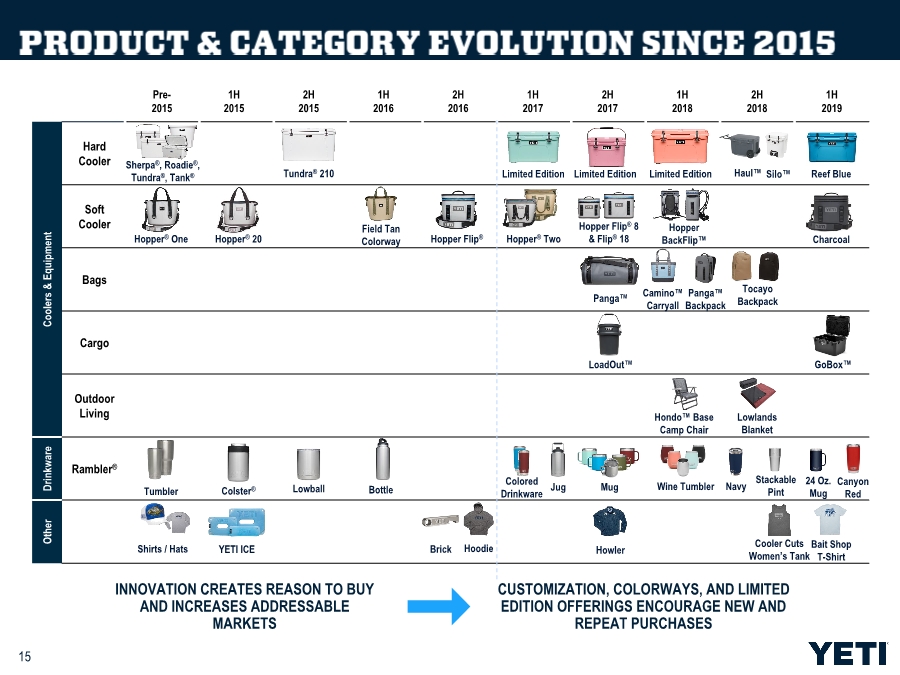
| 15 INNOVATION CREATES REASON TO BUY AND INCREASES ADDRESSABLE MARKETS CUSTOMIZATION, COLORWAYS, AND LIMITED EDITION OFFERINGS ENCOURAGE NEW AND REPEAT PURCHASES Pre- 2015 1H 2015 2H 2015 1H 2016 2H 2016 1H 2017 2H 2017 1H 2018 2H 2018 1H 2019 Coolers & Equipment Hard Cooler Soft Cooler Bags Cargo Outdoor Living Drinkware Rambler® Other Tumbler Bottle Wine Tumbler Colster® Lowball Mug Panga™ Camino™ Carryall Hopper Flip® Hopper® Two Hopper BackFlip™ Sherpa®, Roadie®, Tundra®, Tank® Hopper® One Tundra® 210 Field Tan Colorway Jug Colored Drinkware LoadOut™ Panga™ Backpack Haul™ Silo™ Limited Edition Navy Hopper Flip® 8 & Flip® 18 Hopper® 20 Tocayo Backpack Stackable Pint Lowlands Blanket Hondo™ Base Camp Chair Howler Shirts / Hats YETI ICE Brick 24 Oz. Mug Hoodie Reef Blue Canyon Red Charcoal Limited Edition Limited Edition GoBox™ Bait Shop T-Shirt Cooler Cuts Women’s Tank |
| 16 |

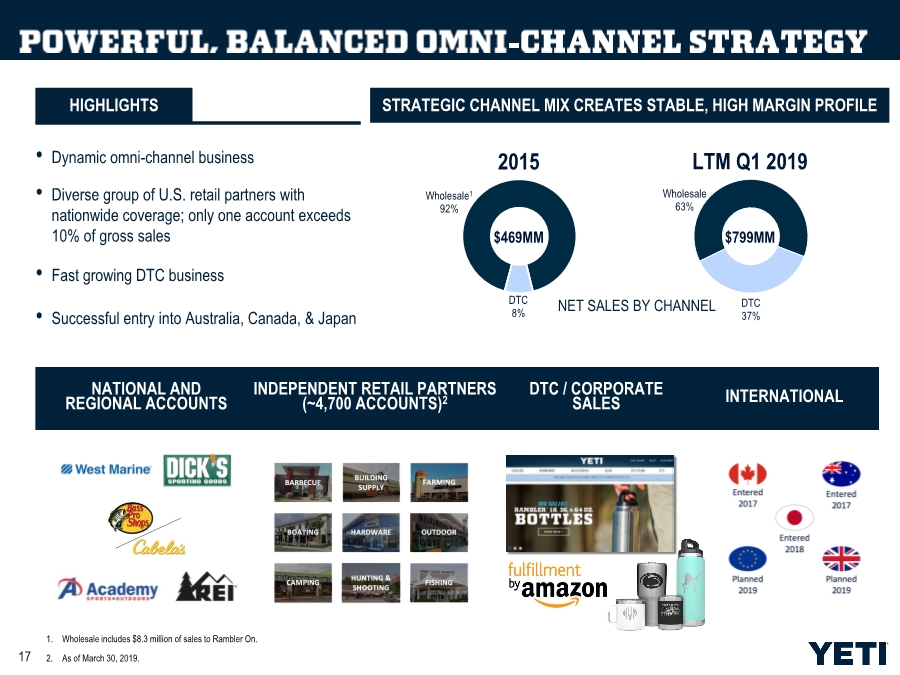
| 17 HIGHLIGHTS • Dynamic omni-channel business • Diverse group of U.S. retail partners with nationwide coverage; only one account exceeds 10% of gross sales • Fast growing DTC business • Successful entry into Australia, Canada, & Japan NET SALES BY CHANNEL NATIONAL AND REGIONAL ACCOUNTS DTC / CORPORATE SALES INTERNATIONAL STRATEGIC CHANNEL MIX CREATES STABLE, HIGH MARGIN PROFILE INDEPENDENT RETAIL PARTNERS (~4,700 ACCOUNTS)2 1. Wholesale includes $8.3 million of sales to Rambler On. 2. As of March 30, 2019. 2015 Wholesale1 92% DTC 8% $469MM LTM Q1 2019 Wholesale 63% DTC 37% $799MM |
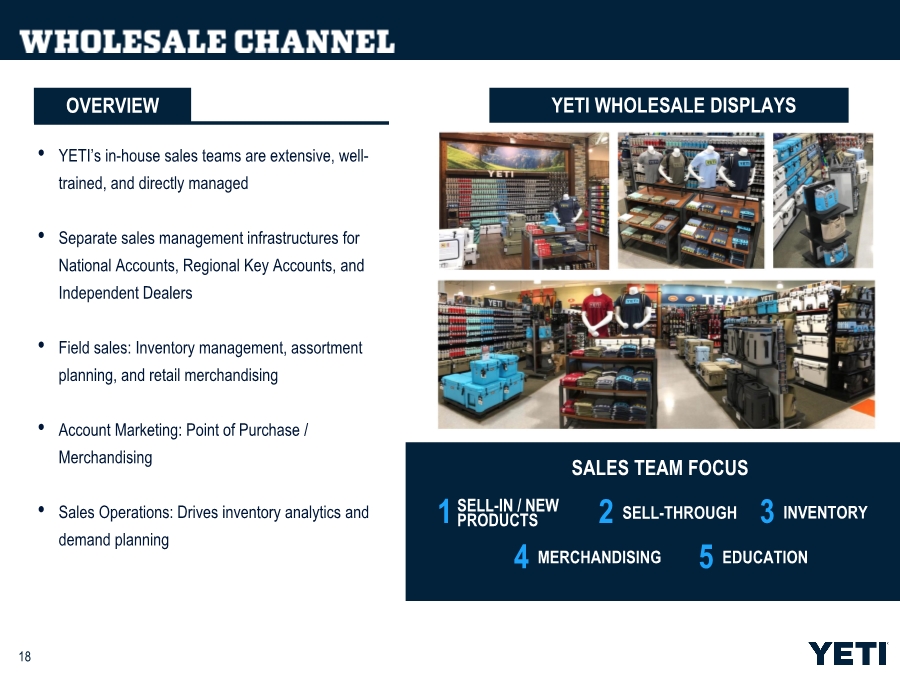
| 18 • YETI’s in-house sales teams are extensive, well- trained, and directly managed • Separate sales management infrastructures for National Accounts, Regional Key Accounts, and Independent Dealers • Field sales: Inventory management, assortment planning, and retail merchandising • Account Marketing: Point of Purchase / Merchandising • Sales Operations: Drives inventory analytics and demand planning SALES TEAM FOCUS 1 SELL-IN / NEW PRODUCTS 2 SELL-THROUGH 3 INVENTORY 4 MERCHANDISING 5 EDUCATION OVERVIEW YETI WHOLESALE DISPLAYS |
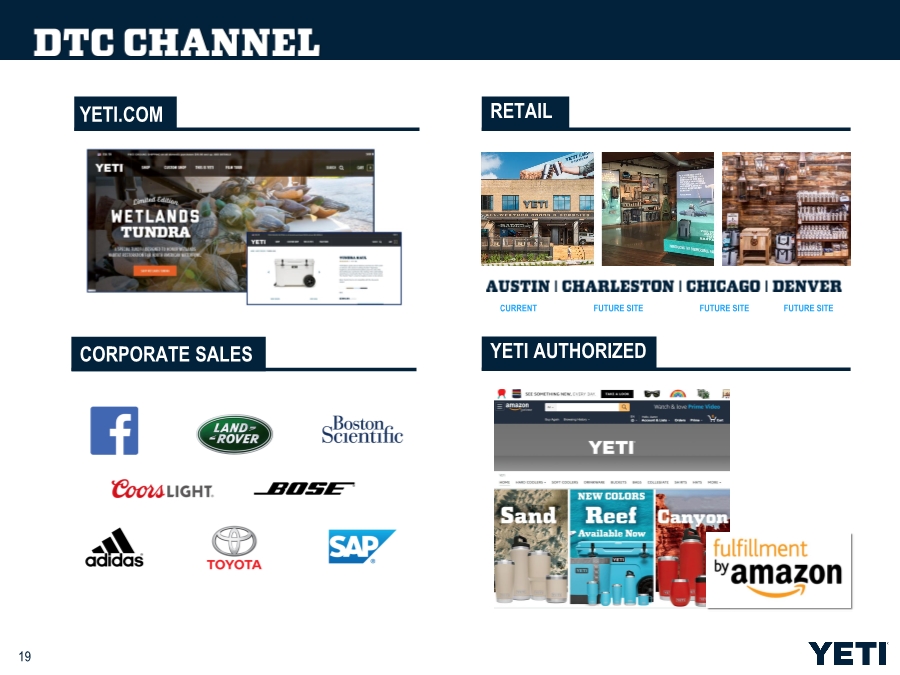
| 19 YETI.COM CORPORATE SALES RETAIL YETI AUTHORIZED CURRENT FUTURE SITE FUTURE SITE FUTURE SITE |
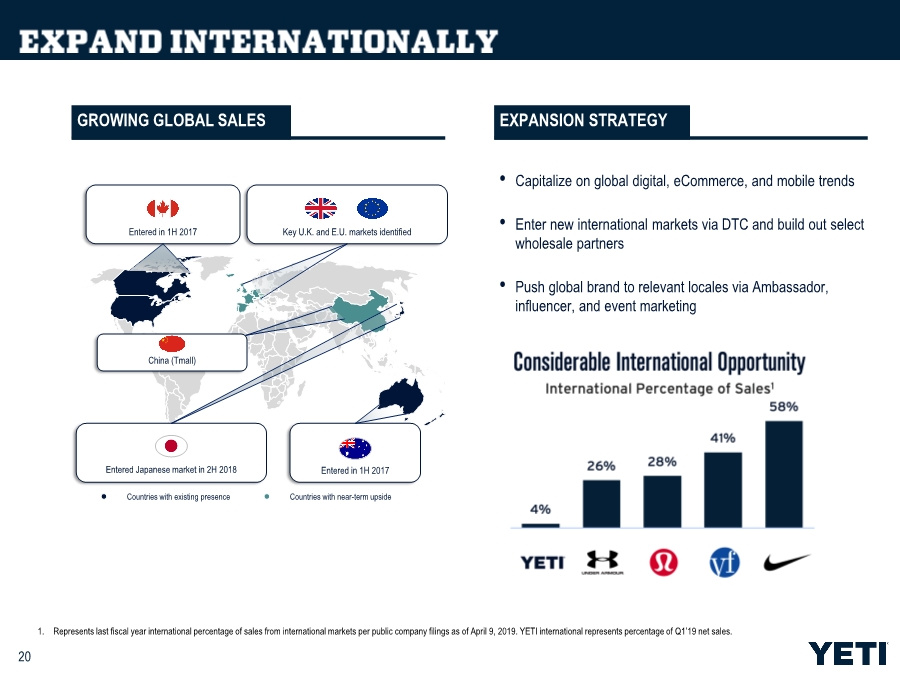
| 20 • Capitalize on global digital, eCommerce, and mobile trends • Enter new international markets via DTC and build out select wholesale partners • Push global brand to relevant locales via Ambassador, influencer, and event marketing EXPANSION STRATEGY GROWING GLOBAL SALES Entered in 1H 2017 Countries with existing presence Countries with near-term upside Entered in 1H 2017 Key U.K. and E.U. markets identified Entered Japanese market in 2H 2018 China (Tmall) 1. Represents last fiscal year international percentage of sales from international markets per public company filings as of April 9, 2019. YETI international represents percentage of Q1’19 net sales. |
| 21 |

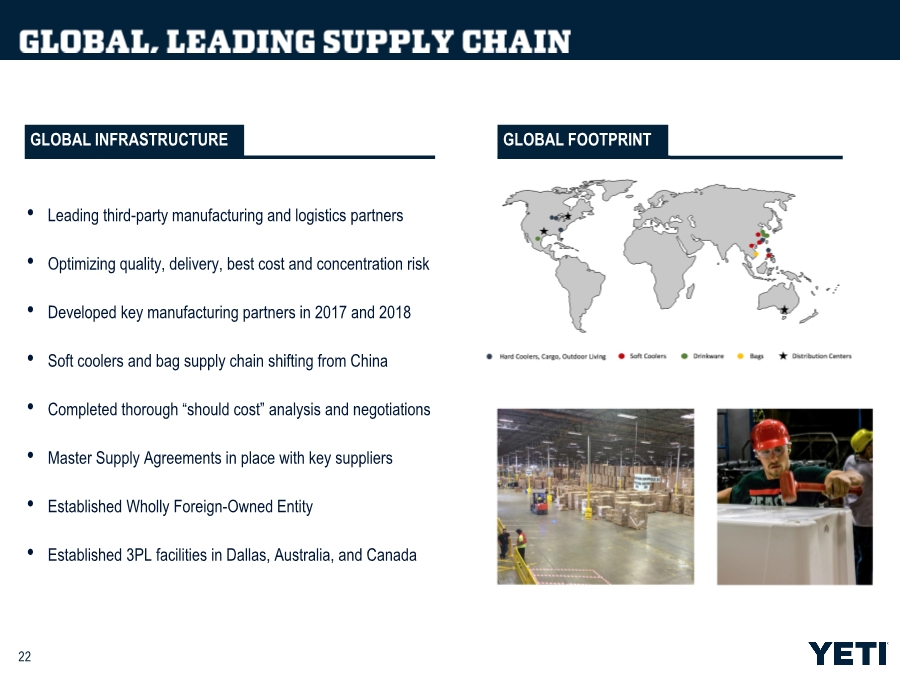
| 22 •Leading third-party manufacturing and logistics partners • Optimizing quality, delivery, best cost and concentration risk • Developed key manufacturing partners in 2017 and 2018 • Soft coolers and bag supply chain shifting from China • Completed thorough “should cost” analysis and negotiations • Master Supply Agreements in place with key suppliers • Established Wholly Foreign-Owned Entity • Established 3PL facilities in Dallas, Australia, and Canada GLOBAL INFRASTRUCTURE GLOBAL FOOTPRINT |
| 23 |

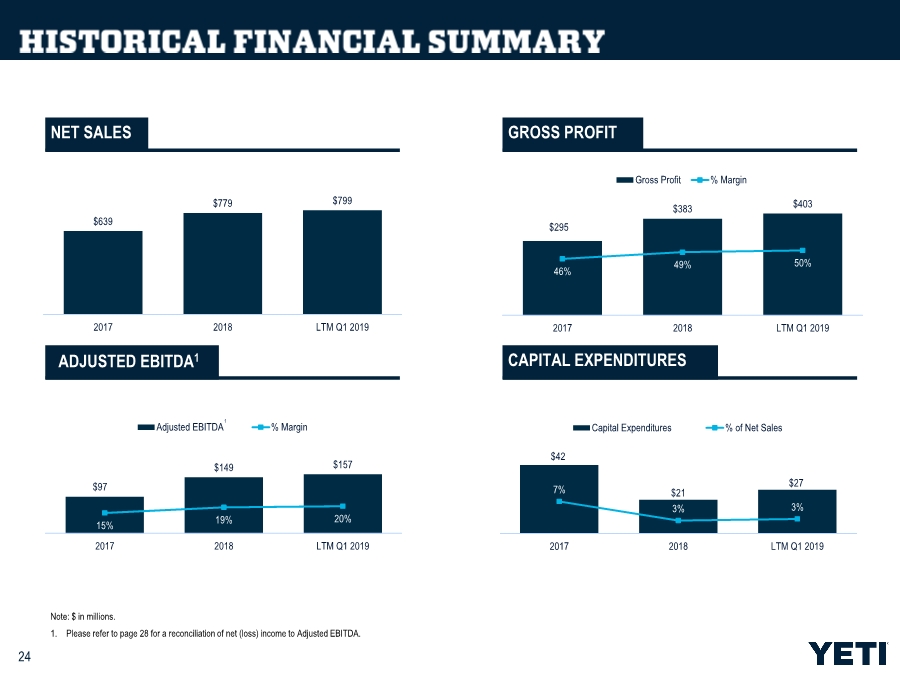
| 24 Note: $ in millions. 1. Please refer to page 28 for a reconciliation of net (loss) income to Adjusted EBITDA. NET SALES GROSS PROFIT CAPITAL EXPENDITURES $639 $779 $799 2017 2018 LTM Q1 2019 $295 $383 $403 46% 49% 50% 2017 2018 LTM Q1 2019 Gross Profit % Margin $97 $149 $157 15% 19% 20% 2017 2018 LTM Q1 2019 Adjusted EBITDA % Margin 1 $42 $21 $27 7% 3% 3% 2017 2018 LTM Q1 2019 Capital Expenditures % of Net Sales ADJUSTED EBITDA1 |
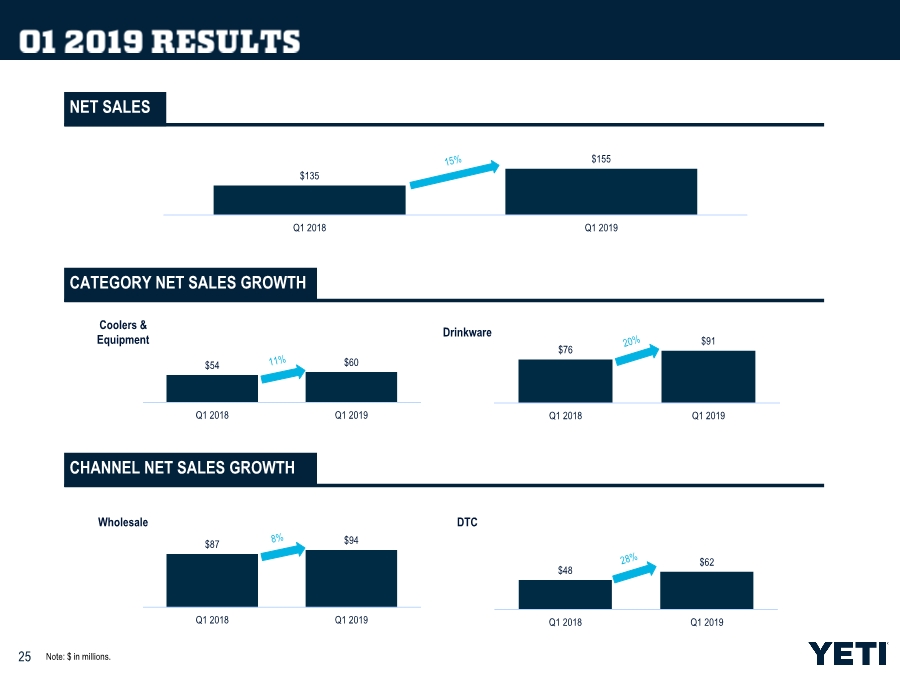
| 25 Note: $ in millions. NET SALES CATEGORY NET SALES GROWTH CHANNEL NET SALES GROWTH $135 $155 Q1 2018 Q1 2019 $54 $60 Q1 2018 Q1 2019 $76 $91 Q1 2018 Q1 2019 Coolers & Equipment Drinkware $87 $94 Q1 2018 Q1 2019 $48 $62 Q1 2018 Q1 2019 Wholesale DTC |
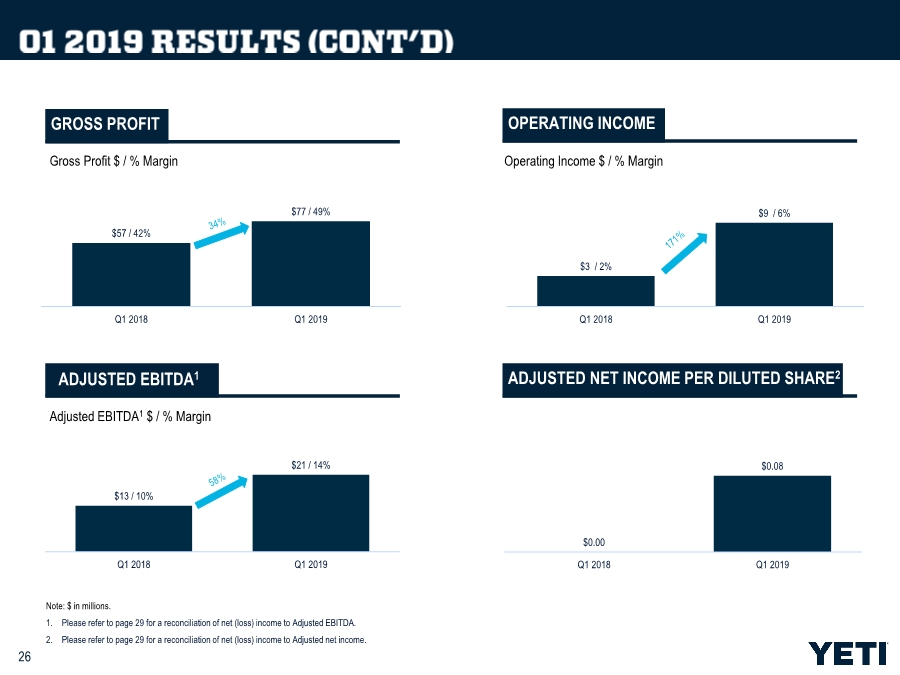
| 26 Note: $ in millions. 1. Please refer to page 29 for a reconciliation of net (loss) income to Adjusted EBITDA. 2. Please refer to page 29 for a reconciliation of net (loss) income to Adjusted net income. GROSS PROFIT OPERATING INCOME ADJUSTED NET INCOME PER DILUTED SHARE2 ADJUSTED EBITDA1 $0.00 $0.08 Q1 2018 Q1 2019 $13 / 10% $21 / 14% Q1 2018 Q1 2019 $57 / 42% $77 / 49% Q1 2018 Q1 2019 $3 / 2% $9 / 6% Q1 2018 Q1 2019 Gross Profit $ / % Margin Adjusted EBITDA1 $ / % Margin Operating Income $ / % Margin |
| 27 |
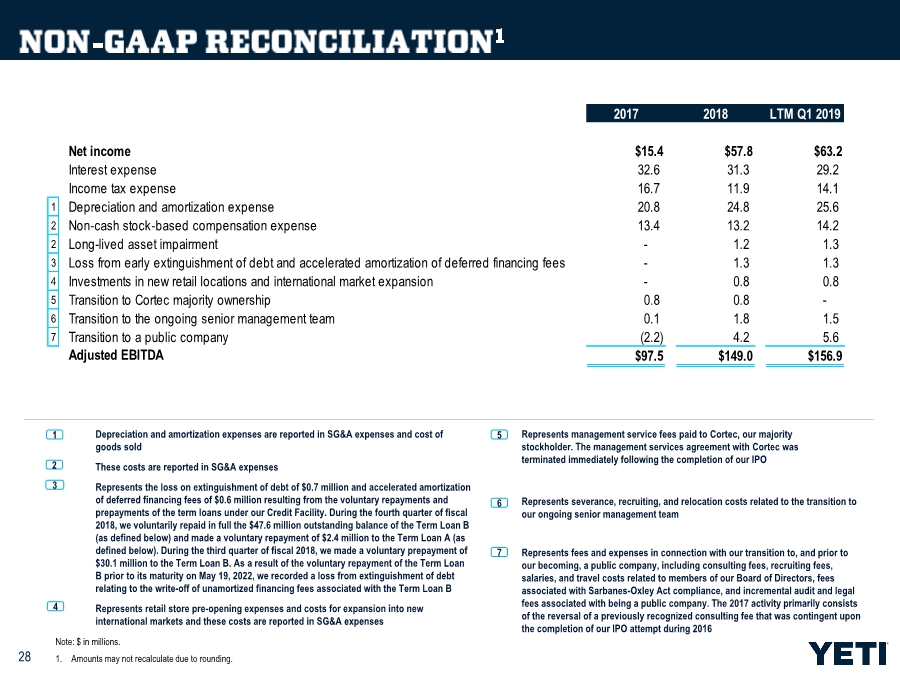
| 28 Depreciation and amortization expenses are reported in SG&A expenses and cost of goods sold 1 Represents retail store pre-opening expenses and costs for expansion into new international markets and these costs are reported in SG&A expenses 4 Represents severance, recruiting, and relocation costs related to the transition to our ongoing senior management team 6 Represents the loss on extinguishment of debt of $0.7 million and accelerated amortization of deferred financing fees of $0.6 million resulting from the voluntary repayments and prepayments of the term loans under our Credit Facility. During the fourth quarter of fiscal 2018, we voluntarily repaid in full the $47.6 million outstanding balance of the Term Loan B (as defined below) and made a voluntary repayment of $2.4 million to the Term Loan A (as defined below). During the third quarter of fiscal 2018, we made a voluntary prepayment of $30.1 million to the Term Loan B. As a result of the voluntary repayment of the Term Loan B prior to its maturity on May 19, 2022, we recorded a loss from extinguishment of debt relating to the write-off of unamortized financing fees associated with the Term Loan B 3 Represents management service fees paid to Cortec, our majority stockholder. The management services agreement with Cortec was terminated immediately following the completion of our IPO 5 Represents fees and expenses in connection with our transition to, and prior to our becoming, a public company, including consulting fees, recruiting fees, salaries, and travel costs related to members of our Board of Directors, fees associated with Sarbanes-Oxley Act compliance, and incremental audit and legal fees associated with being a public company. The 2017 activity primarily consists of the reversal of a previously recognized consulting fee that was contingent upon the completion of our IPO attempt during 2016 7 These costs are reported in SG&A expenses 2 Note: $ in millions. 1. Amounts may not recalculate due to rounding. 2017 2018 LTM Q1 2019 Net income $15.4 $57.8 $63.2 Interest expense 32.6 31.3 29.2 Income tax expense 16.7 11.9 14.1 1 Depreciation and amortization expense 20.8 24.8 25.6 2 Non‑cash stock‑based compensation expense 13.4 13.2 14.2 2 Long-lived asset impairment - 1.2 1.3 3 Loss from early extinguishment of debt and accelerated amortization of deferred financing fees - 1.3 1.3 4 Investments in new retail locations and international market expansion - 0.8 0.8 5 Transition to Cortec majority ownership 0.8 0.8 - 6 Transition to the ongoing senior management team 0.1 1.8 1.5 7 Transition to a public company (2.2) 4.2 5.6 Adjusted EBITDA $97.5 $149.0 $156.9 |
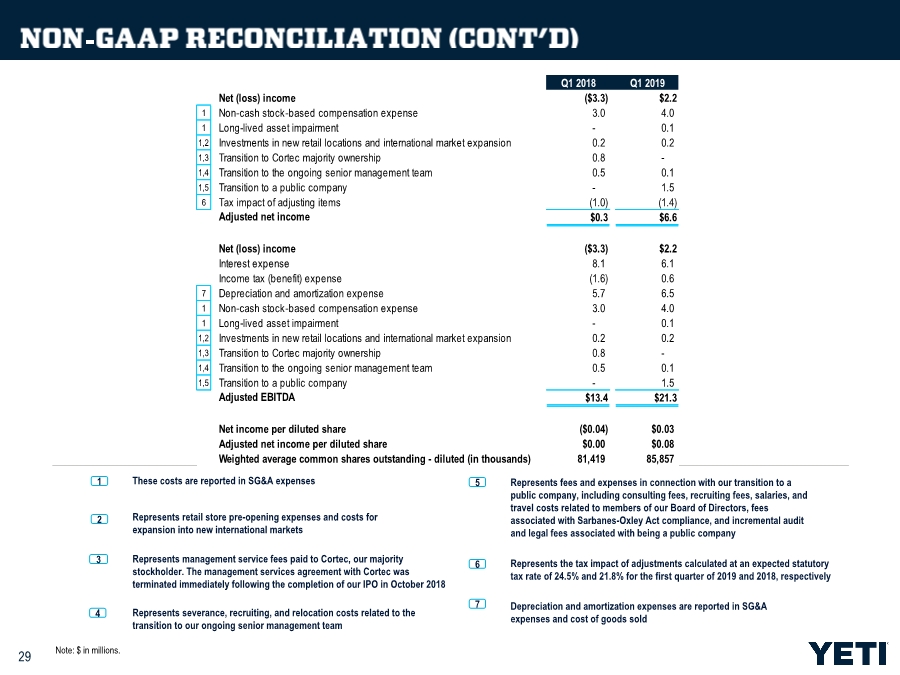
| 29 Depreciation and amortization expenses are reported in SG&A expenses and cost of goods sold Represents retail store pre-opening expenses and costs for expansion into new international markets These costs are reported in SG&A expenses Represents severance, recruiting, and relocation costs related to the transition to our ongoing senior management team Represents the tax impact of adjustments calculated at an expected statutory tax rate of 24.5% and 21.8% for the first quarter of 2019 and 2018, respectively Represents fees and expenses in connection with our transition to a public company, including consulting fees, recruiting fees, salaries, and travel costs related to members of our Board of Directors, fees associated with Sarbanes-Oxley Act compliance, and incremental audit and legal fees associated with being a public company 1 3 2 5 6 7 Note: $ in millions. Represents management service fees paid to Cortec, our majority stockholder. The management services agreement with Cortec was terminated immediately following the completion of our IPO in October 2018 4 Q1 2018 Q1 2019 Net (loss) income ($3.3) $2.2 1 Non‑cash stock‑based compensation expense 3.0 4.0 1 Long-lived asset impairment - 0.1 1,2 Investments in new retail locations and international market expansion 0.2 0.2 1,3 Transition to Cortec majority ownership 0.8 - 1,4 Transition to the ongoing senior management team 0.5 0.1 1,5 Transition to a public company - 1.5 6 Tax impact of adjusting items (1.0) (1.4) Adjusted net income $0.3 $6.6 Net (loss) income ($3.3) $2.2 Interest expense 8.1 6.1 Income tax (benefit) expense (1.6) 0.6 7 Depreciation and amortization expense 5.7 6.5 1 Non‑cash stock‑based compensation expense 3.0 4.0 1 Long-lived asset impairment - 0.1 1,2 Investments in new retail locations and international market expansion 0.2 0.2 1,3 Transition to Cortec majority ownership 0.8 - 1,4 Transition to the ongoing senior management team 0.5 0.1 1,5 Transition to a public company - 1.5 Adjusted EBITDA $13.4 $21.3 Net income per diluted share ($0.04) $0.03 Adjusted net income per diluted share $0.00 $0.08 Weighted average common shares outstanding - diluted (in thousands) 81,419 85,857 |
| 30 |