
Form 8-K TECH DATA CORP For: May 30
UNITED STATES
SECURITIES AND EXCHANGE COMMISSION
WASHINGTON, D.C. 20549
FORM 8-K
CURRENT REPORT PURSUANT TO SECTION 13 OR 15 (d)
OF THE SECURITIES EXCHANGE ACT OF 1934
Date of Report (Date of earliest event reported): May 30, 2019
TECH DATA CORPORATION
(Exact name of registrant as specified in its charter)
Florida | 0-14625 | 59-1578329 |
(State of Incorporation) | (Commission File Number) | (IRS employer Identification No.) |
5350 Tech Data Drive
Clearwater, Florida, 33760
(Address of principal executive offices)
727-539-7429
(Registrant’s telephone number)
Check the appropriate box below if the Form 8-K filing is intended to simultaneously satisfy the filing obligation of the registrant under any of the following provisions:
☐ | Written communications pursuant to Rule 425 under the Securities Act (17 CFR 230.425) |
☐ | Soliciting material pursuant to Rule 14a-12 under the Exchange Act (17 CFR 240.14a-12) |
☐ | Pre-commencement communications pursuant to Rule 14d-2(b) under the Exchange Act (17 CFR 240.14d-2(b)) |
☐ | Pre-commencement communications pursuant to Rule 13e-4(c) under the Exchange Act (17 CFR 240.13e-4(c)) |
Indicate by check mark whether the registrant is an emerging growth company as defined in Rule 405 of the Securities Act of 1933 (§230.405 of this chapter) or Rule 12b-2 of the Securities Exchange Act of 1934 (§240.12b-2 of this chapter).
Emerging growth company ☐
If an emerging growth company, indicate by check mark if the registrant has elected not to use the extended transition period for complying with any new or revised financial accounting standards provided pursuant to Section 13(a) of the Exchange Act. ☐
Item 2.02. | Results of Operations and Financial Condition. |
On May 30, 2019, Tech Data Corporation (the “Company”) issued a press release, furnished as Exhibit 99.1 and incorporated herein by reference, announcing its financial results for the three months ended April 30, 2019. The information in this Form 8-K, including Exhibit 99.1, is furnished and shall not be deemed "filed" for purposes of Section 18 of the Securities Exchange Act of 1934, as amended, or otherwise subject to the liabilities of that section and shall not be deemed incorporated by reference into any registration statement or other document filed pursuant to the Securities Act of 1933, as amended, except as shall be expressly set forth by specific reference in such a filing.
Item 9.01. | Financial Statements and Exhibits. | |||
(d) Exhibits.
The following materials are attached as exhibits to this Current Report on Form 8-K:
SIGNATURE
Pursuant to the requirements of the Securities Exchange Act of 1934, the Registrant has duly caused this report to be signed on its behalf by the undersigned hereunto duly authorized.
Tech Data Corporation | ||
(Registrant) | ||
Date: May 30, 2019 | /s/ Charles V. Dannewitz | |
Charles V. Dannewitz | ||
Executive Vice President, & | ||
Chief Financial Officer | ||

NEWS
FOR IMMEDIATE RELEASE
Tech Data Reports First Quarter Fiscal Year 2020 Results
CLEARWATER, Fla., (May 30, 2019) -- Tech Data (NASDAQ: TECD) (the “Company”) today announced its financial results for the first quarter ended April 30, 2019.
A reconciliation of GAAP to non-GAAP financial measures is presented in the financial tables of this press release.
This information is also available on the Investor Relations section of Tech Data’s website at www.techdata.com/investor.
“We are pleased to report a solid start to Tech Data’s fiscal year 20. In Q1 we delivered double-digit earnings per share growth, generated positive cash flow and earned an industry-leading return on invested capital – all while making good progress on our strategy and continuing to invest for the future. Our worldwide teams executed well in the quarter, despite market uncertainty,” said Rich Hume, chief executive officer. “Looking ahead, although IT market growth has slowed somewhat from the year ago levels, demand continues to be solid and we remain positive on the overall IT spending outlook.”
Page 2 of 11
Regional Financial Highlights for the First Quarter Ended April 30, 2019:
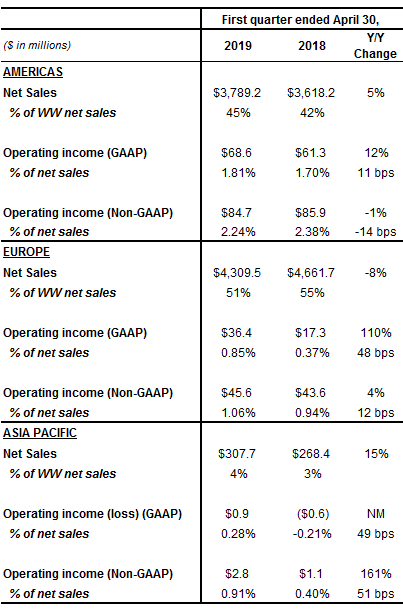
Note: NM = not meaningful, WW = worldwide
Stock-based compensation expense was $8.3 million, an increase of $0.7 million, compared to the prior-year quarter. These expenses are excluded from the regional operating results and presented as a separate line item in the company’s segment reporting (see the GAAP to non-GAAP reconciliation in the financial tables of this press release).
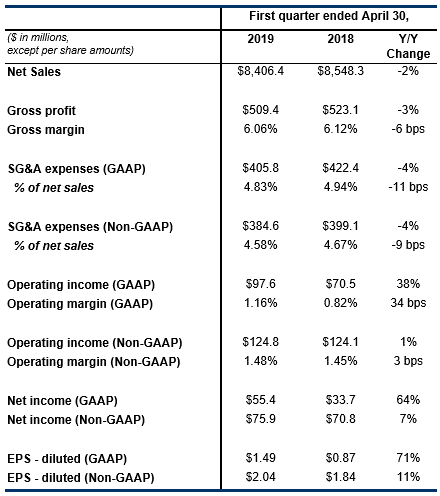
• | Net sales were $8.4 billion, a decrease of 2 percent compared to the prior-year quarter. On a constant currency basis, net sales increased 3 percent. |
o | Americas: Net sales were $3.8 billion, an increase of 5 percent compared to the prior-year quarter. On a constant currency basis, net sales increased 6 percent. |
o | Europe: Net sales were $4.3 billion, a decrease of 8 percent compared to the prior-year quarter. On a constant currency basis, net sales increased 1 percent. |
o | Asia Pacific: Net sales were $0.3 billion, an increase of 15 percent compared to the prior-year quarter. On a constant currency basis, net sales increased 19 percent. |
• | Net cash generated by operations during the quarter was $63 million. |
Page 3 of 11
• | Return on invested capital for the trailing twelve months was 13 percent, compared to 4 percent in the prior year. Adjusted return on invested capital for the trailing twelve months was 14 percent, compared to 11 percent in the prior year. |
“During Q1, we generated $63 million in cash from operations, returned $36 million to our shareholders through share repurchases, and for the trailing twelve month period, earned an adjusted return on invested capital of 14 percent. In addition, we recently improved our liquidity profile to enhance our financial strength and flexibility – all of which reflect our disciplined approach to optimizing our business and commitment to creating shareholder value,” said Chuck Dannewitz, executive vice president, chief financial officer.
Business Outlook
• | For the quarter ending July 31, 2019, the Company anticipates: |
o | Worldwide net sales to be in the range of $8.6 billion to $8.9 billion |
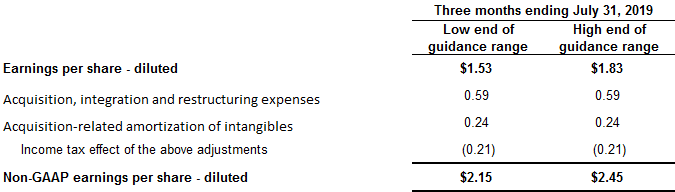
o | EPS to be in the range of $1.53 to $1.83 and non-GAAP EPS to be in the range of $2.15 to $2.45 |
o | An effective tax rate in the range of 24 percent to 26 percent |
• | This guidance assumes an average U.S. dollar to euro exchange rate of $1.12 to €1.00 which compares to $1.17 to €1.00 in the year-ago period. |
Webcast Details
Tech Data will hold a conference call today at 9:00 a.m. (ET) to discuss its financial results for the first quarter ended April 30, 2019. A webcast of the call, including supplemental schedules, will be available to all interested parties and can be obtained at www.techdata.com/investor. The webcast will be available for replay for three months.
Non-GAAP Financial Information
The non-GAAP financial information contained in this release is included with the intention of providing investors a more complete understanding of the Company’s operational results and trends, but should only be used in conjunction with results reported in accordance with Generally Accepted Accounting Principles (“GAAP”). Certain non-GAAP measures presented in this release or other releases, presentations and similar documents issued by the Company include sales, income or expense items as adjusted for the impact of changes in foreign currencies (referred to as “constant currency”), non-GAAP operating income, non-GAAP operating margin, non-GAAP net income, non-GAAP earnings per diluted share and Adjusted Return on Invested Capital. Certain non-GAAP measures also exclude acquisition-related intangible assets amortization expense, benefits associated with legal settlements, acquisition, integration and restructuring expenses, value-added tax assessments and related interest expense, tax indemnifications and changes in deferred tax valuation allowances. A detailed reconciliation of the adjustments between results calculated using GAAP and non-GAAP in this release is contained in the attached financial schedules. This information can also be obtained from the Company’s Investor Relations website at www.techdata.com/investor.
Forward-Looking Statements
Certain statements in this communication may contain “forward-looking statements” within the meaning of the Private Securities Litigation Reform Act of 1995. These statements, including statements regarding Tech Data’s plans, objectives, expectations and intentions, Tech Data’s financial results and estimates and/or business prospects, involve a number of risks and uncertainties and actual results could differ materially from those projected. These forward looking statements are based on current expectations, estimates, forecasts, and projections about the operating environment, economies and markets in which Tech Data operates and the beliefs and assumptions of our management. Words such as “expects,” “anticipates,” “targets,” “goals,” “projects,” “intends,” “plans,” “believes,” “seeks,” “estimates,” variations of such words, and similar expressions are intended to identify such forward looking statements. In addition, any statements that refer to projections of Tech Data’s future financial performance, our anticipated growth and trends in our businesses, and other characterizations of future events or circumstances, are forward looking statements. These forward looking statements are only predictions and are subject to risks, uncertainties, and assumptions. Therefore, actual results may differ materially and adversely from those expressed in any forward looking statements.
Page 4 of 11
For additional information with respect to risks and other factors which could occur, see Tech Data’s Annual Report on Form 10-K for the year ended January 31, 2019, including Part I, Item 1A, “Risk Factors” therein, Quarterly Reports on Form 10-Q, Current Reports on Form 8-K and other securities filings with the Securities and Exchange Commission (the “SEC”) that are available at the SEC’s website at www.sec.gov and other securities regulators. Readers are cautioned not to place undue reliance upon any such forward-looking statements, which speak only as of the date made. Many of these factors are beyond Tech Data’s control. Unless otherwise required by applicable securities laws, Tech Data disclaims any intention or obligation to update or revise any forward-looking statements, whether as a result of new information, future events or otherwise. Tech Data undertakes no duty to update any forward looking statements contained herein to reflect actual results or changes in Tech Data’s expectations.
About Tech Data
Tech Data connects the world with the power of technology. Our end-to-end portfolio of products, services and solutions, highly specialized skills, and expertise in next-generation technologies enable channel partners to bring to market the products and solutions the world needs to connect, grow and advance. Tech Data is ranked No. 88 on the Fortune 500® and has been named one of Fortune's "World's Most Admired Companies" for 10 straight years. To find out more, visit www.techdata.com or follow us on Twitter, LinkedIn, and Facebook.
Investor Contact
Tania Almond
Investor Relations Director
+1 727.538.7064
Media Contact
Bobby Eagle
Director, External Communications
+1 727.538.5864
Page 5 of 11
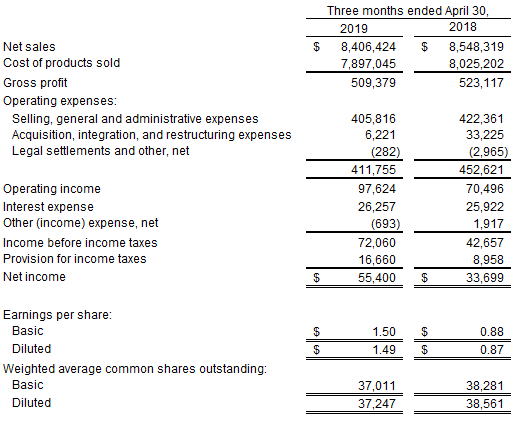
TECH DATA CORPORATION AND SUBSIDIARIES
CONSOLIDATED STATEMENT OF OPERATIONS
(In thousands, except per share amounts)
(Unaudited)
Page 6 of 11
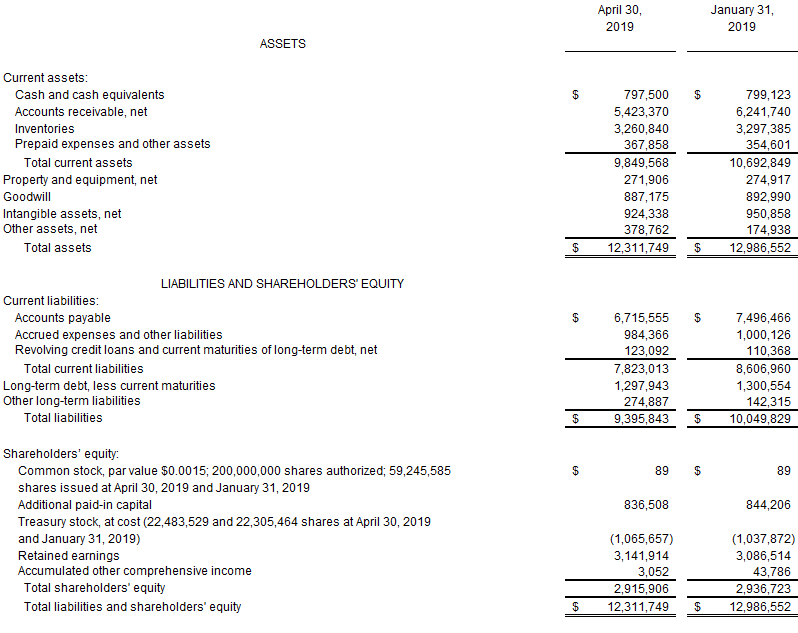
TECH DATA CORPORATION AND SUBSIDIARIES
CONSOLIDATED BALANCE SHEET
(In thousands, except par value and share amounts)
(Unaudited)
Page 7 of 11
TECH DATA CORPORATION AND SUBSIDIARIES
CONSOLIDATED STATEMENT OF CASH FLOWS
(In thousands)
(Unaudited)
Three months ended April 30, | ||||||||
2019 | 2018 | |||||||
Cash flows from operating activities: | ||||||||
Cash received from customers | $ | 11,913,347 | $ | 11,514,374 | ||||
Cash paid to vendors and employees | (11,800,318) | (12,038,399) | ||||||
Interest paid, net | (35,101) | (33,763) | ||||||
Income taxes paid | (14,739) | (8,830) | ||||||
Net cash provided by (used in) operating activities | 63,189 | (566,618) | ||||||
Cash flows from investing activities: | ||||||||
Expenditures for property and equipment | (7,745) | (4,894) | ||||||
Software and software development costs | (7,534) | (3,561) | ||||||
Other | (548) | (267) | ||||||
Net cash used in investing activities | (15,827) | (8,722) | ||||||
Cash flows from financing activities: | ||||||||
Principal payments on long-term debt | (5,224) | (2,899) | ||||||
Cash paid for debt issuance costs | (1,028) | — | ||||||
Net borrowings (repayments) on revolving credit loans | 14,227 | (13,291) | ||||||
Payments for employee tax withholdings on equity awards | (8,602) | (6,255) | ||||||
Proceeds from the reissuance of treasury stock | 495 | 442 | ||||||
Repurchases of common stock | (35,681) | — | ||||||
Net cash used in financing activities | (35,813) | (22,003) | ||||||
Effect of exchange rate changes on cash and cash equivalents | (13,172) | (12,708) | ||||||
Net decrease in cash and cash equivalents | (1,623) | (610,051) | ||||||
Cash and cash equivalents at beginning of year | 799,123 | 955,628 | ||||||
Cash and cash equivalents at end of period | $ | 797,500 | $ | 345,577 | ||||
Reconciliation of net income to net cash provided by operating activities: | ||||||||
Net income | $ | 55,400 | $ | 33,699 | ||||
Adjustments to reconcile net income to net cash provided by (used in) operating activities: | ||||||||
Depreciation and amortization | 37,257 | 40,481 | ||||||
Provision for losses on accounts receivable | 1,765 | 924 | ||||||
Stock-based compensation expense | 8,305 | 7,587 | ||||||
Accretion of debt discount and debt issuance costs | 378 | 378 | ||||||
Changes in operating assets and liabilities: | ||||||||
Accounts receivable | 751,836 | 670,528 | ||||||
Inventories | 2,450 | (7,387) | ||||||
Prepaid expenses and other assets | 2,245 | (30,344) | ||||||
Accounts payable | (706,381) | (1,132,019) | ||||||
Accrued expenses and other liabilities | (90,066) | (150,465) | ||||||
Total adjustments | 7,789 | (600,317) | ||||||
Net cash provided by (used in) operating activities | $ | 63,189 | $ | (566,618) | ||||
Page 8 of 11
TECH DATA CORPORATION AND SUBSIDIARIES
GAAP TO NON-GAAP RECONCILIATION
(In thousands)
Page 9 of 11
TECH DATA CORPORATION AND SUBSIDIARIES
GAAP TO NON-GAAP RECONCILIATION
(In thousands)
Page 10 of 11
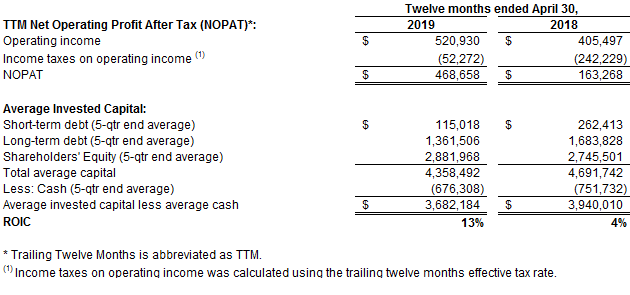
Return on Invested Capital (ROIC)
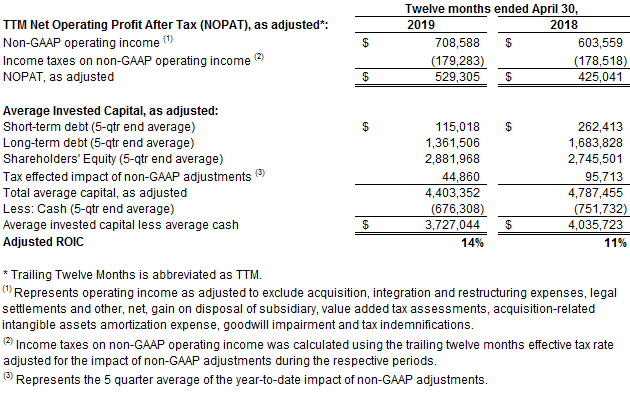
Adjusted Return on Invested Capital (ROIC)
Page 11 of 11
Guidance Reconciliation

Q1 Fiscal Year 2020 Financial Highlights For the quarter ended April 30, 2019 May 30, 2019

Forward-Looking Statements Certain statements in this communication may contain “forward-looking statements” within the meaning of the Private Securities Litigation Reform Act of 1995. These statements, including statements regarding Tech Data’s plans, objectives, expectations and intentions, Tech Data’s financial results and estimates and/or business prospects, involve a number of risks and uncertainties and actual results could differ materially from those projected. These forward looking statements are based on current expectations, estimates, forecasts, and projections about the operating environment, economies and markets in which Tech Data operates and the beliefs and assumptions of our management. Words such as “expects,” “anticipates,” “targets,” “goals,” “projects,” “intends,” “plans,” “believes,” “seeks,” “estimates,” variations of such words, and similar expressions are intended to identify such forward looking statements. In addition, any statements that refer to Tech Data’s future financial performance, our anticipated growth and trends in our businesses, and other characterizations of future events or circumstances, are forward looking statements. These forward looking statements are only predictions and are subject to risks, uncertainties, and assumptions. Therefore, actual results may differ materially and adversely from those expressed in any forward looking statements. For additional information with respect to important risks and other factors that could cause actual results to differ materially from those in the forward-looking statements, see Tech Data’s Annual Report on Form 10-K for the year ended January 31, 2019, including Part I, Item 1A, “Risk Factors” therein, Quarterly Reports on Form 10-Q, Current Reports on Form 8-K and other securities filings with the Securities and Exchange Commission (the “SEC”) that are available at the SEC’s website at www.sec.gov and other securities regulators. Readers are cautioned not to place undue reliance upon any such forward-looking statements, which speak only as of the date made. Many of these factors are beyond Tech Data’s control. Unless otherwise required by applicable securities laws, Tech Data disclaims any intention or obligation to update or revise any forward-looking statements, whether as a result of new information, future events or otherwise. Tech Data undertakes no duty to update any forward looking statements contained herein to reflect actual results or changes in Tech Data’s expectations. Use of Non-GAAP Financial Information This document includes financial results prepared in accordance with generally accepted accounting principles (“GAAP”). In addition to GAAP results, Tech Data management believes that the presentation of non-GAAP financial measures is useful to investors because it provides investors with a more complete understanding of our operational results and a meaningful comparison of our performance between periods. The non-GAAP results and outlook should only be used in conjunction with results reported in accordance with GAAP and are not intended to be a substitute for results reported in accordance with GAAP. Non-GAAP financial measures presented in this presentation or other presentations, press releases and similar documents issued by Tech Data, include but are not limited to sales, income or expense items as adjusted for the impact of changes in foreign currencies (referred to as “constant currency”) , non-GAAP selling, general and administrative expenses (“SG&A”), non-GAAP operating income, non-GAAP operating margin, non-GAAP net income, non-GAAP earnings per diluted share, Adjusted non-GAAP operating income growth, Adjusted non-GAAP EPS growth and Adjusted Return on Invested Capital. These non-GAAP financial measures do not have any standardized meaning and are therefore unlikely to be comparable to similar measures presented by comparable companies. Management may also use these non- GAAP financial measures to establish operational goals and, in some cases, for measuring performance for compensation purposes. This presentation provides a detailed reconciliation between results reported in accordance with GAAP and non-GAAP financial measures. 2

Worldwide Net Sales $ in Billions Q1 FY20: $10.5 • Worldwide reported net sales of $8.4 billion $9.3 3% $8.9 decreased 2% compared to the prior-year quarter. $8.5 3% $8.4 3% 3% 4% 41% • On a constant currency basis, net sales increased 3% 44% 46% compared to the prior-year quarter. Asia Pacific 42% 45% Americas Europe • Three of our vendor partners represented 10% or 56% more of our net sales; Apple represented 13%, Cisco 53% 55% 51% 51% Systems represented 11% and HP Inc represented 10%. Q1 FY19 Q2 FY19 Q3 FY19 Q4 FY19 Q1 FY20 Y/Y Growth 22% 10% 11% 4% -2% Y/Y CC Growth (1) 13% 8% 12% 8% 3% ⁽¹⁾ CC: constant currency 3

Worldwide Gross Profit and Margin $ in Millions Q1 FY20: • Gross profit of $509.4 million decreased 3% compared to the prior-year quarter and increased 2% on a constant currency basis. • Gross margin declined 6 basis points compared to the prior-year quarter. 4

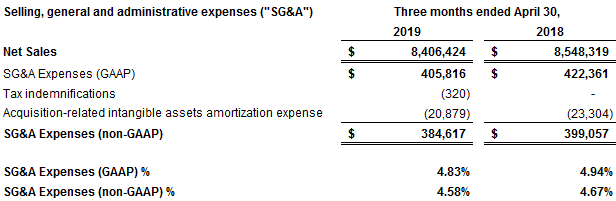
Worldwide SG&A Expenses $ in Millions Q1 FY20: • Non-GAAP SG&A expenses of $384.6 million decreased 4% compared to the prior-year quarter and increased 1% on a constant currency basis. • Non-GAAP SG&A as a percentage of net sales improved 9 basis points compared to the prior-year quarter. • GAAP depreciation and amortization expense was $37.3 million compared to $40.5 million in the prior- year quarter. (1) Non-GAAP SG&A excludes acquisition-related amortization of intangibles expenses and tax indemnifications. See GAAP to Non-GAAP reconciliation in the appendix. Note: Q3 FY19 includes a $25 million benefit from the collection of an accounts receivable balance previously considered uncollectible. 5

Worldwide Operating Income $ in Millions Q1 FY20: • Worldwide non-GAAP operating income of $124.8 million increased 1% compared to the prior-year quarter, and 4% on a constant currency basis. • Worldwide non-GAAP operating margin improved 3 basis points from the prior-year quarter. (1) See the GAAP to Non-GAAP reconciliation in the appendix. Note: Q3 FY19 includes a $25 million benefit from the collection of an accounts receivable balance previously considered uncollectible. 6

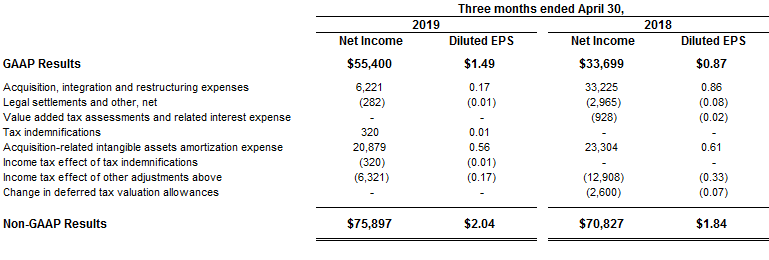
Worldwide Net Income and EPS Q1 FY20: $ in Millions (except EPS) • The effective tax rate was 23%, compared to 21% in the prior-year quarter. The non-GAAP effective tax rate was 23%, compared to 26% in the prior-year quarter. • Non-GAAP net income of $75.9 million increased 7% compared to the prior-year quarter and 11% on a constant currency basis. • Non-GAAP EPS of $2.04 increased 11% compared to the prior-year quarter and 15% on a constant currency basis. (1) See the GAAP to non-GAAP reconciliation in the appendix. Note: Q3 FY19 includes an $18 million net of tax benefit, $0.47 after tax impact in EPS, from the collection of an accounts receivable balance previously considered uncollectible. 7

Regional Results - Americas Net Sales $ in Billions $4.2 Q1 FY20: $4.0 $4.1 $3.8 $3.6 • Americas’ reported net sales were $3.8 billion, an increase of 5% compared to the prior-year quarter. • On a constant currency basis, net sales increased 6% compared to the prior-year quarter. Q1 FY19 Q2 FY19 Q3 FY19 Q4 FY19 Q1 FY20 Americas Y/Y Growth 15% 7% 13% 10% 5% Y/Y CC Growth (1) 15% 7% 14% 11% 6% (1) CC: constant currency 8

Regional Results - Americas Operating Income (1) $ in Millions Q1 FY20: • Americas’ non-GAAP operating income of $84.7 million decreased 1% compared to the prior-year quarter, as well as on a constant currency basis. • Non-GAAP operating margin declined 14 basis points over the prior-year quarter. (1) Before stock compensation expense. (2) See the GAAP to non-GAAP reconciliation in the appendix Note:Q3 FY19 includes a $25 million benefit from the collection of an accounts receivable balance previously considered uncollectible. 9

Regional Results - Europe Net Sales $ in Billions Q1 FY20: $5.9 • Europe’s reported net sales were $4.3 billion, $4.9 $4.7 $4.5 a decline of 8% compared to the prior-year $4.3 quarter. • On a constant currency basis, net sales increased 1% compared to the prior-year quarter. Q1 FY19 Q2 FY19 Q3 FY19 Q4 FY19 Q1 FY20 Europe Y/Y Growth 26% 13% 9% 0% -8% Y/Y CC Growth (1) 10% 9% 12% 5% 1% ⁽¹⁾ CC: constant currency 10

Regional Results - Europe Operating Income (1) $ in Millions Q1 FY20: • Europe’s non-GAAP operating income of $45.6 million increased 4% compared to the prior-year quarter, and 14% on a constant currency basis. • Non-GAAP operating margin improved 12 basis points from the prior-year quarter. (1) Before stock compensation expense. (2) See the GAAP to non-GAAP reconciliation in the appendix. 11

Regional Results - Asia Pacific Net Sales $ in Billions Q1 FY20: $0.33 $0.31 $0.29 • Asia Pacific reported net sales were $0.31 $0.28 $0.27 billion, an increase of 15% compared to the prior-year quarter. • On a constant currency basis, net sales increased 19% compared to the prior-year quarter. Q1 FY19 Q2 FY19 Q3 FY19 Q4 FY19 Q1 FY20 Asia Pacific Y/Y Growth (1) 48% 5% 6% 8% 15% Y/Y CC Growth (2) 46% 7% 12% 13% 19% (1) Tech Data had no operations in the Asia Pacific region prior to the acquisition of Technology Solutions on February 27, 2017 (2) CC: constant currency 12

Regional Results - Asia Pacific Operating Income (1, 3) $ in Millions Q1 FY20: • The Asia Pacific region’s non-GAAP operating income of $2.8 million increased 161% compared to the prior-year quarter, and 163% on a constant currency basis. • Non-GAAP operating margin improved 51 basis points from the prior-year quarter. (1) Before stock compensation expense. (2) See the GAAP to non-GAAP reconciliation in the appendix. (3) GAAP Results for the fourth quarter of fiscal 2019 include a non-cash goodwill impairment charge of $47 million. 13

Worldwide Cash Metrics Cash Flow from Operations Cash Conversion Cycle $ in Millions Q1 FY19 Q2 FY19 Q3 FY19 Q4 FY19 Q1 FY20 Days of Sales 56 53 58 54 59 Outstanding Days of Supply 33 33 33 31 38 Days of Purchases (65) (68) (73) (70) (78) Outstanding Cash Conversion 24 18 18 15 19 Cycle Q1 FY20: • Net cash generated by operations was $63 million. • The cash balance at the end of the quarter was $798 million. 14

Worldwide Balance Sheet Highlights Q1 FY20: • Accumulated other comprehensive income was $3 million. • Capital expenditures were $15 million. • At April 30, 2019, the company had $2.9 billion of equity, and 36.76 million shares outstanding resulting in book value of $79.32 per share. • At April 30, 2019, the company had approximately $1.7 billion of goodwill and acquired intangibles. 15

Worldwide Return on Invested Capital • Company’s Weighted Average Cost of Capital is approximately 9%. • Adjusted return on invested capital in Q1 FY20 TTM (trailing twelve months) was 14% compared to 11% in the prior-year quarter. (1) See reconciliation of ROIC to adjusted ROIC calculation in appendix. 16

Worldwide Share Repurchase Activity Number of Amount Shares Average Repurchased Repurchased Price Per ($ millions) Share (millions) Q1 FY20 Share Repurchases $36 0.346 $103.15 Amount remaining on current authorization $157 million 17

Business Outlook Forward-Looking Statements For the quarter ending July 31, 2019 Certain statements made in this document are “Forward-Looking Statements” as described in the Private Securities Litigation Reform Act of 1995. These statements are subject to risks and uncertainties further described in Tech Data Corporation’s (the Net Sales Range $8.6 billion to $8.9 billion “Company”) Annual Report on Form 10-K for the year EPS Range $1.53 to $1.83 ended January 31, 2019, a copy of which can be obtained from the Company’s Investor Relations Non-GAAP EPS Range (1) $2.15 to $2.45 website at www.techdata.com/investor. A number of important factors, some of which are beyond the Company’s control, could cause actual events and Q2 FY20 business outlook assumes the following: results to differ materially from those contained in or • U.S. dollar to euro exchange rate of $1.12 to €1.00 compared with $1.17 to €1.00 in the prior-year quarter. implied by the forward-looking statements. Forward- • For the quarter ending July 31, 2019, the Company anticipates its effective tax rate will be looking statements reflect management's analysis as in the range of 24 percent to 26 percent. of the filing date of this presentation. The Company does not undertake to update or revise these statements to reflect subsequent developments. (1) See reconciliation in appendix. 18

APPENDIX GAAP to Non-GAAP Reconciliations 19

SG&A $ in thousands Q1 FY19 Q2 FY19 Q3 FY19 Q4 FY19 Q1 FY20 Net Sales $ 8,548,319 $ 8,886,101 $ 9,340,029 $ 10,464,501 $ 8,406,424 SG&A Expenses (GAAP) $ 422,361 $ 415,319 $ 396,675 $ 414,540 $ 405,816 Tax indemnifications - (554) (5,541) (3,539) (320) Acquisition-related intangible assets amortization expense (23,304) (22,715) (22,523) (22,706) (20,879) SG&A Expenses (non-GAAP) $ 399,057 $ 392,050 $ 368,611 $ 388,295 $ 384,617 SG&A Expenses (GAAP) % 4.94% 4.67% 4.25% 3.96% 4.83% SG&A Expenses (non-GAAP) % 4.67% 4.41% 3.95% 3.71% 4.58% 20

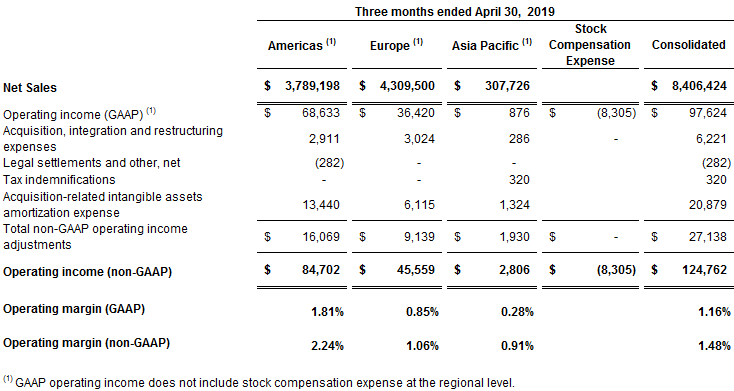
Operating Income Q1 FY20 (In thousands) Q1 FY20 Stock Americas (1) Europe (1) Asia Pacific (1) Compensation Consolidated Expense Net Sales $ 3,789,198 $ 4,309,500 $ 307,726 $ 8,406,424 Operating income (GAAP) (1) $ 68,633 $ 36,420 $ 876 $ (8,305) $ 97,624 Acquisition, integration and restructuring 2,911 3,024 286 - 6,221 expenses Legal settlements and other, net (282) - - (282) Tax indemnifications - - 320 320 Acquisition-related intangible assets 13,440 6,115 1,324 20,879 amortization expense Total non-GAAP operating income $ 16,069 $ 9,139 $ 1,930 $ - $ 27,138 adjustments Operating income (non-GAAP) $ 84,702 $ 45,559 $ 2,806 $ (8,305) $ 124,762 Operating margin (GAAP) 1.81% 0.85% 0.28% 1.16% Operating margin (non-GAAP) 2.24% 1.06% 0.91% 1.48% (1) GAAP operating income does not include stock compensation expense at the regional level. 21

Operating Income Q4 FY19 (In thousands) Q4 FY19 Stock Americas (1) Europe (1) Asia Pacific (1) Compensation Consolidated Expense Net Sales $ 4,241,714 $ 5,895,072 $ 327,715 $ 10,464,501 Operating income (GAAP) (1) $ 104,966 $ 109,083 $ (40,177) $ (7,819) $ 166,053 Acquisition, integration and restructuring 6,145 13,293 1,348 335 21,121 expenses Goodwill impairment - - 47,434 - 47,434 Tax indemnifications 708 3,033 (202) 3,539 Acquisition-related intangible assets 13,414 7,977 1,315 22,706 amortization expense Total non-GAAP operating income $ 20,267 $ 24,303 $ 49,895 $ 335 $ 94,800 adjustments Operating income (non-GAAP) $ 125,233 $ 133,386 $ 9,718 $ (7,484) $ 260,853 Operating margin (GAAP) 2.47% 1.85% -12.26% 1.59% Operating margin (non-GAAP) 2.95% 2.26% 2.97% 2.49% (1) GAAP operating income does not include stock compensation expense at the regional level. 22

Operating Income Q3 FY19 (In thousands) Q3 FY19 Stock Americas (1) Europe (1) Asia Pacific (1) Compensation Consolidated Expense Net Sales $ 4,137,852 $ 4,920,156 $ 282,021 $ 9,340,029 Operating income (GAAP) (1) $ 112,399 $ 39,889 $ 2,739 $ (8,139) $ 146,888 Acquisition, integration and restructuring 5,989 13,132 578 578 20,277 expenses Legal settlements and other, net (7,207) - - (7,207) Gain on disposal of subsidiary - (29) - (29) Tax indemnifications - 5,541 - 5,541 Acquisition-related intangible assets 13,569 7,640 1,314 22,523 amortization expense Total non-GAAP operating income $ 12,351 $ 26,284 $ 1,892 $ 578 $ 41,105 adjustments Operating income (non-GAAP) $ 124,750 $ 66,173 $ 4,631 $ (7,561) $ 187,993 Operating margin (GAAP) 2.72% 0.81% 0.97% 1.57% Operating margin (non-GAAP) 3.01% 1.34% 1.64% 2.01% (1) GAAP operating income does not include stock compensation expense at the regional level. 23

Operating Income Q2 FY19 (In thousands) Q2 FY19 Stock Americas (1) Europe (1) Asia Pacific (1) Compensation Consolidated Expense Net Sales $ 4,043,331 $ 4,549,127 $ 293,643 $ 8,886,101 Operating income (GAAP) (1) $ 87,930 $ 29,085 $ 1,318 $ (7,968) $ 110,365 Acquisition, integration and restructuring (844) 13,342 131 668 13,297 expenses Legal settlements and other, net (5,234) - - (5,234) Gain on disposal of subsidiary - (6,717) - (6,717) Tax indemnifications - 910 (356) 554 Acquisition-related intangible assets 13,570 7,727 1,418 22,715 amortization expense Total non-GAAP operating income $ 7,492 $ 15,262 $ 1,193 $ 668 $ 24,615 adjustments Operating income (non-GAAP) $ 95,422 $ 44,347 $ 2,511 $ (7,300) $ 134,980 Operating margin (GAAP) 2.17% 0.64% 0.45% 1.24% Operating margin (non-GAAP) 2.36% 0.97% 0.86% 1.52% (1) GAAP operating income does not include stock compensation expense at the regional level. 24

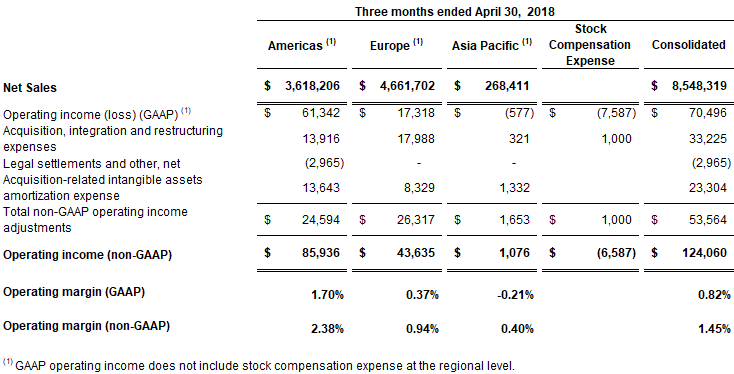
Operating Income Q1 FY19 (In thousands) Q1 FY19 Stock Americas (1) Europe (1) Asia Pacific (1) Compensation Consolidated Expense Net Sales $ 3,618,206 $ 4,661,702 $ 268,411 $ 8,548,319 Operating income (GAAP) (1) $ 61,342 $ 17,318 $ (577) $ (7,587) $ 70,496 Acquisition, integration and restructuring 13,916 17,988 321 1,000 33,225 expenses Legal settlements and other, net (2,965) - - (2,965) Acquisition-related intangible assets 13,643 8,329 1,332 23,304 amortization expense Total non-GAAP operating income $ 24,594 $ 26,317 $ 1,653 $ 1,000 $ 53,564 adjustments Operating income (non-GAAP) $ 85,936 $ 43,635 $ 1,076 $ (6,587) $ 124,060 Operating margin (GAAP) 1.70% 0.37% -0.21% 0.82% Operating margin (non-GAAP) 2.38% 0.94% 0.40% 1.45% (1) GAAP operating income does not include stock compensation expense at the regional level. 25

Net Income and EPS (In thousands, except per Q1 FY19 Q2 FY19 Q3 FY19 Q4 FY19 Q1 FY20 share data) Net Income Diluted EPS Net Income Diluted EPS Net Income Diluted EPS Net Income Diluted EPS Net Income Diluted EPS GAAP Results $33,699 $0.87 $75,866 $1.97 $114,216 $2.96 $116,799 $3.11 $55,400 $1.49 Acquisition, integration and restructuring expenses 33,225 0.86 13,297 0.34 20,277 0.53 21,121 0.56 6,221 0.17 Goodwill impairment - - - - - - 47,434 1.26 - - Legal settlements and other, net (2,965) (0.08) (5,234) (0.13) (7,207) (0.19) - - (282) (0.01) Gain on disposal of subsidiary - - (6,717) (0.17) (29) - - - - - Value added tax assessments and related interest expense (928) (0.02) - - - - - - - - Tax indemnifications - - 554 0.01 5,541 0.14 3,539 0.09 320 0.01 Acquisition-related intangible assets amortization expense 23,304 0.61 22,715 0.59 22,523 0.58 22,706 0.60 20,879 0.56 Income tax effect of tax indemnifications - - (554) (0.01) (5,541) (0.14) (3,539) (0.09) (320) (0.01) Income tax effect of other adjustments above (12,908) (0.33) (9,404) (0.25) (8,798) (0.23) (8,815) (0.23) (6,321) (0.17) Income tax benefit from acquisition settlement - - (12,839) (0.34) (207) - - - - - Change in deferred tax valuation allowances (2,600) (0.07) - - (473) (0.01) (2,914) (0.08) - - Impact of US tax reform - - - - (24,000) (0.62) (25,234) (0.67) - - Non-GAAP Results $70,827 $1.84 $77,684 $2.01 $116,302 $3.02 $171,097 $4.55 $75,897 $2.04 Weighted average shares 38,561 38,566 38,526 37,577 37,247 outstanding - diluted 26

Return on Invested Capital $ in thousands Twelve months ended April 30, TTM Net Operating Profit After Tax (NOPAT)*: 2018 2019 Operating income $ 405,497 $ 520,930 Income taxes on operating income (1) (242,229) (52,272) NOPAT $ 163,268 $ 468,658 Average Invested Capital: Short-term debt (5-qtr end average) $ 262,413 $ 115,018 Long-term debt (5-qtr end average) 1,683,828 1,361,506 Shareholders' Equity (5-qtr end average) 2,745,501 2,881,968 Total average capital 4,691,742 4,358,492 Less: Cash (5-qtr end average) (751,732) (676,308) Average invested capital less average cash $ 3,940,010 $ 3,682,184 ROIC 4% 13% * Trailing Twelve Months is abbreviated as TTM. (1) Income taxes on operating income was calculated using the trailing twelve months effective tax rate. 27

Adjusted Return on Invested Capital $ in thousands Twelve months ended April 30, TTM Net Operating Profit After Tax (NOPAT), as adjusted*: 2018 2019 Non-GAAP operating income (1) $ 603,559 $ 708,588 Income taxes on non-GAAP operating income (2) (178,518) (179,283) NOPAT, as adjusted $ 425,041 $ 529,305 Average Invested Capital, as adjusted: Short-term debt (5-qtr end average) $ 262,413 $ 115,018 Long-term debt (5-qtr end average) 1,683,828 1,361,506 Shareholders' Equity (5-qtr end average) 2,745,501 2,881,968 Tax effected impact of non-GAAP adjustments (3) 95,713 44,860 Total average capital, as adjusted 4,787,455 4,403,352 Less: Cash (5-qtr end average) (751,732) (676,308) Average invested capital less average cash $ 4,035,723 $ 3,727,044 Adjusted ROIC 11% 14% * Trailing Twelve Months is abbreviated as TTM. (1) Represents operating income as adjusted to exclude acquisition, integration and restructuring expenses, legal settlements and other, net, gain on disposal of subsidiary, value added tax assessments, acquisition- related intangible assets amortization expense, goodwill impairment and tax indemnifications. (2) Income taxes on non-GAAP operating income was calculated using the trailing twelve months effective tax rate adjusted for the impact of non-GAAP adjustments during the respective periods. (3) Represents the 5 quarter average of the year-to-date impact of non-GAAP adjustments. 28

Guidance Reconciliation Three months ending July 31, 2019 Low end of High end of guidance range guidance range Earnings per share - diluted $1.53 $1.83 Acquisition, integration and restructuring expenses 0.59 0.59 Acquisition-related amortization of intangibles 0.24 0.24 Income tax effect of the above adjustments (0.21) (0.21) Non-GAAP earnings per share - diluted $2.15 $2.45 29