
Form 8-K INTEL CORP For: May 08
UNITED STATES
SECURITIES AND EXCHANGE COMMISSION
Washington, D.C. 20549
FORM 8-K
CURRENT REPORT
Pursuant to Section 13 or 15(d)
of the Securities Exchange Act of 1934
Date of Report (Date of earliest event reported): May 8, 2019

INTEL CORPORATION
(Exact name of registrant as specified in its charter)
| Delaware | 000-06217 | 94-1672743 | ||
| (State or Other Jurisdiction of Incorporation) |
(Commission File Number) |
(IRS Employer Identification No.) | ||
| 2200 Mission College Blvd., Santa Clara, California | 95054-1549 | |||
| (Address of principal executive offices) | (Zip Code) | |||
Registrant’s telephone number, including area code: (408) 765-8080
Not Applicable
(Former name or former address, if changed since last report.)
Check the appropriate box below if the Form 8-K filing is intended to simultaneously satisfy the filing obligation of the registrant under any of the following provisions:
| ☐ | Written communications pursuant to Rule 425 under the Securities Act (17 CFR 230.425) |
| ☐ | Soliciting material pursuant to Rule 14a-12 under the Exchange Act (17 CFR 240.14a-12) |
| ☐ | Pre-commencement communications pursuant to Rule 14d-2(b) under the Exchange Act (17 CFR 240.14d-2(b)) |
| ☐ | Pre-commencement communications pursuant to Rule 13e-4(c) under the Exchange Act (17 CFR 240.13e-4(c)) |
Indicate by check mark whether the registrant is an emerging growth company as defined in Rule 405 of the Securities Act of 1933 (§230.405 of this chapter) or Rule 12b-2 of the Securities Exchange Act of 1934 (§240.12b-2 of this chapter).
Emerging growth company ☐
If an emerging growth company, indicate by check mark if the registrant has elected not to use the extended transition period for complying with any new or revised financial accounting standards provided pursuant to Section 13(a) of the Exchange Act. ☐
Securities registered pursuant to Section 12(b) of the Act:
| Title of each class |
Trading Symbol(s) |
Name of each exchange on which registered | ||
| Common stock, $0.001 par value | INTC | The Nasdaq Global Select Market |
| Item 7.01 | Regulation FD Disclosure. |
On May 8, 2019, Intel Corporation (“Intel”) held a publicly available webcast meeting for investors and the general public (the “Investor Meeting”). At the Investor Meeting, presentations discussing Intel’s strategy, financial performance, and product roadmap, among other topics, were given by (1) Robert H. Swan, Chief Executive Officer; (2) Venkata S.M. (“Murthy”) Renduchintala, Executive Vice President; Group President, Technology, Systems Architecture and Client Group, and Chief Engineering Officer; (3) Navin Shenoy, Executive Vice President; General Manager, Data Center Group; (4) Gregory M. Bryant, Senior Vice President; General Manager, Client Computing Group; and (5) George S. Davis, Executive Vice President; Chief Financial Officer. These presentations are attached as exhibits to this report.
These presentations and a recording of the webcast may also be found on Intel’s Investor Relations website, www.intc.com.
The presentations contain forward-looking statements relating to Intel’s financial plan as well as other statements that refer to future plans and expectations, including with respect to Intel’s future technologies and the expected benefits of such technologies. Such statements involve a number of risks and uncertainties. Words such as “anticipates,” “expects,” “intends,” “goals,” “plans,” “believes,” “seeks,” “estimates,” “continues,” “may,” “will,” “would,” “should,” “could,” and variations of such words and similar expressions are intended to identify forward-looking statements. Statements that refer to or are based on estimates, forecasts, projections, uncertain events or assumptions, including statements relating to total addressable market (TAM) or market opportunity, future products and the expected availability and benefits of such products, and anticipated trends in our businesses or the markets relevant to them, also identify forward-looking statements. Such statements are based on current expectations and involve many risks and uncertainties that could cause actual results to differ materially from those expressed or implied in these forward-looking statements. Important factors that could cause actual results to differ materially from the company’s expectations are set forth in Intel’s most recent earnings release dated April 25, 2019, which is included as an exhibit to Intel’s Form 8-K furnished to the Securities and Exchange Commission (“SEC”) on such date. Additional information regarding these and other factors that could affect Intel’s results is included in Intel’s Annual Report on Form 10-K for the year ended December 29, 2018, filed with the SEC on February 1, 2019.
The information in Item 7.01 of this report is furnished and shall not be treated as filed for purposes of the Securities Exchange Act of 1934, as amended.
| Item 9.01 | Financial Statements and Exhibits. |
(d) Exhibits.
The following exhibits are furnished as part of this report:
SIGNATURES
Pursuant to the requirements of the Securities Exchange Act of 1934, the Registrant has duly caused this report to be signed on its behalf by the undersigned hereunto duly authorized.
| INTEL CORPORATION | ||||||
| (Registrant) | ||||||
| Date: May 9, 2019 | /s/ Steven R. Rodgers | |||||
| Steven R. Rodgers | ||||||
| Executive Vice President and General Counsel | ||||||
Exhibit 99.1 CHIEF EXECUTIVE OFFICERExhibit 99.1 CHIEF EXECUTIVE OFFICER
This presentation contains non-GAAP financial measures. You can find the reconciliation of these measures to the most directly comparable GAAP financial measure in the Appendix at the end of this presentation. The non-GAAP financial measures disclosed by Intel should not be considered a substitute for, or superior to, the financial measures prepared in accordance with GAAP. Please refer to “Explanation of Non-GAAP Measures” in Intel's quarterly earnings release for a detailed explanation of the adjustments made to the comparable GAAP measures, the ways management uses the non-GAAP measures and the reasons why management believes the non-GAAP measures provide investors with useful supplemental information. Statements in this presentation that refer to business outlook, future plans and expectations are forward-looking statements that involve a number of risks and uncertainties. Words such as anticipates, expects, intends, goals, plans, believes, seeks, estimates, continues, may, will, “would,” should, “could,” and variations of such words and similar expressions are intended to identify such forward-looking statements. Statements that refer to or are based on estimates, forecasts, projections, uncertain events or assumptions, including statements relating to total addressable market (TAM) or market opportunity, future products and the expected availability and benefits of such products, and anticipated trends in our businesses or the markets relevant to them, also identify forward-looking statements. Such statements are based on management's expectations as of May 8, 2019, unless an earlier date is indicated, and involve many risks and uncertainties that could cause actual results to differ materially from those expressed or implied in these forward-looking statements. Important factors that could cause actual results to differ materially from the company's expectations are set forth in Intel's earnings release dated April 25, 2019, which is included as an exhibit to Intel’s Form 8-K furnished to the SEC on such date. Additional information regarding these and other factors that could affect Intel's results is included in Intel's SEC filings, including the company's most recent reports on Forms 10-K and 10-Q. Copies of Intel's Form 10- K, 10-Q and 8-K reports may be obtained by visiting our Investor Relations website at www.intc.com or the SEC's website at www.sec.gov. All information in this presentation reflects management’s views as of May 8, 2019, unless an earlier date is indicated. Intel does not undertake, and expressly disclaims any duty, to update any statement made in this presentation, whether as a result of new information, new developments or otherwise, except to the extent that disclosure may be required by law.This presentation contains non-GAAP financial measures. You can find the reconciliation of these measures to the most directly comparable GAAP financial measure in the Appendix at the end of this presentation. The non-GAAP financial measures disclosed by Intel should not be considered a substitute for, or superior to, the financial measures prepared in accordance with GAAP. Please refer to “Explanation of Non-GAAP Measures” in Intel's quarterly earnings release for a detailed explanation of the adjustments made to the comparable GAAP measures, the ways management uses the non-GAAP measures and the reasons why management believes the non-GAAP measures provide investors with useful supplemental information. Statements in this presentation that refer to business outlook, future plans and expectations are forward-looking statements that involve a number of risks and uncertainties. Words such as anticipates, expects, intends, goals, plans, believes, seeks, estimates, continues, may, will, “would,” should, “could,” and variations of such words and similar expressions are intended to identify such forward-looking statements. Statements that refer to or are based on estimates, forecasts, projections, uncertain events or assumptions, including statements relating to total addressable market (TAM) or market opportunity, future products and the expected availability and benefits of such products, and anticipated trends in our businesses or the markets relevant to them, also identify forward-looking statements. Such statements are based on management's expectations as of May 8, 2019, unless an earlier date is indicated, and involve many risks and uncertainties that could cause actual results to differ materially from those expressed or implied in these forward-looking statements. Important factors that could cause actual results to differ materially from the company's expectations are set forth in Intel's earnings release dated April 25, 2019, which is included as an exhibit to Intel’s Form 8-K furnished to the SEC on such date. Additional information regarding these and other factors that could affect Intel's results is included in Intel's SEC filings, including the company's most recent reports on Forms 10-K and 10-Q. Copies of Intel's Form 10- K, 10-Q and 8-K reports may be obtained by visiting our Investor Relations website at www.intc.com or the SEC's website at www.sec.gov. All information in this presentation reflects management’s views as of May 8, 2019, unless an earlier date is indicated. Intel does not undertake, and expressly disclaims any duty, to update any statement made in this presentation, whether as a result of new information, new developments or otherwise, except to the extent that disclosure may be required by law.
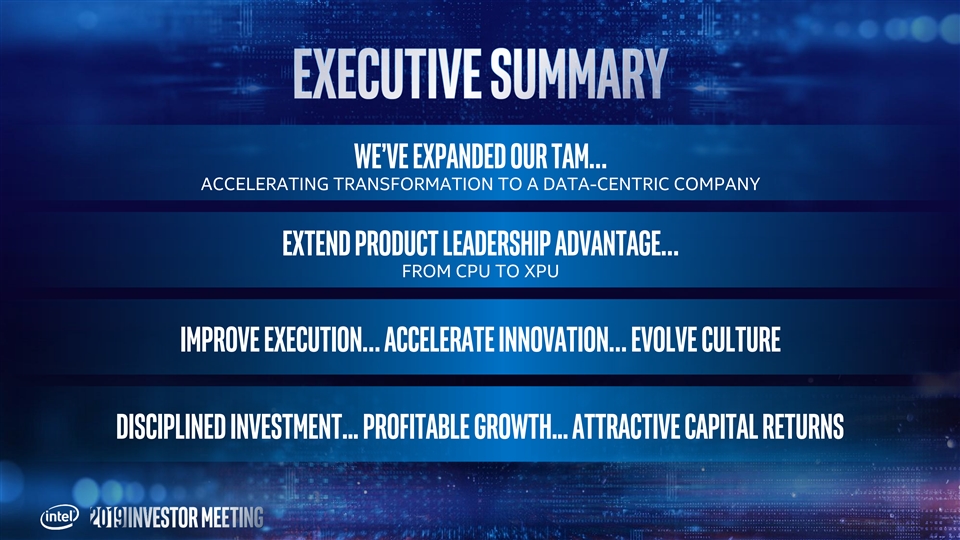
We’ve expanded our TAM… ACCELERATING TRANSFORMATION TO A DATA-CENTRIC COMPANY Extend product leadership advantage… FROM CPU TO XPU Improve execution… accelerate innovation… evolve culture Disciplined investment... Profitable growth... Attractive capital returnsWe’ve expanded our TAM… ACCELERATING TRANSFORMATION TO A DATA-CENTRIC COMPANY Extend product leadership advantage… FROM CPU TO XPU Improve execution… accelerate innovation… evolve culture Disciplined investment... Profitable growth... Attractive capital returns

We exceeded Q1 expectations… but lowered outlook 1 1 Revenue Operating Margin EPS Down Down Down $2.5B 2pts $0.25 1 Non-GAAP. Refer to the Appendix for a reconciliation of these non-GAAP measures.We exceeded Q1 expectations… but lowered outlook 1 1 Revenue Operating Margin EPS Down Down Down $2.5B 2pts $0.25 1 Non-GAAP. Refer to the Appendix for a reconciliation of these non-GAAP measures.

Top Priorities for 2017 Growth in Data strong & healthy Client growth flawlessly execute in Center & Adjacencies business in IoT & devices Memory & FPGAS 29Top Priorities for 2017 Growth in Data strong & healthy Client growth flawlessly execute in Center & Adjacencies business in IoT & devices Memory & FPGAS 29

Data-centric Increased revenue by $9B since ‘16 PC-Centric Record profitability in declining market Significant FCF Vs 3-yr guide Beat revenue by $6.7B and EPS by $1.27 Over the 3 years… added ~$12B in revenue… on lower spending… with ~64% increase in EPS 1 Data-centric businesses include DCG, IOTG, Mobileye, NSG, PSG and All Other. Growth from 2016 to 2019 outlook excludes $2.5B of revenue from McAfee and Wind River which have been divested in 2017 and 2018, respectively. EPS is non-GAAPData-centric Increased revenue by $9B since ‘16 PC-Centric Record profitability in declining market Significant FCF Vs 3-yr guide Beat revenue by $6.7B and EPS by $1.27 Over the 3 years… added ~$12B in revenue… on lower spending… with ~64% increase in EPS 1 Data-centric businesses include DCG, IOTG, Mobileye, NSG, PSG and All Other. Growth from 2016 to 2019 outlook excludes $2.5B of revenue from McAfee and Wind River which have been divested in 2017 and 2018, respectively. EPS is non-GAAP

transformations …but it won’t be easytransformations …but it won’t be easy

Make the world’s best semiconductors Lead the AI, 5g, and Autonomous revolution Be the leading end to end platform provider for the new data world Relentless focus on operational excellence & efficiency Continue to hire, develop and retain the best, most diverse & inclusive talentMake the world’s best semiconductors Lead the AI, 5g, and Autonomous revolution Be the leading end to end platform provider for the new data world Relentless focus on operational excellence & efficiency Continue to hire, develop and retain the best, most diverse & inclusive talent

2021 & beyond Middle of a Journey Intel Powers the World 2017-2021 Data-Centric 2013 A PC-Centric Company2021 & beyond Middle of a Journey Intel Powers the World 2017-2021 Data-Centric 2013 A PC-Centric Company

Data-Centric Businesses PC-centric Business Growth Cash Flow/ ScaleData-Centric Businesses PC-centric Business Growth Cash Flow/ Scale

Data is growing exponentially Global Digital Data Created Data Centers Edge/Endpoints Real-time Source: IDC Data Age 2025 (2018) Data Created (ZB)Data is growing exponentially Global Digital Data Created Data Centers Edge/Endpoints Real-time Source: IDC Data Age 2025 (2018) Data Created (ZB)
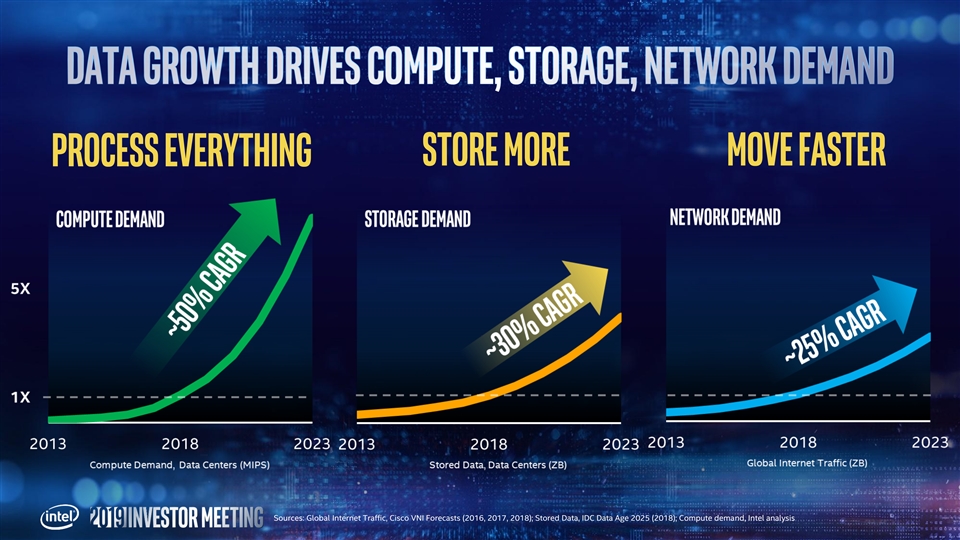
process everything store more Move faster Sources: Global Internet Traffic, Cisco VNI Forecasts (2016, 2017, 2018); Stored Data, IDC Data Age 2025 (2018); Compute demand, Intel analysisprocess everything store more Move faster Sources: Global Internet Traffic, Cisco VNI Forecasts (2016, 2017, 2018); Stored Data, IDC Data Age 2025 (2018); Compute demand, Intel analysis

Source: 2018 Intel Revenue is based on Intel financials. 2018 Si TAM is based on amalgamation of analyst data and Intel analysis. PC and Server include CPU and Chipsets revenue. Source: 2018 Intel Revenue is based on Intel financials. 2018 Si TAM is based on amalgamation of analyst data and Intel analysis. PC and Server include CPU and Chipsets revenue.

2023F TAM is based on an amalgamation of analyst data and Intel analysis, based upon current expectations and available information and is subject to change without notice. PC-Centric includes CPU & Chipsets, Connectivity (including modems other than 5G smartphone), Gateways, Gaming Consoles, Memory and Discrete Graphics. Data-Centric includes Data Center and Networking Compute, Memory, Storage and Connectivity, and IOT addressable Logic ASIC/ASSP, MPU, MCU, DSP for Industrial, Transportation, Automated Driving, Retail, Video Surveillance, Healthcare, Public Sector, Office Automation, Gaming and Smart Home. IOT also includes MaaS and intelligent transportation enabled data opportunities. 2023F TAM is based on an amalgamation of analyst data and Intel analysis, based upon current expectations and available information and is subject to change without notice. PC-Centric includes CPU & Chipsets, Connectivity (including modems other than 5G smartphone), Gateways, Gaming Consoles, Memory and Discrete Graphics. Data-Centric includes Data Center and Networking Compute, Memory, Storage and Connectivity, and IOT addressable Logic ASIC/ASSP, MPU, MCU, DSP for Industrial, Transportation, Automated Driving, Retail, Video Surveillance, Healthcare, Public Sector, Office Automation, Gaming and Smart Home. IOT also includes MaaS and intelligent transportation enabled data opportunities.
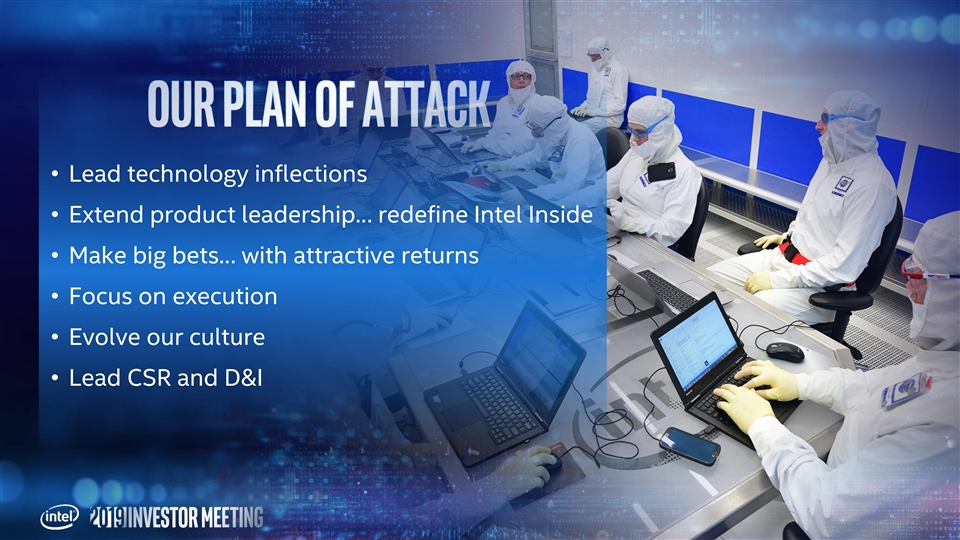
• Lead technology inflections • Extend product leadership… redefine Intel Inside • Make big bets… with attractive returns • Focus on execution • Evolve our culture • Lead CSR and D&I• Lead technology inflections • Extend product leadership… redefine Intel Inside • Make big bets… with attractive returns • Focus on execution • Evolve our culture • Lead CSR and D&I

Artificial intelligence 5G Autonomous systems Autonomous systems AI unlocks value from 5G transforms the require real-time data, enables new network, increases analysis of data flows, business models and consumption of data- drive new compute, experiences rich experiences network architecturesArtificial intelligence 5G Autonomous systems Autonomous systems AI unlocks value from 5G transforms the require real-time data, enables new network, increases analysis of data flows, business models and consumption of data- drive new compute, experiences rich experiences network architectures

WORKLOAD-OPTIMIZED PLATFORMS, EFFORTLESS CUSTOMER & DEVELOPER INNOVATIONWORKLOAD-OPTIMIZED PLATFORMS, EFFORTLESS CUSTOMER & DEVELOPER INNOVATION
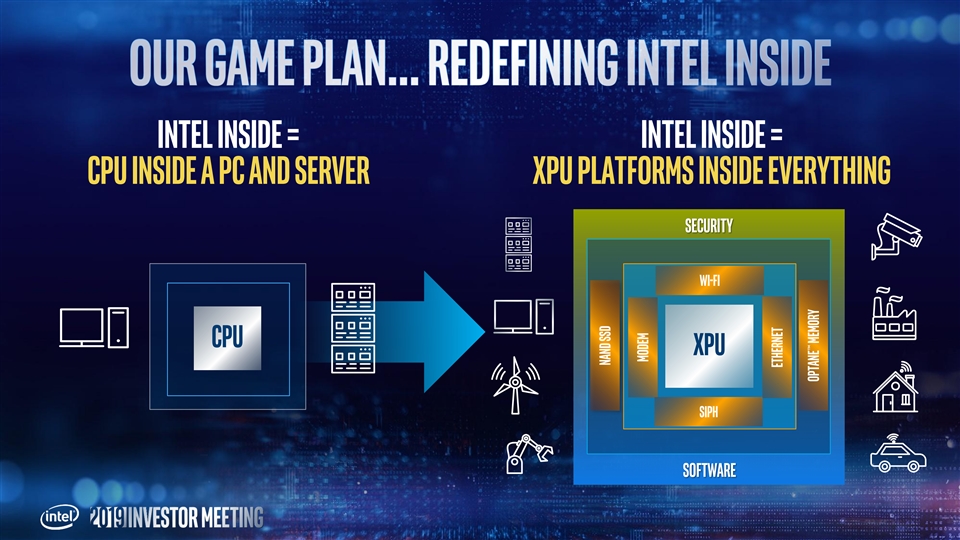
Intel Inside = Intel Inside = CPU inside a PC and server XPU platforms inside everything Security Wi-Fi CPU XPU siph Software Nand SSD Modem ethernet Optane™ MemoryIntel Inside = Intel Inside = CPU inside a PC and server XPU platforms inside everything Security Wi-Fi CPU XPU siph Software Nand SSD Modem ethernet Optane™ Memory

extend 14nm ramp 10nm Accelerate to 7nm Client Systems on Build Capacity Shelf for 2019 Production and to Support Holiday Season Launch in 2021 Customer Growth Server in 1H’20 vs. tsmc 10nm vs. tsmc 7nm vs. tsmc 5nm world class packaging technology complements process leadershipextend 14nm ramp 10nm Accelerate to 7nm Client Systems on Build Capacity Shelf for 2019 Production and to Support Holiday Season Launch in 2021 Customer Growth Server in 1H’20 vs. tsmc 10nm vs. tsmc 7nm vs. tsmc 5nm world class packaging technology complements process leadership

our investments must… …Address the leading edge of a technology inflection… …Allow us to play a larger role in the success of our customers… …Offer a clear path to profitability/attractive returns… …with regular evaluationour investments must… …Address the leading edge of a technology inflection… …Allow us to play a larger role in the success of our customers… …Offer a clear path to profitability/attractive returns… …with regular evaluation

Influencing and shaping 5G standards Inflections World class 5G modem IP ready for 2020 industry ramp Customer Built momentum and won share at 4G/LTE High customer concentration Impact Unprofitable despite share and scale Profit Evaluating options to maintain modem capabilities for PC/IOT Significant outside interest in our modem team, technology, and IP and ReturnInfluencing and shaping 5G standards Inflections World class 5G modem IP ready for 2020 industry ramp Customer Built momentum and won share at 4G/LTE High customer concentration Impact Unprofitable despite share and scale Profit Evaluating options to maintain modem capabilities for PC/IOT Significant outside interest in our modem team, technology, and IP and Return

Memory storage High-density 3D NAND for Optane™ offers ~performance of storage transition to NVM Inflections DRAM, persistence of NAND Industry leading density #2 DC SSD provider 3+ years Customer Optane™ + Xeon® = breakthrough Challenging tech transitions platform-level innovation impacted execution Impact Aggressive capacity build + Profit Significant potential for Optane™ market conditions slowed Systems challenges slow ramp progress & limited returns and ReturnMemory storage High-density 3D NAND for Optane™ offers ~performance of storage transition to NVM Inflections DRAM, persistence of NAND Industry leading density #2 DC SSD provider 3+ years Customer Optane™ + Xeon® = breakthrough Challenging tech transitions platform-level innovation impacted execution Impact Aggressive capacity build + Profit Significant potential for Optane™ market conditions slowed Systems challenges slow ramp progress & limited returns and Return

1 ADAS penetration rising globally, growing from 30% to 70% by ‘23 L4/5 AV designs on track for 2021, enabling a MaaS opportunity Inflections Data services such as REM present new adjacent opportunities >60% global ADAS market segment share Customer L2+ designs w OEMs representing >50% of global vehicle production Real-time crowdsourced map tech, customers launching new data svcs Impact Profit 2 Revenue up ~2x in 2 yrs ; positive OM contribution, in line w/deal thesis and Return 1 Internal analysis 2 2017 revenue compared to 2019 revenue; 2017 revenue includes revenue prior to acquisition in Aug'17.1 ADAS penetration rising globally, growing from 30% to 70% by ‘23 L4/5 AV designs on track for 2021, enabling a MaaS opportunity Inflections Data services such as REM present new adjacent opportunities >60% global ADAS market segment share Customer L2+ designs w OEMs representing >50% of global vehicle production Real-time crowdsourced map tech, customers launching new data svcs Impact Profit 2 Revenue up ~2x in 2 yrs ; positive OM contribution, in line w/deal thesis and Return 1 Internal analysis 2 2017 revenue compared to 2019 revenue; 2017 revenue includes revenue prior to acquisition in Aug'17.
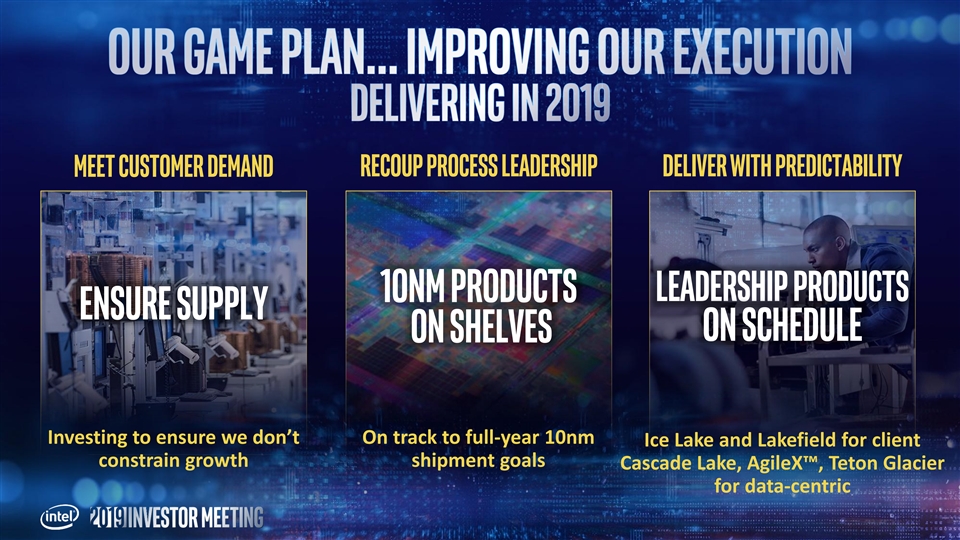
Recoup Process Leadership deliver with predictability Meet Customer Demand Leadership products 10nm products Ensure Supply on schedule on shelves Investing to ensure we don’t On track to full-year 10nm Ice Lake and Lakefield for client constrain growth shipment goals Cascade Lake, AgileX™, Teton Glacier for data-centricRecoup Process Leadership deliver with predictability Meet Customer Demand Leadership products 10nm products Ensure Supply on schedule on shelves Investing to ensure we don’t On track to full-year 10nm Ice Lake and Lakefield for client constrain growth shipment goals Cascade Lake, AgileX™, Teton Glacier for data-centric

Relentless focus on things that matter mostRelentless focus on things that matter most

From To Build the best products… customers will come Listen to customers & enable their growth Nearly $300B TAM… Low MSS... growth mode $52B TAM… MSS >90%… protect & defend Very capable competition has high MSS Competition has <10% MSS… compete internally Product leadership trumps all IDM advantage/process lead trumps all AN INCREDIBLE 50 YEARS AN INCREDIBLE OPPORTUNITYFrom To Build the best products… customers will come Listen to customers & enable their growth Nearly $300B TAM… Low MSS... growth mode $52B TAM… MSS >90%… protect & defend Very capable competition has high MSS Competition has <10% MSS… compete internally Product leadership trumps all IDM advantage/process lead trumps all AN INCREDIBLE 50 YEARS AN INCREDIBLE OPPORTUNITY

2727

We are a recognized leader in corporate responsibility and take action to advance progress in environmental sustainability, supply chain responsibility, and social impact. #1 Scores 4B KWH ENERGY SAVED >20 years For our environmental & since 2012, resulting in Of TRANSPARENCY & PROACTIVE social disclosure quality by >$500M in cost SAVINGS ENGAGEMENT WITH INVESTORS ON ESG ISS Ethix ISSUES +500 SUPPLIER AUDITS 90% recycle RATE 17.4M square feet Completed since 2014 as part of for NON-HAZARDOUS WASTE in OF LEED CERTIFIED SPACE in our supply chain responsibility our global operations support of our green programs buildings goal www.intel.com/responsibility We are a recognized leader in corporate responsibility and take action to advance progress in environmental sustainability, supply chain responsibility, and social impact. #1 Scores 4B KWH ENERGY SAVED >20 years For our environmental & since 2012, resulting in Of TRANSPARENCY & PROACTIVE social disclosure quality by >$500M in cost SAVINGS ENGAGEMENT WITH INVESTORS ON ESG ISS Ethix ISSUES +500 SUPPLIER AUDITS 90% recycle RATE 17.4M square feet Completed since 2014 as part of for NON-HAZARDOUS WASTE in OF LEED CERTIFIED SPACE in our supply chain responsibility our global operations support of our green programs buildings goal www.intel.com/responsibility

INNOVATIVE & INCLUSIVE TALENT Innovative supply chain Comprehensive workforce pay $1B annually 2 years Early Equity for global gender pay global initiative to spend with met our 2020 U.S. worKforce CLOSED THE GAP OF Average PAY BETWEEN Diverse-owned businesses by 2020 to diversity goal EMPLOYEES OF DIFFERENT GENDERS IN SIMILAR generate an Inclusive supply chain ROLES creating inclusive workplace www.intel.com/diversityINNOVATIVE & INCLUSIVE TALENT Innovative supply chain Comprehensive workforce pay $1B annually 2 years Early Equity for global gender pay global initiative to spend with met our 2020 U.S. worKforce CLOSED THE GAP OF Average PAY BETWEEN Diverse-owned businesses by 2020 to diversity goal EMPLOYEES OF DIFFERENT GENDERS IN SIMILAR generate an Inclusive supply chain ROLES creating inclusive workplace www.intel.com/diversity

Revenue growth Operating efficiency Earnings/FCF Low-single digit growth, $76B-$78B Operating Margin ~32% EPS growth in line with revenue Data-Centric businesses Gross Margins declines high-single digit growth offset by spending FCF growing faster leverage and 5G than earnings PC-Centric business smartphone modem exit ~flat to slightly down Closing FCF/Earnings gap (>80%)… ATTRACTIVE capital RETURNS Operating margin, gross margin, EPS, and FCF are non-GAAP. Forecasts are Intel estimates, based upon current expectations and available information and are subject to change without notice.Revenue growth Operating efficiency Earnings/FCF Low-single digit growth, $76B-$78B Operating Margin ~32% EPS growth in line with revenue Data-Centric businesses Gross Margins declines high-single digit growth offset by spending FCF growing faster leverage and 5G than earnings PC-Centric business smartphone modem exit ~flat to slightly down Closing FCF/Earnings gap (>80%)… ATTRACTIVE capital RETURNS Operating margin, gross margin, EPS, and FCF are non-GAAP. Forecasts are Intel estimates, based upon current expectations and available information and are subject to change without notice.

EPS presented on a non-GAAP basis. Refer to the Appendix for a reconciliation of this non-GAAP measure Forecasts are Intel estimates, based upon current expectations and available information and are subject to change without noticeEPS presented on a non-GAAP basis. Refer to the Appendix for a reconciliation of this non-GAAP measure Forecasts are Intel estimates, based upon current expectations and available information and are subject to change without notice

Speaker Topic Murthy Renduchintala Product Leadership Walk-on: Raja Koduri Navin Shenoy The Data-Centric Opportunity Walk-On: Sandra Rivera Gregory Bryant The Transformation of the PC Sector George Davis A Focus on PerformanceSpeaker Topic Murthy Renduchintala Product Leadership Walk-on: Raja Koduri Navin Shenoy The Data-Centric Opportunity Walk-On: Sandra Rivera Gregory Bryant The Transformation of the PC Sector George Davis A Focus on Performance


Full-year 2019 2018 Outlook Approximately GAAP OPERATING MARGIN 33% 30% Amortization of acquisition-related intangible assets 2% 2% NON-GAAP OPERATING MARGIN 35% 32% GAAP EARNINGS PER SHARE $4.48 $4.14 Inventory valuation adjustments — — Amortization of acquisition-related intangible assets 0.28 0.29 Other acquisition-related charges — — Restructuring and other charges (0.02) — (Gains) losses from divestitures (0.11) — Ongoing mark-to-market on marketable equity securities 0.03 (0.06) Tax reform (0.06) — Income tax effect (0.02) (0.02) NON-GAAP EARNINGS PER SHARE 4.58 $4.35 Forward-looking non-GAAP measures relating to fiscal years 2020 and beyond represent targets and are based on internal forecasts subject to significant uncertainty. We are unable to provide a full reconciliation of such measures to GAAP measures without unreasonable efforts as we cannot predict the amount or timing of certain elements that are included in reported GAAP results and that may significantly affect GAAP results, including acquisition-related adjustments, ongoing mark-to-market adjustments on marketable equity securities, and other non-recurring events or transactions. In addition, certain comparable GAAP measures such as net cash provided by operating activities are difficult to accurately estimate for such time frames and are dependent on future events. We believe such a reconciliation would also imply a degree of precision that could be confusing or inappropriate for these forward-looking measures. Full-year 2019 2018 Outlook Approximately GAAP OPERATING MARGIN 33% 30% Amortization of acquisition-related intangible assets 2% 2% NON-GAAP OPERATING MARGIN 35% 32% GAAP EARNINGS PER SHARE $4.48 $4.14 Inventory valuation adjustments — — Amortization of acquisition-related intangible assets 0.28 0.29 Other acquisition-related charges — — Restructuring and other charges (0.02) — (Gains) losses from divestitures (0.11) — Ongoing mark-to-market on marketable equity securities 0.03 (0.06) Tax reform (0.06) — Income tax effect (0.02) (0.02) NON-GAAP EARNINGS PER SHARE 4.58 $4.35 Forward-looking non-GAAP measures relating to fiscal years 2020 and beyond represent targets and are based on internal forecasts subject to significant uncertainty. We are unable to provide a full reconciliation of such measures to GAAP measures without unreasonable efforts as we cannot predict the amount or timing of certain elements that are included in reported GAAP results and that may significantly affect GAAP results, including acquisition-related adjustments, ongoing mark-to-market adjustments on marketable equity securities, and other non-recurring events or transactions. In addition, certain comparable GAAP measures such as net cash provided by operating activities are difficult to accurately estimate for such time frames and are dependent on future events. We believe such a reconciliation would also imply a degree of precision that could be confusing or inappropriate for these forward-looking measures.
Exhibit 99.2 DR. MURTHY RENDUCHINTALA Chief Engineering Officer, Intel Group President, TSCGExhibit 99.2 DR. MURTHY RENDUCHINTALA Chief Engineering Officer, Intel Group President, TSCG

Statements in this presentation that refer to business outlook, future plans and expectations are forward-looking statements that involve a number of risks and uncertainties. Words such as anticipates, expects, intends, goals, plans, believes, seeks, estimates, continues, may, will, “would,” should, “could,” and variations of such words and similar expressions are intended to identify such forward-looking statements. Statements that refer to or are based on estimates, forecasts, projections, uncertain events or assumptions, including statements relating to total addressable market (TAM) or market opportunity, future products and the expected availability and benefits of such products, and anticipated trends in our businesses or the markets relevant to them, also identify forward-looking statements. Such statements are based on management's expectations as of May 8, 2019, unless an earlier date is indicated, and involve many risks and uncertainties that could cause actual results to differ materially from those expressed or implied in these forward-looking statements. Important factors that could cause actual results to differ materially from the company's expectations are set forth in Intel's earnings release dated April 25, 2019, which is included as an exhibit to Intel’s Form 8-K furnished to the SEC on such date. Additional information regarding these and other factors that could affect Intel's results is included in Intel's SEC filings, including the company's most recent reports on Forms 10-K and 10-Q. Copies of Intel's Form 10-K, 10-Q and 8-K reports may be obtained by visiting our Investor Relations website at www.intc.com or the SEC's website at www.sec.gov. All information in this presentation reflects management’s views as of May 8, 2019, unless an earlier date is indicated. Intel does not undertake, and expressly disclaims any duty, to update any statement made in this presentation, whether as a result of new information, new developments or otherwise, except to the extent that disclosure may be required by law.Statements in this presentation that refer to business outlook, future plans and expectations are forward-looking statements that involve a number of risks and uncertainties. Words such as anticipates, expects, intends, goals, plans, believes, seeks, estimates, continues, may, will, “would,” should, “could,” and variations of such words and similar expressions are intended to identify such forward-looking statements. Statements that refer to or are based on estimates, forecasts, projections, uncertain events or assumptions, including statements relating to total addressable market (TAM) or market opportunity, future products and the expected availability and benefits of such products, and anticipated trends in our businesses or the markets relevant to them, also identify forward-looking statements. Such statements are based on management's expectations as of May 8, 2019, unless an earlier date is indicated, and involve many risks and uncertainties that could cause actual results to differ materially from those expressed or implied in these forward-looking statements. Important factors that could cause actual results to differ materially from the company's expectations are set forth in Intel's earnings release dated April 25, 2019, which is included as an exhibit to Intel’s Form 8-K furnished to the SEC on such date. Additional information regarding these and other factors that could affect Intel's results is included in Intel's SEC filings, including the company's most recent reports on Forms 10-K and 10-Q. Copies of Intel's Form 10-K, 10-Q and 8-K reports may be obtained by visiting our Investor Relations website at www.intc.com or the SEC's website at www.sec.gov. All information in this presentation reflects management’s views as of May 8, 2019, unless an earlier date is indicated. Intel does not undertake, and expressly disclaims any duty, to update any statement made in this presentation, whether as a result of new information, new developments or otherwise, except to the extent that disclosure may be required by law.

33

CAGR (17-25) PB 2 ZB 15 ZB 160 ZB 20% COMPUTE DIVERSITY PRODUCTIVITY DATA BROADCAST MEDIA Scalar, vector, spatial - AI, graphics, media, analytics NETWORK CLOUDIFICATION Compute & storage distributed across WEB / MOBILE core, access, and edge networks 35% INTELLIGENT AGENTS IOT / ANALYTICS Proliferation of autonomous / AI-enabled devices, things, and edge gateways Outbound/ Inbound/ Unstructured/ Structured Latency Sensitive Source: Analyst reports, tech press, industry interviews 4CAGR (17-25) PB 2 ZB 15 ZB 160 ZB 20% COMPUTE DIVERSITY PRODUCTIVITY DATA BROADCAST MEDIA Scalar, vector, spatial - AI, graphics, media, analytics NETWORK CLOUDIFICATION Compute & storage distributed across WEB / MOBILE core, access, and edge networks 35% INTELLIGENT AGENTS IOT / ANALYTICS Proliferation of autonomous / AI-enabled devices, things, and edge gateways Outbound/ Inbound/ Unstructured/ Structured Latency Sensitive Source: Analyst reports, tech press, industry interviews 4

DATA CENTRIC: ~$220B PC CENTRIC: ~$68B High growth segments 2018-23 growth relative to aggregate TAM COMPUTE DIVERSITY 10x+ NETWORK CLOUDIFICATION INTELLIGENT AGENTS 5x 2x DATACENTER Network IOT PC AND ADJACENCIES + + Source: Intel calculated 2023 TAM and growth rates derived from analyst forecasts and Intel TAM model 5 DC FPGA AI NVMe SSD NFV / SDN 5G Edge Comp. ADAS/AD Gaming Modern Notebook ChromeDATA CENTRIC: ~$220B PC CENTRIC: ~$68B High growth segments 2018-23 growth relative to aggregate TAM COMPUTE DIVERSITY 10x+ NETWORK CLOUDIFICATION INTELLIGENT AGENTS 5x 2x DATACENTER Network IOT PC AND ADJACENCIES + + Source: Intel calculated 2023 TAM and growth rates derived from analyst forecasts and Intel TAM model 5 DC FPGA AI NVMe SSD NFV / SDN 5G Edge Comp. ADAS/AD Gaming Modern Notebook Chrome
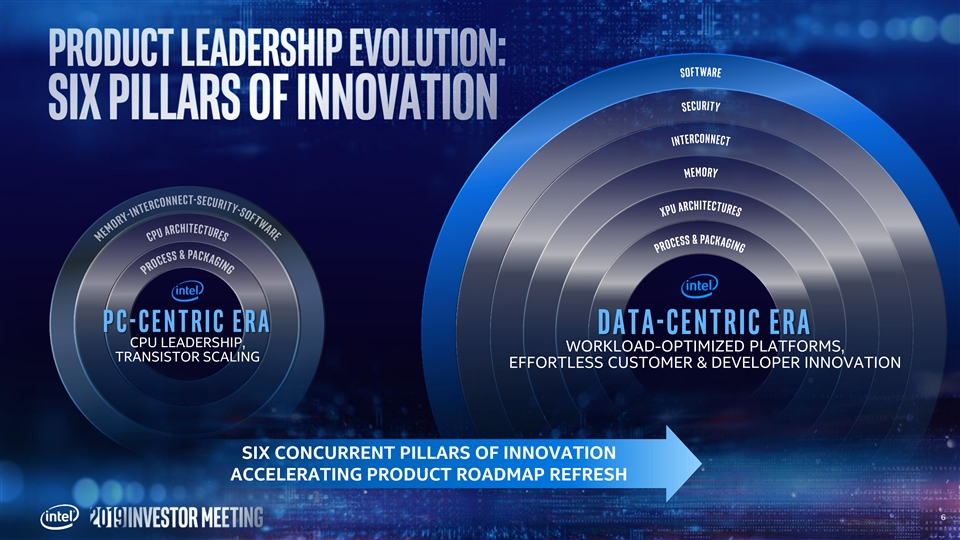
pc - c e n t r i c E R A D a t a - c e n t r i c E R A CPU LEADERSHIP, WORKLOAD-OPTIMIZED PLATFORMS, TRANSISTOR SCALING EFFORTLESS CUSTOMER & DEVELOPER INNOVATION SIX CONCURRENT PILLARS OF INNOVATION ACCELERATING PRODUCT ROADMAP REFRESH 6pc - c e n t r i c E R A D a t a - c e n t r i c E R A CPU LEADERSHIP, WORKLOAD-OPTIMIZED PLATFORMS, TRANSISTOR SCALING EFFORTLESS CUSTOMER & DEVELOPER INNOVATION SIX CONCURRENT PILLARS OF INNOVATION ACCELERATING PRODUCT ROADMAP REFRESH 6

SW portability, reusability and performance grows in value with compute diversity Confidentiality, integrity and resiliency become increasingly critical Increased data movement makes interconnects critical to the platform Memory bandwidth/latency/cost critical to handle data Data-centric workloads require scalar, vector, matrix and spatial compute: xPUs Compute diversity benefits from process and packaging diversity D a t a - c e n t r i c E R A WORKLOAD-OPTIMIZED PLATFORMS, EFFORTLESS CUSTOMER & DEVELOPER INNOVATION 7SW portability, reusability and performance grows in value with compute diversity Confidentiality, integrity and resiliency become increasingly critical Increased data movement makes interconnects critical to the platform Memory bandwidth/latency/cost critical to handle data Data-centric workloads require scalar, vector, matrix and spatial compute: xPUs Compute diversity benefits from process and packaging diversity D a t a - c e n t r i c E R A WORKLOAD-OPTIMIZED PLATFORMS, EFFORTLESS CUSTOMER & DEVELOPER INNOVATION 7

TRANSISTOR SCALING & MONOLITHIC INTEGRATION HETEROGENEOUS PROCESSES & INTEGRATION One process design point for all products Multiple processes optimized for individual IPs Monolithic integration Multi-chip integration with advanced packaging Product restricted by reticle Product unconstrained by reticle 8TRANSISTOR SCALING & MONOLITHIC INTEGRATION HETEROGENEOUS PROCESSES & INTEGRATION One process design point for all products Multiple processes optimized for individual IPs Monolithic integration Multi-chip integration with advanced packaging Product restricted by reticle Product unconstrained by reticle 8
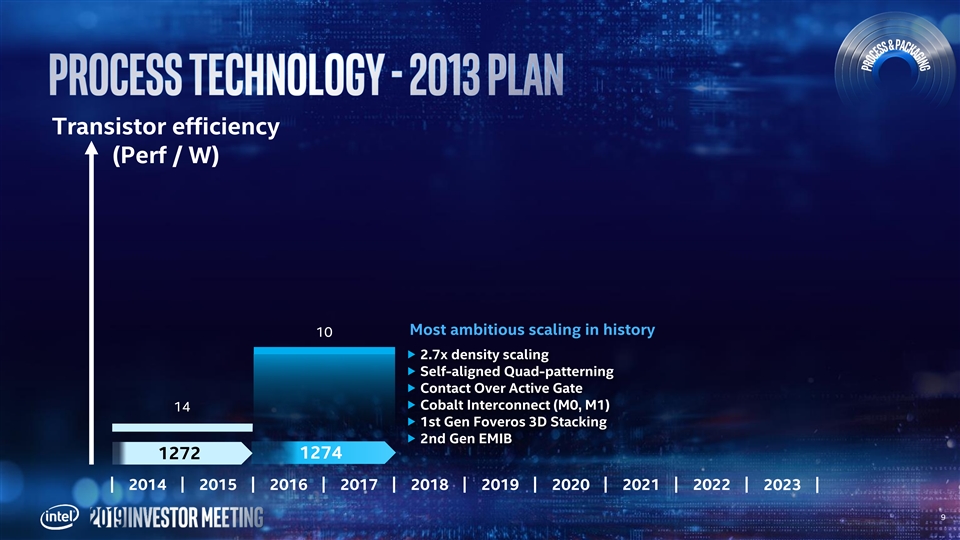
Transistor efficiency (Perf / W) Most ambitious scaling in history 10 u 2.7x density scaling u Self-aligned Quad-patterning u Contact Over Active Gate u Cobalt Interconnect (M0, M1) 14 u 1st Gen Foveros 3D Stacking u 2nd Gen EMIB 1272 1274 2014 2015 2016 2017 2018 2019 2020 2021 2022 2023 9Transistor efficiency (Perf / W) Most ambitious scaling in history 10 u 2.7x density scaling u Self-aligned Quad-patterning u Contact Over Active Gate u Cobalt Interconnect (M0, M1) 14 u 1st Gen Foveros 3D Stacking u 2nd Gen EMIB 1272 1274 2014 2015 2016 2017 2018 2019 2020 2021 2022 2023 9

Transistor efficiency (Perf / W) LEARNINGS Balance between schedule, performance, power, cost 10 14 1272 1274 2014 2015 2016 2017 2018 2019 2020 2021 2022 2023 10Transistor efficiency (Perf / W) LEARNINGS Balance between schedule, performance, power, cost 10 14 1272 1274 2014 2015 2016 2017 2018 2019 2020 2021 2022 2023 10
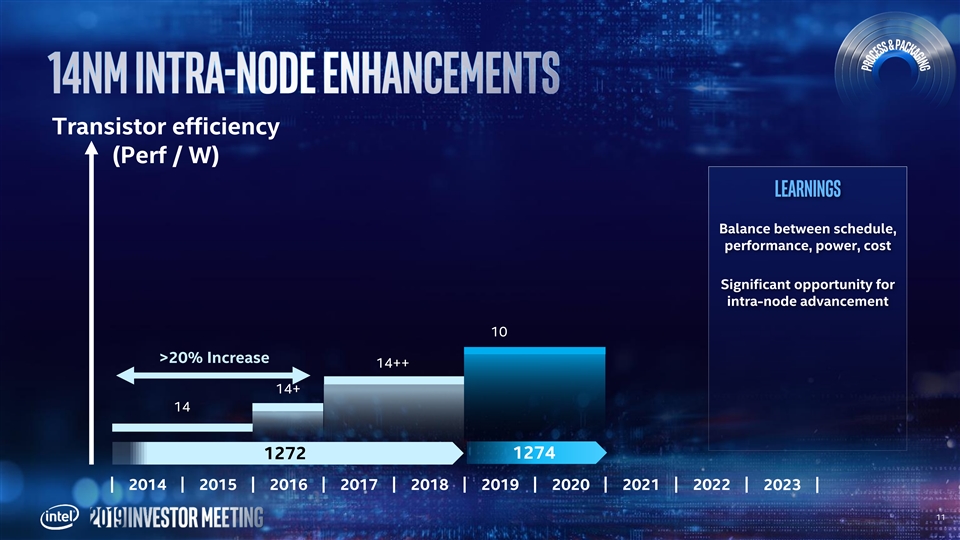
Transistor efficiency (Perf / W) LEARNINGS Balance between schedule, performance, power, cost Significant opportunity for intra-node advancement 10 >20% Increase 14++ 14+ 14 1272 1274 2014 2015 2016 2017 2018 2019 2020 2021 2022 2023 11Transistor efficiency (Perf / W) LEARNINGS Balance between schedule, performance, power, cost Significant opportunity for intra-node advancement 10 >20% Increase 14++ 14+ 14 1272 1274 2014 2015 2016 2017 2018 2019 2020 2021 2022 2023 11

Transistor efficiency (Perf / W) LEARNINGS Balance between schedule, performance, power, cost 10++ Significant opportunity for intra-node advancement 10+ 10 Value in maintaining mix of nodes 14++ Ease-of-design accelerates 14+ innovation 14 1274 1272 2014 2015 2016 2017 2018 2019 2020 2021 2022 2023 12Transistor efficiency (Perf / W) LEARNINGS Balance between schedule, performance, power, cost 10++ Significant opportunity for intra-node advancement 10+ 10 Value in maintaining mix of nodes 14++ Ease-of-design accelerates 14+ innovation 14 1274 1272 2014 2015 2016 2017 2018 2019 2020 2021 2022 2023 12

Transistor efficiency (Perf / W) 7++ 7+ 7 u 2x scaling 10++ u Planned intra-node optimizations 10+u 4x Reduction in design rules u EUV 10 u Next-gen Foveros & EMIB packaging 14++ 14+ 1276 14 1274 1272 2014 2015 2016 2017 2018 2019 2020 2021 2022 2023 13Transistor efficiency (Perf / W) 7++ 7+ 7 u 2x scaling 10++ u Planned intra-node optimizations 10+u 4x Reduction in design rules u EUV 10 u Next-gen Foveros & EMIB packaging 14++ 14+ 1276 14 1274 1272 2014 2015 2016 2017 2018 2019 2020 2021 2022 2023 13

Transistor efficiency (Perf / W) One ML of scaling & performance start of node + one ML performance intra-node 7++ 7+ Multi-chip SoC construction for non-compromise performance 7 10++ Radical design simplification 10+ accelerates innovation 10 10nm shipping in June, multiple 14++ products through 2019 and 2020 14+ 1276 14 7nm progressing to plan 1274 Lead product launch in 2021 1272 2014 2015 2016 2017 2018 2019 2020 2021 2022 2023 14Transistor efficiency (Perf / W) One ML of scaling & performance start of node + one ML performance intra-node 7++ 7+ Multi-chip SoC construction for non-compromise performance 7 10++ Radical design simplification 10+ accelerates innovation 10 10nm shipping in June, multiple 14++ products through 2019 and 2020 14+ 1276 14 7nm progressing to plan 1274 Lead product launch in 2021 1272 2014 2015 2016 2017 2018 2019 2020 2021 2022 2023 14

IPU R Core Core I DISPLAY D N D G Core Core R Shipping in June Approx. Graphics Performance 2X TYPE C AI Performance 2.5X – 3x GT Video Encode 2x Wireless Speeds 3x OPIO Disclaimer: Results are approximate and have been estimated or simulated as of April 2019 using Intel internal analysis or architecture simulation or modeling Graphics and video – Next Gen Graphics Iris Plus Experience Wireless – Intel’s Wi-Fi 6 (GIG+) vs typical competitive 11AC design AI – AIXPRT Community 2 Preview; OpenVINO 2018.R5, Max Throughput 15W WHL to 15W ICL projection 15 For more complete information about performance and benchmark results, visit www.intel.com/benchmarks. Performance results are based on testing as of date specified and may not reflect all publicly available security updates. See configuration disclosure for details. No product or component can be absolutely secure.IPU R Core Core I DISPLAY D N D G Core Core R Shipping in June Approx. Graphics Performance 2X TYPE C AI Performance 2.5X – 3x GT Video Encode 2x Wireless Speeds 3x OPIO Disclaimer: Results are approximate and have been estimated or simulated as of April 2019 using Intel internal analysis or architecture simulation or modeling Graphics and video – Next Gen Graphics Iris Plus Experience Wireless – Intel’s Wi-Fi 6 (GIG+) vs typical competitive 11AC design AI – AIXPRT Community 2 Preview; OpenVINO 2018.R5, Max Throughput 15W WHL to 15W ICL projection 15 For more complete information about performance and benchmark results, visit www.intel.com/benchmarks. Performance results are based on testing as of date specified and may not reflect all publicly available security updates. See configuration disclosure for details. No product or component can be absolutely secure.

Shipping in June IPU R Multiple Product Launches Core Core I DISPLAY D Across Entire Portfolio Through 2019 and 2020 N D G Core Core R AI Inference Xeon CPU GP-GPU TYPE C FPGA 5G/Networking… GT OPIO 16Shipping in June IPU R Multiple Product Launches Core Core I DISPLAY D Across Entire Portfolio Through 2019 and 2020 N D G Core Core R AI Inference Xeon CPU GP-GPU TYPE C FPGA 5G/Networking… GT OPIO 16

e X Architecture-Based GP-GPU using Foveros for Datacenter AI & HPC Launch in 2021 17e X Architecture-Based GP-GPU using Foveros for Datacenter AI & HPC Launch in 2021 17

For every order of magnitude performance from new hardware, there is >2 orders of magnitude unlocked by software Raja Koduri Chief Architect, SVP Intel Architecture, Graphics and Software 18For every order of magnitude performance from new hardware, there is >2 orders of magnitude unlocked by software Raja Koduri Chief Architect, SVP Intel Architecture, Graphics and Software 18

Example 1: Java runtime optimizations 6X 6 x 4X 2X 1 x 0X JDK9 JDK8 For more complete information about performance and benchmark results, visit www.intel.com/benchmarks. Performance results are based on testing as of dates shown in 19 configuration and may not reflect all publicly available security updates. No product or component can be absolutely secure.Example 1: Java runtime optimizations 6X 6 x 4X 2X 1 x 0X JDK9 JDK8 For more complete information about performance and benchmark results, visit www.intel.com/benchmarks. Performance results are based on testing as of dates shown in 19 configuration and may not reflect all publicly available security updates. No product or component can be absolutely secure.

Example 2: Persistent memory complete stack optimizations 8X 8.1 x 6X 4X 2X 1 x 0X SSD Storage Intel Optane™ DCPMM +software For more complete information about performance and benchmark results, visit www.intel.com/benchmarks. Performance results are based on testing as of dates shown in 20 configuration and may not reflect all publicly available security updates. No product or component can be absolutely secure.Example 2: Persistent memory complete stack optimizations 8X 8.1 x 6X 4X 2X 1 x 0X SSD Storage Intel Optane™ DCPMM +software For more complete information about performance and benchmark results, visit www.intel.com/benchmarks. Performance results are based on testing as of dates shown in 20 configuration and may not reflect all publicly available security updates. No product or component can be absolutely secure.

Example 3: Deep Learning Boost 28 x 20X 15X 10X 5X 1 x 0X Hardware + Software Base Hardware For more complete information about performance and benchmark results, visit www.intel.com/benchmarks. Performance results are based on testing as of dates shown in configuration and may not reflect all publicly available security updates. No product or component can be absolutely secure. 21Example 3: Deep Learning Boost 28 x 20X 15X 10X 5X 1 x 0X Hardware + Software Base Hardware For more complete information about performance and benchmark results, visit www.intel.com/benchmarks. Performance results are based on testing as of dates shown in configuration and may not reflect all publicly available security updates. No product or component can be absolutely secure. 21

Per core performance advantage Data Analytics Java (1.9x) Web (2.1x) Browsing (1.7x) High Performance Compute Networking (1.9x) (2.0x) Productivity (1.6x) Deep Learning Gaming Content (1.4x) Creation (10.3x) (2.5x) For more complete information about performance and benchmark results, visit www.intel.com/benchmarks. Performance results are based on testing as of dates shown in 22 configuration and may not reflect all publicly available security updates. No product or component can be absolutely secure.Per core performance advantage Data Analytics Java (1.9x) Web (2.1x) Browsing (1.7x) High Performance Compute Networking (1.9x) (2.0x) Productivity (1.6x) Deep Learning Gaming Content (1.4x) Creation (10.3x) (2.5x) For more complete information about performance and benchmark results, visit www.intel.com/benchmarks. Performance results are based on testing as of dates shown in 22 configuration and may not reflect all publicly available security updates. No product or component can be absolutely secure.

>15,000 software engineers #1 contributor to Linux kernel; >1/2 million lines of code modified each year > 100 operating systems optimized top three contributors to Chromium OS >10,000 high touch customer deployments top 10 contributor to Openstack >12 million developers For more complete information about performance and benchmark results, visit www.intel.com/benchmarks. Performance results are based on testing as of dates shown in 23 configuration and may not reflect all publicly available security updates. No product or component can be absolutely secure.>15,000 software engineers #1 contributor to Linux kernel; >1/2 million lines of code modified each year > 100 operating systems optimized top three contributors to Chromium OS >10,000 high touch customer deployments top 10 contributor to Openstack >12 million developers For more complete information about performance and benchmark results, visit www.intel.com/benchmarks. Performance results are based on testing as of dates shown in 23 configuration and may not reflect all publicly available security updates. No product or component can be absolutely secure.
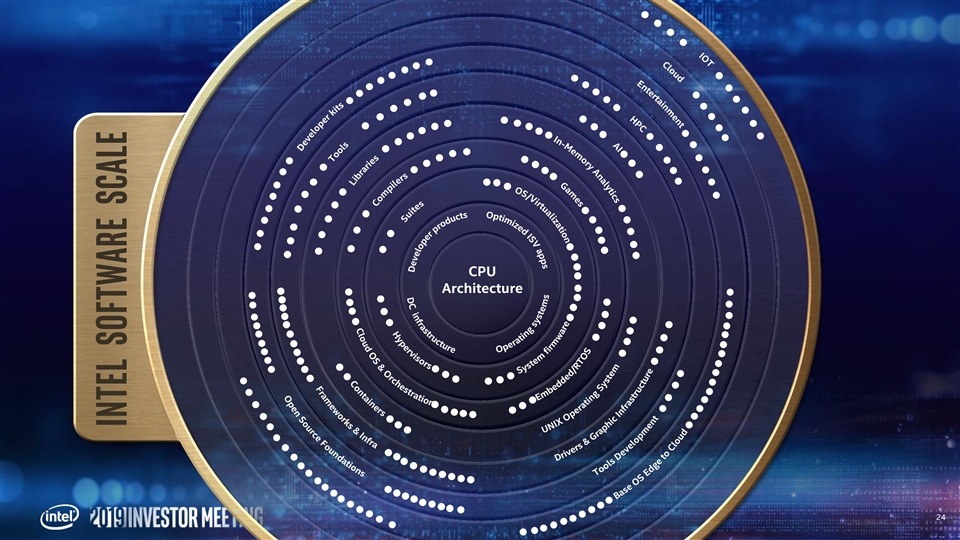
CPU Architecture 24 Intel Software scaleCPU Architecture 24 Intel Software scale

One Architecture 12 million developers 25One Architecture 12 million developers 25

Cloud One GPU AI Architecture Native 8 million 1 million 100K developers developers developers 12 million developers 26Cloud One GPU AI Architecture Native 8 million 1 million 100K developers developers developers 12 million developers 26

One GPU AI Architecture 27One GPU AI Architecture 27

“The future is a diverse mix of Scalar, Vector, Matrix and Spatial CPU GPU architectures deployed in CPU, GPU, FPGA and Accelerator AI FPGA sockets…” Intel Arch day, Dec ‘2018 28“The future is a diverse mix of Scalar, Vector, Matrix and Spatial CPU GPU architectures deployed in CPU, GPU, FPGA and Accelerator AI FPGA sockets…” Intel Arch day, Dec ‘2018 28

CPU GPU GPU AI AI FPGA 29CPU GPU GPU AI AI FPGA 29

CPU GPU AI FPGA 30CPU GPU AI FPGA 30
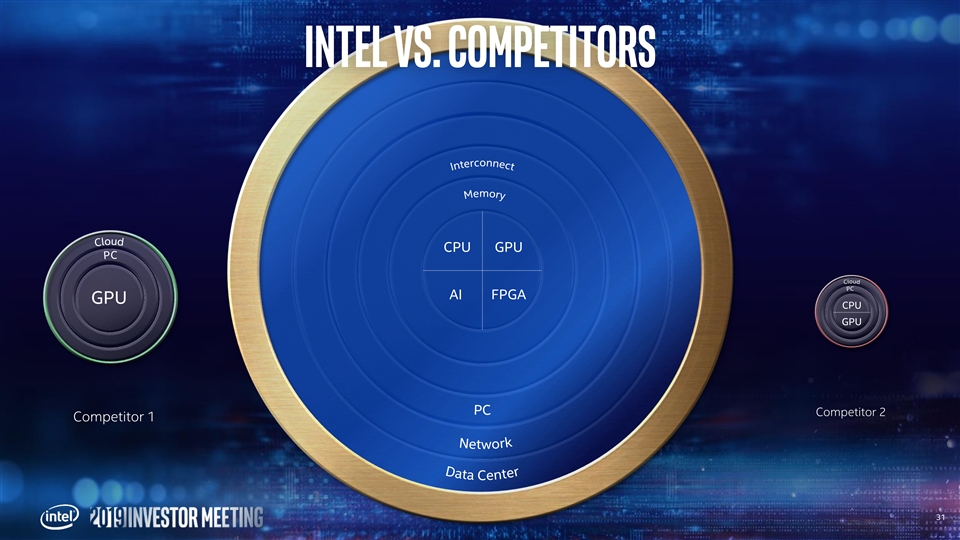
CPU GPU AI FPGA GPU CPU GPU Competitor 2 Competitor 1 31CPU GPU AI FPGA GPU CPU GPU Competitor 2 Competitor 1 31

simple and scalable open one developer experience 32simple and scalable open one developer experience 32

Coming soon to a developer near you in Q4 2019 33Coming soon to a developer near you in Q4 2019 33

Data Center Network Intelligent Agents 34Data Center Network Intelligent Agents 34

COMPUTE DIVERSITY Intel® MKL-DNN OpenVINO SPDK (Storage) Intel® Security (AI) (AI) DPDK (Network) Libraries - DC software Intel® Threat Intel® Security Detection Tech SGX Card Memory Encryption Ultra Path Interconnect Interconnect Highest Native Memory DDR Bandwidth Intel® Intel® Speed Intel® Workload XPU Architectures Optimized SKUs AVX-512 Select DL Boost PROCESS & Packaging 14nm Scaling 56C MCP Up to 28X AI performance Up to 56 core per socket, 112 core in two socket 200GB/s bandwidth per socket Up to 36TB addressable memory AI Performance: In AP configuration Memory bandwidth: 1-node, 2x Intel® Xeon® Platinum 9282 cpu on Walker Pass with 768 GB (24x 32GB 2933) total memory, ucode 0x400000A on RHEL7.6, 3.10.0-957.el7.x86_65, IC19u1, AVX512, HT off, Turbo on, Stream Triad 35 score=407 GB/s, test by Intel on 2/16/2019 For more complete information about performance and benchmark results, visit www.intel.com/benchmarks. Performance results are based on testing as of date specified and may not reflect all publicly available security updates. See configuration disclosure for details. No product or component can be absolutely secure.COMPUTE DIVERSITY Intel® MKL-DNN OpenVINO SPDK (Storage) Intel® Security (AI) (AI) DPDK (Network) Libraries - DC software Intel® Threat Intel® Security Detection Tech SGX Card Memory Encryption Ultra Path Interconnect Interconnect Highest Native Memory DDR Bandwidth Intel® Intel® Speed Intel® Workload XPU Architectures Optimized SKUs AVX-512 Select DL Boost PROCESS & Packaging 14nm Scaling 56C MCP Up to 28X AI performance Up to 56 core per socket, 112 core in two socket 200GB/s bandwidth per socket Up to 36TB addressable memory AI Performance: In AP configuration Memory bandwidth: 1-node, 2x Intel® Xeon® Platinum 9282 cpu on Walker Pass with 768 GB (24x 32GB 2933) total memory, ucode 0x400000A on RHEL7.6, 3.10.0-957.el7.x86_65, IC19u1, AVX512, HT off, Turbo on, Stream Triad 35 score=407 GB/s, test by Intel on 2/16/2019 For more complete information about performance and benchmark results, visit www.intel.com/benchmarks. Performance results are based on testing as of date specified and may not reflect all publicly available security updates. See configuration disclosure for details. No product or component can be absolutely secure.

INTELLIGENT AGENTS software Security Interconnect Memory XPU Architectures PROCESS & Packaging 36INTELLIGENT AGENTS software Security Interconnect Memory XPU Architectures PROCESS & Packaging 36

INTELLIGENT AGENTS PC in Mobile form factor – 12x12x1 37INTELLIGENT AGENTS PC in Mobile form factor – 12x12x1 37

INTELLIGENT AGENTS Chipset PACKAGE Power Delivery Ultra low power logic - P1222 38INTELLIGENT AGENTS Chipset PACKAGE Power Delivery Ultra low power logic - P1222 38
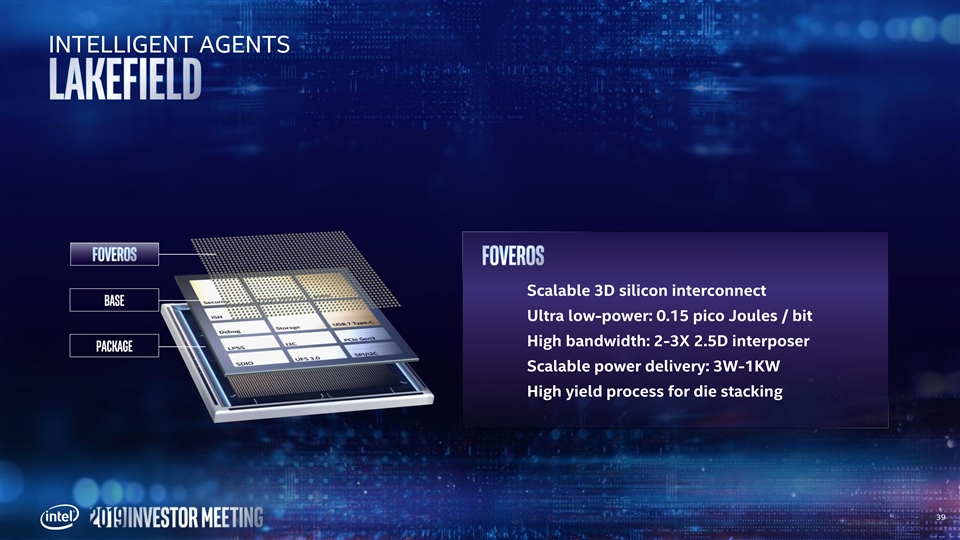
INTELLIGENT AGENTS Scalable 3D silicon interconnect BASE Ultra low-power: 0.15 pico Joules / bit High bandwidth: 2-3X 2.5D interposer PACKAGE Scalable power delivery: 3W-1KW High yield process for die stacking 39INTELLIGENT AGENTS Scalable 3D silicon interconnect BASE Ultra low-power: 0.15 pico Joules / bit High bandwidth: 2-3X 2.5D interposer PACKAGE Scalable power delivery: 3W-1KW High yield process for die stacking 39

INTELLIGENT AGENTS 10 nm process compute foveros Hybrid architecture: Core + Atom Thermal solution to enable 3D stacking BASE PACKAGE 40INTELLIGENT AGENTS 10 nm process compute foveros Hybrid architecture: Core + Atom Thermal solution to enable 3D stacking BASE PACKAGE 40
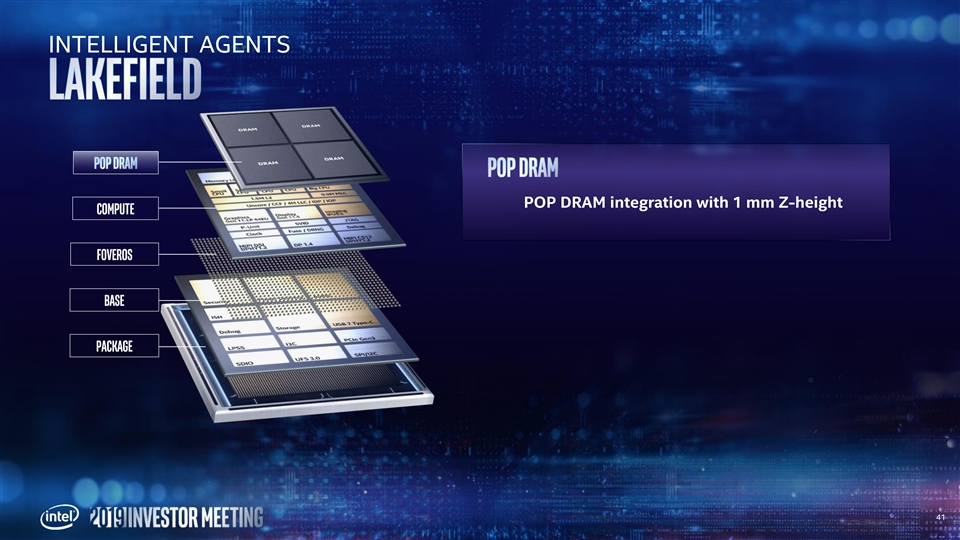
INTELLIGENT AGENTS POP DRAM integration with 1 mm Z-height COMPUTE foveros BASE PACKAGE 41INTELLIGENT AGENTS POP DRAM integration with 1 mm Z-height COMPUTE foveros BASE PACKAGE 41

INTELLIGENT AGENTS OpenVINO software POP DRAM UFS Inline Boot from UFS VBS Security Encryption COMPUTE UFS 3.0 USB 3.0 MIPI CSI2 Interconnect foveros POP DRAM Memory BASE H y b R I d A R C H I T E C T U R E XPU Architectures GEN11 Graphics Sunny Cove CPU Tremont CPU PACKAGE Foveros 3D Integration PROCESS & Packaging 10nm Compute Die, Low Power Base Die A Standby SOC Power Improvement Results have been estimated or simulated as of April, 2019 using internal Intel 10X analysis or architecture simulation or modeling vs. AML product P Disclaimer: Results are approximate and have been estimated or simulated as of April 2019 Active SOC Power Improvement using Intel internal analysis or architecture simulation or modeling 1.5 – 2X P For more complete information about performance and benchmark results, visit www.intel.com/benchmarks. Performance results are based on testing as of date specified and R may not reflect all publicly available security updates. See configuration disclosure for details. Graphics Performance 2X No product or component can be absolutely secure. O 42 PCB Area Reduction 2X XINTELLIGENT AGENTS OpenVINO software POP DRAM UFS Inline Boot from UFS VBS Security Encryption COMPUTE UFS 3.0 USB 3.0 MIPI CSI2 Interconnect foveros POP DRAM Memory BASE H y b R I d A R C H I T E C T U R E XPU Architectures GEN11 Graphics Sunny Cove CPU Tremont CPU PACKAGE Foveros 3D Integration PROCESS & Packaging 10nm Compute Die, Low Power Base Die A Standby SOC Power Improvement Results have been estimated or simulated as of April, 2019 using internal Intel 10X analysis or architecture simulation or modeling vs. AML product P Disclaimer: Results are approximate and have been estimated or simulated as of April 2019 Active SOC Power Improvement using Intel internal analysis or architecture simulation or modeling 1.5 – 2X P For more complete information about performance and benchmark results, visit www.intel.com/benchmarks. Performance results are based on testing as of date specified and R may not reflect all publicly available security updates. See configuration disclosure for details. Graphics Performance 2X No product or component can be absolutely secure. O 42 PCB Area Reduction 2X X
Data drives extraordinary opportunities for growth Intel products & methods targeted to win data-centric growth with six pillar innovation model You will see this in our product leadership 43Data drives extraordinary opportunities for growth Intel products & methods targeted to win data-centric growth with six pillar innovation model You will see this in our product leadership 43


Performance results are based on testing as of dates shown in configuration and may not reflect all publicly available security updates. See configuration disclosure for details. No product or component can be absolutely secure. Software and workloads used in performance tests may have been optimized for performance only on Intel microprocessors. Performance tests, such as SYSmark and MobileMark, are measured using specific computer systems, components, software, operations and functions. Any change to any of those factors may cause the results to vary. You should consult other information and performance tests to assist you in fully evaluating your contemplated purchases, including the performance of that product when combined with other products. For more complete information visit www.intel.com/benchmarks. Approx. 3x Ice Lake Wireless Speeds: 802.11ax 2x2 160MHz enables 2402Mbps maximum theoretical data rates, ~3X (2.8X) faster than standard 802.11ac 2x2 80MHz (867Mbps) as documented in IEEE 802.11 wireless standard specifications, and require the use of similarly configured 802.11ax wireless network routers. Approx. 2x Ice Lake Video Encode: Based on 4k HEVC to 4k HEVC transcode (8bit). Intel preproduction system, ICL 15w compared to WHL 15w. Measured by Intel as of April 2019. Approx. 2x Ice Lake Graphics Performance: Workload: 3DMark11 v 1.0.132. Intel PreProduction ICL U4+2 15W Configuration (Assumptions):, Processor: Intel® Core™ i7 (ICL-U 4+2) PL1=15W TDP, 4C8T, Memory: 2x8GB LPDDR4-3733 2Rx8, Storage: Intel® 760p m.2 PCIe NVMe SSD with AHCI Microsoft driver, Display Resolution: 3840x2160 eDP Panel 12.5”, OS: Windows* 10 RS5-17763.316, Graphics driver: PROD-H-RELEASES_ICL-PV-2019-04-09-1006832. Vs config – Intel PreProduction WHL U4+2 15W Configuration (Measured), Processor: Intel® Core™ i7-8565U (WHL-U4+2) PL1=15W TDP, 4C8T, Turbo up to 4.6Ghz, Memory: 2x8GB DDR4-2400 2Rx8, Storage: Intel® 760p m.2 PCIe NVMe SSD with AHCI Microsoft driver, Display Resolution: 3840x2160 eDP Panel 12.5”, OS: Windows* 10 RS4-17134.112. ,Graphics driver: 100.6195. Measured by Intel as of April 2019. Approx. 2.5x-3x Ice Lake AI Performance: Workload: images per second using AIXPRT Community Preview 2 with Int8 precision on ResNet-50 and SSD-Mobilenet-v1 models. Intel preproduction system, ICL-U, PL1 15w, 4C/8T, Turbo TBD, Intel Gen11 Graphics, GFX driver preproduction, Memory 8GB LPDDR4X-3733, Storage Intel SSD Pro 760P 256GB, OS Microsoft Windows 10, RS5 Build 475, preprod bios. Vs. Config – HP spectre x360 13t 13-ap0038nr, Intel® Core™ i7-8565U, PL1 20w, 4C/8T, Turbo up to 4.6Ghz, Intel UHD Graphics 620, Gfx driver 26.20.100.6709, Memory 16GB DDR4-2400, Storage Intel SSD 760p 512GB, OS – Microsoft Windows 10 RS5 Build 475 Bios F.26. Measured by Intel as of April 2019.Performance results are based on testing as of dates shown in configuration and may not reflect all publicly available security updates. See configuration disclosure for details. No product or component can be absolutely secure. Software and workloads used in performance tests may have been optimized for performance only on Intel microprocessors. Performance tests, such as SYSmark and MobileMark, are measured using specific computer systems, components, software, operations and functions. Any change to any of those factors may cause the results to vary. You should consult other information and performance tests to assist you in fully evaluating your contemplated purchases, including the performance of that product when combined with other products. For more complete information visit www.intel.com/benchmarks. Approx. 3x Ice Lake Wireless Speeds: 802.11ax 2x2 160MHz enables 2402Mbps maximum theoretical data rates, ~3X (2.8X) faster than standard 802.11ac 2x2 80MHz (867Mbps) as documented in IEEE 802.11 wireless standard specifications, and require the use of similarly configured 802.11ax wireless network routers. Approx. 2x Ice Lake Video Encode: Based on 4k HEVC to 4k HEVC transcode (8bit). Intel preproduction system, ICL 15w compared to WHL 15w. Measured by Intel as of April 2019. Approx. 2x Ice Lake Graphics Performance: Workload: 3DMark11 v 1.0.132. Intel PreProduction ICL U4+2 15W Configuration (Assumptions):, Processor: Intel® Core™ i7 (ICL-U 4+2) PL1=15W TDP, 4C8T, Memory: 2x8GB LPDDR4-3733 2Rx8, Storage: Intel® 760p m.2 PCIe NVMe SSD with AHCI Microsoft driver, Display Resolution: 3840x2160 eDP Panel 12.5”, OS: Windows* 10 RS5-17763.316, Graphics driver: PROD-H-RELEASES_ICL-PV-2019-04-09-1006832. Vs config – Intel PreProduction WHL U4+2 15W Configuration (Measured), Processor: Intel® Core™ i7-8565U (WHL-U4+2) PL1=15W TDP, 4C8T, Turbo up to 4.6Ghz, Memory: 2x8GB DDR4-2400 2Rx8, Storage: Intel® 760p m.2 PCIe NVMe SSD with AHCI Microsoft driver, Display Resolution: 3840x2160 eDP Panel 12.5”, OS: Windows* 10 RS4-17134.112. ,Graphics driver: 100.6195. Measured by Intel as of April 2019. Approx. 2.5x-3x Ice Lake AI Performance: Workload: images per second using AIXPRT Community Preview 2 with Int8 precision on ResNet-50 and SSD-Mobilenet-v1 models. Intel preproduction system, ICL-U, PL1 15w, 4C/8T, Turbo TBD, Intel Gen11 Graphics, GFX driver preproduction, Memory 8GB LPDDR4X-3733, Storage Intel SSD Pro 760P 256GB, OS Microsoft Windows 10, RS5 Build 475, preprod bios. Vs. Config – HP spectre x360 13t 13-ap0038nr, Intel® Core™ i7-8565U, PL1 20w, 4C/8T, Turbo up to 4.6Ghz, Intel UHD Graphics 620, Gfx driver 26.20.100.6709, Memory 16GB DDR4-2400, Storage Intel SSD 760p 512GB, OS – Microsoft Windows 10 RS5 Build 475 Bios F.26. Measured by Intel as of April 2019.

nd 2 Gen Intel® Xeon Scalable Processors up to 28X AI Performance: Based on Intel internal testing: 28x performance improvement based on Intel® Optimization for Café ResNet-50 inference throughput performance on Intel® Xeon® Scalable Processor. 28x inference throughput improvement on Intel® Xeon® Platinum 9282 processor with Intel® DL Boost: Tested by Intel as of 2/26/2019. Platform: Dragon rock 2 socket Intel® Xeon® Platinum 9282(56 cores per socket), HT ON, turbo ON, Total Memory 768 GB (24 slots/ 32 GB/ 2933 MHz), BIOS:SE5C620.86B.0D.01.0241.112020180249, Centos 7 Kernel 3.10.0-957.5.1.el7.x86_64, Deep Learning Framework: Intel® Optimization for Caffe version: https://github.com/intel/caffe d554cbf1, ICC 2019.2.187, MKL DNN version: v0.17 (commit hash: 830a10059a018cd2634d94195140cf2d8790a75a), model: https://github.com/intel/caffe/blob/master/models/intel_optimized_models/int8/resnet50_int8_full_conv.prototxt, BS=64, No datalayer syntheticData:3x224x224, 56 instance/2 socket, Datatype: INT8 vs. Tested by Intel as of July 11th 2017: 2S Intel® Xeon® Platinum 8180 CPU @ 2.50GHz (28 cores), HT disabled, turbo disabled, scaling governor set to “performance” via intel_pstate driver, 384GB DDR4-2666 ECC RAM. CentOS Linux release 7.3.1611 (Core), Linux kernel 3.10.0-514.10.2.el7.x86_64. SSD: Intel® SSD DC S3700 Series (800GB, 2.5in SATA 6Gb/s, 25nm, MLC).Performance measured with: Environment variables: KMP_AFFINITY='granularity=fine, compact‘, OMP_NUM_THREADS=56, CPU Freq set with cpupower frequency-set -d 2.5G -u 3.8G -g performance. Caffe: (http://github.com/intel/caffe/), revision f96b759f71b2281835f690af267158b82b150b5c. Inference measured with “caffe time --forward_only” command, training measured with “caffe time” command. For “ConvNet” topologies, synthetic dataset was used. For other topologies, data was stored on local storage and cached in memory before training. Topology specs from https://github.com/intel/caffe/tree/master/models/intel_optimized_models (ResNet-50). Intel C++ compiler ver. 17.0.2 20170213, Intel MKL small libraries version 2018.0.20 Performance results are based on testing as of 2/26/2019 (28x) and may not reflect all publically available security updates. No product can be absolutely secure. See configuration disclosure for details.nd 2 Gen Intel® Xeon Scalable Processors up to 28X AI Performance: Based on Intel internal testing: 28x performance improvement based on Intel® Optimization for Café ResNet-50 inference throughput performance on Intel® Xeon® Scalable Processor. 28x inference throughput improvement on Intel® Xeon® Platinum 9282 processor with Intel® DL Boost: Tested by Intel as of 2/26/2019. Platform: Dragon rock 2 socket Intel® Xeon® Platinum 9282(56 cores per socket), HT ON, turbo ON, Total Memory 768 GB (24 slots/ 32 GB/ 2933 MHz), BIOS:SE5C620.86B.0D.01.0241.112020180249, Centos 7 Kernel 3.10.0-957.5.1.el7.x86_64, Deep Learning Framework: Intel® Optimization for Caffe version: https://github.com/intel/caffe d554cbf1, ICC 2019.2.187, MKL DNN version: v0.17 (commit hash: 830a10059a018cd2634d94195140cf2d8790a75a), model: https://github.com/intel/caffe/blob/master/models/intel_optimized_models/int8/resnet50_int8_full_conv.prototxt, BS=64, No datalayer syntheticData:3x224x224, 56 instance/2 socket, Datatype: INT8 vs. Tested by Intel as of July 11th 2017: 2S Intel® Xeon® Platinum 8180 CPU @ 2.50GHz (28 cores), HT disabled, turbo disabled, scaling governor set to “performance” via intel_pstate driver, 384GB DDR4-2666 ECC RAM. CentOS Linux release 7.3.1611 (Core), Linux kernel 3.10.0-514.10.2.el7.x86_64. SSD: Intel® SSD DC S3700 Series (800GB, 2.5in SATA 6Gb/s, 25nm, MLC).Performance measured with: Environment variables: KMP_AFFINITY='granularity=fine, compact‘, OMP_NUM_THREADS=56, CPU Freq set with cpupower frequency-set -d 2.5G -u 3.8G -g performance. Caffe: (http://github.com/intel/caffe/), revision f96b759f71b2281835f690af267158b82b150b5c. Inference measured with “caffe time --forward_only” command, training measured with “caffe time” command. For “ConvNet” topologies, synthetic dataset was used. For other topologies, data was stored on local storage and cached in memory before training. Topology specs from https://github.com/intel/caffe/tree/master/models/intel_optimized_models (ResNet-50). Intel C++ compiler ver. 17.0.2 20170213, Intel MKL small libraries version 2018.0.20 Performance results are based on testing as of 2/26/2019 (28x) and may not reflect all publically available security updates. No product can be absolutely secure. See configuration disclosure for details.
Approx. 10x Lakefield Standby SoC Power Improvement: Estimated or simulated as of April 2019 using Intel internal analysis or architecture simulation or modeling. Vs. Amber Lake. Approx. 1.5x-2x Lakefield Active SoC Power Improvement: Estimated or simulated as of April 2019 using Intel internal analysis or architecture simulation or modeling. Workload: 1080p video playback. Vs. Amber Lake next-gen product. Approx. 2x Lakefield Graphics Performance: Estimated or simulated as of April 2019 using Intel internal analysis or architecture simulation or modeling. Workload: GfxBENCH. LKF 5W & 7W Configuration (Assumptions):,Processor: LKF PL1=5W & 7W TDP, 5C5T, Memory: 2X4GB LPDDR4x - 4267MHz, Storage: Intel® 760p m.2 PCIe NVMe SSD; LKF Optimized Power configuration uses UFS, Display Resolution: 1920x1080 for Performance; 25x14 eDP 13.3” and 19x12 MIPI 8.0” for Power, OS: Windows* 10 RS5. Power policy set to AC/Balanced mode for all benchmarks except SYSmark 2014 SE which is measured in AC/BAPCo mode for Performance. Power policy set to DC/Balanced mode for power. All benchmarks run in Admin mode., Graphics driver: X.X Vs. Configuration Data: Intel® Core™ AML Y2+2 5W measurements: Processor: Intel® Core™ i7-8500Y processor, PL1=5.0W TDP, 2C4T, Turbo up to 4.2GHz/3.6GHz, Memory: 2x4GB LPDDR3- 1866MHz, Storage: Intel® 760p m.2 PCIe NVMe SSD, Display Resolution: 1920x1080 for Performance; 25x14 eDP 13.3” for Power, OS: Windows 10 Build RS3 17134.112. SYSmark 2014 SE is measured in BAPCo power plan. Power policy set to DC/Balanced mode for power. All benchmarks run in Admin mode, Graphics driver: driver:whl.1006167-v2. Approx. 10x Lakefield Standby SoC Power Improvement: Estimated or simulated as of April 2019 using Intel internal analysis or architecture simulation or modeling. Vs. Amber Lake. Approx. 1.5x-2x Lakefield Active SoC Power Improvement: Estimated or simulated as of April 2019 using Intel internal analysis or architecture simulation or modeling. Workload: 1080p video playback. Vs. Amber Lake next-gen product. Approx. 2x Lakefield Graphics Performance: Estimated or simulated as of April 2019 using Intel internal analysis or architecture simulation or modeling. Workload: GfxBENCH. LKF 5W & 7W Configuration (Assumptions):,Processor: LKF PL1=5W & 7W TDP, 5C5T, Memory: 2X4GB LPDDR4x - 4267MHz, Storage: Intel® 760p m.2 PCIe NVMe SSD; LKF Optimized Power configuration uses UFS, Display Resolution: 1920x1080 for Performance; 25x14 eDP 13.3” and 19x12 MIPI 8.0” for Power, OS: Windows* 10 RS5. Power policy set to AC/Balanced mode for all benchmarks except SYSmark 2014 SE which is measured in AC/BAPCo mode for Performance. Power policy set to DC/Balanced mode for power. All benchmarks run in Admin mode., Graphics driver: X.X Vs. Configuration Data: Intel® Core™ AML Y2+2 5W measurements: Processor: Intel® Core™ i7-8500Y processor, PL1=5.0W TDP, 2C4T, Turbo up to 4.2GHz/3.6GHz, Memory: 2x4GB LPDDR3- 1866MHz, Storage: Intel® 760p m.2 PCIe NVMe SSD, Display Resolution: 1920x1080 for Performance; 25x14 eDP 13.3” for Power, OS: Windows 10 Build RS3 17134.112. SYSmark 2014 SE is measured in BAPCo power plan. Power policy set to DC/Balanced mode for power. All benchmarks run in Admin mode, Graphics driver: driver:whl.1006167-v2.
Software and workloads used in performance tests may have been optimized for performance only on Intel microprocessors. Performance tests, such as SYSmark and MobileMark, are measured using specific computer systems, components, software, operations and functions. Any change to any of those factors may cause the results to vary. You should consult other information and performance tests to assist you in fully evaluating your contemplated purchases, including the performance of that product when combined with other products. For more information go to www.intel.com/benchmarks. Performance results are based on testing as of date specified in the Configuration Disclosure and may not reflect all publicly available security updates. See configuration disclosure for details. No product or component can be absolutely secure. Optimization Notice: Intel's compilers may or may not optimize to the same degree for non-Intel microprocessors for optimizations that are not unique to Intel microprocessors. These optimizations include SSE2, SSE3, and SSSE3 instruction sets and other optimizations. Intel does not guarantee the availability, functionality, or effectiveness of any optimization on microprocessors not manufactured by Intel. Microprocessor- dependent optimizations in this product are intended for use with Intel microprocessors. Certain optimizations not specific to Intel microarchitecture are reserved for Intel microprocessors. Please refer to the applicable product User and Reference Guides for more information regarding the specific instruction sets covered by this notice. Intel technologies’ features and benefits depend on system configuration and may require enabled hardware, software or service activation. Performance varies depending on system configuration. Check with your system manufacturer or retailer or learn more at intel.com. Intel, the Intel logo, Intel Agilex, Intel Optane, Intel Xeon, and OpenVINO are trademarks of Intel Corporation or its subsidiaries in the U.S. and/or other countries. *Other names and brands may be claimed as the property of others. © Intel Corporation.Software and workloads used in performance tests may have been optimized for performance only on Intel microprocessors. Performance tests, such as SYSmark and MobileMark, are measured using specific computer systems, components, software, operations and functions. Any change to any of those factors may cause the results to vary. You should consult other information and performance tests to assist you in fully evaluating your contemplated purchases, including the performance of that product when combined with other products. For more information go to www.intel.com/benchmarks. Performance results are based on testing as of date specified in the Configuration Disclosure and may not reflect all publicly available security updates. See configuration disclosure for details. No product or component can be absolutely secure. Optimization Notice: Intel's compilers may or may not optimize to the same degree for non-Intel microprocessors for optimizations that are not unique to Intel microprocessors. These optimizations include SSE2, SSE3, and SSSE3 instruction sets and other optimizations. Intel does not guarantee the availability, functionality, or effectiveness of any optimization on microprocessors not manufactured by Intel. Microprocessor- dependent optimizations in this product are intended for use with Intel microprocessors. Certain optimizations not specific to Intel microarchitecture are reserved for Intel microprocessors. Please refer to the applicable product User and Reference Guides for more information regarding the specific instruction sets covered by this notice. Intel technologies’ features and benefits depend on system configuration and may require enabled hardware, software or service activation. Performance varies depending on system configuration. Check with your system manufacturer or retailer or learn more at intel.com. Intel, the Intel logo, Intel Agilex, Intel Optane, Intel Xeon, and OpenVINO are trademarks of Intel Corporation or its subsidiaries in the U.S. and/or other countries. *Other names and brands may be claimed as the property of others. © Intel Corporation.

Exhibit 99.3 EXECUTIVE VICE PRESIDENT & GENERAL MANAGER DATA CENTER GROUPExhibit 99.3 EXECUTIVE VICE PRESIDENT & GENERAL MANAGER DATA CENTER GROUP

Statements in this presentation that refer to business outlook, future plans and expectations are forward-looking statements that involve a number of risks and uncertainties. Words such as anticipates, expects, intends, goals, plans, believes, seeks, estimates, continues, may, will, “would,” should, “could,” and variations of such words and similar expressions are intended to identify such forward-looking statements. Statements that refer to or are based on estimates, forecasts, projections, uncertain events or assumptions, including statements relating to total addressable market (TAM) or market opportunity, future products and the expected availability and benefits of such products, and anticipated trends in our businesses or the markets relevant to them, also identify forward-looking statements. Such statements are based on management's expectations as of May 8, 2019, unless an earlier date is indicated, and involve many risks and uncertainties that could cause actual results to differ materially from those expressed or implied in these forward-looking statements. Important factors that could cause actual results to differ materially from the company's expectations are set forth in Intel's earnings release dated April 25, 2019, which is included as an exhibit to Intel’s Form 8-K furnished to the SEC on such date. Additional information regarding these and other factors that could affect Intel's results is included in Intel's SEC filings, including the company's most recent reports on Forms 10-K and 10-Q. Copies of Intel's Form 10-K, 10-Q and 8-K reports may be obtained by visiting our Investor Relations website at www.intc.com or the SEC's website at www.sec.gov. All information in this presentation reflects management’s views as of May 8, 2019, unless an earlier date is indicated. Intel does not undertake, and expressly disclaims any duty, to update any statement made in this presentation, whether as a result of new information, new developments or otherwise, except to the extent that disclosure may be required by law.Statements in this presentation that refer to business outlook, future plans and expectations are forward-looking statements that involve a number of risks and uncertainties. Words such as anticipates, expects, intends, goals, plans, believes, seeks, estimates, continues, may, will, “would,” should, “could,” and variations of such words and similar expressions are intended to identify such forward-looking statements. Statements that refer to or are based on estimates, forecasts, projections, uncertain events or assumptions, including statements relating to total addressable market (TAM) or market opportunity, future products and the expected availability and benefits of such products, and anticipated trends in our businesses or the markets relevant to them, also identify forward-looking statements. Such statements are based on management's expectations as of May 8, 2019, unless an earlier date is indicated, and involve many risks and uncertainties that could cause actual results to differ materially from those expressed or implied in these forward-looking statements. Important factors that could cause actual results to differ materially from the company's expectations are set forth in Intel's earnings release dated April 25, 2019, which is included as an exhibit to Intel’s Form 8-K furnished to the SEC on such date. Additional information regarding these and other factors that could affect Intel's results is included in Intel's SEC filings, including the company's most recent reports on Forms 10-K and 10-Q. Copies of Intel's Form 10-K, 10-Q and 8-K reports may be obtained by visiting our Investor Relations website at www.intc.com or the SEC's website at www.sec.gov. All information in this presentation reflects management’s views as of May 8, 2019, unless an earlier date is indicated. Intel does not undertake, and expressly disclaims any duty, to update any statement made in this presentation, whether as a result of new information, new developments or otherwise, except to the extent that disclosure may be required by law.
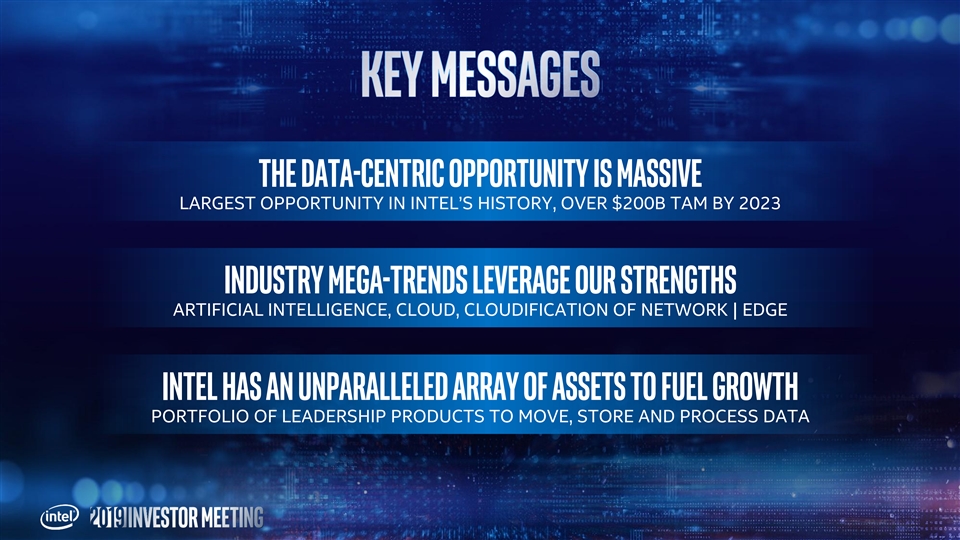
The Data-centric opportunity is massive LARGEST OPPORTUNITY IN INTEL’S HISTORY, OVER $200B TAM BY 2023 industry Mega-trends LEVERAGE OUR STRENGTHS ARTIFICIAL INTELLIGENCE, CLOUD, CLOUDIFICATION OF NETWORK | EDGE Intel has an unparalleled array of assets to fuel growth PORTFOLIO OF LEADERSHIP PRODUCTS TO MOVE, STORE AND PROCESS DATAThe Data-centric opportunity is massive LARGEST OPPORTUNITY IN INTEL’S HISTORY, OVER $200B TAM BY 2023 industry Mega-trends LEVERAGE OUR STRENGTHS ARTIFICIAL INTELLIGENCE, CLOUD, CLOUDIFICATION OF NETWORK | EDGE Intel has an unparalleled array of assets to fuel growth PORTFOLIO OF LEADERSHIP PRODUCTS TO MOVE, STORE AND PROCESS DATA

GROWTH OF PROLIFERATION OF CLOUDIFICATION OF THEGROWTH OF PROLIFERATION OF CLOUDIFICATION OF THE

AI Analytics HPC Multi-cloud & Orchestration Network in-memory Database Virtualization COMPUTE DEMAND (MIPS) ~60% CAGR Security 2014 2015 2016 2017 2018 2019 2020 2021 2022 2023AI Analytics HPC Multi-cloud & Orchestration Network in-memory Database Virtualization COMPUTE DEMAND (MIPS) ~60% CAGR Security 2014 2015 2016 2017 2018 2019 2020 2021 2022 2023
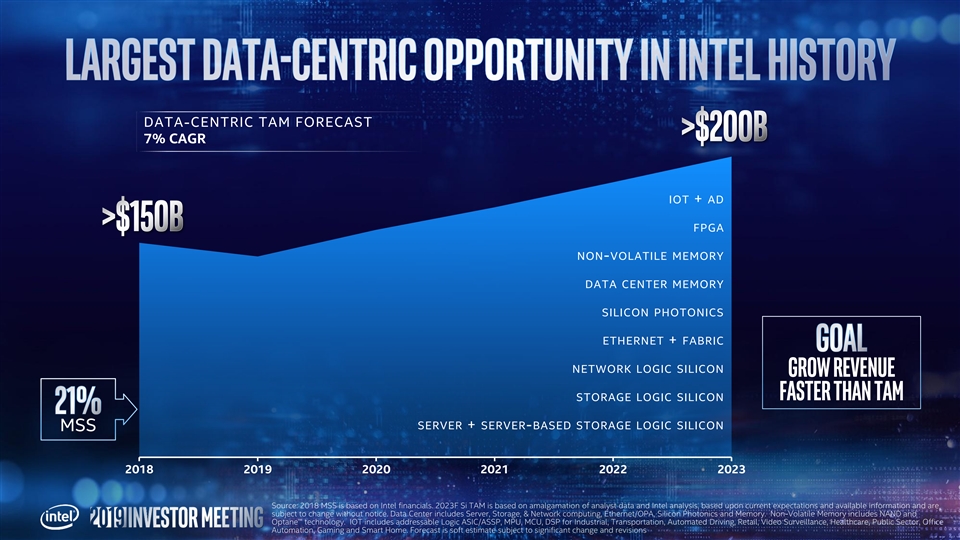
DATA-CENTRIC TAM FORECAST 7% CAGR IOT + AD FPGA NON-VOLATILE MEMORY DATA CENTER MEMORY SILICON PHOTONICS ETHERNET + FABRIC NETWORK LOGIC SILICON Grow Revenue faster than TAM STORAGE LOGIC SILICON SERVER + SERVER-BASED STORAGE LOGIC SILICON MSS 2018 2019 2020 2021 2022 2023DATA-CENTRIC TAM FORECAST 7% CAGR IOT + AD FPGA NON-VOLATILE MEMORY DATA CENTER MEMORY SILICON PHOTONICS ETHERNET + FABRIC NETWORK LOGIC SILICON Grow Revenue faster than TAM STORAGE LOGIC SILICON SERVER + SERVER-BASED STORAGE LOGIC SILICON MSS 2018 2019 2020 2021 2022 2023

INTEL DATA CENTER GROUP REVENUE 12% CAGR ◊ Cloud SP + Comms SP approaching 70% of DCG revenue CLOUD + COMMS ~65% ◊ 2019 revenue forecast down mid-single CLOUD + digits YOY COMMS ~40% ◊ Inventory and capacity absorption off of a record 21% growth year E&G E&G ◊ Continued China weakness ~60% ~35% 2014 2015 2016 2017 2018INTEL DATA CENTER GROUP REVENUE 12% CAGR ◊ Cloud SP + Comms SP approaching 70% of DCG revenue CLOUD + COMMS ~65% ◊ 2019 revenue forecast down mid-single CLOUD + digits YOY COMMS ~40% ◊ Inventory and capacity absorption off of a record 21% growth year E&G E&G ◊ Continued China weakness ~60% ~35% 2014 2015 2016 2017 2018

INTEL PUBLIC CLOUD SP REVENUE >30% CAGR $B Investing to enable Next wave CSPs NEXT WAVE GROWTH OF 33% IN 2018 CAGR NEXT Deepen Partnerships with CSPs WAVE CUSTOM CPUS >55% OF VOLUME IN 2018 Public Cloud Business is TAM Expansive CAGR 2/3 OF REV IS TAM EXPANSIVE, AND GROWING (CONSUMER AND NEW CLOUD SERVICES) SUPER 7 2014 2015 2016 2017 2018INTEL PUBLIC CLOUD SP REVENUE >30% CAGR $B Investing to enable Next wave CSPs NEXT WAVE GROWTH OF 33% IN 2018 CAGR NEXT Deepen Partnerships with CSPs WAVE CUSTOM CPUS >55% OF VOLUME IN 2018 Public Cloud Business is TAM Expansive CAGR 2/3 OF REV IS TAM EXPANSIVE, AND GROWING (CONSUMER AND NEW CLOUD SERVICES) SUPER 7 2014 2015 2016 2017 2018

DIGITAL TRANSFORMATION CONTINUES CLOUD SPS INVESTING IN HYBRID CLOUD SOLUTIONS AWS DELL TECHNOLOGIES OUTPOSTS CLOUD GOOGLE CLOUD MICROSOFT AZURE ANTHOS VMWARE SOLUTIONSDIGITAL TRANSFORMATION CONTINUES CLOUD SPS INVESTING IN HYBRID CLOUD SOLUTIONS AWS DELL TECHNOLOGIES OUTPOSTS CLOUD GOOGLE CLOUD MICROSOFT AZURE ANTHOS VMWARE SOLUTIONS

Move Process Store ETHERNET SILICON PHOTONICS OMNI-PATH FABRIC Software & System-LevelMove Process Store ETHERNET SILICON PHOTONICS OMNI-PATH FABRIC Software & System-Level

ND A P R I L 2 L A U N C H MOVE STORE PROCESS “Only one company can introduce technologies across such a broad set of areas – this is unparalleled.” Mario Morales, IDCND A P R I L 2 L A U N C H MOVE STORE PROCESS “Only one company can introduce technologies across such a broad set of areas – this is unparalleled.” Mario Morales, IDC

CLOUD VIDEO ANALYSIS INDUSTRIAL BIG DATA CLOUD MANAGEMENT 8260 DLBOOST VS FP32 MORE VMS AI 8280+OPTANE PM VS DRAM 8260+OPTANE PM VS DRAM ANALYTICS CLOUD ORCHESTRATION VNETWORK GATEWAY IMDB MORE UP VM TO INSTANCES 5218N+QAT VS 5118 8280+OPTANE PM VS DRAM CUSTOM SKUS STANDARD SKUS NETWORK VIRTUALIZATION IMDB VIRTUAL NG FIREWALL CORES PER SOCKET SOCKETS MEMORY PER SOCKET PHYSICS SIMULATION 8260+OPTANE PM VS DRAM 6230N+QAT VS 6230N up IN-MEMORY DATABASE SECURITY to 9242 VS 8160 AVG. MAINSTREAM PERF GEN ON GEN HPCCLOUD VIDEO ANALYSIS INDUSTRIAL BIG DATA CLOUD MANAGEMENT 8260 DLBOOST VS FP32 MORE VMS AI 8280+OPTANE PM VS DRAM 8260+OPTANE PM VS DRAM ANALYTICS CLOUD ORCHESTRATION VNETWORK GATEWAY IMDB MORE UP VM TO INSTANCES 5218N+QAT VS 5118 8280+OPTANE PM VS DRAM CUSTOM SKUS STANDARD SKUS NETWORK VIRTUALIZATION IMDB VIRTUAL NG FIREWALL CORES PER SOCKET SOCKETS MEMORY PER SOCKET PHYSICS SIMULATION 8260+OPTANE PM VS DRAM 6230N+QAT VS 6230N up IN-MEMORY DATABASE SECURITY to 9242 VS 8160 AVG. MAINSTREAM PERF GEN ON GEN HPC

A PLATFORM APPROACH INTEL® OPTANE™ DC PERSISTENT MEMORY SAM (2023) >50% CAGR (’18-’23) VMS, CONTAINERS, REAL-TIME STORAGE IN-MEMORY CONTENT HIGH PERFORMANCE DATABASE APP DENSITY DELIVERY ANALYTICS DATA REPLICATION COMPUTING CUSTOMER PROOF-OF-CONCEPT TRACTION SINCE LAUNCH FORTUNE 500 SUPER 7 NEXT WAVE CSPs COMMS SPsA PLATFORM APPROACH INTEL® OPTANE™ DC PERSISTENT MEMORY SAM (2023) >50% CAGR (’18-’23) VMS, CONTAINERS, REAL-TIME STORAGE IN-MEMORY CONTENT HIGH PERFORMANCE DATABASE APP DENSITY DELIVERY ANALYTICS DATA REPLICATION COMPUTING CUSTOMER PROOF-OF-CONCEPT TRACTION SINCE LAUNCH FORTUNE 500 SUPER 7 NEXT WAVE CSPs COMMS SPs

nd Cooper Lake Intel® Xeon® Intel® Xeon® Intel® Xeon® 2 Gen Intel® Xeon® & Processor E5 v3 Processor E5 v4 Scalable Processor Scalable Processor Haswell Broadwell Skylake Cascade Lake Ice Lake PRODUCTION SHIPMENTS 1H’20 SAMPLES SHIPPING NOW POWERED ON AT MULTIPLE CUSTOMERSnd Cooper Lake Intel® Xeon® Intel® Xeon® Intel® Xeon® 2 Gen Intel® Xeon® & Processor E5 v3 Processor E5 v4 Scalable Processor Scalable Processor Haswell Broadwell Skylake Cascade Lake Ice Lake PRODUCTION SHIPMENTS 1H’20 SAMPLES SHIPPING NOW POWERED ON AT MULTIPLE CUSTOMERS

nd Cooper Lake Sapphire Next Intel® Xeon® Intel® Xeon® Intel® Xeon® 2 Gen Intel® Xeon® & Processor E5 v3 Processor E5 v4 Scalable Processor Scalable Processor Rapids Gen Haswell Broadwell Skylake Cascade Lake Ice Lake DRIVING LEADERSHIP WORKLOAD PERFORMANCE Moving to QUARTER CADENCE QUARTER CADENCEnd Cooper Lake Sapphire Next Intel® Xeon® Intel® Xeon® Intel® Xeon® 2 Gen Intel® Xeon® & Processor E5 v3 Processor E5 v4 Scalable Processor Scalable Processor Rapids Gen Haswell Broadwell Skylake Cascade Lake Ice Lake DRIVING LEADERSHIP WORKLOAD PERFORMANCE Moving to QUARTER CADENCE QUARTER CADENCE

AI DATA CENTER SI TAM >20% CAGR ’18 INTEL DATA CENTER AI REV INFERENCE TRAINING 2018 2023AI DATA CENTER SI TAM >20% CAGR ’18 INTEL DATA CENTER AI REV INFERENCE TRAINING 2018 2023

FROM CPU TO XPU - ONE SIZE DOES NOT FIT ALL Intel® Xeon® Intel® Intel® Intel® Nervana™ NNP Scalable Processor Family Discrete Graphics FPGA Intel® Movidius™ Myriad™ Intel® Mobileye® EyeQ® ONEAPI Unified developer frameworkFROM CPU TO XPU - ONE SIZE DOES NOT FIT ALL Intel® Xeon® Intel® Intel® Intel® Nervana™ NNP Scalable Processor Family Discrete Graphics FPGA Intel® Movidius™ Myriad™ Intel® Mobileye® EyeQ® ONEAPI Unified developer framework
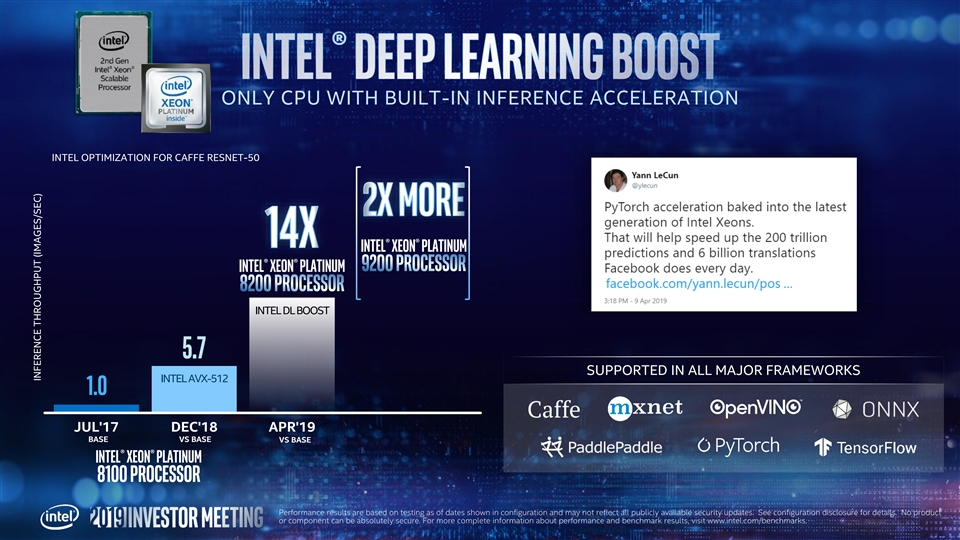
ONLY CPU WITH BUILT-IN INFERENCE ACCELERATION INTEL OPTIMIZATION FOR CAFFE RESNET-50 intel® xeon® platinum intel® xeon® platinum INTEL DL BOOST 5.7 SUPPORTED IN ALL MAJOR FRAMEWORKS INTEL AVX-512 1.0 JUL'17 DEC'18 APR'19 COLUMN1 BASE VS BASE VS BASE intel® xeon® platinum 8100 processor INFERENCE THROUGHPUT (IMAGES/SEC)ONLY CPU WITH BUILT-IN INFERENCE ACCELERATION INTEL OPTIMIZATION FOR CAFFE RESNET-50 intel® xeon® platinum intel® xeon® platinum INTEL DL BOOST 5.7 SUPPORTED IN ALL MAJOR FRAMEWORKS INTEL AVX-512 1.0 JUL'17 DEC'18 APR'19 COLUMN1 BASE VS BASE VS BASE intel® xeon® platinum 8100 processor INFERENCE THROUGHPUT (IMAGES/SEC)
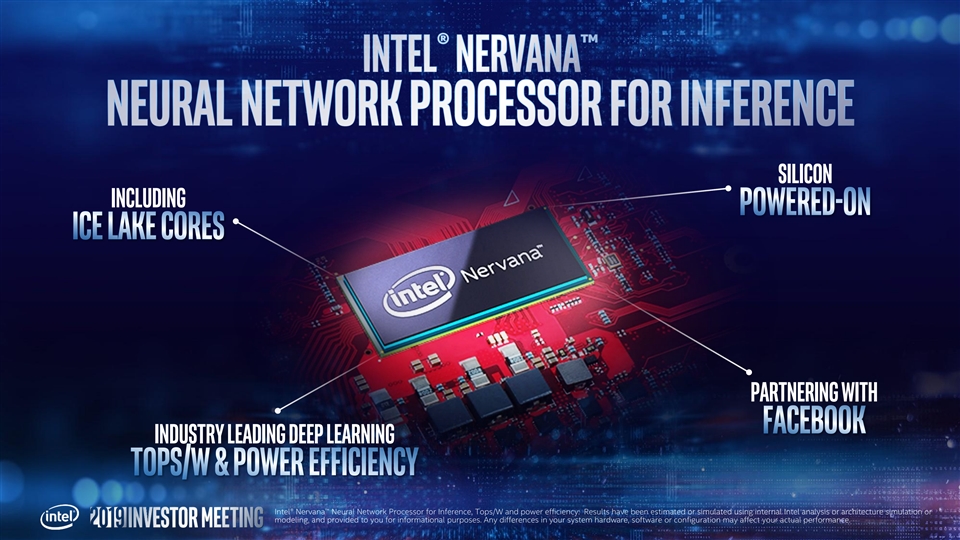
Silicon Including Partnering with Industry leading Deep LearningSilicon Including Partnering with Industry leading Deep Learning

Autonomous cars things Access | network Edge Core network Data Center | Cloud EDGE COMPUTING NETWORK EDGE Autonomous Driving IOT Network SILICON + SERVICES SILICON SILICON 2018 intel Revenue ~$65B opportunity By 2023 >20% GROWTH YOYAutonomous cars things Access | network Edge Core network Data Center | Cloud EDGE COMPUTING NETWORK EDGE Autonomous Driving IOT Network SILICON + SERVICES SILICON SILICON 2018 intel Revenue ~$65B opportunity By 2023 >20% GROWTH YOY

SENIOR VICE PRESIDENT & GENERAL MANAGER NETWORK PLATFORMS GROUPSENIOR VICE PRESIDENT & GENERAL MANAGER NETWORK PLATFORMS GROUP

Traditional network intelligent network THINGS NETWORK Data Center/ things RAN/Edge CORE Cloud Analytics compute Compute Compute Compute Compute Network Storage Storage Storage Storage Analytics Analytics Analytics Analytics Storage Scalability & flexibility for networking workloads ETHERNET OPENNESS SILICON PHOTONICSTraditional network intelligent network THINGS NETWORK Data Center/ things RAN/Edge CORE Cloud Analytics compute Compute Compute Compute Compute Network Storage Storage Storage Storage Analytics Analytics Analytics Analytics Storage Scalability & flexibility for networking workloads ETHERNET OPENNESS SILICON PHOTONICS

2011 2013 2015 2017 2018 2019 st st NFV 1 NFV 20% DPDK 65% 1 100% DEFINED PROOF OF OF COMMS SPS MOVES TO LINUX CORE NW FUNCTIONS CLOUD-NATIVE CONCEPTS ADOPT NFV FOUNDATION VIRTUALIZED NETWORK st World’s 1 End to end cloud native Mobile network IMPROVED FOR ENTIRE OPERATIONS FROM CONCEPT TO NETWORK TCO NETWORK STAFF DEPLOYMENT ARCHITECTURE ON INTEL ARCHITECTURE “Our vision is to build a network that innovates at the speed of software and scales at the speed of cloud… leveraging best-in-class technology…to provide a high quality, cost- effective service to our customers.” Tareq Amin, Group CTIO, Rakuten 2011 2013 2015 2017 2018 2019 st st NFV 1 NFV 20% DPDK 65% 1 100% DEFINED PROOF OF OF COMMS SPS MOVES TO LINUX CORE NW FUNCTIONS CLOUD-NATIVE CONCEPTS ADOPT NFV FOUNDATION VIRTUALIZED NETWORK st World’s 1 End to end cloud native Mobile network IMPROVED FOR ENTIRE OPERATIONS FROM CONCEPT TO NETWORK TCO NETWORK STAFF DEPLOYMENT ARCHITECTURE ON INTEL ARCHITECTURE “Our vision is to build a network that innovates at the speed of software and scales at the speed of cloud… leveraging best-in-class technology…to provide a high quality, cost- effective service to our customers.” Tareq Amin, Group CTIO, Rakuten

ACCELERATED BY 5G INTEL NETWORK REVENUE ~40% CAGR 22% MSS DRIVING TRANSFORMATION TO CPU VOLUME ~20% CAGR CLOUD-BASED PLATFORMS XEON ASP 10% CAGR DELIVERING PORTFOLIO OF PRODUCTS FOR 5G AND EDGE ON TRACK TO BASESTATION MSS 8% MSS >40% BY 2022 2014 2016 2018ACCELERATED BY 5G INTEL NETWORK REVENUE ~40% CAGR 22% MSS DRIVING TRANSFORMATION TO CPU VOLUME ~20% CAGR CLOUD-BASED PLATFORMS XEON ASP 10% CAGR DELIVERING PORTFOLIO OF PRODUCTS FOR 5G AND EDGE ON TRACK TO BASESTATION MSS 8% MSS >40% BY 2022 2014 2016 2018

INTEL IOTG REVENUE >10% CAGR 16% MSS AGGREGATION AT THE EDGE ASP VIDEO INFERENCE HIGH PERFORMANCE COMPUTE ATOM CORE XEON 2014 2015 2016 2017 2018INTEL IOTG REVENUE >10% CAGR 16% MSS AGGREGATION AT THE EDGE ASP VIDEO INFERENCE HIGH PERFORMANCE COMPUTE ATOM CORE XEON 2014 2015 2016 2017 2018
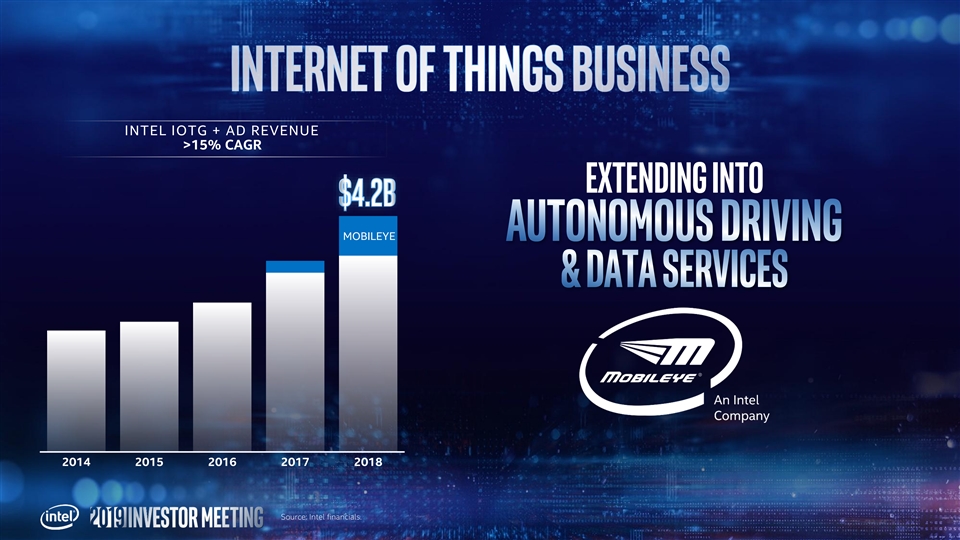
INTEL IOTG + AD REVENUE >15% CAGR Extending into MOBILEYE 2014 2015 2016 2017 2018INTEL IOTG + AD REVENUE >15% CAGR Extending into MOBILEYE 2014 2015 2016 2017 2018

The Data-centric opportunity is massive LARGEST OPPORTUNITY IN INTEL’S HISTORY, OVER $200B TAM BY 2023 industry Mega-trends LEVERAGE OUR STRENGTHS ARTIFICIAL INTELLIGENCE, CLOUD, CLOUDIFICATION OF NETWORK | EDGE Intel has an unparalleled array of assets to fuel growth PORTFOLIO OF LEADERSHIP PRODUCTS TO MOVE, STORE AND PROCESS DATAThe Data-centric opportunity is massive LARGEST OPPORTUNITY IN INTEL’S HISTORY, OVER $200B TAM BY 2023 industry Mega-trends LEVERAGE OUR STRENGTHS ARTIFICIAL INTELLIGENCE, CLOUD, CLOUDIFICATION OF NETWORK | EDGE Intel has an unparalleled array of assets to fuel growth PORTFOLIO OF LEADERSHIP PRODUCTS TO MOVE, STORE AND PROCESS DATA


Configuration Disclosure Performance results are based on testing as of dates shown in configuration and may not reflect all publicly available security updates. See configuration disclosure for details. No product or component can be absolutely secure. Software and workloads used in performance tests may have been optimized for performance only on Intel microprocessors. Performance tests, such as SYSmark and MobileMark, are measured using specific computer systems, components, software, operations and functions. Any change to any of those factors may cause the results to vary. You should consult other information and performance tests to assist you in fully evaluating your contemplated purchases, including the performance of that product when combined with other products. For more complete information visit www.intel.com/benchmarks. Up to 1.33x average generational gains on mainstream Gold SKU: Geomean of est SPECrate2017_int_base, est SPECrate2017_fp_base, Stream Triad, Intel Distribution of Linpack, server side Java. Gold 5218 vs Gold 5118: 1-node, 2x Intel® Xeon® Gold 5218 cpu on Wolf Pass with 384 GB (12 X 32GB 2933 (2666)) total memory, ucode 0x4000013 on RHEL7.6, 3.10.0-957.el7.x86_64, IC18u2, AVX2, HT on all (off Stream, Linpack), Turbo on, result: est int throughput=162, est fp throughput=172, Stream Triad=185, Linpack=1088, server side java=98333, test by Intel on 12/7/2018. 1-node, 2x Intel® Xeon® Gold 5118 cpu on Wolf Pass with 384 GB (12 X 32GB 2666 (2400)) total memory, ucode 0x200004D on RHEL7.6, 3.10.0-957.el7.x86_64, IC18u2, AVX2, HT on all (off Stream, Linpack), Turbo on, result: est int throughput=119, est fp throughput=134, Stream Triad=148.6, Linpack=822, server side java=67434, test by Intel on 11/12/2018. 2.01x LS-Dyna* Explicit, 3car: 1-node, 2x Intel® Xeon® Platinum 8160L cpu on Wolf Pass with 192 GB (12 slots / 16GB / 2666) total memory, ucode 0x200004d on Oracle Linux Server release 7.6 , 3.10.0-862.14.4.el7.crt1.x86_64, Intel SSDSC2BA80, LS-Dyna 9.3-Explicit AVX2 binary, 3car, HT on, Turbo on, test by Intel on 2/26/2019. 1-node, 2x Intel® Xeon® Platinum 9242 cpu on Intel reference platform with 384 GB (24 slots / 16GB / 2933) total memory, ucode 0x4000017 on CentOS 7.6, 3.10.0- 957.5.1.el7.x86_64, Intel SSDSC2BA80, LS-Dyna 9.3-Explicit AVX2 binary, 3car, HT on, Turbo on, test by Intel on 3/18/2019. 1.39x BAOSIGHT* xInsight*: 1-node, 2x Intel® Xeon® Platinum 8260L cpu on S2600WFS with 768 DDR GB (24 slots / 32GB / 2666) total memory, ucode 0x400000A on CentOS 7.5, 3.10.0-957.1.3.el7.x86_64, 1x Intel 480GB SSD OS Drive, 1x Intel XC722, xInsight 2.0 internal workload, HT on, Turbo on, test by Intel/Baosight on 1/8/2019. 1-node, 2x Intel® Xeon® Platinum 8260L cpu on S2600WFS with 192 DDR + 1024 Intel DCPMM GB (12 slots / 16 GB / 2666 DDR + 8 slots / 128 GB / 2666 Intel DCPMM) total memory, ucode 0x400000A on CentOS 7.5, 3.10.0-957.1.3.el7.x86_64, 1x Intel 480GB SSD OS Drive, 1x Intel XC722, xInsight 2.0 internal workload, HT on, Turbo on, test by Intel/Baosight on 1/9/2018. 1.42x Huawei* FusionSphere*: 1-node, 2x Intel® Xeon® Platinum 8260L cpu on Wolf Pass with 1024 GB (16 slots / 64GB / 2666) total memory, ucode 0x400000A on FusionSphere HyperV, 3.10.0-514.44.5.10_96.x86_64 , 1x Intel 800GB SSD OS Drive, 1x Intel 800GB SSD OS Drive, 1x Intel XC722, FusionSphere 6.3.1, mysql-5.7.24, sysbench-1.0.6, HT on, Turbo on, test by Huawei/Intel on 1/11/2018. 1-node, 2x Intel® Xeon® Platinum 8260L cpu on Wolf Pass with 384 DDR + 1536 Intel DCPMM GB (12 slots / 32 GB / 2666 DDR + 12 slots / 128 GB / 2666 Intel DCPMM) total memory, ucode 0x400000A on FusionSphere HyperV, 3.10.0-514.44.5.10_96.x86_64 , 3 x P3520 1.8TB Application Data, 3 x P3520 1.8TB Application Data, 1x Intel XC722, FusionSphere 6.3.1, mysql- 5.7.24, sysbench-1.0.6, HT on, Turbo on, test by Huawei/Intel on 1/11/2018. 1.35x GBASE: 1-node, 2x Intel® Xeon® Platinum 8260 cpu on S2600WFT with 768 DDR GB (24 slots / 32GB / 2666) total memory, ucode 0x400000A on CentOS 7.5, 3.10.0-957.1.3.el7.x86_64, 1x Intel 400GB SSD OS Drive, 1x Intel XC722, Gbase 8m 6.3.2 OCS Benchmark, HT on, Turbo on, test by GBASE/Intel on 2/19/2019. 1-node, 2x Intel® Xeon® Platinum 8260 cpu on S2600WFT with 192 DDR + 1024 Intel DCPMM GB (12 slots / 16 GB / 2666 DDR + 8 slots / 128 GB / 2666 Intel DCPMM) total memory, ucode 0x400000A on CentOS 7.5, 3.10.0-957.1.3.el7.x86_64, 1x Intel 400GB SSD OS Drive, 1x Intel XC722, Gbase 8m 6.3.2 OCS Benchmark, HT on, Turbo on, test by GBASE/Intel on 2/19/2019. 2x Nokia* SDWAN: Configuration #1 (With Intel® QuickAssist® Technology): 2x Intel® Xeon® Gold 5218N Processor on Neon City Platform with 192 GB total memory (12 slots / 16GB / DDR4 2667MHz), ucode 0x4000019, Bios: PLYXCRB 1.86B.0568.D10.1901032132, uCode: 0x4000019 on CentOS 7.5 with Kernel 3.10.0-862, KVM Hypervisor; 1x Intel® QuickAssist Adapter 8970, Cipher: AES-128 SHA-256; Intel® Ethernet Converged Network Adapter X520-SR2; Application: Nokia Nuage SDWAN NSGv 5.3.3U3. Configuration # 2: 2x Intel® Xeon® Gold 5118 Processor on Neon City Platform with 192 GB total memory (12 slots / 16GB / DDR4 2667MHz), ucode 0x4000019, Bios: PLYXCRB 1.86B.0568.D10.1901032132, uCode: 0x4000019 on CentOS 7.5 with Kernel 3.10.0-862, KVM Hypervisor; Intel® Ethernet Converged Network Adapter X520-SR2; Application: Nokia Nuage SDWAN NSGv 5.3.3U3. Results recorded by Intel on 2/14/2018 in collaborate with Nokia. 3.26x latency reduction for Tencent* Cloud Video Analysis: Tested by Tencent as of 1/14/2019. 2 socket Intel® Xeon® Gold Processor, 24 cores HT On Turbo ON Total Memory 192 GB (12 slots/ 16GB/ 2666 MHz), CentOS 7.6 3.10.0-957.el7.x86_64, Compiler: gcc 4.8.5, Deep Learning Framework: Intel® Optimizations for Caffe v1.1.3, Topology: modified inception v3, Tencent’s private dataset, BS=1. Comparing performance on same system with FP32 vs INT8 w/ Intel® DL Boost 3x Fortinet* Fortigate*: Configuration #1 (With Intel® QuickAssist Technology) 2x Intel® Xeon® Gold E5-6230N Processor on Neon City Platform with 192 GB total memory (12 slots / 16GB / DDR4 2933MHz), ucode 0x4000019, Bios: PLYXCRB 1.86B.0568.D10.1901032132, uCode: 0x4000019 on CentOS 7.5 with Kernel 3.10.0-862, KVM Hypervisor; 1 x Intel® QuickAssist Adapter 8970, IPSec AES128-SHA256; 1 x Dual Port 40GbE Intel® Ethernet Network Adapter XL710; Application: FortiGate VM64- KVM (v.6.2.0 interim build). Configuration #2 (Without Intel® QuickAssist Technology) : 2x Intel® Xeon® Gold E5-6230N Processor on Neon City Platform with 192 GB total memory (12 slots / 16GB / DDR4 2933MHz), ucode 0x4000019, Bios: PLYXCRB 1.86B.0568.D10.1901032132, uCode: 0x4000019 on CentOS 7.5 with Kernel 3.10.0-862, KVM Hypervisor; 1 x Dual Port 40GbE Intel® Ethernet Network Adapter XL710; Application: FortiGate VM64-KVM (v.6.2.0 interim build). Results recorded by Intel and reviewed by Fortinet on 3/27/2018. Up to 8X more VMs when running Redis with 8X memory capacity: 1-node, 2x Intel Xeon Platinum 8276 cpu on Intel reference platform with 768 GB (12 slots / 32GB / 2666) total memory, BIOS PLYXCRB1.86B.0573.D10.1901300453 on Fedora-27, 4.20.4- 200.fc29.x86_64, 2x40G, Redis 4.0.11, memtier_benchmark-1.2.12 (80/20 read/write); 1K record size, KVM, 1/VM, centos-7.0, HT on, Turbo on, test by Intel on 2/22/2019. 1-node, 2x Intel Xeon Platinum 8276 cpu on Intel reference platform with 192 + 6144 GB (12 slots / 16GB / 2666 DDR + 12 slots / 512GB/ 2666 Intel Optance DCPMM) total memory, BIOS PLYXCRB1.86B.0573.D10.1901300453 on Fedora-27, 4.20.4-200.fc29.x86_64, 2x40G, Redis 4.0.11, memtier_benchmark-1.2.12 (80/20 read/write); 1K record size, KVM, 1/VM, centos-7.0, Memory mode, HT on, Turbo on, test by Intel on 2/22/2019.Configuration Disclosure Performance results are based on testing as of dates shown in configuration and may not reflect all publicly available security updates. See configuration disclosure for details. No product or component can be absolutely secure. Software and workloads used in performance tests may have been optimized for performance only on Intel microprocessors. Performance tests, such as SYSmark and MobileMark, are measured using specific computer systems, components, software, operations and functions. Any change to any of those factors may cause the results to vary. You should consult other information and performance tests to assist you in fully evaluating your contemplated purchases, including the performance of that product when combined with other products. For more complete information visit www.intel.com/benchmarks. Up to 1.33x average generational gains on mainstream Gold SKU: Geomean of est SPECrate2017_int_base, est SPECrate2017_fp_base, Stream Triad, Intel Distribution of Linpack, server side Java. Gold 5218 vs Gold 5118: 1-node, 2x Intel® Xeon® Gold 5218 cpu on Wolf Pass with 384 GB (12 X 32GB 2933 (2666)) total memory, ucode 0x4000013 on RHEL7.6, 3.10.0-957.el7.x86_64, IC18u2, AVX2, HT on all (off Stream, Linpack), Turbo on, result: est int throughput=162, est fp throughput=172, Stream Triad=185, Linpack=1088, server side java=98333, test by Intel on 12/7/2018. 1-node, 2x Intel® Xeon® Gold 5118 cpu on Wolf Pass with 384 GB (12 X 32GB 2666 (2400)) total memory, ucode 0x200004D on RHEL7.6, 3.10.0-957.el7.x86_64, IC18u2, AVX2, HT on all (off Stream, Linpack), Turbo on, result: est int throughput=119, est fp throughput=134, Stream Triad=148.6, Linpack=822, server side java=67434, test by Intel on 11/12/2018. 2.01x LS-Dyna* Explicit, 3car: 1-node, 2x Intel® Xeon® Platinum 8160L cpu on Wolf Pass with 192 GB (12 slots / 16GB / 2666) total memory, ucode 0x200004d on Oracle Linux Server release 7.6 , 3.10.0-862.14.4.el7.crt1.x86_64, Intel SSDSC2BA80, LS-Dyna 9.3-Explicit AVX2 binary, 3car, HT on, Turbo on, test by Intel on 2/26/2019. 1-node, 2x Intel® Xeon® Platinum 9242 cpu on Intel reference platform with 384 GB (24 slots / 16GB / 2933) total memory, ucode 0x4000017 on CentOS 7.6, 3.10.0- 957.5.1.el7.x86_64, Intel SSDSC2BA80, LS-Dyna 9.3-Explicit AVX2 binary, 3car, HT on, Turbo on, test by Intel on 3/18/2019. 1.39x BAOSIGHT* xInsight*: 1-node, 2x Intel® Xeon® Platinum 8260L cpu on S2600WFS with 768 DDR GB (24 slots / 32GB / 2666) total memory, ucode 0x400000A on CentOS 7.5, 3.10.0-957.1.3.el7.x86_64, 1x Intel 480GB SSD OS Drive, 1x Intel XC722, xInsight 2.0 internal workload, HT on, Turbo on, test by Intel/Baosight on 1/8/2019. 1-node, 2x Intel® Xeon® Platinum 8260L cpu on S2600WFS with 192 DDR + 1024 Intel DCPMM GB (12 slots / 16 GB / 2666 DDR + 8 slots / 128 GB / 2666 Intel DCPMM) total memory, ucode 0x400000A on CentOS 7.5, 3.10.0-957.1.3.el7.x86_64, 1x Intel 480GB SSD OS Drive, 1x Intel XC722, xInsight 2.0 internal workload, HT on, Turbo on, test by Intel/Baosight on 1/9/2018. 1.42x Huawei* FusionSphere*: 1-node, 2x Intel® Xeon® Platinum 8260L cpu on Wolf Pass with 1024 GB (16 slots / 64GB / 2666) total memory, ucode 0x400000A on FusionSphere HyperV, 3.10.0-514.44.5.10_96.x86_64 , 1x Intel 800GB SSD OS Drive, 1x Intel 800GB SSD OS Drive, 1x Intel XC722, FusionSphere 6.3.1, mysql-5.7.24, sysbench-1.0.6, HT on, Turbo on, test by Huawei/Intel on 1/11/2018. 1-node, 2x Intel® Xeon® Platinum 8260L cpu on Wolf Pass with 384 DDR + 1536 Intel DCPMM GB (12 slots / 32 GB / 2666 DDR + 12 slots / 128 GB / 2666 Intel DCPMM) total memory, ucode 0x400000A on FusionSphere HyperV, 3.10.0-514.44.5.10_96.x86_64 , 3 x P3520 1.8TB Application Data, 3 x P3520 1.8TB Application Data, 1x Intel XC722, FusionSphere 6.3.1, mysql- 5.7.24, sysbench-1.0.6, HT on, Turbo on, test by Huawei/Intel on 1/11/2018. 1.35x GBASE: 1-node, 2x Intel® Xeon® Platinum 8260 cpu on S2600WFT with 768 DDR GB (24 slots / 32GB / 2666) total memory, ucode 0x400000A on CentOS 7.5, 3.10.0-957.1.3.el7.x86_64, 1x Intel 400GB SSD OS Drive, 1x Intel XC722, Gbase 8m 6.3.2 OCS Benchmark, HT on, Turbo on, test by GBASE/Intel on 2/19/2019. 1-node, 2x Intel® Xeon® Platinum 8260 cpu on S2600WFT with 192 DDR + 1024 Intel DCPMM GB (12 slots / 16 GB / 2666 DDR + 8 slots / 128 GB / 2666 Intel DCPMM) total memory, ucode 0x400000A on CentOS 7.5, 3.10.0-957.1.3.el7.x86_64, 1x Intel 400GB SSD OS Drive, 1x Intel XC722, Gbase 8m 6.3.2 OCS Benchmark, HT on, Turbo on, test by GBASE/Intel on 2/19/2019. 2x Nokia* SDWAN: Configuration #1 (With Intel® QuickAssist® Technology): 2x Intel® Xeon® Gold 5218N Processor on Neon City Platform with 192 GB total memory (12 slots / 16GB / DDR4 2667MHz), ucode 0x4000019, Bios: PLYXCRB 1.86B.0568.D10.1901032132, uCode: 0x4000019 on CentOS 7.5 with Kernel 3.10.0-862, KVM Hypervisor; 1x Intel® QuickAssist Adapter 8970, Cipher: AES-128 SHA-256; Intel® Ethernet Converged Network Adapter X520-SR2; Application: Nokia Nuage SDWAN NSGv 5.3.3U3. Configuration # 2: 2x Intel® Xeon® Gold 5118 Processor on Neon City Platform with 192 GB total memory (12 slots / 16GB / DDR4 2667MHz), ucode 0x4000019, Bios: PLYXCRB 1.86B.0568.D10.1901032132, uCode: 0x4000019 on CentOS 7.5 with Kernel 3.10.0-862, KVM Hypervisor; Intel® Ethernet Converged Network Adapter X520-SR2; Application: Nokia Nuage SDWAN NSGv 5.3.3U3. Results recorded by Intel on 2/14/2018 in collaborate with Nokia. 3.26x latency reduction for Tencent* Cloud Video Analysis: Tested by Tencent as of 1/14/2019. 2 socket Intel® Xeon® Gold Processor, 24 cores HT On Turbo ON Total Memory 192 GB (12 slots/ 16GB/ 2666 MHz), CentOS 7.6 3.10.0-957.el7.x86_64, Compiler: gcc 4.8.5, Deep Learning Framework: Intel® Optimizations for Caffe v1.1.3, Topology: modified inception v3, Tencent’s private dataset, BS=1. Comparing performance on same system with FP32 vs INT8 w/ Intel® DL Boost 3x Fortinet* Fortigate*: Configuration #1 (With Intel® QuickAssist Technology) 2x Intel® Xeon® Gold E5-6230N Processor on Neon City Platform with 192 GB total memory (12 slots / 16GB / DDR4 2933MHz), ucode 0x4000019, Bios: PLYXCRB 1.86B.0568.D10.1901032132, uCode: 0x4000019 on CentOS 7.5 with Kernel 3.10.0-862, KVM Hypervisor; 1 x Intel® QuickAssist Adapter 8970, IPSec AES128-SHA256; 1 x Dual Port 40GbE Intel® Ethernet Network Adapter XL710; Application: FortiGate VM64- KVM (v.6.2.0 interim build). Configuration #2 (Without Intel® QuickAssist Technology) : 2x Intel® Xeon® Gold E5-6230N Processor on Neon City Platform with 192 GB total memory (12 slots / 16GB / DDR4 2933MHz), ucode 0x4000019, Bios: PLYXCRB 1.86B.0568.D10.1901032132, uCode: 0x4000019 on CentOS 7.5 with Kernel 3.10.0-862, KVM Hypervisor; 1 x Dual Port 40GbE Intel® Ethernet Network Adapter XL710; Application: FortiGate VM64-KVM (v.6.2.0 interim build). Results recorded by Intel and reviewed by Fortinet on 3/27/2018. Up to 8X more VMs when running Redis with 8X memory capacity: 1-node, 2x Intel Xeon Platinum 8276 cpu on Intel reference platform with 768 GB (12 slots / 32GB / 2666) total memory, BIOS PLYXCRB1.86B.0573.D10.1901300453 on Fedora-27, 4.20.4- 200.fc29.x86_64, 2x40G, Redis 4.0.11, memtier_benchmark-1.2.12 (80/20 read/write); 1K record size, KVM, 1/VM, centos-7.0, HT on, Turbo on, test by Intel on 2/22/2019. 1-node, 2x Intel Xeon Platinum 8276 cpu on Intel reference platform with 192 + 6144 GB (12 slots / 16GB / 2666 DDR + 12 slots / 512GB/ 2666 Intel Optance DCPMM) total memory, BIOS PLYXCRB1.86B.0573.D10.1901300453 on Fedora-27, 4.20.4-200.fc29.x86_64, 2x40G, Redis 4.0.11, memtier_benchmark-1.2.12 (80/20 read/write); 1K record size, KVM, 1/VM, centos-7.0, Memory mode, HT on, Turbo on, test by Intel on 2/22/2019.

Configuration Disclosure Intel® Deep Learning Boost th 1x inference throughput baseline on Intel® Xeon® Platinum 8180 processor (July 2017) : Tested by Intel as of July 11 2017: Platform: 2S Intel® Xeon® Platinum 8180 CPU @ 2.50GHz (28 cores), HT disabled, turbo disabled, scaling governor set to “performance” via intel_pstate driver, 384GB DDR4-2666 ECC RAM. CentOS Linux release 7.3.1611 (Core), Linux kernel 3.10.0-514.10.2.el7.x86_64. SSD: Intel® SSD DC S3700 Series (800GB, 2.5in SATA 6Gb/s, 25nm, MLC).Performance measured with: Environment variables: KMP_AFFINITY='granularity=fine, compact‘, OMP_NUM_THREADS=56, CPU Freq set with cpupower frequency-set -d 2.5G -u 3.8G -g performance. Caffe: (http://github.com/intel/caffe/), revision f96b759f71b2281835f690af267158b82b150b5c. Inference measured with “caffe time --forward_only” command, training measured with “caffe time” command. For “ConvNet” topologies, synthetic dataset was used. For other topologies, data was stored on local storage and cached in memory before training. Topology specs from https://github.com/intel/caffe/tree/master/models/intel_optimized_models (ResNet-50),and https://github.com/soumith/convnet-benchmarks/tree/master/caffe/imagenet_winners (ConvNet benchmarks; files were updated to use newer Caffe prototxt format but are functionally equivalent). Intel C++ compiler ver. 17.0.2 20170213, Intel MKL small libraries version 2018.0.20170425. Caffe run with “numactl -l“. th 5.7x inference throughput improvement on Intel® Xeon® Platinum 8180 processor (December 2018) with continued optimizations : Tested by Intel as of November 11 2018 :2 socket Intel(R) Xeon(R) Platinum 8180 CPU @ 2.50GHz / 28 cores HT ON , Turbo ON Total Memory 376.46GB (12slots / 32 GB / 2666 MHz). CentOS Linux-7.3.1611-Core, kernel: 3.10.0-862.3.3.el7.x86_64, SSD sda RS3WC080 HDD 744.1GB,sdb RS3WC080 HDD 1.5TB,sdc RS3WC080 HDD 5.5TB , Deep Learning Framework Intel® Optimization for caffe version: 551a53d63a6183c233abaa1a19458a25b672ad41 Topology::ResNet_50_v1 BIOS:SE5C620.86B.00.01.0014.070920180847 MKLDNN: 4e333787e0d66a1dca1218e99a891d493dbc8ef1 instances: 2 instances socket:2 (Results on Intel® Xeon® Scalable Processor were measured running multiple instances of the framework. Methodology described here: th https://software.intel.com/en-us/articles/boosting-deep-learning-training-inference-performance-on-xeon-and-xeon-phi) Synthetic data. Datatype: INT8 Batchsize=64 vs Tested by Intel as of July 11 2017:2S Intel® Xeon® Platinum 8180 CPU @ 2.50GHz (28 cores), HT disabled, turbo disabled, scaling governor set to “performance” via intel_pstate driver, 384GB DDR4-2666 ECC RAM. CentOS Linux release 7.3.1611 (Core), Linux kernel 3.10.0- 514.10.2.el7.x86_64. SSD: Intel® SSD DC S3700 Series (800GB, 2.5in SATA 6Gb/s, 25nm, MLC).Performance measured with: Environment variables: KMP_AFFINITY='granularity=fine, compact‘, OMP_NUM_THREADS=56, CPU Freq set with cpupower frequency-set -d 2.5G -u 3.8G -g performance. Caffe: (http://github.com/intel/caffe/), revision f96b759f71b2281835f690af267158b82b150b5c. Inference measured with “caffe time --forward_only” command, training measured with “caffe time” command. For “ConvNet” topologies, synthetic dataset was used. For other topologies, data was stored on local storage and cached in memory before training. Topology specs from https://github.com/intel/caffe/tree/master/models/intel_optimized_models (ResNet-50). Intel C++ compiler ver. 17.0.2 20170213, Intel MKL small libraries version 2018.0.20170425. Caffe run with “numactl -l“. 14x inference throughput improvement on Intel® Xeon® Platinum 8280 processor with Intel® DL Boost: Tested by Intel as of 2/20/2019. 2 socket Intel® Xeon® Platinum 8280 Processor, 28 cores HT On Turbo ON Total Memory 384 GB (12 slots/ 32GB/ 2933 MHz), BIOS: SE5C620.86B.0D.01.0271.120720180605 (ucode: 0x200004d), Ubuntu 18.04.1 LTS, kernel 4.15.0-45-generic, SSD 1x sda INTEL SSDSC2BA80 SSD 745.2GB, nvme1n1 INTEL SSDPE2KX040T7 SSD 3.7TB, Deep Learning Framework: Intel® Optimization for Caffe version: 1.1.3 (commit hash: 7010334f159da247db3fe3a9d96a3116ca06b09a) , ICC version 18.0.1, MKL DNN version: v0.17 (commit hash: 830a10059a018cd2634d94195140cf2d8790a75a, model: https://github.com/intel/caffe/blob/master/models/intel_optimized_models/int8/resnet50_int8_full_conv.prototxt, BS=64, synthetic Data, 4 instance/2 socket, th Datatype: INT8 vs Tested by Intel as of July 11 2017: 2S Intel® Xeon® Platinum 8180 CPU @ 2.50GHz (28 cores), HT disabled, turbo disabled, scaling governor set to “performance” via intel_pstate driver, 384GB DDR4-2666 ECC RAM. CentOS Linux release 7.3.1611 (Core), Linux kernel 3.10.0-514.10.2.el7.x86_64. SSD: Intel® SSD DC S3700 Series (800GB, 2.5in SATA 6Gb/s, 25nm, MLC).Performance measured with: Environment variables: KMP_AFFINITY='granularity=fine, compact‘, OMP_NUM_THREADS=56, CPU Freq set with cpupower frequency-set -d 2.5G -u 3.8G -g performance. Caffe: (http://github.com/intel/caffe/), revision f96b759f71b2281835f690af267158b82b150b5c. Inference measured with “caffe time --forward_only” command, training measured with “caffe time” command. For “ConvNet” topologies, synthetic dataset was used. For other topologies, data was stored on local storage and cached in memory before training. Topology specs from https://github.com/intel/caffe/tree/master/models/intel_optimized_models (ResNet-50),. Intel C++ compiler ver. 17.0.2 20170213, Intel MKL small libraries version 2018.0.20170425. Caffe run with “numactl -l“. 2x More inference throughput improvement on Intel® Xeon® Platinum 9282 processor with Intel® DL Boost : Tested by Intel as of 2/26/2019. Platform: Dragon rock 2 socket Intel® Xeon® Platinum 9282(56 cores per socket), HT ON, turbo ON, Total Memory 768 GB (24 slots/ 32 GB/ 2933 MHz), BIOS:SE5C620.86B.0D.01.0241.112020180249, Centos 7 Kernel 3.10.0-957.5.1.el7.x86_64, Deep Learning Framework: Intel® Optimization for Caffe version: https://github.com/intel/caffe d554cbf1, ICC 2019.2.187, MKL DNN version: v0.17 (commit hash: 830a10059a018cd2634d94195140cf2d8790a75a), model: https://github.com/intel/caffe/blob/master/models/intel_optimized_models/int8/resnet50_int8_full_conv.prototxt, BS=64, No datalayer syntheticData:3x224x224, 56 instance/2 socket, Datatype: INT8 vs Tested by Intel as of th July 11 2017: 2S Intel® Xeon® Platinum 8180 CPU @ 2.50GHz (28 cores), HT disabled, turbo disabled, scaling governor set to “performance” via intel_pstate driver, 384GB DDR4-2666 ECC RAM. CentOS Linux release 7.3.1611 (Core), Linux kernel 3.10.0-514.10.2.el7.x86_64. SSD: Intel® SSD DC S3700 Series (800GB, 2.5in SATA 6Gb/s, 25nm, MLC).Performance measured with: Environment variables: KMP_AFFINITY='granularity=fine, compact‘, OMP_NUM_THREADS=56, CPU Freq set with cpupower frequency-set -d 2.5G -u 3.8G -g performance. Caffe: (http://github.com/intel/caffe/), revision f96b759f71b2281835f690af267158b82b150b5c. Inference measured with “caffe time --forward_only” command, training measured with “caffe time” command. For “ConvNet” topologies, synthetic dataset was used. For other topologies, data was stored on local storage and cached in memory before training. Topology specs from https://github.com/intel/caffe/tree/master/models/intel_optimized_models (ResNet-50),. Intel C++ compiler ver. 17.0.2 20170213, Intel MKL small libraries version 2018.0.20170425. Caffe run with “numactl -l“. Configuration Disclosure Intel® Deep Learning Boost th 1x inference throughput baseline on Intel® Xeon® Platinum 8180 processor (July 2017) : Tested by Intel as of July 11 2017: Platform: 2S Intel® Xeon® Platinum 8180 CPU @ 2.50GHz (28 cores), HT disabled, turbo disabled, scaling governor set to “performance” via intel_pstate driver, 384GB DDR4-2666 ECC RAM. CentOS Linux release 7.3.1611 (Core), Linux kernel 3.10.0-514.10.2.el7.x86_64. SSD: Intel® SSD DC S3700 Series (800GB, 2.5in SATA 6Gb/s, 25nm, MLC).Performance measured with: Environment variables: KMP_AFFINITY='granularity=fine, compact‘, OMP_NUM_THREADS=56, CPU Freq set with cpupower frequency-set -d 2.5G -u 3.8G -g performance. Caffe: (http://github.com/intel/caffe/), revision f96b759f71b2281835f690af267158b82b150b5c. Inference measured with “caffe time --forward_only” command, training measured with “caffe time” command. For “ConvNet” topologies, synthetic dataset was used. For other topologies, data was stored on local storage and cached in memory before training. Topology specs from https://github.com/intel/caffe/tree/master/models/intel_optimized_models (ResNet-50),and https://github.com/soumith/convnet-benchmarks/tree/master/caffe/imagenet_winners (ConvNet benchmarks; files were updated to use newer Caffe prototxt format but are functionally equivalent). Intel C++ compiler ver. 17.0.2 20170213, Intel MKL small libraries version 2018.0.20170425. Caffe run with “numactl -l“. th 5.7x inference throughput improvement on Intel® Xeon® Platinum 8180 processor (December 2018) with continued optimizations : Tested by Intel as of November 11 2018 :2 socket Intel(R) Xeon(R) Platinum 8180 CPU @ 2.50GHz / 28 cores HT ON , Turbo ON Total Memory 376.46GB (12slots / 32 GB / 2666 MHz). CentOS Linux-7.3.1611-Core, kernel: 3.10.0-862.3.3.el7.x86_64, SSD sda RS3WC080 HDD 744.1GB,sdb RS3WC080 HDD 1.5TB,sdc RS3WC080 HDD 5.5TB , Deep Learning Framework Intel® Optimization for caffe version: 551a53d63a6183c233abaa1a19458a25b672ad41 Topology::ResNet_50_v1 BIOS:SE5C620.86B.00.01.0014.070920180847 MKLDNN: 4e333787e0d66a1dca1218e99a891d493dbc8ef1 instances: 2 instances socket:2 (Results on Intel® Xeon® Scalable Processor were measured running multiple instances of the framework. Methodology described here: th https://software.intel.com/en-us/articles/boosting-deep-learning-training-inference-performance-on-xeon-and-xeon-phi) Synthetic data. Datatype: INT8 Batchsize=64 vs Tested by Intel as of July 11 2017:2S Intel® Xeon® Platinum 8180 CPU @ 2.50GHz (28 cores), HT disabled, turbo disabled, scaling governor set to “performance” via intel_pstate driver, 384GB DDR4-2666 ECC RAM. CentOS Linux release 7.3.1611 (Core), Linux kernel 3.10.0- 514.10.2.el7.x86_64. SSD: Intel® SSD DC S3700 Series (800GB, 2.5in SATA 6Gb/s, 25nm, MLC).Performance measured with: Environment variables: KMP_AFFINITY='granularity=fine, compact‘, OMP_NUM_THREADS=56, CPU Freq set with cpupower frequency-set -d 2.5G -u 3.8G -g performance. Caffe: (http://github.com/intel/caffe/), revision f96b759f71b2281835f690af267158b82b150b5c. Inference measured with “caffe time --forward_only” command, training measured with “caffe time” command. For “ConvNet” topologies, synthetic dataset was used. For other topologies, data was stored on local storage and cached in memory before training. Topology specs from https://github.com/intel/caffe/tree/master/models/intel_optimized_models (ResNet-50). Intel C++ compiler ver. 17.0.2 20170213, Intel MKL small libraries version 2018.0.20170425. Caffe run with “numactl -l“. 14x inference throughput improvement on Intel® Xeon® Platinum 8280 processor with Intel® DL Boost: Tested by Intel as of 2/20/2019. 2 socket Intel® Xeon® Platinum 8280 Processor, 28 cores HT On Turbo ON Total Memory 384 GB (12 slots/ 32GB/ 2933 MHz), BIOS: SE5C620.86B.0D.01.0271.120720180605 (ucode: 0x200004d), Ubuntu 18.04.1 LTS, kernel 4.15.0-45-generic, SSD 1x sda INTEL SSDSC2BA80 SSD 745.2GB, nvme1n1 INTEL SSDPE2KX040T7 SSD 3.7TB, Deep Learning Framework: Intel® Optimization for Caffe version: 1.1.3 (commit hash: 7010334f159da247db3fe3a9d96a3116ca06b09a) , ICC version 18.0.1, MKL DNN version: v0.17 (commit hash: 830a10059a018cd2634d94195140cf2d8790a75a, model: https://github.com/intel/caffe/blob/master/models/intel_optimized_models/int8/resnet50_int8_full_conv.prototxt, BS=64, synthetic Data, 4 instance/2 socket, th Datatype: INT8 vs Tested by Intel as of July 11 2017: 2S Intel® Xeon® Platinum 8180 CPU @ 2.50GHz (28 cores), HT disabled, turbo disabled, scaling governor set to “performance” via intel_pstate driver, 384GB DDR4-2666 ECC RAM. CentOS Linux release 7.3.1611 (Core), Linux kernel 3.10.0-514.10.2.el7.x86_64. SSD: Intel® SSD DC S3700 Series (800GB, 2.5in SATA 6Gb/s, 25nm, MLC).Performance measured with: Environment variables: KMP_AFFINITY='granularity=fine, compact‘, OMP_NUM_THREADS=56, CPU Freq set with cpupower frequency-set -d 2.5G -u 3.8G -g performance. Caffe: (http://github.com/intel/caffe/), revision f96b759f71b2281835f690af267158b82b150b5c. Inference measured with “caffe time --forward_only” command, training measured with “caffe time” command. For “ConvNet” topologies, synthetic dataset was used. For other topologies, data was stored on local storage and cached in memory before training. Topology specs from https://github.com/intel/caffe/tree/master/models/intel_optimized_models (ResNet-50),. Intel C++ compiler ver. 17.0.2 20170213, Intel MKL small libraries version 2018.0.20170425. Caffe run with “numactl -l“. 2x More inference throughput improvement on Intel® Xeon® Platinum 9282 processor with Intel® DL Boost : Tested by Intel as of 2/26/2019. Platform: Dragon rock 2 socket Intel® Xeon® Platinum 9282(56 cores per socket), HT ON, turbo ON, Total Memory 768 GB (24 slots/ 32 GB/ 2933 MHz), BIOS:SE5C620.86B.0D.01.0241.112020180249, Centos 7 Kernel 3.10.0-957.5.1.el7.x86_64, Deep Learning Framework: Intel® Optimization for Caffe version: https://github.com/intel/caffe d554cbf1, ICC 2019.2.187, MKL DNN version: v0.17 (commit hash: 830a10059a018cd2634d94195140cf2d8790a75a), model: https://github.com/intel/caffe/blob/master/models/intel_optimized_models/int8/resnet50_int8_full_conv.prototxt, BS=64, No datalayer syntheticData:3x224x224, 56 instance/2 socket, Datatype: INT8 vs Tested by Intel as of th July 11 2017: 2S Intel® Xeon® Platinum 8180 CPU @ 2.50GHz (28 cores), HT disabled, turbo disabled, scaling governor set to “performance” via intel_pstate driver, 384GB DDR4-2666 ECC RAM. CentOS Linux release 7.3.1611 (Core), Linux kernel 3.10.0-514.10.2.el7.x86_64. SSD: Intel® SSD DC S3700 Series (800GB, 2.5in SATA 6Gb/s, 25nm, MLC).Performance measured with: Environment variables: KMP_AFFINITY='granularity=fine, compact‘, OMP_NUM_THREADS=56, CPU Freq set with cpupower frequency-set -d 2.5G -u 3.8G -g performance. Caffe: (http://github.com/intel/caffe/), revision f96b759f71b2281835f690af267158b82b150b5c. Inference measured with “caffe time --forward_only” command, training measured with “caffe time” command. For “ConvNet” topologies, synthetic dataset was used. For other topologies, data was stored on local storage and cached in memory before training. Topology specs from https://github.com/intel/caffe/tree/master/models/intel_optimized_models (ResNet-50),. Intel C++ compiler ver. 17.0.2 20170213, Intel MKL small libraries version 2018.0.20170425. Caffe run with “numactl -l“.
Software and workloads used in performance tests may have been optimized for performance only on Intel microprocessors. Performance tests, such as SYSmark and MobileMark, are measured using specific computer systems, components, software, operations and functions. Any change to any of those factors may cause the results to vary. You should consult other information and performance tests to assist you in fully evaluating your contemplated purchases, including the performance of that product when combined with other products. For more information go to www.intel.com/benchmarks. Performance results are based on testing as of date specified in the Configuration Disclosure and may not reflect all publicly available security updates. See configuration disclosure for details. No product or component can be absolutely secure. Optimization Notice: Intel's compilers may or may not optimize to the same degree for non-Intel microprocessors for optimizations that are not unique to Intel microprocessors. These optimizations include SSE2, SSE3, and SSSE3 instruction sets and other optimizations. Intel does not guarantee the availability, functionality, or effectiveness of any optimization on microprocessors not manufactured by Intel. Microprocessor- dependent optimizations in this product are intended for use with Intel microprocessors. Certain optimizations not specific to Intel microarchitecture are reserved for Intel microprocessors. Please refer to the applicable product User and Reference Guides for more information regarding the specific instruction sets covered by this notice. Intel technologies’ features and benefits depend on system configuration and may require enabled hardware, software or service activation. Performance varies depending on system configuration. Check with your system manufacturer or retailer or learn more at intel.com. Intel, the Intel logo, EyeQ, Intel Agilex, Intel Atom, Intel Nervana, Intel Optane, Mobileye, Movidius, OpenVINO, Stratix, Xeon are trademarks of Intel Corporation or its subsidiaries in the U.S. and/or other countries. *Other names and brands may be claimed as the property of others. © Intel Corporation.Software and workloads used in performance tests may have been optimized for performance only on Intel microprocessors. Performance tests, such as SYSmark and MobileMark, are measured using specific computer systems, components, software, operations and functions. Any change to any of those factors may cause the results to vary. You should consult other information and performance tests to assist you in fully evaluating your contemplated purchases, including the performance of that product when combined with other products. For more information go to www.intel.com/benchmarks. Performance results are based on testing as of date specified in the Configuration Disclosure and may not reflect all publicly available security updates. See configuration disclosure for details. No product or component can be absolutely secure. Optimization Notice: Intel's compilers may or may not optimize to the same degree for non-Intel microprocessors for optimizations that are not unique to Intel microprocessors. These optimizations include SSE2, SSE3, and SSSE3 instruction sets and other optimizations. Intel does not guarantee the availability, functionality, or effectiveness of any optimization on microprocessors not manufactured by Intel. Microprocessor- dependent optimizations in this product are intended for use with Intel microprocessors. Certain optimizations not specific to Intel microarchitecture are reserved for Intel microprocessors. Please refer to the applicable product User and Reference Guides for more information regarding the specific instruction sets covered by this notice. Intel technologies’ features and benefits depend on system configuration and may require enabled hardware, software or service activation. Performance varies depending on system configuration. Check with your system manufacturer or retailer or learn more at intel.com. Intel, the Intel logo, EyeQ, Intel Agilex, Intel Atom, Intel Nervana, Intel Optane, Mobileye, Movidius, OpenVINO, Stratix, Xeon are trademarks of Intel Corporation or its subsidiaries in the U.S. and/or other countries. *Other names and brands may be claimed as the property of others. © Intel Corporation.

Exhibit 99.4 Gregory Bryant SENIOR VICE PRESIDENT GENERAL MANAGER, CLIENT COMPUTING GROUPExhibit 99.4 Gregory Bryant SENIOR VICE PRESIDENT GENERAL MANAGER, CLIENT COMPUTING GROUP

Statements in this presentation that refer to business outlook, future plans and expectations are forward-looking statements that involve a number of risks and uncertainties. Words such as anticipates, expects, intends, goals, plans, believes, seeks, estimates, continues, may, will, “would,” should, “could,” and variations of such words and similar expressions are intended to identify such forward-looking statements. Statements that refer to or are based on estimates, forecasts, projections, uncertain events or assumptions, including statements relating to total addressable market (TAM) or market opportunity, future products and the expected availability and benefits of such products, and anticipated trends in our businesses or the markets relevant to them, also identify forward-looking statements. Such statements are based on management's expectations as of May 8, 2019, unless an earlier date is indicated, and involve many risks and uncertainties that could cause actual results to differ materially from those expressed or implied in these forward-looking statements. Important factors that could cause actual results to differ materially from the company's expectations are set forth in Intel's earnings release dated April 25, 2019, which is included as an exhibit to Intel’s Form 8-K furnished to the SEC on such date. Additional information regarding these and other factors that could affect Intel's results is included in Intel's SEC filings, including the company's most recent reports on Forms 10-K and 10-Q. Copies of Intel's Form 10-K, 10-Q and 8-K reports may be obtained by visiting our Investor Relations website at www.intc.com or the SEC's website at www.sec.gov. All information in this presentation reflects management’s views as of May 8, 2019, unless an earlier date is indicated. Intel does not undertake, and expressly disclaims any duty, to update any statement made in this presentation, whether as a result of new information, new developments or otherwise, except to the extent that disclosure may be required by law.Statements in this presentation that refer to business outlook, future plans and expectations are forward-looking statements that involve a number of risks and uncertainties. Words such as anticipates, expects, intends, goals, plans, believes, seeks, estimates, continues, may, will, “would,” should, “could,” and variations of such words and similar expressions are intended to identify such forward-looking statements. Statements that refer to or are based on estimates, forecasts, projections, uncertain events or assumptions, including statements relating to total addressable market (TAM) or market opportunity, future products and the expected availability and benefits of such products, and anticipated trends in our businesses or the markets relevant to them, also identify forward-looking statements. Such statements are based on management's expectations as of May 8, 2019, unless an earlier date is indicated, and involve many risks and uncertainties that could cause actual results to differ materially from those expressed or implied in these forward-looking statements. Important factors that could cause actual results to differ materially from the company's expectations are set forth in Intel's earnings release dated April 25, 2019, which is included as an exhibit to Intel’s Form 8-K furnished to the SEC on such date. Additional information regarding these and other factors that could affect Intel's results is included in Intel's SEC filings, including the company's most recent reports on Forms 10-K and 10-Q. Copies of Intel's Form 10-K, 10-Q and 8-K reports may be obtained by visiting our Investor Relations website at www.intc.com or the SEC's website at www.sec.gov. All information in this presentation reflects management’s views as of May 8, 2019, unless an earlier date is indicated. Intel does not undertake, and expressly disclaims any duty, to update any statement made in this presentation, whether as a result of new information, new developments or otherwise, except to the extent that disclosure may be required by law.
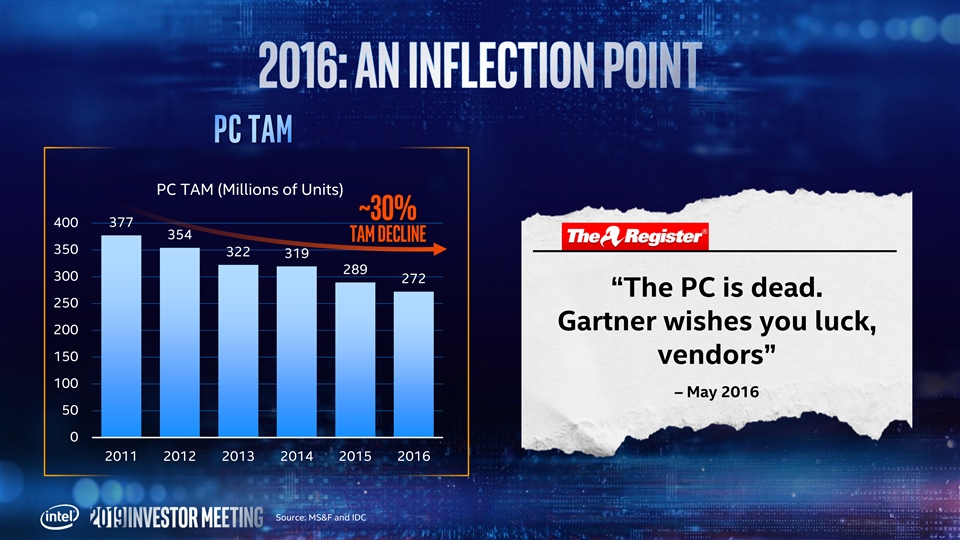
PC TAM (Millions of Units) ~30% 400 377 354 TAM decline 350 322 319 289 300 272 “The PC is dead. 250 Gartner wishes you luck, 200 150 vendors” 100 – May 2016 50 0 2011 2012 2013 2014 2015 2016 Source: MS&F and IDC PC TAM (Millions of Units) ~30% 400 377 354 TAM decline 350 322 319 289 300 272 “The PC is dead. 250 Gartner wishes you luck, 200 150 vendors” 100 – May 2016 50 0 2011 2012 2013 2014 2015 2016 Source: MS&F and IDC
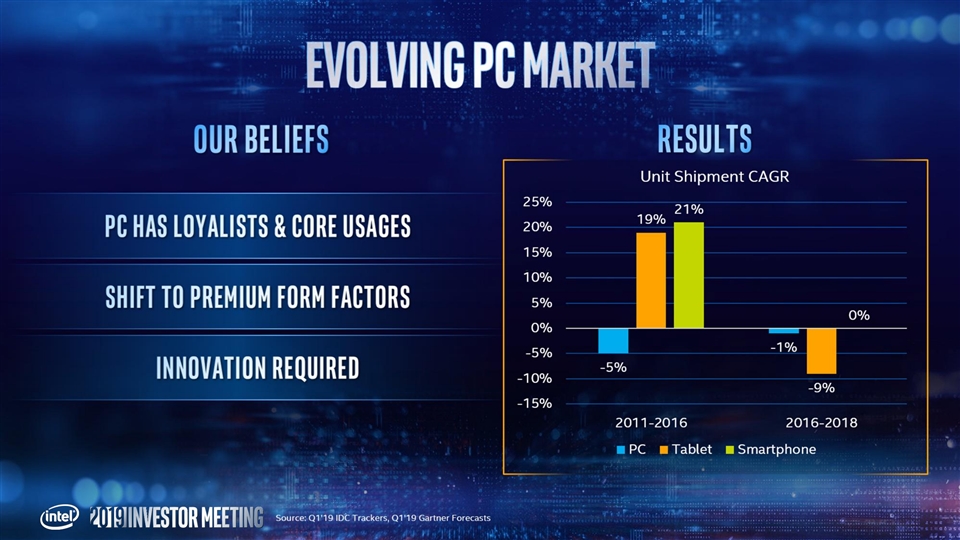

$40 B MARKET STABILIZING $37 300 Mu $34 $32.9 $32.2 PC TAM $30 DELIVERED 3 YEARS OF TOP & BOTTOM LINE GROWTH 280 $20 MANUFACTURING AND IP R&D SCALE $14.2 $12.9 260 $10.6 $8.2 $10 2019 PC-CENTRIC REVENUE DOWN LOW SINGLE DIGITS YOY 240 $0 2015 2016 2017 2018 CONSTRAINED SUPPLY Revenue OI & COMPETITIVE ENVIRONMENT Source: PC TAM MS&F and IDC $40 B MARKET STABILIZING $37 300 Mu $34 $32.9 $32.2 PC TAM $30 DELIVERED 3 YEARS OF TOP & BOTTOM LINE GROWTH 280 $20 MANUFACTURING AND IP R&D SCALE $14.2 $12.9 260 $10.6 $8.2 $10 2019 PC-CENTRIC REVENUE DOWN LOW SINGLE DIGITS YOY 240 $0 2015 2016 2017 2018 CONSTRAINED SUPPLY Revenue OI & COMPETITIVE ENVIRONMENT Source: PC TAM MS&F and IDC

20% ~18% ~14% ~11% 10% ~4% 0% (~1%) (~3%) -10% (~11%) SEGMENTs in decline Segments of growth -20% 18 - '23 Intel Revenue CAGR Shifted focus: premium, PURPOSE -BUILT products Source: 2018-’23 Intel Revenue CAGR based on Intel Internal forecast 20% ~18% ~14% ~11% 10% ~4% 0% (~1%) (~3%) -10% (~11%) SEGMENTs in decline Segments of growth -20% 18 - '23 Intel Revenue CAGR Shifted focus: premium, PURPOSE -BUILT products Source: 2018-’23 Intel Revenue CAGR based on Intel Internal forecast
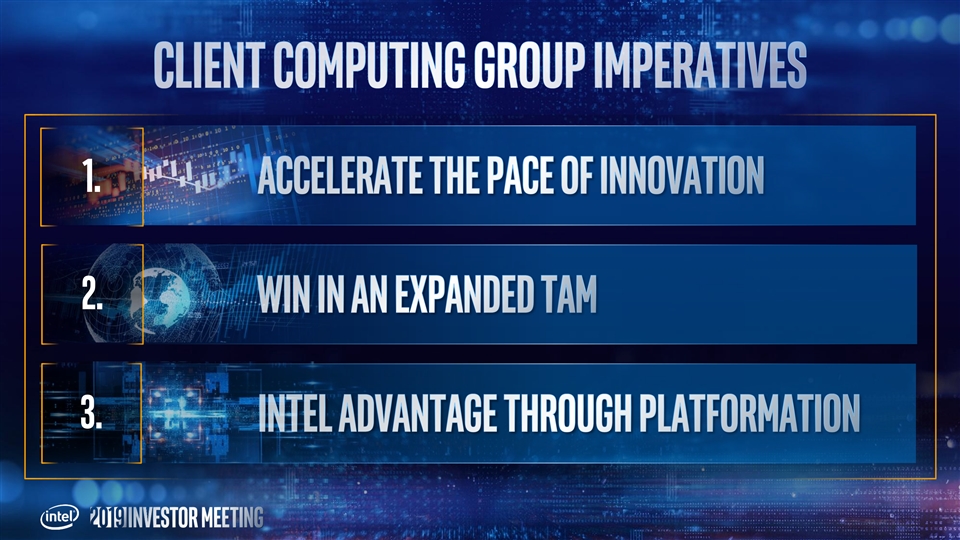
1. 2. 3.1. 2. 3.

1. Unmatched leadership portfolio1. Unmatched leadership portfolio

1. 20 19 2019 2020 NEW CPU CORE ARCHITECTURE HYBRID CPU ARCHITECTURE NEW CPU CORE ARCHITECTURE e NEW GEN 11 GRAPHICS ENGINE 3D FOVEROS PACKAGING NEW X GRAPHICS ENGINE ST 1 INTEGRATED WIFI6 (11AX) / NEW GEN 11 GRAPHICS ENGINE LATEST DISPLAY TECHNOLOGY THUNDERBOLT™ 3 OpenVINO / DL BOOST IMPROVED STANDBY SOC POWER NEXT GEN I/O TECHNOLOGY A new level of Enabling revolutionary Mobility Redefined Integr ation new form factors1. 20 19 2019 2020 NEW CPU CORE ARCHITECTURE HYBRID CPU ARCHITECTURE NEW CPU CORE ARCHITECTURE e NEW GEN 11 GRAPHICS ENGINE 3D FOVEROS PACKAGING NEW X GRAPHICS ENGINE ST 1 INTEGRATED WIFI6 (11AX) / NEW GEN 11 GRAPHICS ENGINE LATEST DISPLAY TECHNOLOGY THUNDERBOLT™ 3 OpenVINO / DL BOOST IMPROVED STANDBY SOC POWER NEXT GEN I/O TECHNOLOGY A new level of Enabling revolutionary Mobility Redefined Integr ation new form factors

1. Wireless 1 Speeds Productivity in 4 slim Form Factors Graphics 2 performance ENCODE 5 performance 3 AI Performance * Approximate Disclaimer: Results are approximate and have been estimated or simulated as of April 2019 using Intel internal analysis or architecture simulation or modeling 1) Intel’s Wi-Fi 6 (GIG+) vs typical competitive 11AC design 4) 5W AML 2+2 vs 9W TGL 4+2 projections 2) 15W WHL to 25W TGL (projections) 5) WHL 4K60 to TGL 8K60 projections 3) AIXPRT Community 2 Preview; OpenVINO 2018.R5, Max Throughput 15W WHL to 15W ICL projection For more complete information about performance and benchmark results, visit www.intel.com/benchmarks. Performance results are based on testing as of date specified and may not reflect all publicly available security updates. See configuration disclosure for details. No product or component can be absolutely secure.1. Wireless 1 Speeds Productivity in 4 slim Form Factors Graphics 2 performance ENCODE 5 performance 3 AI Performance * Approximate Disclaimer: Results are approximate and have been estimated or simulated as of April 2019 using Intel internal analysis or architecture simulation or modeling 1) Intel’s Wi-Fi 6 (GIG+) vs typical competitive 11AC design 4) 5W AML 2+2 vs 9W TGL 4+2 projections 2) 15W WHL to 25W TGL (projections) 5) WHL 4K60 to TGL 8K60 projections 3) AIXPRT Community 2 Preview; OpenVINO 2018.R5, Max Throughput 15W WHL to 15W ICL projection For more complete information about performance and benchmark results, visit www.intel.com/benchmarks. Performance results are based on testing as of date specified and may not reflect all publicly available security updates. See configuration disclosure for details. No product or component can be absolutely secure.

2. 2023 $39 $7 $6 $10 $6 ~$68B TAM TAM Platforms Graphics Intel Share Connectivity Memory PC & adjacencies dGFX MEMORY CPU CONNECTIVITY GATEWAY opportunity to grow beyond The cpu TAM Source: Intel calculated 2023 TAM derived from industry analyst reports/internal estimates and 2018 Intel revenue 2. 2023 $39 $7 $6 $10 $6 ~$68B TAM TAM Platforms Graphics Intel Share Connectivity Memory PC & adjacencies dGFX MEMORY CPU CONNECTIVITY GATEWAY opportunity to grow beyond The cpu TAM Source: Intel calculated 2023 TAM derived from industry analyst reports/internal estimates and 2018 Intel revenue

2. FIRST TO PC MARKET INTEL® OPTANE™ MEMORY WITH WI-FI6 LEADER IN INTEGRATED GFX SHIPPED IN 2018 (Discrete & Integrated) INTEL® OPTANE™ MEMORY NEW INDUSTRY STANDARD H10 WITH SOLID-STATE GEN 11 LAUNCHING IN 2019 WITH THUNDERBOLT™ 3 STORAGE LAUNCHED APRIL e PERSISTENT MEMORY ON NEW X ARCHITECTURE ACPC/LTE MARKET LEADER WORKSTATIONS 2H’19 IN 2020 Lau nch gam es Nearly 3x Accelerating graphics 1 2 up to 60 % f as ter faster speeds performance 1) Optane – based on 8th Gen Intel U with Optane Memory H10 2) Wireless- Intel’s Wi-FI 6 (Gig+) vs, typical 11AC design For more complete information about performance and benchmark results, visit www.intel.com/benchmarks. Performance results are based on testing as of date specified and may not reflect all publicly available security updates. See configuration disclosure for details. No product or component can be absolutely secure.2. FIRST TO PC MARKET INTEL® OPTANE™ MEMORY WITH WI-FI6 LEADER IN INTEGRATED GFX SHIPPED IN 2018 (Discrete & Integrated) INTEL® OPTANE™ MEMORY NEW INDUSTRY STANDARD H10 WITH SOLID-STATE GEN 11 LAUNCHING IN 2019 WITH THUNDERBOLT™ 3 STORAGE LAUNCHED APRIL e PERSISTENT MEMORY ON NEW X ARCHITECTURE ACPC/LTE MARKET LEADER WORKSTATIONS 2H’19 IN 2020 Lau nch gam es Nearly 3x Accelerating graphics 1 2 up to 60 % f as ter faster speeds performance 1) Optane – based on 8th Gen Intel U with Optane Memory H10 2) Wireless- Intel’s Wi-FI 6 (Gig+) vs, typical 11AC design For more complete information about performance and benchmark results, visit www.intel.com/benchmarks. Performance results are based on testing as of date specified and may not reflect all publicly available security updates. See configuration disclosure for details. No product or component can be absolutely secure.

3. mobile innovation rooted in human understanding Focus Always Ready Adaptable3. mobile innovation rooted in human understanding Focus Always Ready Adaptable


Performance results are based on testing as of dates shown in configuration and may not reflect all publicly available security updates. See configuration disclosure for details. No product or component can be absolutely secure. Software and workloads used in performance tests may have been optimized for performance only on Intel microprocessors. Performance tests, such as SYSmark and MobileMark, are measured using specific computer systems, components, software, operations and functions. Any change to any of those factors may cause the results to vary. You should consult other information and performance tests to assist you in fully evaluating your contemplated purchases, including the performance of that product when combined with other products. For more complete information visit www.intel.com/benchmarks. Approx. 3x Wireless Speeds: 802.11ax 2x2 160MHz enables 2402Mbps maximum theoretical data rates, ~3X (2.8X) faster than standard 802.11ac 2x2 80MHz (867Mbps) as documented in IEEE 802.11 wireless standard specifications, and require the use of similarly configured 802.11ax wireless network routers. Approx. 4x Graphics Performance: Estimated by Intel as of April 2019, based on the 3DMark 11 and Firestrike scores of TGL U42 96EU 15W as compared to WHL U42 24EU 15W. Approx. 2.5x-3x AI Performance: Workload: images per second using AIXPRT Community Preview 2 with Int8 precision on ResNet-50 and SSD-Mobilenet-v1 models. Intel preproduction system, ICL-U, PL1 15w, 4C/8T, Turbo TBD, Intel Gen11 Graphics, GFX driver preproduction, Memory 8GB LPDDR4X-3733, Storage Intel SSD Pro 760P 256GB, OS Microsoft Windows 10, RS5 Build 475, preprod bios. Vs. Config – HP spectre x360 13t 13-ap0038nr, Intel® Core™ i7-8565U, PL1 20w, 4C/8T, Turbo up to 4.6Ghz, Intel UHD Graphics 620, Gfx driver 26.20.100.6709, Memory 16GB DDR4-2400, Storage Intel SSD 760p 512GB, OS – Microsoft Windows 10 RS5 Build 475 Bios F.26. Estimated as of April 2019. Approx. 2x Productivity in Slim Form Factors: Estimated by Intel as of April 2019, based on SYSmark 2014 (overall score) of AML Y-5W 2+2 SKL 14nm i7-8500Y as compared to TGL Y-9W 4+2 WLC 10nm. Approx. 4x Encode Performance: Estimated by Intel as of April 2019 between WHL 4K60 and TGL 8K60. Launch Games up to 60% Faster: Testing by Intel as of March 22nd, 2019. As measured by Path of Exile* Game Launch with Background Activity (e.g. 18GB Video File Copy), comparing 8th Gen Intel® Core™ i7-8565U (512GB TLC SSD) vs. 8th Gen Intel® Core™ i7-8565U (32GB+512GB Intel® Optane™ memory H10 with solid state storage) Performance results are based on testing as of dates shown in configuration and may not reflect all publicly available security updates. See configuration disclosure for details. No product or component can be absolutely secure. Software and workloads used in performance tests may have been optimized for performance only on Intel microprocessors. Performance tests, such as SYSmark and MobileMark, are measured using specific computer systems, components, software, operations and functions. Any change to any of those factors may cause the results to vary. You should consult other information and performance tests to assist you in fully evaluating your contemplated purchases, including the performance of that product when combined with other products. For more complete information visit www.intel.com/benchmarks. Approx. 3x Wireless Speeds: 802.11ax 2x2 160MHz enables 2402Mbps maximum theoretical data rates, ~3X (2.8X) faster than standard 802.11ac 2x2 80MHz (867Mbps) as documented in IEEE 802.11 wireless standard specifications, and require the use of similarly configured 802.11ax wireless network routers. Approx. 4x Graphics Performance: Estimated by Intel as of April 2019, based on the 3DMark 11 and Firestrike scores of TGL U42 96EU 15W as compared to WHL U42 24EU 15W. Approx. 2.5x-3x AI Performance: Workload: images per second using AIXPRT Community Preview 2 with Int8 precision on ResNet-50 and SSD-Mobilenet-v1 models. Intel preproduction system, ICL-U, PL1 15w, 4C/8T, Turbo TBD, Intel Gen11 Graphics, GFX driver preproduction, Memory 8GB LPDDR4X-3733, Storage Intel SSD Pro 760P 256GB, OS Microsoft Windows 10, RS5 Build 475, preprod bios. Vs. Config – HP spectre x360 13t 13-ap0038nr, Intel® Core™ i7-8565U, PL1 20w, 4C/8T, Turbo up to 4.6Ghz, Intel UHD Graphics 620, Gfx driver 26.20.100.6709, Memory 16GB DDR4-2400, Storage Intel SSD 760p 512GB, OS – Microsoft Windows 10 RS5 Build 475 Bios F.26. Estimated as of April 2019. Approx. 2x Productivity in Slim Form Factors: Estimated by Intel as of April 2019, based on SYSmark 2014 (overall score) of AML Y-5W 2+2 SKL 14nm i7-8500Y as compared to TGL Y-9W 4+2 WLC 10nm. Approx. 4x Encode Performance: Estimated by Intel as of April 2019 between WHL 4K60 and TGL 8K60. Launch Games up to 60% Faster: Testing by Intel as of March 22nd, 2019. As measured by Path of Exile* Game Launch with Background Activity (e.g. 18GB Video File Copy), comparing 8th Gen Intel® Core™ i7-8565U (512GB TLC SSD) vs. 8th Gen Intel® Core™ i7-8565U (32GB+512GB Intel® Optane™ memory H10 with solid state storage)
Software and workloads used in performance tests may have been optimized for performance only on Intel microprocessors. Performance tests, such as SYSmark and MobileMark, are measured using specific computer systems, components, software, operations and functions. Any change to any of those factors may cause the results to vary. You should consult other information and performance tests to assist you in fully evaluating your contemplated purchases, including the performance of that product when combined with other products. For more information go to www.intel.com/benchmarks. Performance results are based on testing as of date specified in the Configuration Disclosure and may not reflect all publicly available security updates. See configuration disclosure for details. No product or component can be absolutely secure. Optimization Notice: Intel's compilers may or may not optimize to the same degree for non-Intel microprocessors for optimizations that are not unique to Intel microprocessors. These optimizations include SSE2, SSE3, and SSSE3 instruction sets and other optimizations. Intel does not guarantee the availability, functionality, or effectiveness of any optimization on microprocessors not manufactured by Intel. Microprocessor- dependent optimizations in this product are intended for use with Intel microprocessors. Certain optimizations not specific to Intel microarchitecture are reserved for Intel microprocessors. Please refer to the applicable product User and Reference Guides for more information regarding the specific instruction sets covered by this notice. Intel technologies’ features and benefits depend on system configuration and may require enabled hardware, software or service activation. Performance varies depending on system configuration. Check with your system manufacturer or retailer or learn more at intel.com. Intel, the Intel logo, Celeron, Intel Core, Intel Optane, Intel vPro, OpenVINO, Pentium, and Thunderbolt are trademarks of Intel Corporation or its subsidiaries in the U.S. and/or other countries. *Other names and brands may be claimed as the property of others. © Intel Corporation.Software and workloads used in performance tests may have been optimized for performance only on Intel microprocessors. Performance tests, such as SYSmark and MobileMark, are measured using specific computer systems, components, software, operations and functions. Any change to any of those factors may cause the results to vary. You should consult other information and performance tests to assist you in fully evaluating your contemplated purchases, including the performance of that product when combined with other products. For more information go to www.intel.com/benchmarks. Performance results are based on testing as of date specified in the Configuration Disclosure and may not reflect all publicly available security updates. See configuration disclosure for details. No product or component can be absolutely secure. Optimization Notice: Intel's compilers may or may not optimize to the same degree for non-Intel microprocessors for optimizations that are not unique to Intel microprocessors. These optimizations include SSE2, SSE3, and SSSE3 instruction sets and other optimizations. Intel does not guarantee the availability, functionality, or effectiveness of any optimization on microprocessors not manufactured by Intel. Microprocessor- dependent optimizations in this product are intended for use with Intel microprocessors. Certain optimizations not specific to Intel microarchitecture are reserved for Intel microprocessors. Please refer to the applicable product User and Reference Guides for more information regarding the specific instruction sets covered by this notice. Intel technologies’ features and benefits depend on system configuration and may require enabled hardware, software or service activation. Performance varies depending on system configuration. Check with your system manufacturer or retailer or learn more at intel.com. Intel, the Intel logo, Celeron, Intel Core, Intel Optane, Intel vPro, OpenVINO, Pentium, and Thunderbolt are trademarks of Intel Corporation or its subsidiaries in the U.S. and/or other countries. *Other names and brands may be claimed as the property of others. © Intel Corporation.

Exhibit 99.5 George Davis CHIEF FINANCIAL OFFICERExhibit 99.5 George Davis CHIEF FINANCIAL OFFICER

This presentation contains non-GAAP financial measures. You can find the reconciliation of these measures to the most directly comparable GAAP financial measure in the Appendix at the end of this presentation. The non-GAAP financial measures disclosed by Intel should not be considered a substitute for, or superior to, the financial measures prepared in accordance with GAAP. Please refer to “Explanation of Non-GAAP Measures” in Intel's quarterly earnings release for a detailed explanation of the adjustments made to the comparable GAAP measures, the ways management uses the non-GAAP measures and the reasons why management believes the non-GAAP measures provide investors with useful supplemental information. Statements in this presentation that refer to business outlook, future plans and expectations are forward-looking statements that involve a number of risks and uncertainties. Words such as anticipates, expects, intends, goals, plans, believes, seeks, estimates, continues, may, will, “would,” should, “could,” and variations of such words and similar expressions are intended to identify such forward-looking statements. Statements that refer to or are based on estimates, forecasts, projections, uncertain events or assumptions, including statements relating to total addressable market (TAM) or market opportunity, future products and the expected availability and benefits of such products, and anticipated trends in our businesses or the markets relevant to them, also identify forward-looking statements. Such statements are based on management's expectations as of May 8, 2019, unless an earlier date is indicated, and involve many risks and uncertainties that could cause actual results to differ materially from those expressed or implied in these forward-looking statements. Important factors that could cause actual results to differ materially from the company's expectations are set forth in Intel's earnings release dated April 25, 2019, which is included as an exhibit to Intel’s Form 8-K furnished to the SEC on such date. Additional information regarding these and other factors that could affect Intel's results is included in Intel's SEC filings, including the company's most recent reports on Forms 10-K and 10-Q. Copies of Intel's Form 10-K, 10-Q and 8-K reports may be obtained by visiting our Investor Relations website at www.intc.com or the SEC's website at www.sec.gov. All information in this presentation reflects management’s views as of May 8, 2019, unless an earlier date is indicated. Intel does not undertake, and expressly disclaims any duty, to update any statement made in this presentation, whether as a result of new information, new developments or otherwise, except to the extent that disclosure may be required by law.This presentation contains non-GAAP financial measures. You can find the reconciliation of these measures to the most directly comparable GAAP financial measure in the Appendix at the end of this presentation. The non-GAAP financial measures disclosed by Intel should not be considered a substitute for, or superior to, the financial measures prepared in accordance with GAAP. Please refer to “Explanation of Non-GAAP Measures” in Intel's quarterly earnings release for a detailed explanation of the adjustments made to the comparable GAAP measures, the ways management uses the non-GAAP measures and the reasons why management believes the non-GAAP measures provide investors with useful supplemental information. Statements in this presentation that refer to business outlook, future plans and expectations are forward-looking statements that involve a number of risks and uncertainties. Words such as anticipates, expects, intends, goals, plans, believes, seeks, estimates, continues, may, will, “would,” should, “could,” and variations of such words and similar expressions are intended to identify such forward-looking statements. Statements that refer to or are based on estimates, forecasts, projections, uncertain events or assumptions, including statements relating to total addressable market (TAM) or market opportunity, future products and the expected availability and benefits of such products, and anticipated trends in our businesses or the markets relevant to them, also identify forward-looking statements. Such statements are based on management's expectations as of May 8, 2019, unless an earlier date is indicated, and involve many risks and uncertainties that could cause actual results to differ materially from those expressed or implied in these forward-looking statements. Important factors that could cause actual results to differ materially from the company's expectations are set forth in Intel's earnings release dated April 25, 2019, which is included as an exhibit to Intel’s Form 8-K furnished to the SEC on such date. Additional information regarding these and other factors that could affect Intel's results is included in Intel's SEC filings, including the company's most recent reports on Forms 10-K and 10-Q. Copies of Intel's Form 10-K, 10-Q and 8-K reports may be obtained by visiting our Investor Relations website at www.intc.com or the SEC's website at www.sec.gov. All information in this presentation reflects management’s views as of May 8, 2019, unless an earlier date is indicated. Intel does not undertake, and expressly disclaims any duty, to update any statement made in this presentation, whether as a result of new information, new developments or otherwise, except to the extent that disclosure may be required by law.

Results and Near-term Expectations Extending Product Leadership while Investing in Process Capital Returns & Investment Discipline Summary of Today’s Key MessagesResults and Near-term Expectations Extending Product Leadership while Investing in Process Capital Returns & Investment Discipline Summary of Today’s Key Messages

3 Years of Records & PROGRESS ON DATA-CENTRIC TRANSFORMATION Intel Revenue PC Business Data Centric Businesses $70.8B $72 $68 CAGR $34B $29B ~14% $64 $26B $23B $60 $37B $34B $33B $32B $56 ~5% $52 2015 2016 2017 2018 2015 2016 2017 2018 Data-Centric Businesses ~50% of Total Revenue Data-centric businesses include DCG, IOTG, Mobileye, NSG, PSG and All Other. Revenue ($)3 Years of Records & PROGRESS ON DATA-CENTRIC TRANSFORMATION Intel Revenue PC Business Data Centric Businesses $70.8B $72 $68 CAGR $34B $29B ~14% $64 $26B $23B $60 $37B $34B $33B $32B $56 ~5% $52 2015 2016 2017 2018 2015 2016 2017 2018 Data-Centric Businesses ~50% of Total Revenue Data-centric businesses include DCG, IOTG, Mobileye, NSG, PSG and All Other. Revenue ($)

2023 ~$220B ~$68B ~$35B ~$17b TAM 7% CAGR -1% CAGR GRAPHICS CONNECTIVITY Data center NETWORK IOT PLATFORMS AI AI NFV MEMORY FPGA 5G ADAS CONNECTIVITY MEDIA MaaS/DATA Optane™ FPGA VIDEO 3D NAND EDGE EDGE Server PC CPU (x86 CPU compute) (x86 compute) data-centric Pc-centric data-centric From Defending MSS... …TO Growing mss 2023F TAM is based on an amalgamation of analyst data and Intel analysis, based upon current expectations and available information and is subject to change without notice. PC-Centric includes CPU & Chipsets, Connectivity (including modems other than 5G smartphone), Gateways, Gaming Consoles, Memory and Discrete Graphics. Data-Centric includes Data Center and Networking Compute, Memory, Storage and Connectivity, and IOT addressable Logic ASIC/ASSP, MPU, MCU, DSP for Industrial, Transportation, Automated Driving, Retail, Video Surveillance, Healthcare, Public Sector, Office Automation, Gaming and Smart Home. IOT also includes MaaS and intelligent transportation enabled data opportunities. MSS 2018 2023 ~$220B ~$68B ~$35B ~$17b TAM 7% CAGR -1% CAGR GRAPHICS CONNECTIVITY Data center NETWORK IOT PLATFORMS AI AI NFV MEMORY FPGA 5G ADAS CONNECTIVITY MEDIA MaaS/DATA Optane™ FPGA VIDEO 3D NAND EDGE EDGE Server PC CPU (x86 CPU compute) (x86 compute) data-centric Pc-centric data-centric From Defending MSS... …TO Growing mss 2023F TAM is based on an amalgamation of analyst data and Intel analysis, based upon current expectations and available information and is subject to change without notice. PC-Centric includes CPU & Chipsets, Connectivity (including modems other than 5G smartphone), Gateways, Gaming Consoles, Memory and Discrete Graphics. Data-Centric includes Data Center and Networking Compute, Memory, Storage and Connectivity, and IOT addressable Logic ASIC/ASSP, MPU, MCU, DSP for Industrial, Transportation, Automated Driving, Retail, Video Surveillance, Healthcare, Public Sector, Office Automation, Gaming and Smart Home. IOT also includes MaaS and intelligent transportation enabled data opportunities. MSS 2018

Operating Margin Revenue EPS ~32% ~$4.35 ~$69B Building on a strong platform, investing for earnings leverage in 7nm & beyond Operating margin and EPS are presented on a non-GAAP basis. Refer to the Appendix for a reconciliation of these non-GAAP measures.Operating Margin Revenue EPS ~32% ~$4.35 ~$69B Building on a strong platform, investing for earnings leverage in 7nm & beyond Operating margin and EPS are presented on a non-GAAP basis. Refer to the Appendix for a reconciliation of these non-GAAP measures.


EPS Leverage on next gen products 7++ Strengthening product leadership, focused 7+ spending 7 10++ 10+ 10 14++ 14+ 1276 14 1274 1272 2014 2015 2016 2017 2018 2019 2020 2021 2022 2023 8 Transistor efficiency (Perf / W)EPS Leverage on next gen products 7++ Strengthening product leadership, focused 7+ spending 7 10++ 10+ 10 14++ 14+ 1276 14 1274 1272 2014 2015 2016 2017 2018 2019 2020 2021 2022 2023 8 Transistor efficiency (Perf / W)
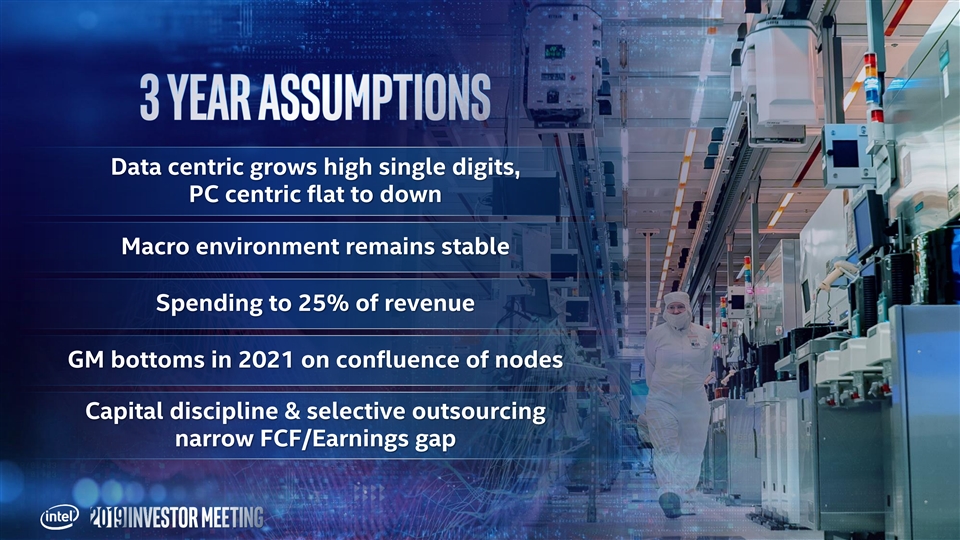
Data centric grows high single digits, PC centric flat to down Macro environment remains stable Spending to 25% of revenue GM bottoms in 2021 on confluence of nodes Capital discipline & selective outsourcing narrow FCF/Earnings gapData centric grows high single digits, PC centric flat to down Macro environment remains stable Spending to 25% of revenue GM bottoms in 2021 on confluence of nodes Capital discipline & selective outsourcing narrow FCF/Earnings gap

Revenue growth Operating efficiency Earnings/FCF Low-single digit growth, $76B-$78B Operating Margin ~32% EPS growth in line with revenue Data-Centric businesses Gross Margins declines high-single digit growth offset by spending FCF growing faster leverage and 5G than earnings PC-Centric business smartphone modem exit ~flat to down Closing FCF/Earnings gap (>80%)… ATTRACTIVE capital RETURNS Operating margin, gross margin, EPS, and FCF are non-GAAP. Forecasts are Intel estimates, based upon current expectations and available information and are subject to change without notice.Revenue growth Operating efficiency Earnings/FCF Low-single digit growth, $76B-$78B Operating Margin ~32% EPS growth in line with revenue Data-Centric businesses Gross Margins declines high-single digit growth offset by spending FCF growing faster leverage and 5G than earnings PC-Centric business smartphone modem exit ~flat to down Closing FCF/Earnings gap (>80%)… ATTRACTIVE capital RETURNS Operating margin, gross margin, EPS, and FCF are non-GAAP. Forecasts are Intel estimates, based upon current expectations and available information and are subject to change without notice.

Opex Gross Margin GM% between 57% and 60% Spending to ~25% of revenue Tailwinds Tailwinds • Demand for performance • 5G smartphone modem exit • Improving yields • Comprehensive portfolio review • SG&A productivity gains Headwinds • Transition to 10nm & 7nm startup Headwinds • Growth of adjacent businesses • Growing investment in critical process • Intensifying competitive environment & product initiatives Operating Margin at ~32%, GM% decline offset by Opex leverage Opex Gross Margin GM% between 57% and 60% Spending to ~25% of revenue Tailwinds Tailwinds • Demand for performance • 5G smartphone modem exit • Improving yields • Comprehensive portfolio review • SG&A productivity gains Headwinds • Transition to 10nm & 7nm startup Headwinds • Growth of adjacent businesses • Growing investment in critical process • Intensifying competitive environment & product initiatives Operating Margin at ~32%, GM% decline offset by Opex leverage

Drive to 25 36% 33% 28% $7.5B $6.0B $7.9B $13.2B $12.1B $13.0B 2015` 2017 2019F R&D SG&A % of RevenueDrive to 25 36% 33% 28% $7.5B $6.0B $7.9B $13.2B $12.1B $13.0B 2015` 2017 2019F R&D SG&A % of Revenue

non-GAAP EPS $4.58 Free Cash Flow $4.35 FCF/Earnings % FCF >80% of Earnings in 2021 $3.46 ~75% 66% 62% $15B - $10B - $17B+ $14B '16-18 '19-21 2017 2018 2019 Guide Grow FCF in a Challenging Environmentnon-GAAP EPS $4.58 Free Cash Flow $4.35 FCF/Earnings % FCF >80% of Earnings in 2021 $3.46 ~75% 66% 62% $15B - $10B - $17B+ $14B '16-18 '19-21 2017 2018 2019 Guide Grow FCF in a Challenging Environment
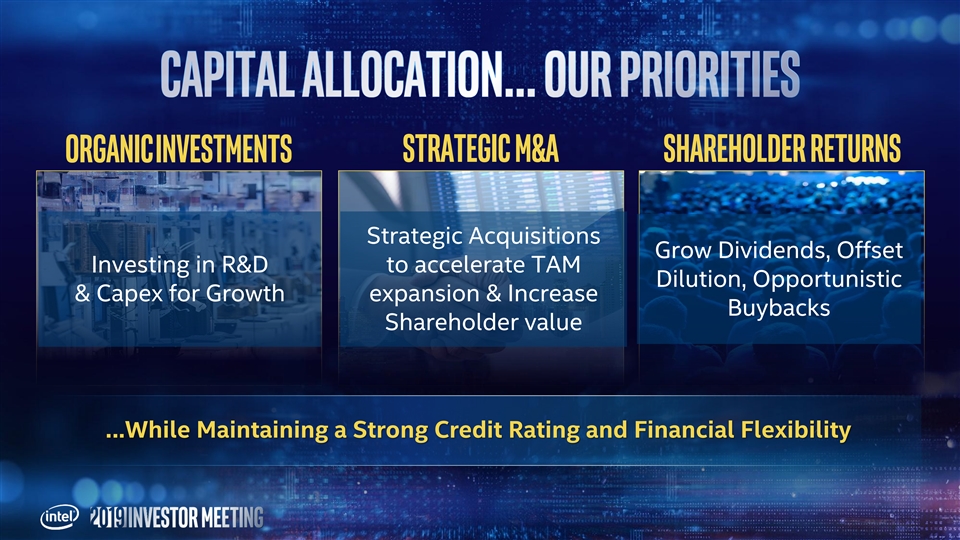
Organic Investments Strategic M&A Shareholder Returns Strategic Acquisitions Grow Dividends, Offset Investing in R&D to accelerate TAM Dilution, Opportunistic & Capex for Growth expansion & Increase Buybacks Shareholder value …While Maintaining a Strong Credit Rating and Financial FlexibilityOrganic Investments Strategic M&A Shareholder Returns Strategic Acquisitions Grow Dividends, Offset Investing in R&D to accelerate TAM Dilution, Opportunistic & Capex for Growth expansion & Increase Buybacks Shareholder value …While Maintaining a Strong Credit Rating and Financial Flexibility

>95% R&D $ Data Center Network Intelligent Agents>95% R&D $ Data Center Network Intelligent Agents

Focus 2015-2018 Deals • Tight alignment to TAM expansion >= $1B 3• DCF discipline • Accelerate critical technologies & scale $500M-$999M• Tuck-ins continue 1 • Fully-resourced & milestone-driven integration teams on every deal $100M-$499M 12 Exit $25M - $99M 9 • Non-strategic businesses • Low NPV opportunities < $25M 13 All dealsFocus 2015-2018 Deals • Tight alignment to TAM expansion >= $1B 3• DCF discipline • Accelerate critical technologies & scale $500M-$999M• Tuck-ins continue 1 • Fully-resourced & milestone-driven integration teams on every deal $100M-$499M 12 Exit $25M - $99M 9 • Non-strategic businesses • Low NPV opportunities < $25M 13 All deals

• Thesis ~on-track, process behind • Meeting tech inflection/customer/profit criteria • Regular checks against milestones • Positions for Cloud, AI, & 5G networking leadership • On-track to exceed value of deal thesis • Entering new markets, business models • Providing scale, sharing technical expertise to accelerate growth• Thesis ~on-track, process behind • Meeting tech inflection/customer/profit criteria • Regular checks against milestones • Positions for Cloud, AI, & 5G networking leadership • On-track to exceed value of deal thesis • Entering new markets, business models • Providing scale, sharing technical expertise to accelerate growth

Our Policy Maintain strong investment grade rating Grow dividend in line with earnings Eliminate equity plan dilution as a floor Be opportunistic on buybacks Strong FCF & attractive Capital ReturnOur Policy Maintain strong investment grade rating Grow dividend in line with earnings Eliminate equity plan dilution as a floor Be opportunistic on buybacks Strong FCF & attractive Capital Return

our practice Buyback Dividend $1.20 5 &10 Year Avg Return of $16.3B ~95% Capital (% FCF) $5.5B $8.7B Since 2015 Total Increase: $7.6B $7.5B $5.1B $10.7B $4.6B $4.9B $0.24 / 25% $3.6B $3.0B $2.6B 2015 2016 2017 2018 History of Attractive & Consistent Capital Returnour practice Buyback Dividend $1.20 5 &10 Year Avg Return of $16.3B ~95% Capital (% FCF) $5.5B $8.7B Since 2015 Total Increase: $7.6B $7.5B $5.1B $10.7B $4.6B $4.9B $0.24 / 25% $3.6B $3.0B $2.6B 2015 2016 2017 2018 History of Attractive & Consistent Capital Return
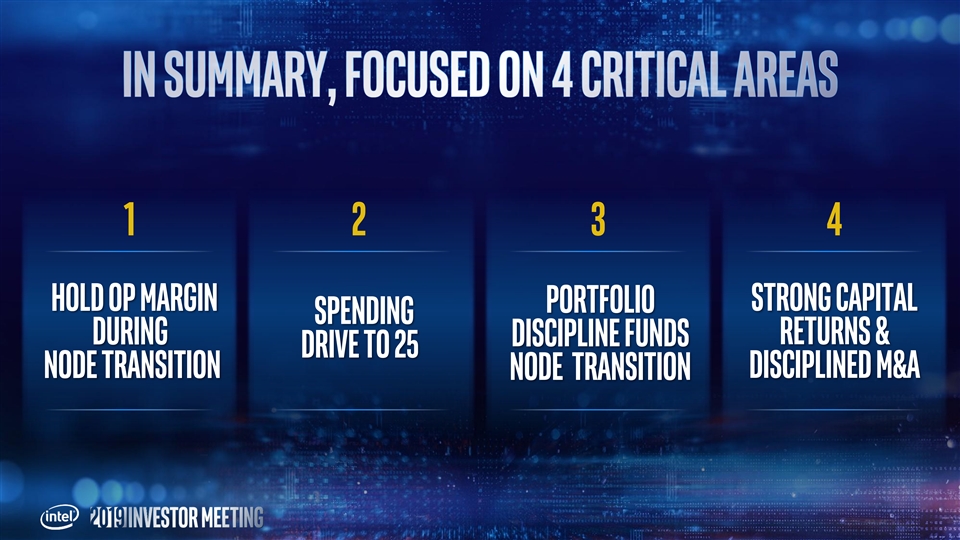
1 2 3 4 Hold Op Margin strong capital Portfolio Spending During returns & Discipline funds Drive to 25 Node transition disciplined M&A node transition1 2 3 4 Hold Op Margin strong capital Portfolio Spending During returns & Discipline funds Drive to 25 Node transition disciplined M&A node transition
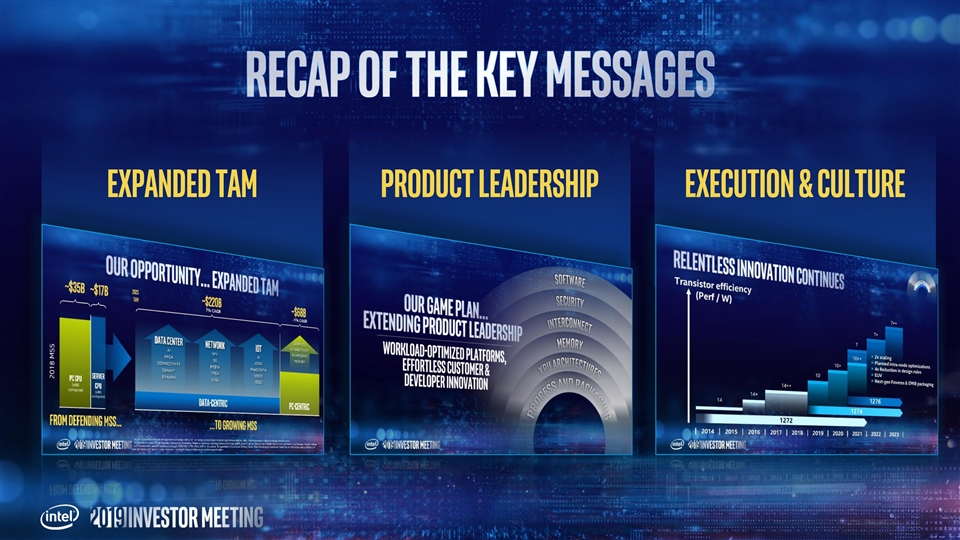
Expanded TAM Product Leadership Execution & cultureExpanded TAM Product Leadership Execution & culture

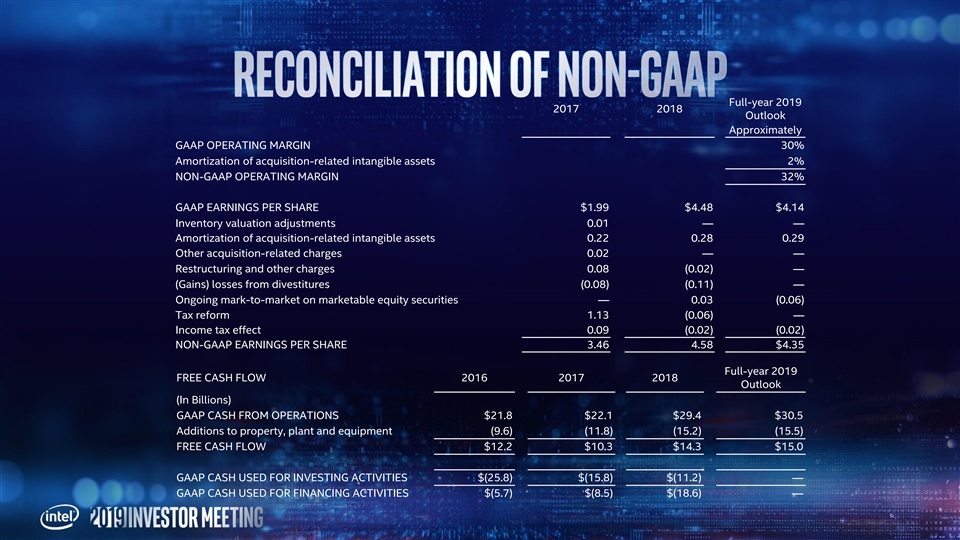
Full-year 2019 2017 2018 Outlook Approximately GAAP OPERATING MARGIN 30% Amortization of acquisition-related intangible assets 2% NON-GAAP OPERATING MARGIN 32% GAAP EARNINGS PER SHARE $1.99 $4.48 $4.14 Inventory valuation adjustments 0.01 — — Amortization of acquisition-related intangible assets 0.22 0.28 0.29 Other acquisition-related charges 0.02 — — Restructuring and other charges 0.08 (0.02) — (Gains) losses from divestitures (0.08) (0.11) — Ongoing mark-to-market on marketable equity securities — 0.03 (0.06) Tax reform 1.13 (0.06) — Income tax effect 0.09 (0.02) (0.02) NON-GAAP EARNINGS PER SHARE 3.46 4.58 $4.35 Full-year 2019 FREE CASH FLOW 2016 2017 2018 Outlook (In Billions) GAAP CASH FROM OPERATIONS $21.8 $22.1 $29.4 $30.5 Additions to property, plant and equipment (9.6) (11.8) (15.2) (15.5) FREE CASH FLOW $12.2 $10.3 $14.3 $15.0 GAAP CASH USED FOR INVESTING ACTIVITIES $(25.8) $(15.8) $(11.2) — GAAP CASH USED FOR FINANCING ACTIVITIES $(5.7) $(8.5) $(18.6) —Full-year 2019 2017 2018 Outlook Approximately GAAP OPERATING MARGIN 30% Amortization of acquisition-related intangible assets 2% NON-GAAP OPERATING MARGIN 32% GAAP EARNINGS PER SHARE $1.99 $4.48 $4.14 Inventory valuation adjustments 0.01 — — Amortization of acquisition-related intangible assets 0.22 0.28 0.29 Other acquisition-related charges 0.02 — — Restructuring and other charges 0.08 (0.02) — (Gains) losses from divestitures (0.08) (0.11) — Ongoing mark-to-market on marketable equity securities — 0.03 (0.06) Tax reform 1.13 (0.06) — Income tax effect 0.09 (0.02) (0.02) NON-GAAP EARNINGS PER SHARE 3.46 4.58 $4.35 Full-year 2019 FREE CASH FLOW 2016 2017 2018 Outlook (In Billions) GAAP CASH FROM OPERATIONS $21.8 $22.1 $29.4 $30.5 Additions to property, plant and equipment (9.6) (11.8) (15.2) (15.5) FREE CASH FLOW $12.2 $10.3 $14.3 $15.0 GAAP CASH USED FOR INVESTING ACTIVITIES $(25.8) $(15.8) $(11.2) — GAAP CASH USED FOR FINANCING ACTIVITIES $(5.7) $(8.5) $(18.6) —

Forward-looking non-GAAP measures relating to fiscal years 2020 and beyond represent targets and are based on internal forecasts subject to significant uncertainty. We are unable to provide a full reconciliation of such measures to GAAP measures without unreasonable efforts as we cannot predict the amount or timing of certain elements that are included in reported GAAP results and that may significantly affect GAAP results, including acquisition-related adjustments and other non-recurring events or transactions. In addition, certain comparable GAAP measures such as net cash provided by operating activities are difficult to accurately estimate for such time frames and are dependent on future events. We believe such a reconciliation would also imply a degree of precision that could be confusing or inappropriate for these forward-looking measures. Forward-looking non-GAAP measures relating to fiscal years 2020 and beyond represent targets and are based on internal forecasts subject to significant uncertainty. We are unable to provide a full reconciliation of such measures to GAAP measures without unreasonable efforts as we cannot predict the amount or timing of certain elements that are included in reported GAAP results and that may significantly affect GAAP results, including acquisition-related adjustments and other non-recurring events or transactions. In addition, certain comparable GAAP measures such as net cash provided by operating activities are difficult to accurately estimate for such time frames and are dependent on future events. We believe such a reconciliation would also imply a degree of precision that could be confusing or inappropriate for these forward-looking measures.