
Form 8-K NETFLIX INC For: Apr 16
SECURITIES AND EXCHANGE COMMISSION
Washington, D.C. 20549
__________________________________
FORM 8-K
__________________________________
Current Report
Pursuant to Section 13 or 15(d) of
the Securities Exchange Act of 1934
Date of Report (Date of earliest event reported):
April 16, 2019
__________________________________
NETFLIX, INC.
(Exact name of registrant as specified in its charter)
__________________________________
Delaware | 001-35727 | 77-0467272 |
(State or other jurisdiction of incorporation) | (Commission File Number) | (I.R.S. Employer Identification No.) |
100 Winchester Circle
Los Gatos, CA
95032
(Address of principal executive offices)
(Zip Code)
(408) 540-3700
(Registrant’s telephone number, including area code)
(Former name or former address, if changed since last report)
__________________________________
Check the appropriate box below if the Form 8-K filing is intended to simultaneously satisfy the filing obligation of the registrant under any of the following provisions:
o | Written communications pursuant to Rule 425 under the Securities Act (17 CFR 230.425) |
o | Soliciting material pursuant to Rule 14a-12 under the Exchange Act (17 CFR 240.14a-12) |
o | Pre-commencement communications pursuant to Rule 14d-2(b) under the Exchange Act (17 CFR 240.14d-2(b)) |
o | Pre-commencement communications pursuant to Rule 13e-4(c) under the Exchange Act (17 CFR 240.13e-4(c)) |
Indicate by check mark whether the registrant is an emerging growth company as defined in Rule 405 of the Securities Act of 1933 (§230.405 of this chapter) or Rule 12b-2 of the Securities Exchange Act of 1934 (§240.12b-2 of this chapter).
Emerging growth company ¨
If an emerging growth company, indicate by check mark if the registrant has elected not to use the extended transition period for complying with any new or revised financial accounting standards provided pursuant to Section 13(a) of the Exchange Act. ¨
Item 2.02 Results of Operations and Financial Condition.
On April 16, 2019, Netflix, Inc. (the “Company”) announced its financial results for the quarter ended March 31, 2019. The Letter to Shareholders, which is attached hereto as Exhibit 99.1 and is incorporated herein by reference, includes reference to the non-GAAP financial measures of free cash flow and EBITDA. Generally, a non-GAAP financial measure is a numerical measure of a company’s performance, financial position, or cash flows that either excludes or includes amounts that are not normally excluded or included in the most directly comparable measure calculated and presented in accordance with generally accepted accounting principles in the United States. Management believes that the non-GAAP measures of free cash flow and EBITDA are important liquidity metrics because they measure, during a given period, the amount of cash generated that is available to repay debt obligations, make investments and for certain other activities or the amount of cash used in operations, including investments in global streaming content. However, these non-GAAP measures should be considered in addition to, not as a substitute for or superior to, net income, operating income, diluted earnings per share and net cash provided by operating activities, or other financial measures prepared in accordance with GAAP. Reconciliation to the GAAP equivalent of these non-GAAP measures are contained in tabular form in Exhibit 99.1.
The information in this report shall not be treated as “filed” for purposes of Section 18 of the Securities Exchange Act of 1934, nor shall it be deemed incorporated by reference into any registration statement or other document pursuant to the Securities Act of 1933 or the Securities Exchange Act of 1934, except as expressly stated by specific reference in such filing.
Item 9.01 Financial Statement and Exhibits.
(d) Exhibit
99.1 | Letter to Shareholders dated: | April 16, 2019 | |
SIGNATURES
Pursuant to the requirements of the Securities Exchange Act of 1934, the registrant has duly caused this report to be signed on its behalf by the undersigned hereunto duly authorized.
NETFLIX, INC. | ||
Date: | April 16, 2019 | |
/s/ Spencer Neumann | ||
Spencer Neumann | ||
Chief Financial Officer | ||
EXHIBIT INDEX
Exhibit No. | Description of Exhibit | ||
* | This exhibit is intended to be furnished and shall not be deemed “filed” for purposes of the Securities Exchange Act of 1934. |
The Letter to Shareholders will be attached as Exhibit 99.1.
Exhibit 99.1
April 16, 2019
Fellow shareholders,
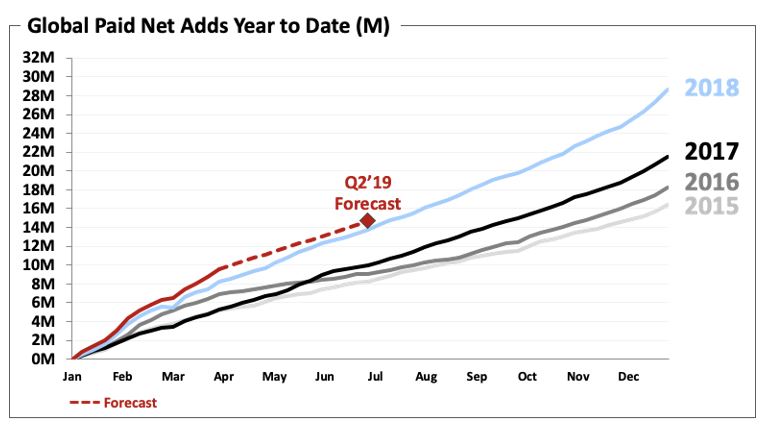
Revenue surpassed $4.5 billion in Q1 and we recorded the highest quarterly paid net adds in our history (9.6m, up 16% year over year). For 20 years, we've had the same strategy: when we please our members, they watch more and we grow more.
(in millions except per share data and Streaming Content Obligations) | Q1'18 | Q2'18 | Q3'18 | Q4'18 | Q1'19 | Q2'19 Forecast | ||||||||||||
Revenue | $ | 3,701 | $ | 3,907 | $ | 3,999 | $ | 4,187 | $ | 4,521 | $ | 4,928 | ||||||
Y/Y % Growth | 40.4 | % | 40.3 | % | 34.0 | % | 27.4 | % | 22.2 | % | 26.1 | % | ||||||
Operating Income | $ | 447 | $ | 462 | $ | 481 | $ | 216 | $ | 459 | $ | 616 | ||||||
Operating Margin | 12.1 | % | 11.8 | % | 12.0 | % | 5.2 | % | 10.2 | % | 12.5 | % | ||||||
Net Income | $ | 290 | $ | 384 | $ | 403 | $ | 134 | $ | 344 | $ | 249 | ||||||
Diluted EPS | $ | 0.64 | $ | 0.85 | $ | 0.89 | $ | 0.30 | $ | 0.76 | $ | 0.55 | ||||||
Global Streaming Paid Memberships | 118.90 | 124.35 | 130.42 | 139.26 | 148.86 | 153.86 | ||||||||||||
Y/Y % Growth | 26.0 | % | 25.6 | % | 25.4 | % | 25.9 | % | 25.2 | % | 23.7 | % | ||||||
Global Streaming Paid Net Additions | 8.26 | 5.45 | 6.07 | 8.84 | 9.60 | 5.00 | ||||||||||||
Net cash (used in) operating activities | $ | (237 | ) | $ | (518 | ) | $ | (690 | ) | $ | (1,235 | ) | $ | (380 | ) | |||
Free Cash Flow* | $ | (287 | ) | $ | (559 | ) | $ | (859 | ) | $ | (1,315 | ) | $ | (460 | ) | |||
EBITDA** | $ | 534 | $ | 563 | $ | 584 | $ | 328 | $ | 584 | ||||||||
Shares (FD) | 450.4 | 451.6 | 451.9 | 451.1 | 451.9 | |||||||||||||
Streaming Content Obligations*** ($B) | 17.9 | 18.4 | 18.6 | 19.3 | 18.9 | |||||||||||||
Note: Figures are consolidated, including DVD. | ||||||||||||||||||
* Free cash flow represents Net Cash (used in) operating activities adjusted for acquisition of DVD content assets, purchases of property and equipment and change in other assets | ||||||||||||||||||
** Adjusted EBITDA represents net income before interest expense and other income/expense, income taxes, depreciation and amortization of property and equipment and further adjusted to exclude other non-cash charges or non-recurring items | ||||||||||||||||||
*** Corresponds to our total known streaming content obligations as defined in our financial statements and related notes in our most recently filed SEC Form 10-K | ||||||||||||||||||
 | 1 |
Q1 Results and Q2 Forecast
In Q1’19, average streaming paid memberships increased 26% year over year, while ARPU decreased 2% year over year due to currency headwinds. Excluding F/X, global streaming ARPU improved 3% year over year and 2% sequentially. Year over year total revenue growth of 22% compares against 40% in Q1’18, which benefited from several price changes that took place in Q4’17 as well as F/X. On a F/X-neutral basis, Q1’19 revenue grew 28% year over year.
Operating margin of 10.2% exceeded our beginning-of-quarter expectation as some spending was shifted from Q1 to later in the year. EPS of $0.76, vs. $0.64 in the prior year period, included a $58 million non-cash unrealized gain from F/X remeasurement on our Euro denominated debt. Streaming content obligations dipped sequentially in Q1 due in part to the timing of run-of-series commitments. In addition, as we shift to more original content, there will be greater variability in content obligations quarter-to-quarter due to the timing of when productions start. We early-adopted the new content accounting standard (ASU 2019-2) in Q1’19. There is no material impact as our content accounting policies are already consistent with the new rules.
Paid net adds in Q1 were 9.6 million (with 1.74m in the US and 7.86m internationally), up 16% year over year, representing a new quarterly record. As always, our quarterly guidance is our internal forecast at the time we report. For Q2’19, we project total paid net adds of 5.0m (-8% year over year), with 0.3m in the US and 4.7m for the international segment. This would put us at 14.6m paid net adds for the first half of 2019, up 7% year over year.
We’re working our way through a series of price increases in the US, Brazil, Mexico and parts of Europe. The response in the US so far is as we expected and is tracking similarly to what we saw in Canada following our Q4’18 increase, where our gross additions are unaffected, and we see some modest short-term churn effect as members consent to the price change. We’re looking forward to a strong slate of global content in the second half of the year, including new seasons of some of our biggest series, Stranger Things (July 4th), 13 Reasons Why, Orange is the New Black, The Crown and La Casa de Papel (aka Money Heist) as well as big films like Michael Bay’s Six Underground and Martin Scorsese’s The Irishman, and expect another year of record annual paid net adds in 2019.
| 2 |
We forecast an acceleration in both streaming ARPU (+2% vs. -2%) and total revenue growth (26% vs. 22%) in Q2 vs. Q1. Excluding currency, we forecast streaming ARPU and total revenue would rise 7% and 32%, respectively in Q2. While there will be some quarter-to-quarter lumpiness in operating margins due to the timing of spending, our full year 2019 operating margin target of 13% is unchanged, which means that we expect operating margin in the second half of the year will be higher than the first half.
As a result of US tax reform, we took the opportunity to simplify our corporate structure. This will result in a higher effective tax rate in 2019, including an expected effective tax rate of 48% in Q2’19 due to one time discrete events. Longer term, we expect our effective tax rate to trend down toward U.S. federal rates.
Content
We program Netflix with a wide breadth of content to satisfy the diverse tastes of our nearly 150m paid members and the hundreds of millions of people we hope will one day join Netflix. We continue to see big successes across our programming categories. For Q1’19, in scripted English language TV, we premiered another big hit in Umbrella Academy, based on the comic book by Gerard Way and Gabriel Bá, which has been watched by 45 million member households in its first four weeks on service.
Our original films effort built on the momentum from our Q4 blockbuster Bird Box with Triple Frontier, starring Ben Affleck and directed by J.C. Chandor. This action/heist movie has been watched by over 52 million member households in its first four weeks on Netflix. The Highwaymen (starring Kevin Costner and Woody Harrelson as two lawmen that bring Bonnie and Clyde to justice) is on track to being watched by over 40 million member households in its first month.
Our documentary feature FYRE: The Greatest Party That Never Happened has been watched by over 20 million member households in its first month on Netflix. In early April, we unveiled Our Planet, our most ambitious entry into the popular nature documentary genre. More than four years in the making and shot in 50 different countries, Our Planet is off to a strong start and is tracking to be one of our most successful global documentary series launches yet, with over 25 million member households projected to watch in the first month of release.
We launched our originals effort for the unscripted genre two years ago with several successful English-language formats like the light hearted cooking competition Nailed It!. We’re building on that success by launching locally adapted versions in Mexico, France, Germany and Spain. ¡Nailed It!: México was the first and launched on February 8, achieving three times more first-month watchers in Mexico than the dubbed US version.
Our non-English language originals continue to be successful for us and we recently announced that Bela Bajaria, who has overseen some of our most successful scripted and unscripted titles, will now lead this programming category for original series in LatAm, EMEA and India. We premiered our first large scale Korean original series, Kingdom, in January. This period piece with zombies is our most successful season one show in Korea to date and has also been watched by millions of members outside of Korea with particularly strong viewing throughout Asia. Durante la Tormenta (aka Mirage) is a successful Spanish-language original film that debuted in the quarter and has seen broad viewing across the world.
We’re thrilled for the creators of our content when they are recognized for their exceptional work. We’re proud that last year Netflix became the most nominated network at the Emmys and now has tied to become the #2 most nominated studio at the Oscars; we tied for most wins in both, including major
| 3 |
Oscar wins for Alfonso Cuarón for Best Director and Best Cinematographer for Roma, which also won for Best Foreign Language Feature.
Marketing
Our CMO, Kelly Bennett, will be retiring this year after an amazing seven year run. During this time, Kelly was a key contributor to the transformation of Netflix from a primarily domestic service with only 2nd run content to a global service launching an unprecedented amount of original programming and we thank Kelly for his hard work. Ted Sarandos has led content for nearly 20 years here, and is ready to run both content and marketing, so he is leading the search for the new CMO, who will report to him.
Product and Partnerships
We’ve been expanding our bundling initiative and we are now distributing Netflix through ten different operator bundles across the globe. To date, these bundles have had a positive effect on our business, driving incremental acquisition at similar economics to other partnerships where Netflix is offered á la carte.
Later in Q2 we’ll be running a test to improve our UK member experience by releasing weekly top 10 lists of the most popular content on our UK service across various programming categories. For those who want to watch what others are watching, this may make choosing titles even easier. After a few months we’ll decide whether to end or expand the test.
Competition
Recently, Apple and Disney each unveiled their direct-to-consumer subscription video services. Both companies are world class consumer brands and we’re excited to compete; the clear beneficiaries will be content creators and consumers who will reap the rewards of many companies vying to provide a great video experience for audiences.
We don’t anticipate that these new entrants will materially affect our growth because the transition from linear to on demand entertainment is so massive and because of the differing nature of our content offerings. We believe we’ll all continue to grow as we each invest more in content and improve our service and as consumers continue to migrate away from linear viewing (similar to how US cable networks collectively grew for years as viewing shifted from broadcast networks during the 1980s and 1990s).
We believe there is vast demand for watching great TV and movies and Netflix only satisfies a small portion of that demand. Last quarter, we talked about how our streaming hours in the US (our most mature market) on TV still only represents roughly 10% of total TV usage. We are much smaller and have even more room to grow in other countries and on other devices like mobile. For instance, Sandvine estimates our share of global1 downstream mobile internet traffic is about 2%.
___________________________________
1 The Sandvine data does not include significant data from either China or India
| 4 |
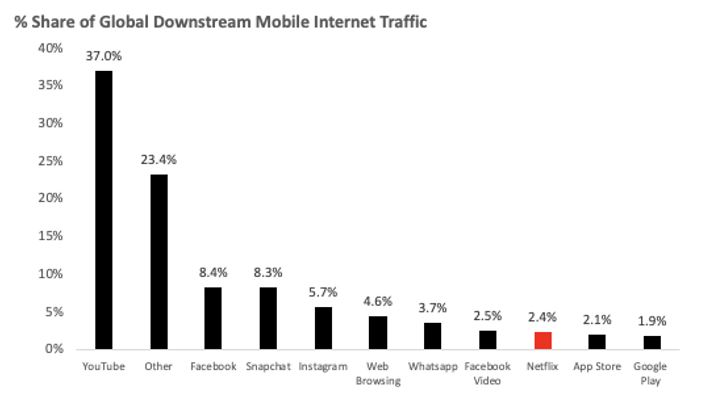
Source: Sandvine, The Mobile Internet Phenomena Report (February 2019)
Cash Flow and Capital Structure
Net cash used in operating activities in Q1’19 was -$380 million vs. -$237 million in the prior year period. Free cash flow2 totaled -$460 million vs. -$287 million in the year ago quarter. As a reminder, the gap between net income and free cash flow is primarily driven by our investment in originals and self produced content where the cash spending is more front end loaded than for second run licensed programming (where cash payments are generally spread over the term of the license).
We now expect 2019 free cash flow deficit to be modestly higher at approximately -$3.5 billion due to higher cash taxes related to the change in our corporate structure and additional investments in real estate and other infrastructure. We’re still expecting free cash flow to improve in 2020 and each year thereafter, driven by our growing member base, revenues, and operating margins.
There’s no change to our plan to use the high yield market to finance our cash needs. We recently upsized our revolving credit facility from $500 million to $750 million (which remains undrawn) at the same cost and extended the term from 2022 to 2024.
___________________________________
2 For a reconciliation of free cash flow to net cash (used in) operating activities, please refer to the reconciliation in tabular form on the attached unaudited financial statements and the footnotes thereto.
| 5 |
Reference
For quick reference, our eight most recent investor letters are: January 2019,3 October 2018,4 July 2018,5 April 2018,6 January 2018,7 October 2017,8 July 2017,9 April 2017.10
Appendix
(in millions) | Q1'18 | Q2'18 | Q3'18 | Q4'18 | Q1'19 | Q2'19 Forecast | ||||||||||||
US Streaming: | ||||||||||||||||||
Revenue | $ | 1,820 | $ | 1,893 | $ | 1,937 | $ | 1,996 | $ | 2,074 | $ | 2,277 | ||||||
Contribution Profit* | $ | 633 | $ | 672 | $ | 688 | $ | 590 | $ | 713 | $ | 795 | ||||||
Contribution Margin* | 34.8 | % | 35.5 | % | 35.5 | % | 29.6 | % | 34.4 | % | 34.9 | % | ||||||
Paid Memberships | 55.09 | 55.96 | 56.96 | 58.49 | 60.23 | 60.53 | ||||||||||||
Paid Net Additions | 2.28 | 0.87 | 1.00 | 1.53 | 1.74 | 0.30 | ||||||||||||
Free Trials | 1.62 | 1.42 | 1.51 | 2.07 | 1.56 | |||||||||||||
International Streaming: | ||||||||||||||||||
Revenue | $ | 1,782 | $ | 1,921 | $ | 1,973 | $ | 2,106 | $ | 2,367 | $ | 2,575 | ||||||
Contribution Profit* | $ | 174 | $ | 188 | $ | 218 | $ | 82 | $ | 274 | $ | 400 | ||||||
Contribution Margin* | 9.8 | % | 9.8 | % | 11.0 | % | 3.9 | % | 11.6 | % | 15.5 | % | ||||||
Paid Memberships | 63.82 | 68.39 | 73.46 | 80.77 | 88.63 | 93.33 | ||||||||||||
Paid Net Additions | 5.98 | 4.58 | 5.07 | 7.31 | 7.86 | 4.70 | ||||||||||||
Free Trials | 4.48 | 4.37 | 5.17 | 7.13 | 5.00 | |||||||||||||
*Certain prior period amounts have been reclassified from G&A to Cost of revenues and Marketing and from Tech & Dev to Cost of revenues to conform to current period presentation | ||||||||||||||||||
Note: As announced in our Q3'18 investor letter, we will cease reporting end-of-quarter free trial count in January of 2020. | ||||||||||||||||||
___________________________________
3 https://s22.q4cdn.com/959853165/files/doc_financials/quarterly_reports/2018/q4/01/FINAL-Q4-18-Shareholder-Letter.pdf
4 https://s22.q4cdn.com/959853165/files/doc_financials/quarterly_reports/2018/q3/FINAL-Q3-18-Shareholder-Letter.pdf
5 https://s22.q4cdn.com/959853165/files/doc_financials/quarterly_reports/2018/q2/FINAL-Q2-18-Shareholder-Letter.pdf
6 https://s22.q4cdn.com/959853165/files/doc_financials/quarterly_reports/2018/q1/FINAL-Q1-18-Shareholder-Letter.pdf
7 https://s22.q4cdn.com/959853165/files/doc_financials/quarterly_reports/2017/q4/COMBINED-Q4-17-Shareholder-Letter-FINAL.pdf
8 https://s22.q4cdn.com/959853165/files/doc_financials/quarterly_reports/2017/q3/Q3_17_Shareholder_Letter_COMBINED.pdf
9 https://s22.q4cdn.com/959853165/files/doc_financials/quarterly_reports/2017/q2/Q2_17_Shareholder_Letter.pdf
10 https://s22.q4cdn.com/959853165/files/doc_financials/quarterly_reports/2017/q1/Q117ShareholderLetterV2FINAL.pdf
| 6 |
April 16, 2019 Earnings Interview, 3pm PST
Our video interview with Eric Sheridan of UBS will be on youtube/netflixir at 3pm PST today. Questions that investors would like to see asked should be sent to [email protected]. Reed Hastings, CEO, Spence Neumann, CFO, Ted Sarandos, Chief Content Officer, Greg Peters, Chief Product Officer and Spencer Wang, VP of IR/Corporate Development will all be on the video to answer Eric’s questions.
IR Contact: | PR Contact: |
Spencer Wang | Richard Siklos |
VP, Finance/IR & Corporate Development | VP, Corporate Communications |
408 809-5360 | 408 540-2629 |
| 7 |
Use of Non-GAAP Measures
This shareholder letter and its attachments include reference to the non-GAAP financial measure of free cash flow and EBITDA. Management believes that free cash flow and EBITDA are important liquidity metrics because they measure, during a given period, the amount of cash generated that is available to repay debt obligations, make investments and for certain other activities or the amount of cash used in operations, including investments in global streaming content. However, these non-GAAP measures should be considered in addition to, not as a substitute for or superior to, net income, operating income, diluted earnings per share and net cash provided by operating activities, or other financial measures prepared in accordance with GAAP. Reconciliation to the GAAP equivalent of these non-GAAP measures are contained in tabular form on the attached unaudited financial statements.
Forward-Looking Statements
This shareholder letter contains certain forward-looking statements within the meaning of the federal
securities laws, including statements regarding future content offerings; variability of content obligations; product tests; impact of competition; future capital raises; ARPU; global streaming membership growth; tax rate; impact of the change in corporate structure; U.S. and international streaming paid memberships, paid net additions, revenue, contribution profit (loss) and contribution margin; consolidated revenue, revenue growth, operating income, operating margin, net income, and earnings per share; and free cash flow. The forward-looking statements in this letter are subject to risks and uncertainties that could cause actual results and events to differ, including, without limitation: our ability to attract new members and retain existing members; our ability to compete effectively; maintenance and expansion of device platforms for streaming; fluctuations in consumer usage of our service; service disruptions; production risks; actions of Internet Service Providers; and, competition, including consumer adoption of different modes of viewing in-home filmed entertainment. A detailed discussion of these and other risks and uncertainties that could cause actual results and events to differ materially from such forward-looking statements is included in our filings with the Securities and Exchange Commission, including our Annual Report on Form 10-K, filed with the Securities and Exchange Commission (“SEC”) on January 29, 2019, as amended by Form 10-K/A, filed with the SEC on February 8, 2019. The Company provides internal forecast numbers. Investors should anticipate that actual performance will vary from these forecast numbers based on risks and uncertainties discussed above and in our Annual Report on Form 10-K, as amended by Form 10-K/A. We undertake no obligation to update forward-looking statements to reflect events or circumstances occurring after the date of this shareholder letter.
| 8 |
Netflix, Inc.
Consolidated Statements of Operations
(unaudited)
(in thousands, except per share data)
Three Months Ended | |||||||||||
March 31, 2019 | December 31, 2018 | March 31, 2018 | |||||||||
Revenues | $ | 4,520,992 | $ | 4,186,841 | $ | 3,700,856 | |||||
Cost of revenues | 2,870,614 | 2,733,400 | 2,300,579 | ||||||||
Marketing | 616,578 | 730,355 | 536,777 | ||||||||
Technology and development | 372,764 | 331,789 | 282,310 | ||||||||
General and administrative | 201,952 | 175,530 | 134,612 | ||||||||
Operating income | 459,084 | 215,767 | 446,578 | ||||||||
Other income (expense): | |||||||||||
Interest expense | (135,529 | ) | (128,807 | ) | (81,219 | ) | |||||
Interest and other income (expense) | 76,104 | 32,436 | (65,743 | ) | |||||||
Income before income taxes | 399,659 | 119,396 | 299,616 | ||||||||
Provision for (benefit from) income taxes | 55,607 | (14,538 | ) | 9,492 | |||||||
Net income | $ | 344,052 | $ | 133,934 | $ | 290,124 | |||||
Earnings per share: | |||||||||||
Basic | $ | 0.79 | $ | 0.31 | $ | 0.67 | |||||
Diluted | $ | 0.76 | $ | 0.30 | $ | 0.64 | |||||
Weighted-average common shares outstanding: | |||||||||||
Basic | 436,947 | 436,385 | 434,174 | ||||||||
Diluted | 451,922 | 451,116 | 450,359 | ||||||||
| 9 |
Netflix, Inc.
Consolidated Balance Sheets
(unaudited)
(in thousands)
As of | |||||||
March 31, 2019 | December 31, 2018 | ||||||
Assets | |||||||
Current assets: | |||||||
Cash and cash equivalents | $ | 3,348,557 | $ | 3,794,483 | |||
Current content assets, net | — | 5,151,186 | |||||
Other current assets | 820,350 | 748,466 | |||||
Total current assets | 4,168,907 | 9,694,135 | |||||
Non-current content assets, net | 20,888,785 | 14,960,954 | |||||
Property and equipment, net | 434,372 | 418,281 | |||||
Other non-current assets | 1,726,568 | 901,030 | |||||
Total assets | $ | 27,218,632 | $ | 25,974,400 | |||
Liabilities and Stockholders' Equity | |||||||
Current liabilities: | |||||||
Current content liabilities | $ | 4,863,351 | $ | 4,686,019 | |||
Accounts payable | 439,496 | 562,985 | |||||
Accrued expenses and other liabilities | 746,268 | 477,417 | |||||
Deferred revenue | 808,692 | 760,899 | |||||
Total current liabilities | 6,857,807 | 6,487,320 | |||||
Non-current content liabilities | 3,560,364 | 3,759,026 | |||||
Long-term debt | 10,305,023 | 10,360,058 | |||||
Other non-current liabilities | 792,380 | 129,231 | |||||
Total liabilities | 21,515,574 | 20,735,635 | |||||
Stockholders' equity: | |||||||
Common stock | 2,439,773 | 2,315,988 | |||||
Accumulated other comprehensive loss | (25,600 | ) | (19,582 | ) | |||
Retained earnings | 3,288,885 | 2,942,359 | |||||
Total stockholders' equity | 5,703,058 | 5,238,765 | |||||
Total liabilities and stockholders' equity | $ | 27,218,632 | $ | 25,974,400 | |||
| 10 |
Netflix, Inc.
Consolidated Statements of Cash Flows
(unaudited)
(in thousands)
Three Months Ended | |||||||||||
March 31, 2019 | December 31, 2018 | March 31, 2018 | |||||||||
Cash flows from operating activities: | |||||||||||
Net income | $ | 344,052 | $ | 133,934 | $ | 290,124 | |||||
Adjustments to reconcile net income to net cash used in operating activities: | |||||||||||
Additions to streaming content assets | (2,997,746 | ) | (3,784,252 | ) | (2,986,747 | ) | |||||
Change in streaming content liabilities | (14,698 | ) | 266,653 | 378,885 | |||||||
Amortization of streaming content assets | 2,124,686 | 2,053,660 | 1,748,844 | ||||||||
Amortization of DVD content assets | 8,509 | 8,965 | 11,134 | ||||||||
Depreciation and amortization of property, equipment and intangibles | 23,561 | 23,219 | 19,041 | ||||||||
Stock-based compensation expense | 101,200 | 88,714 | 68,395 | ||||||||
Other non-cash items | 37,199 | 9,336 | 8,209 | ||||||||
Foreign currency remeasurement loss (gain) on long-term debt | (57,600 | ) | (21,953 | ) | 41,080 | ||||||
Deferred taxes | 6,627 | (14,479 | ) | (22,049 | ) | ||||||
Changes in operating assets and liabilities: | |||||||||||
Other current assets | (32,076 | ) | (88,359 | ) | (55,905 | ) | |||||
Accounts payable | (124,467 | ) | 121,831 | 74,083 | |||||||
Accrued expenses and other liabilities | 157,647 | (49,776 | ) | 119,049 | |||||||
Deferred revenue | 47,793 | 44,176 | 55,270 | ||||||||
Other non-current assets and liabilities | (4,486 | ) | (26,741 | ) | 13,830 | ||||||
Net cash used in operating activities | (379,799 | ) | (1,235,072 | ) | (236,757 | ) | |||||
Cash flows from investing activities: | |||||||||||
Acquisition of DVD content assets | (9,170 | ) | (7,507 | ) | (10,796 | ) | |||||
Purchases of property and equipment | (60,381 | ) | (70,120 | ) | (37,170 | ) | |||||
Change in other assets | (10,552 | ) | (2,731 | ) | (1,786 | ) | |||||
Net cash used in investing activities | (80,103 | ) | (80,358 | ) | (49,752 | ) | |||||
Cash flows from financing activities: | |||||||||||
Proceeds from issuance of debt | — | 2,061,852 | — | ||||||||
Debt issuance costs | — | (18,879 | ) | — | |||||||
Proceeds from issuance of common stock | 22,972 | 11,450 | 56,335 | ||||||||
Other financing activities | — | (559 | ) | (321 | ) | ||||||
Net cash provided by financing activities | 22,972 | 2,053,864 | 56,014 | ||||||||
Effect of exchange rate changes on cash, cash equivalents, and restricted cash | (5,014 | ) | (4,957 | ) | 7,177 | ||||||
Net increase (decrease) in cash, cash equivalents, and restricted cash | (441,944 | ) | 733,477 | (223,318 | ) | ||||||
Cash, cash equivalents and restricted cash at beginning of period | 3,812,041 | 3,078,564 | 2,822,795 | ||||||||
Cash, cash equivalents and restricted cash at end of period | $ | 3,370,097 | $ | 3,812,041 | $ | 2,599,477 | |||||
Three Months Ended | |||||||||||
March 31, 2019 | December 31, 2018 | March 31, 2018 | |||||||||
Non-GAAP free cash flow reconciliation: | |||||||||||
Net cash used in operating activities | $ | (379,799 | ) | $ | (1,235,072 | ) | $ | (236,757 | ) | ||
Acquisition of DVD content assets | (9,170 | ) | (7,507 | ) | (10,796 | ) | |||||
Purchases of property and equipment | (60,381 | ) | (70,120 | ) | (37,170 | ) | |||||
Change in other assets | (10,552 | ) | (2,731 | ) | (1,786 | ) | |||||
Non-GAAP free cash flow | $ | (459,902 | ) | $ | (1,315,430 | ) | $ | (286,509 | ) | ||
| 11 |
Netflix, Inc.
Segment Information
(unaudited)
(in thousands)
As of / Three Months Ended | |||||||||||
March 31, 2019 | December 31, 2019 | March 31, 2018 | |||||||||
Domestic Streaming | |||||||||||
Paid memberships at end of period | 60,229 | 58,486 | 55,087 | ||||||||
Paid net membership additions | 1,743 | 1,529 | 2,277 | ||||||||
Free trials | 1,563 | 2,065 | 1,618 | ||||||||
Revenues | $ | 2,073,555 | $ | 1,996,092 | $ | 1,820,019 | |||||
Cost of revenues | 1,139,535 | 1,093,446 | 936,480 | ||||||||
Marketing | 221,046 | 312,739 | 250,719 | ||||||||
Contribution profit | 712,974 | 589,907 | 632,820 | ||||||||
International Streaming | |||||||||||
Paid memberships at end of period | 88,634 | 80,773 | 63,815 | ||||||||
Paid net membership additions | 7,861 | 7,308 | 5,981 | ||||||||
Free trials | 5,003 | 7,131 | 4,475 | ||||||||
Revenues | $ | 2,366,749 | $ | 2,105,592 | $ | 1,782,086 | |||||
Cost of revenues | 1,697,121 | 1,606,275 | 1,321,706 | ||||||||
Marketing | 395,532 | 417,616 | 286,058 | ||||||||
Contribution profit | 274,096 | 81,701 | 174,322 | ||||||||
Domestic DVD | |||||||||||
Paid memberships at end of period | 2,565 | 2,706 | 3,138 | ||||||||
Free trials | 22 | 25 | 29 | ||||||||
Revenues | $ | 80,688 | $ | 85,157 | $ | 98,751 | |||||
Cost of revenues | 33,958 | 33,679 | 42,393 | ||||||||
Contribution profit | 46,730 | 51,478 | 56,358 | ||||||||
Consolidated | |||||||||||
Revenues | $ | 4,520,992 | $ | 4,186,841 | $ | 3,700,856 | |||||
Cost of revenues | 2,870,614 | 2,733,400 | 2,300,579 | ||||||||
Marketing | 616,578 | 730,355 | 536,777 | ||||||||
Contribution profit | 1,033,800 | 723,086 | 863,500 | ||||||||
Other operating expenses | 574,716 | 507,319 | 416,922 | ||||||||
Operating income | 459,084 | 215,767 | 446,578 | ||||||||
Other expense | (59,425 | ) | (96,371 | ) | (146,962 | ) | |||||
Provision for (benefit from) income taxes | 55,607 | (14,538 | ) | 9,492 | |||||||
Net income | $ | 344,052 | $ | 133,934 | $ | 290,124 | |||||
| 12 |
Netflix, Inc.
Non-GAAP Information
(unaudited)
(in thousands)
March 31, 2018 | June 30, 2018 | September 30, 2018 | December 31, 2018 | March 31, 2019 | |||||||||||||||
Non-GAAP Adjusted EBITDA reconciliation: | |||||||||||||||||||
GAAP net income | $ | 290,124 | $ | 384,349 | $ | 402,835 | $ | 133,934 | $ | 344,052 | |||||||||
Add: | |||||||||||||||||||
Other expense | 146,962 | 33,577 | 101,858 | 96,371 | 59,425 | ||||||||||||||
Provision for (benefit from) income taxes | 9,492 | 44,287 | (24,025 | ) | (14,538 | ) | 55,607 | ||||||||||||
Depreciation and amortization of property, equipment and intangibles | 19,041 | 19,736 | 21,161 | 23,219 | 23,561 | ||||||||||||||
Stock-based compensation expense | 68,395 | 81,232 | 82,316 | 88,714 | 101,200 | ||||||||||||||
Adjusted EBITDA | $ | 534,014 | $ | 563,181 | $ | 584,145 | $ | 327,700 | $ | 583,845 | |||||||||
| 13 |