Form 8-K NEWPARK RESOURCES INC For: Nov 29
UNITED STATES
SECURITIES AND EXCHANGE COMMISSION
Washington, D.C. 20549
FORM 8-K
CURRENT REPORT
Pursuant to Section 13 or 15(d) of The Securities Exchange Act of 1934
Date of Report (Date of earliest event reported): November 29, 2018

NEWPARK RESOURCES, INC.
(Exact name of registrant as specified in its charter)
Delaware | 001-02960 | 72-1123385 | ||
(State or other jurisdiction of incorporation) | (Commission File Number) | (IRS Employer Identification No.) | ||
9320 Lakeside Boulevard, Suite 100 The Woodlands, TX | 77381 | |
(Address of principal executive offices) | (Zip Code) | |
Registrant's telephone number, including area code: (281) 362-6800
Not Applicable |
(Former name or former address, if changed since last report.)
Check the appropriate box below if the Form 8-K filing is intended to simultaneously satisfy the filing obligation of the registrant under any of the following provisions:
p | Written communications pursuant to Rule 425 under the Securities Act (17 CFR 230.425) |
p | Soliciting material pursuant to Rule 14a-12 under the Exchange Act (17 CFR 240.14a-12) |
p | Pre-commencement communications pursuant to Rule 14d-2(b) under the Exchange Act (17 CFR 240.14d-2(b)) |
p | Pre-commencement communications pursuant to Rule 13e-4(c) under the Exchange Act (17 CFR 240.13a-4(c)) |
Indicate by check mark whether the registrant is an emerging growth company as defined in Rule 405 of the Securities Act of 1933 (§230.405 of this chapter) or Rule 12b-2 of the Securities Exchange Act of 1934 (§240.12b-2 of this chapter).
Emerging growth company ☐
If an emerging growth company, indicate by check mark if the registrant has elected not to use the extended transition period for complying with any new or revised financial accounting standards provided pursuant to Section 13(a) of the Exchange Act. ☐
Item 7.01. Regulation FD Disclosure.
Newpark Resources, Inc. (the “Company”) has prepared presentation materials (the “Presentation Materials”) that management intends to use in connection with a meeting with industry analysts and investors being hosted by the Company in Carencro, Louisiana on November 29, 2018. The meeting, including the question and answer session following immediately thereafter, will be webcast live to the general public as previously announced via a press release issued by the Company on November 26, 2018. The Company may use the Presentation Materials, possibly with modifications, in presentations to current and potential investors, lenders, creditors, insurers, vendors, customers, employees and others with an interest in the Company and its business.
The information contained in the Presentation Materials is summary information that should be considered in the context of the Company’s filings with the Securities and Exchange Commission and other public announcements that the Company may make by press release or otherwise from time to time. The Presentation Materials speak as of the date of this Current Report on Form 8-K. While the Company may elect to update the Presentation Materials in the future or reflect events and circumstances occurring or existing after the date of this Current Report on Form 8-K, the Company specifically disclaims any obligation to do so. The Presentation Materials are furnished as Exhibit 99.1 to this Current Report on Form 8-K and are incorporated herein by reference. The Presentation Materials will also be posted in the Investor Information section of the Company’s website, http://www.newpark.com for up to 90 days.
The information referenced under Item 7.01 (including Exhibit 99.1 referenced in Item 9.01 below) of this Current Report on Form 8-K is being “furnished” under “Item 7.01. Regulation FD Disclosure” and, as such, shall not be deemed to be “filed” for the purposes of Section 18 of the Securities Exchange Act of 1934, as amended (the “Exchange Act”), or otherwise subject to the liabilities of that Section. The information set forth in this Current Report on Form 8-K (including Exhibit 99.1 referenced in Item 9.01 below) shall not be incorporated by reference into any registration statement, report or other document filed by the Company pursuant to the Securities Act of 1933, as amended (the “Securities Act”), except as shall be expressly set forth by specific reference in such filing.
Use of Non-GAAP Financial Information
To help understand the Company’s financial performance, the Company has supplemented its financial results that it provides in accordance with generally accepted accounting principles (“GAAP”) with the non-GAAP financial measure of earnings before interest, taxes, depreciation and amortization (“EBITDA”).
We believe this non-GAAP financial measure is frequently used by investors, securities analysts and other parties in the evaluation of our performance and/or that of other companies in our industry. In addition, management uses this measure to evaluate operating performance, and our annual cash incentive compensation plan has included performance metrics based on our consolidated EBITDA, along with other factors. The methods we use to produce this non-GAAP financial measure may differ from methods used by other companies. This measure should be considered in addition to, not as a substitute for, financial measures prepared in accordance with GAAP. Applicable reconciliations to the nearest GAAP financial measure are included in the attached Exhibit 99.1.
Item 9.01. Financial Statements and Exhibits.
(d) | Exhibits | |||
Exhibit No. | Description | |||
99.1 | ||||
SIGNATURES
Pursuant to the requirements of the Securities Exchange Act of 1934, the registrant has duly caused this report to be signed on its behalf by the undersigned hereunto duly authorized.
NEWPARK RESOURCES, INC. | |||
(Registrant) | |||
Date: | November 29, 2018 | By: | /s/ Gregg S. Piontek |
Gregg S. Piontek | |||
Senior Vice President and Chief Financial Officer | |||
(Principal Financial Officer) | |||

NEWPARK RESOURCES PRESENTATION NOVEMBER 2018

FORWARD LOOKING STATEMENTS This presentation contains “forward-looking statements” within the meaning of the Private Securities Litigation Reform Act of 1995, as amended. All statements that address expectations or projections about the future, including Newpark's strategy for growth, product development, market position, expected expenditures and future financial results are forward- looking statements. Words such as “will,” “may,” “could,” “would,” “should,” “anticipates,” “believes,” “estimates,” “expects,” “plans,” “intends,” and similar expressions are intended to identify these forward-looking statements but are not the exclusive means of identifying them. These statements are not guarantees of future performance and involve a number of risks, uncertainties and assumptions. Many factors, including those discussed more fully elsewhere in this release and in documents filed with the Securities and Exchange Commission by Newpark, particularly its Annual Report on Form 10-K for the year ended December 31, 2017, as well as others, could cause results to differ materially from those expressed in, or implied by, these statements. These risk factors include, but are not limited to, risks related to the worldwide oil and natural gas industry, our customer concentration and reliance on the U.S. exploration and production market, risks related to our international operations, our ability to replace existing contracts, the cost and continued availability of borrowed funds including noncompliance with debt covenants, operating hazards present in the oil and natural gas industry, our ability to execute our business strategy and make successful business acquisitions and capital investments, the availability of raw materials or the impact of tariffs on the cost of such raw materials, the availability of skilled personnel, our market competition, our ability to expand our product and service offerings and enter new customer markets with our existing products, compliance with legal and regulatory matters, including environmental regulations, the availability of insurance and the risks and limitations of our insurance coverage, the ongoing impact of the U.S. Tax Cuts and Jobs Act and the refinement of provisional estimates, potential impairments of long-lived intangible assets, technological developments in our industry, risks related to severe weather, particularly in the U.S. Gulf Coast, cybersecurity breaches or business system disruptions and risks related to the fluctuations in the market value of our common stock. Newpark's filings with the Securities and Exchange Commission can be obtained at no charge at www.sec.gov, as well as through our website at www.newpark.com. We assume no obligation to update, amend or clarify publicly any forward-looking statements, whether as a result of new information, future events or otherwise, except as required by securities laws. In light of these risks, uncertainties and assumptions, the forward-looking events discussed in this presentation might not occur. 2

NON-GAAP FINANCIAL MEASURES To help understand the Company’s financial performance, the Company has supplemented its financial results that it provides in accordance with generally accepted accounting principles (“GAAP”) with the non-GAAP financial measure of earnings before interest, taxes, depreciation and amortization (“EBITDA”). We believe this non-GAAP financial measure is frequently used by investors, securities analysts and other parties in the evaluation of our performance and/or that of other companies in our industry. In addition, management uses this measure to evaluate operating performance, and our annual cash incentive compensation plan has included performance metrics based on our consolidated EBITDA, along with other factors. The methods we use to produce this non-GAAP financial measure may differ from methods used by other companies. This measure should be considered in addition to, not as a substitute for, financial measures prepared in accordance with GAAP. 3

COMPANY OVERVIEW Consolidated Revenues $1,400 . Revenue recovery driven by oilfield Full Year $1,200 $1,118 activity increase and end-market $1,042 First Nine Months diversification initiatives $1,000 $800 $748 Balanced income contribution from $677 . $600 $699 two operating segments: $471 $543 Revenues ($ Revenues millions) $400 Fluids Systems 3rd largest global provider of drilling and $200 completions fluids to oil and gas exploration $0 industry** 2013 2014 2015 2016 2017 2018 Mats and Integrated Services Leading provider of engineered worksite First Nine Months 2018 - Breakdown by Segment solutions, with diversified customer base Revenue EBITDA* across industries – Oil and gas exploration 23% Fluids Systems – Electrical transmission and distribution 46% Mats and Integrated – Pipeline 54% Services 77% – Petrochemical – Construction *EBITDA is a non-GAAP financial measure. See reconciliation to the most comparable GAAP measure in the Appendix to this presentation. EBITDA contribution % based on Segment EBITDA and excludes Corporate Office expenses. 4 ** Source: 2018 Oilfield Market Report, Spears & Associates, Inc.
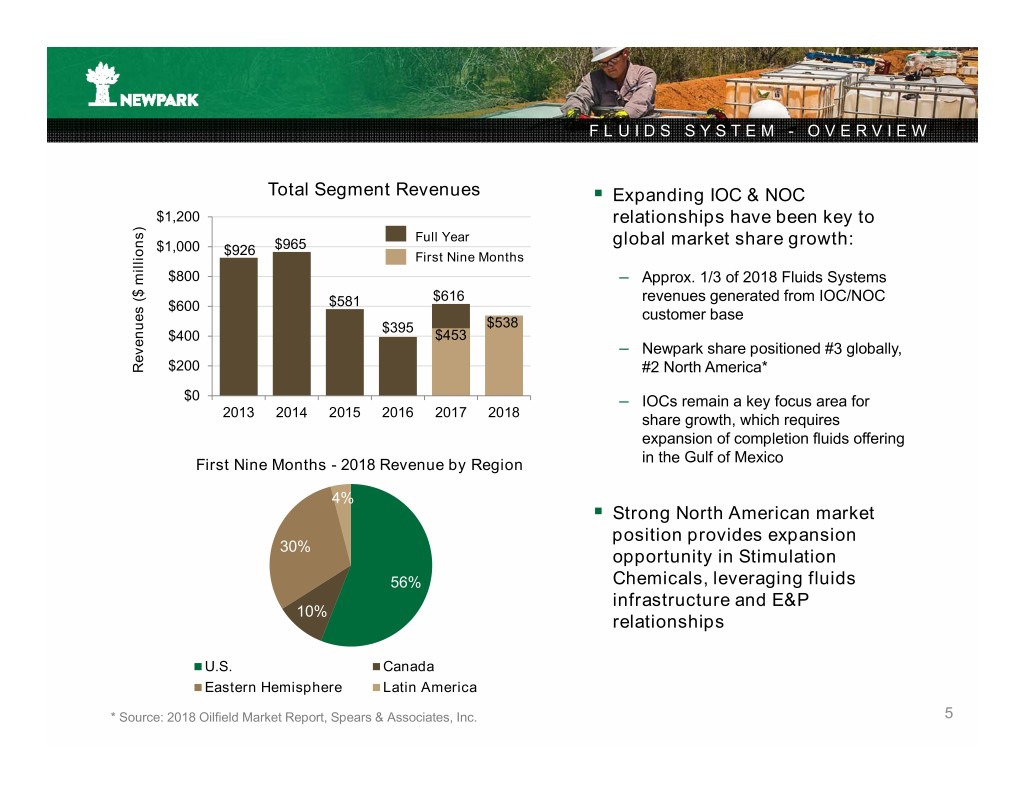
FLUIDS SYSTEM - OVERVIEW Total Segment Revenues . Expanding IOC & NOC $1,200 relationships have been key to Full Year $1,000 $965 global market share growth: $926 First Nine Months $800 – Approx. 1/3 of 2018 Fluids Systems $616 revenues generated from IOC/NOC $600 $581 customer base $395 $538 $400 $453 – Newpark share positioned #3 globally, Revenues ($ millions) Revenues ($ $200 #2 North America* $0 – IOCs remain a key focus area for 2013 2014 2015 2016 2017 2018 share growth, which requires expansion of completion fluids offering First Nine Months - 2018 Revenue by Region in the Gulf of Mexico 4% . Strong North American market position provides expansion 30% opportunity in Stimulation 56% Chemicals, leveraging fluids infrastructure and E&P 10% relationships U.S. Canada Eastern Hemisphere Latin America * Source: 2018 Oilfield Market Report, Spears & Associates, Inc. 5

COMPLETION FLUIDS

EXPANDING PRODUCT LINES – COMPLETION FLUIDS $9bn Drilling and Completion Fluids Market . Natural product line extension from drilling fluids Drilling – Transition from drilling, prepare Fluids for completion Completion Fluids – Customer-driven bundling in GOM and International markets . Operationally adjacent activities Source: 2018 Oilfield Market Report, Spears & Associates, Inc. – Common customers, competitors, cycles, supply chain and facilities Frequency of Bundled Services (Drilling & Completion Fluids) – Seamless integration of capabilities 80% 72% 70% 70% . Accretive margin profile 57% 60% 50% 50% 50% 40% 30% Estimated market size 20% 10% 0% $2.5bn Global IOCs NOCs Offshore GoM Source: Kimberlite International Oilfield Research (2018) 7

COMPLETION FLUIDS – CONSISTS OF THREE PRODUCT GROUPS . Reservoir Drill-in Fluids (RDIF) WBCU ~ 20% of spend (Tools) 9% – Non-damaging fluid for open-hole completions Filtration 10% . Wellbore Cleanup (WBCU) ~ 20% of spend Clear Brine WBCU Fluids (Chemicals) – Chemical, mechanical 49% 12% & software solutions Clear Brine Fluids (CBF) & Reservoir . Drill-In Fluids Filtration ~ 60% of spend 20% – Strategically located facilities – Significant volumes Source: Kimberlite International Oilfield Research (2018) – Strategic supply partnerships are critical 8

COMPLETION FLUIDS – SPEND VARIES BY GEOGRAPHY Spend distribution by geography* Gulf of Mexico International Offshore International Land Average spend per well ($Mil) Average spend per well ($Mil) Average spend per well ($Mil) $1.3 $0.9 $0.3 $3.1 $2.5 $0.8 Completion Fluids Completion Fluids Completion Fluids Drilling Fluids Drilling Fluids Drilling Fluids Breakdown of Breakdown of Breakdown of Completion Fluids Spend Completion Fluids Spend Completion Fluids Spend Reservoir Reservoir Clear Brine Drill-In Fluids Drill-In Reservoir Fluids 6% Fluids Filtration Clear Drill-In 18% 27% 8% Brine Fluids Fluids 36% WBCU 42% (Tools) 6% WBCU (Chemicals) 9% WBCU Filtration (Chemicals) 10% Clear Brine 22% Fluids 71% WBCU WBCU Filtration WBCU (Tools) (Chemicals) 12% (Tools) 11% 10% 12% 9 *Source: Kimberlite International Oilfield Research (2018)

COMPETITIVE ADVANTAGE IN DIVERSIFICATION Leverage complementary drilling & completion fluids capabilities . Cost efficiencies through scale and improved facility utilization . Influence purchasing decisions on fully integrated projects . Brand identity . More fully optimize facilities Technical Manufacturing Shorebase 10

FOURCHON FACILITY CONVERSION UNDERWAY Strategic facility . Well positioned in Port Fourchon . Facility conversion underway, to be operational by end of year . Robust and visible HSE program . 17,000 bbls capacity . 2 DW rigs 11
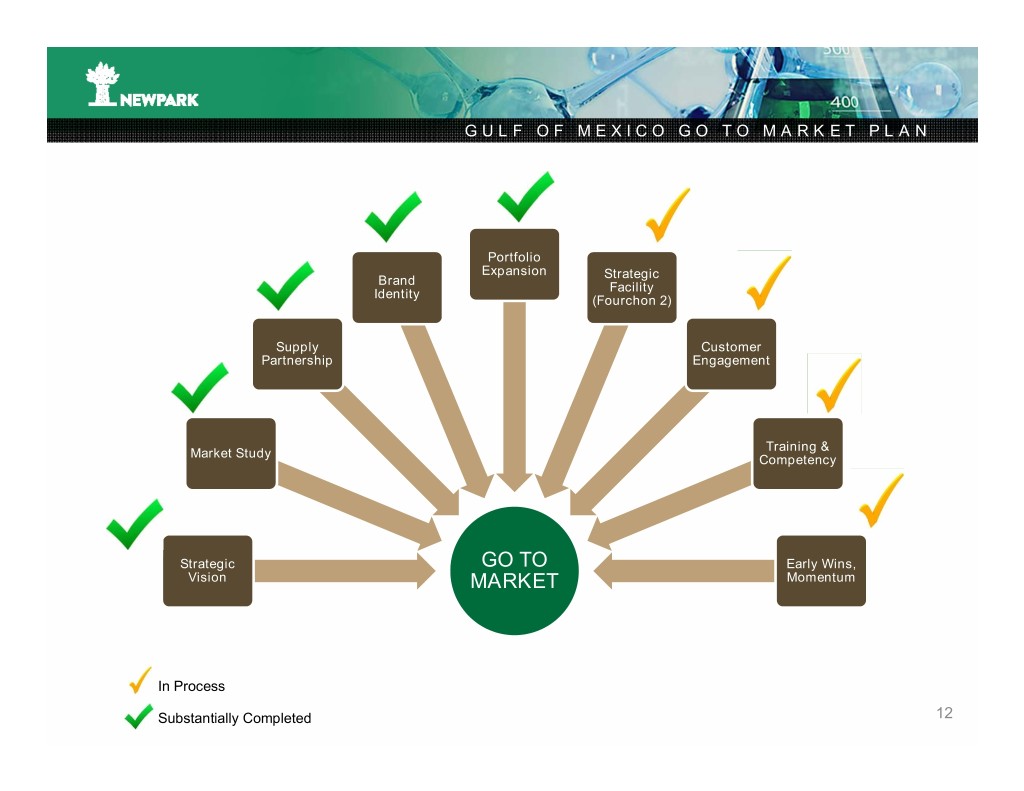
GULF OF MEXICO GO TO MARKET PLAN Portfolio Expansion Strategic Brand Facility Identity (Fourchon 2) Supply Customer Partnership Engagement Training & Market Study Competency Strategic GO TO Early Wins, Vision MARKET Momentum In Process Substantially Completed 12

STIMULATION CHEMICALS

EXPANDING PRODUCT LINES – STIMULATION CHEMICALS Frac Spread Count for week ending Nov 16th 2018 was 476 14
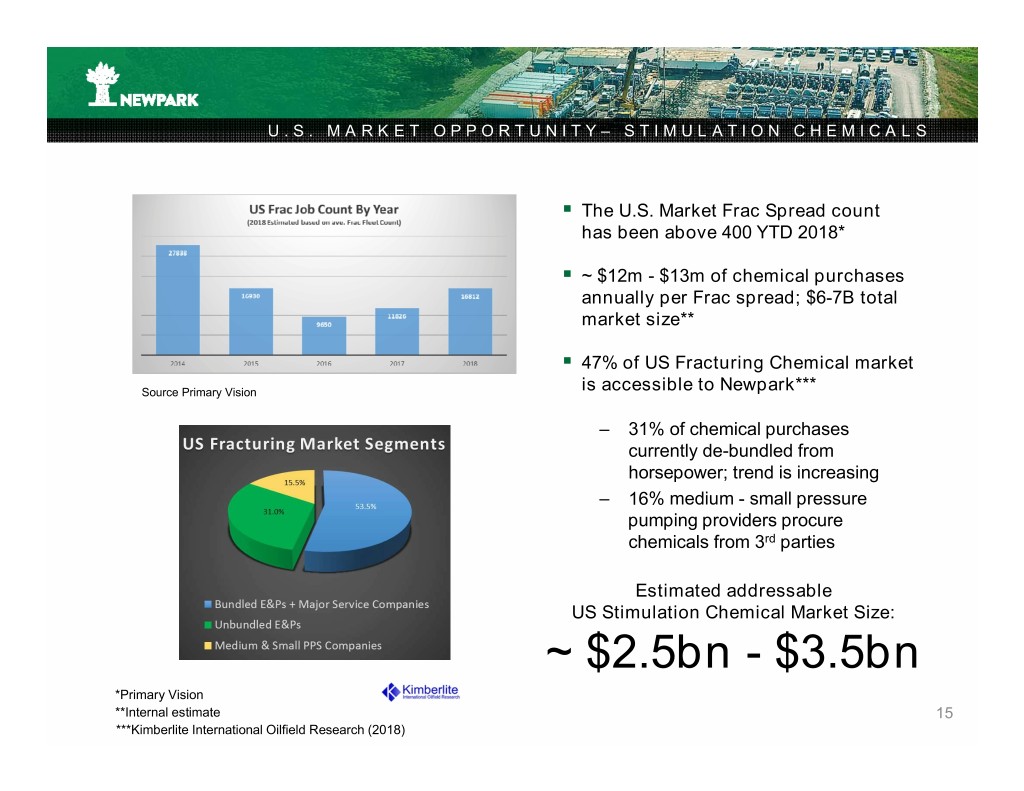
U.S. MARKET OPPORTUNITY– STIMULATION CHEMICALS . The U.S. Market Frac Spread count has been above 400 YTD 2018* . ~ $12m - $13m of chemical purchases annually per Frac spread; $6-7B total market size** . 47% of US Fracturing Chemical market Source Primary Vision is accessible to Newpark*** – 31% of chemical purchases currently de-bundled from horsepower; trend is increasing – 16% medium - small pressure pumping providers procure chemicals from 3rd parties Estimated addressable US Stimulation Chemical Market Size: ~ $2.5bn - $3.5bn *Primary Vision **Internal estimate 15 ***Kimberlite International Oilfield Research (2018)
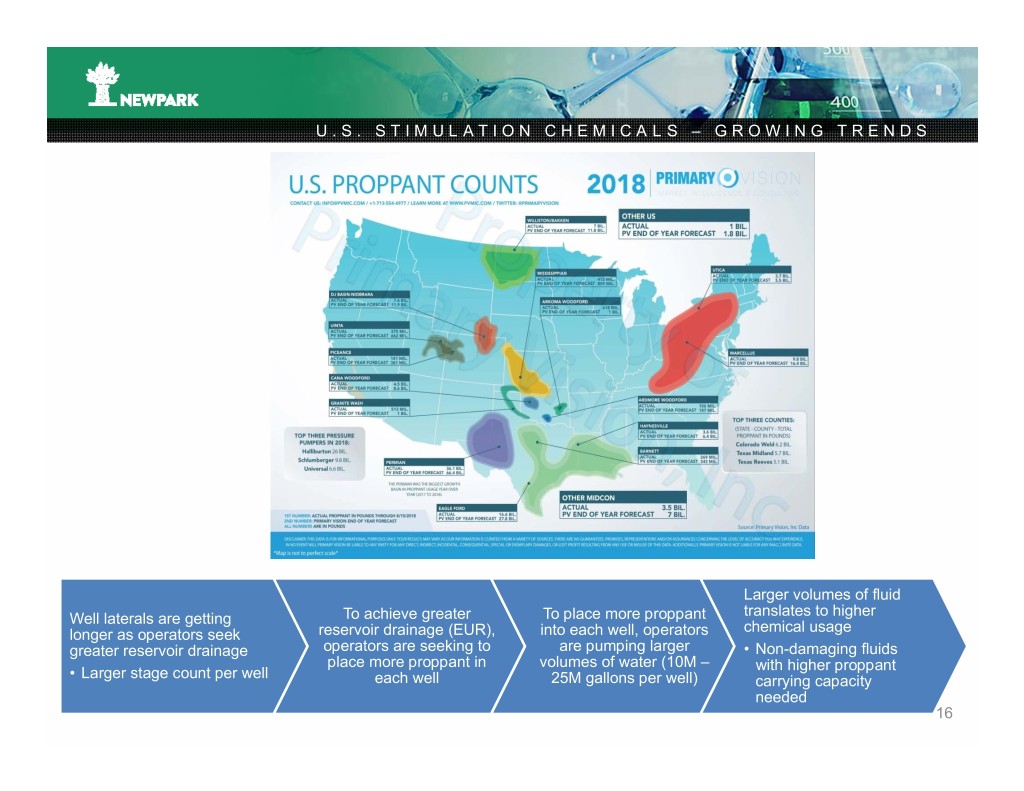
U.S. STIMULATION CHEMICALS – GROWING TRENDS Larger volumes of fluid translates to higher Well laterals are getting To achieve greater To place more proppant chemical usage longer as operators seek reservoir drainage (EUR), into each well, operators greater reservoir drainage operators are seeking to are pumping larger • Non-damaging fluids place more proppant in volumes of water (10M – with higher proppant • Larger stage count per well each well 25M gallons per well) carrying capacity needed 16

U.S. COMPETITIVE LANDSCAPE– STIMULATION CHEMICALS Competitive Chemical Purchasing Criteria Of Significance Unbundled E&Ps Medium & Small PPS Bundled E&Ps Cost Per Stage Price Per Gallon Full Service Capability Availability Of Pressure Wellsite Delivery Local Inventory Pumping Equipment Technical Lab Stage completion per Reliability Of Supply Capabilities day rate Chemical Fluids Suppliers / Newpark Competitors Full Range Of Products Unique Products Reservoir Knowledge Technical Lab Fracturing Design Technical Support Capabilities Capable Safety Record Safety Record Field Experience Key Future Competitive Advantages for Newpark: . Reservoir knowledge improvement by linking Rock Mechanics and Friction Reducer Manufacturers Geomechanics to our Fluid Design . Novel high proppant carrying fluid design through use of Fluids Technology Center (Katy, TX) 17

Hydraulic Fracturing Matrix Acidizing Chemistry need capitalizes on existing fl need capitalizes on Chemistry Delayed Wormhole Crosslinked Gels Standard Acid Linear Gels Slickwater Acid STIMULATIONCATEGORIESLINE: MAJORCOMPONENT Iron Control Agents Anti-Sludge Agents Corrosion Inhibitors Hydration Buffer Acid Emulsifiers Acid Crosslink Buffer Non-Emulsifiers Clay Control Viscoelastic Surfactant Corrosion Intensifiers Flowback Enhancers Instant &Delayed H Cross-Linkers 2 uids R&D capabilities and supply chain capabilities andsupply uids R&D S Scavengers Biocide Delayed Oxidizing Non-Emulsifier Breakers Scale Inhibitor 18
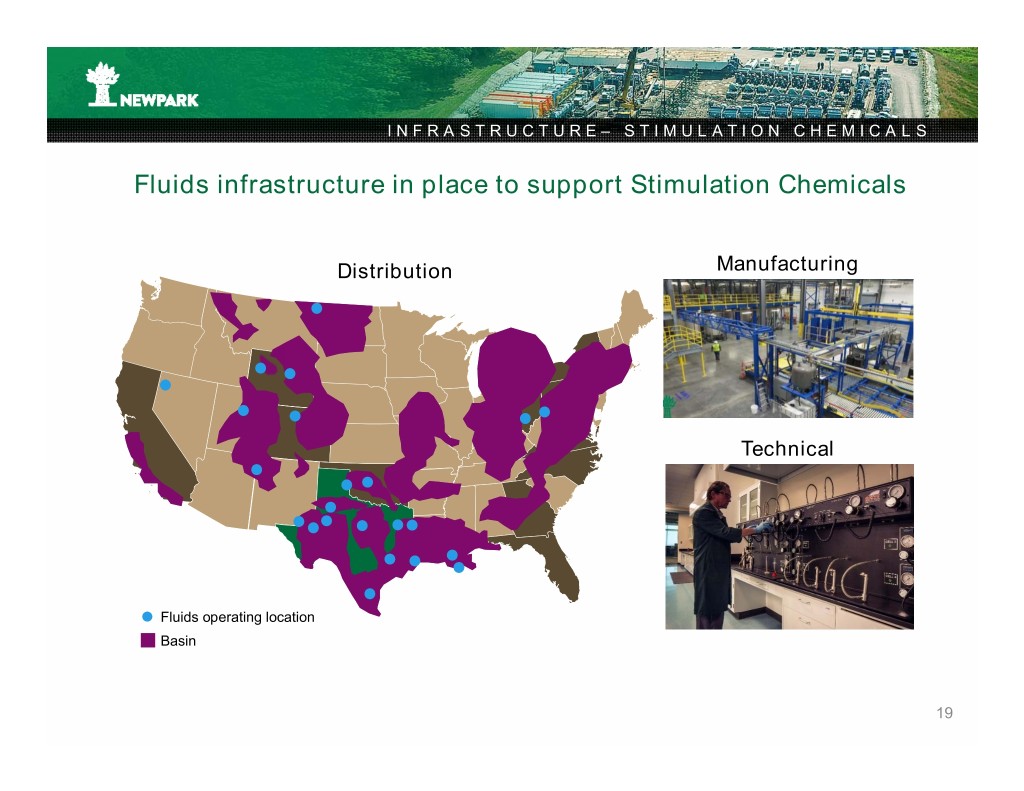
INFRASTRUCTURE– STIMULATION CHEMICALS Fluids infrastructure in place to support Stimulation Chemicals Distribution Manufacturing Technical Fluids operating location Basin 19

U.S. GO TO MARKET PLAN – STIMULATION CHEMICALS Stimulation Chemicals Manufacturing Sales Staff Market Study Facilities Local Customer Warehousing Engagement Build Full Brand Identity Product Line Strategic GO TO Field Trials/ Vision MARKET Momentum In Process Substantially Completed 20

MATS & INTEGRATED SERVICES - OVERVIEW Total Segment Revenues . Leading provider of engineered worksite and access solutions $180 Full Year $160 $153 First Nine Months – In early phases of global market $161 $140 $132 penetration, where our patented $120 $116 systems reduce operators’ costs and $100 $96 improve environmental protection $76 $90 $80 – Diversified market presence, $60 fairly balanced between E&P $40 Revenues ($ Revenues millions) and non-E&P end-markets $20 $0 2013 2014 2015 2016 2017 2018 . Revenues include rentals & service, as well as sales of manufactured matting products First Nine Months 2018 – First Nine Months 2018 – Revenue by End Market Revenue by Type – 2017 acquisition significantly NAM E&P NAM NON-E&P INT'L NON-E&P PRODUCT SALES RENTAL SERVICE expanded service revenues $11 $32 . Patented technology, service $69 capability, low manufacturing cost $66 $84 and size of composite mat rental fleet $60 provide competitive advantage 21

MATS – HIGH LEVEL OVERVIEW GENERAL INTRODUCTION

MATS – HIGH LEVEL OVERVIEW Access alternatives Longer Duration, Low Remediation Requirement Shorter Duration, High Remediation Requirement 23

MATS – HIGH LEVEL OVERVIEW Services & containment Site evaluation, planning Containment and spill ROW clearing, hydro and layout design prevention seeding Storm Water Pollution Impoundments Mat fleet management Prevention Plan/BMP 24

MATS – CORE MARKET OVERVIEW Exploration & Production Pipeline SIZE SIZE PENETRATION PENETRATION HISTORY HISTORY Transmission & Distribution Construction & Other SIZE SIZE PENETRATION PENETRATION HISTORY HISTORY 25

MATS – STRONG FOUNDATIONS Mats & Integrated Services Revenue and Operating Income $250 $80 Revenue Op Income $70 $200 $60 Oil Price $50 $150 Collapse Global Financial $40 Crisis $30 $100 Revenue ($MIL) Revenue $20 Operating Income ($MIL) $50 $10 $- $- $(10) 2003 2004 2005 2006 2007 2008 2009 2010 2011 2012 2013 2014 2015 2016 2017 2018* 2005 2007 2010 2011 2012 2013 2015 2016 2017 Completed Sold timber Rental Manufacturing Well Service Announced Manufacturing R&D Acquired Well acquisition mill and exited expansion line began Group began $40M capital expansion Center Service which included wood mat into running 24/7 providing mat project to expand project completed Group/Utility Dura-Base manufacturing; Northeast to support installation in manufacturing completed Access composite mat acquired SEM Region oilfield Northeast capacity and Solutions technology Construction, demand R&D Center and expanding Focused manufacturing R&S business Acquired Terrafirma business on key facility in Colorado Roadways expanding Industry R&S business into Verticals Europe 26 * Reflects first nine months annualized

MATS – HIGH LEVEL OVERVIEW Changing matting landscape Pre 2007 Today Timber Composite Demonstrating Value and Capturing Share 27

MATS – VALUE PROPOSITION Lower Customer Operating Risk Safety Scale & Reliability Efficiency Environmental Sustainability 28

MATS – UNIQUE HISTORY PROVIDES SUCCESS FOUNDATIONS Belief in Innovation . Introduced the world to Composite matting technology . 20 Years of DURA-BASE as the industry standard . Continual investment in technology & productivity Scaled to Succeed . Operating largest fleet of DURA-BASE mats in the world . Advantaged domestic and International footprint . Continuous investment in manufacturing capacity & agility Proven Record in Delivering . Transformed NE containment market to DURA-BASE . Uniquely positioned to repeat success in T&D and Pipeline 29

MATS & INTEGRATED SERVICES MARKET OPPORTUNITY

MATS – EXPLORATION & PRODUCTION Annual Spend Annual Growth 2013-18 Forecast Growth 2018-23 $76.7bn* -11.8%* 4.1%* $7.30 $12.40 Other Support Natural Gas Services Key Demand Drivers Well Support Services . Global O&G prices $15.30 . Producers drive for efficiency Oil Drilling . Regulatory / Environmental framework Services Oilfield . Midstream capacity constraints Support Services . Shift to containerized proppants $41.70 * Source: IBISWorld Industry Report 21311 – Oil & Gas Field Services in the U.S. – August 2018 31

MATS – EXPLORATION & PRODUCTION Annual Spend Annual Growth 2013-18 Forecast Growth 2018-23 $76.7bn* -11.8%* 4.1%* Other OtherSupport NA Market Support NaturalNatural Gas Gas Services Well SupportWell SupportServices Opportunity ServicesServices ** Oil DrillingOil Drilling Services Oilfield Services Support Oilfield $0.5bn ServicesSupport Services $41.70 *Source: IBISWorld Industry Report 21311 – Oil & Gas Field Services in the U.S. – August 2018 32 **Internal estimates

MATS – EXPLORATION & PRODUCTION Growth of gravity fed proppant delivery U.S. Frac Spread Count ~440 ~370 ~150 ~50 ~320 ~290 CY’17 CY’18 Source: Internal Estimates . Significant YoY growth in gravity fed proppant systems Gravity Fed Pneumatic / Other . Dynamic load conditions demand a durable interlocking surface . Made for DURA-BASE . Short turnaround, rapid deployment & servicing favor scaled service provider 33

MATS – EXPLORATION & PRODUCTION Servicing Major Shale Basins Targeted Customer Base . E&P companies . Pressure Pumping companies . Service companies Key Success Factors . Large-scale fit-for-purpose fleet . Expert service and product offering . Ability to provide Partner operating location products/services in diverse Mats operating location locations Basin . Ability to satisfy environmental requirements . Ability to quickly adopt new technology . Access to skilled labor 34

MATS – UTILITY TRANSMISSION AND DISTRIBUTION Annual Spend Annual Growth 2012-17 Forecast Growth 2017-22 $46.3bn* -0.9%* 4.0%* $7.30 $15.10 Key Demand Drivers Telco Construction (for Access Products) & Repair Transmission . Aging infrastructure, grid hardening Construction Power & Repair . Substation upgrade programs Plant . Environmental regulations $10.80 Construction & Repair and sensitivity Other . Location / Terrain Construction . Weather & Services $13.10 * Source: IBISWorld Industry Report 23713 – Transmission Line Construction in the U.S. – September 2017 35
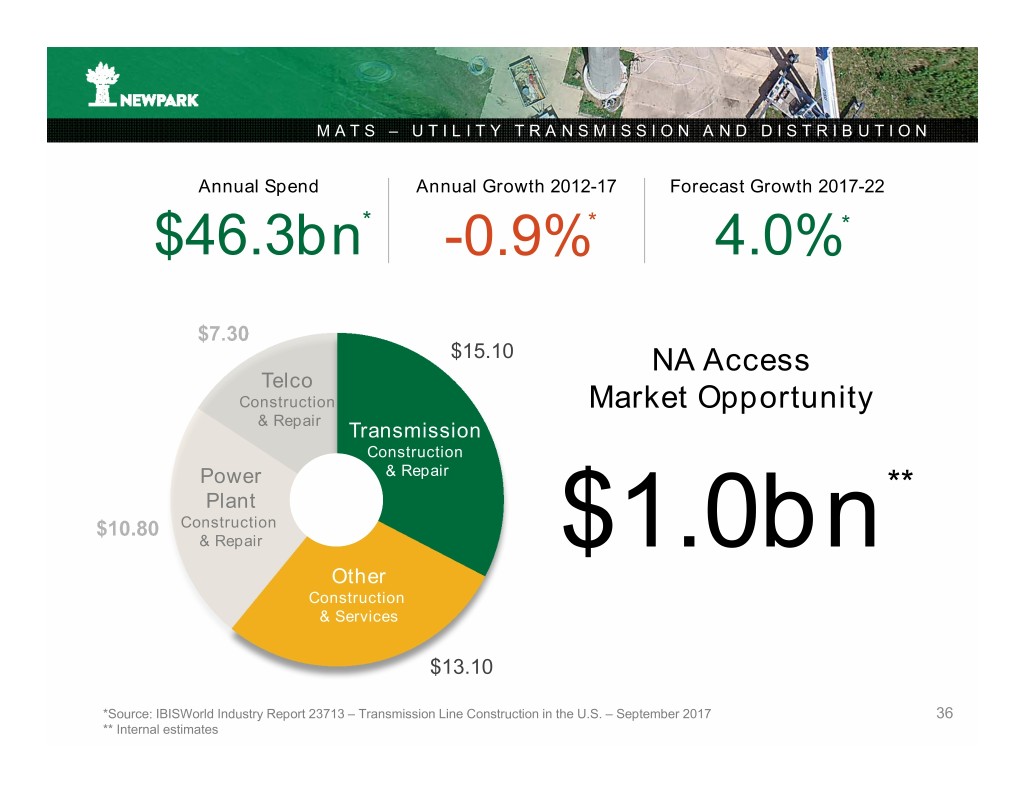
MATS – UTILITY TRANSMISSION AND DISTRIBUTION Annual Spend Annual Growth 2012-17 Forecast Growth 2017-22 $46.3bn* -0.9%* 4.0%* $15.10 NA Access Telco Construction Market Opportunity & Repair Transmission Construction Power & Repair Plant ** Construction & Repair $1.0bn Other Construction & Services $13.10 *Source: IBISWorld Industry Report 23713 – Transmission Line Construction in the U.S. – September 2017 36 ** Internal estimates

MATS – UTILITY TRANSMISSION & DISTRIBUTION % Of Total Market Spend By State* Targeted Customer Base . Utility Companies . EPC Companies . Construction Service Companies Key Success Factors . Large-scale fleet . Expert service and product offering . Ability to provide products/services in diverse locations Partner operating location . Ability to satisfy environmental Mats operating location requirements < 3% . Ability to quickly adopt new > 3% technology . Access to skilled labor *Source: IBISWorld Industry Report 23713 – Transmission Line Construction in the U.S. – September 2017 37
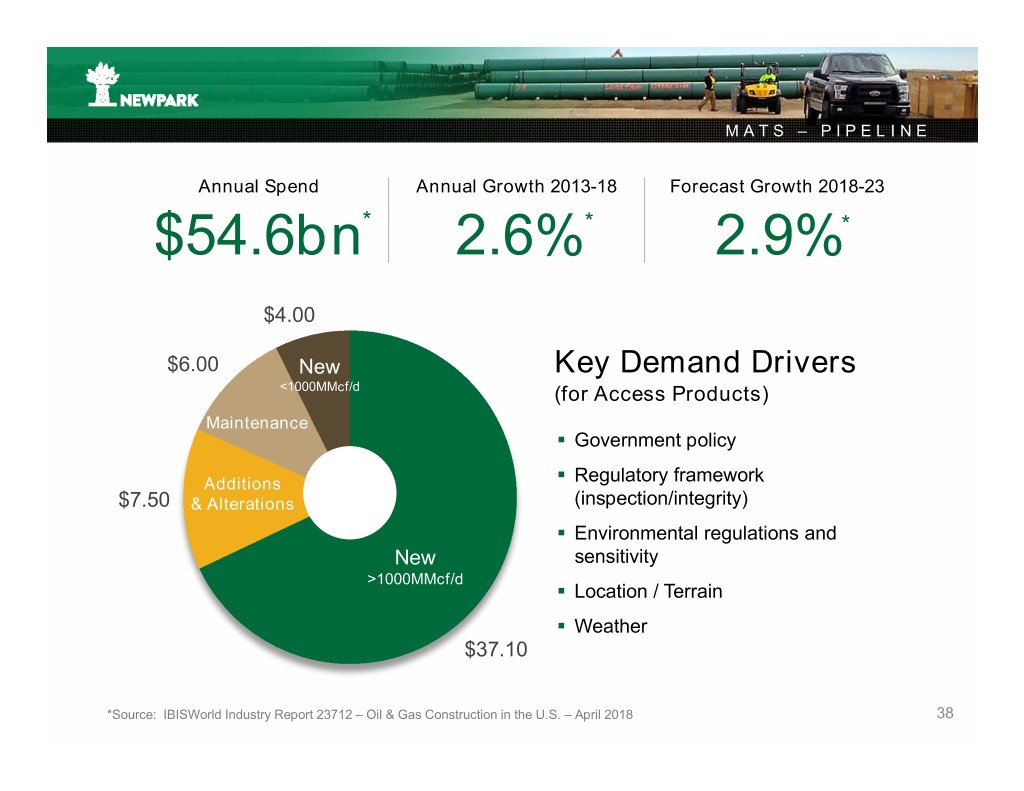
MATS – PIPELINE Annual Spend Annual Growth 2013-18 Forecast Growth 2018-23 $54.6bn* 2.6%* 2.9%* $4.00 $6.00 New Key Demand Drivers <1000MMcf/d (for Access Products) Maintenance . Government policy Additions . Regulatory framework $7.50 & Alterations (inspection/integrity) . Environmental regulations and New sensitivity >1000MMcf/d . Location / Terrain . Weather $37.10 *Source: IBISWorld Industry Report 23712 – Oil & Gas Construction in the U.S. – April 2018 38

MATS – PIPELINE Annual Spend Annual Growth 2013-18 Forecast Growth 2018-23 $54.6bn* 2.6%* 2.9%* $4.00 $6.00 New NA Access <1000MMcf/d Market Opportunity Maintenance Additions ** $7.50 & Alterations $1.0bn New >1000MMcf/d *Source: IBISWorld Industry Report 23712 – Oil & Gas Construction in the U.S. – April 2018 39 **Internal estimates

MATS – PIPELINE % Of Total Market Spend By State* Targeted Customer Base . Pipeline Operators . EPC Companies . Integrity/Inspection Companies . Construction Service Companies Key Success Factors . Large-scale fleet . Expert service and product offering . Ability to provide Partner operating location products/services in diverse Mats operating location locations < 3% . Ability to manage environmental 3% - 10% requirements 10% - 20% 20% + . Access to skilled labor *Source: IBISWorld Industry Report 23713 – Transmission Line Construction in the U.S. – September 2017 40

MATS – GENERAL CONSTRUCTION Annual Spend Annual Growth 2013-18 Forecast Growth 2018-23 $28.1bn* -0.9%* -0.5%* $4.03 $7.25 Tunnel, Outdoor, Key Demand Drivers Harbor (for Access Products) $2.50 & port Mass transit & railroad . Population growth Conservation & infrastructure demand $3.00 . Environmental regulations Hydro‐electric and sensitivity . Location / Terrain Marine Other $6.02 . Weather $5.30 *Source: IBISWorld Industry Report 23799– Heavy Engineering Construction in the US – October 2018 41

MATS – GENERAL CONSTRUCTION Annual Spend Annual Growth 2013-18 Forecast Growth 2018-23 $28.1bn* -0.9%* -0.5%* $4.03 $7.25 Tunnel, NA Access Outdoor, Harbor Market Opportunity $2.50 & port Mass transit & railroad Conservation ** $3.00 Hydro‐electric $0.5bn Marine Other $6.02 $5.30 *Source: IBISWorld Industry Report 23799– Heavy Engineering Construction in the US – October 2018 42 **Internal Estimates
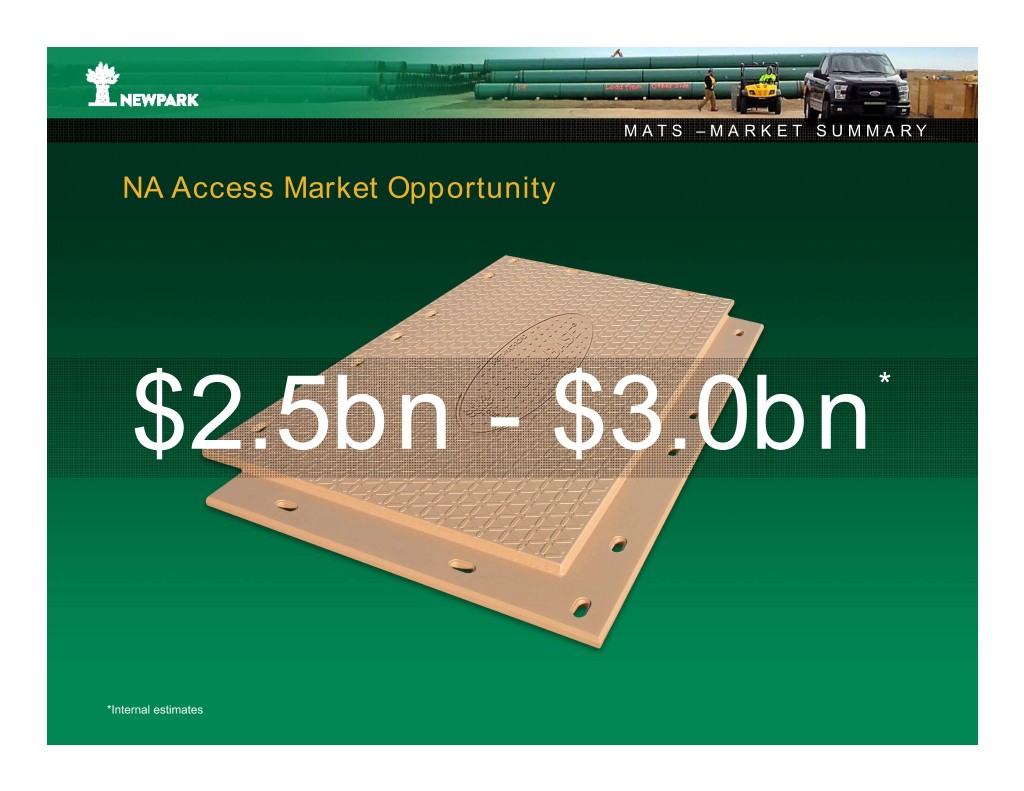
MATS –MARKET SUMMARY NA Access Market Opportunity $2.5bn - $3.0bn* *Internal estimates

MATS & INTEGRATED SERVICES BUILT TO SUCCEED OPERATING FOOTPRINT BUSINESS MODEL ENVIRONMENTAL SUSTAINABILITY INNOVATION PIPELINE
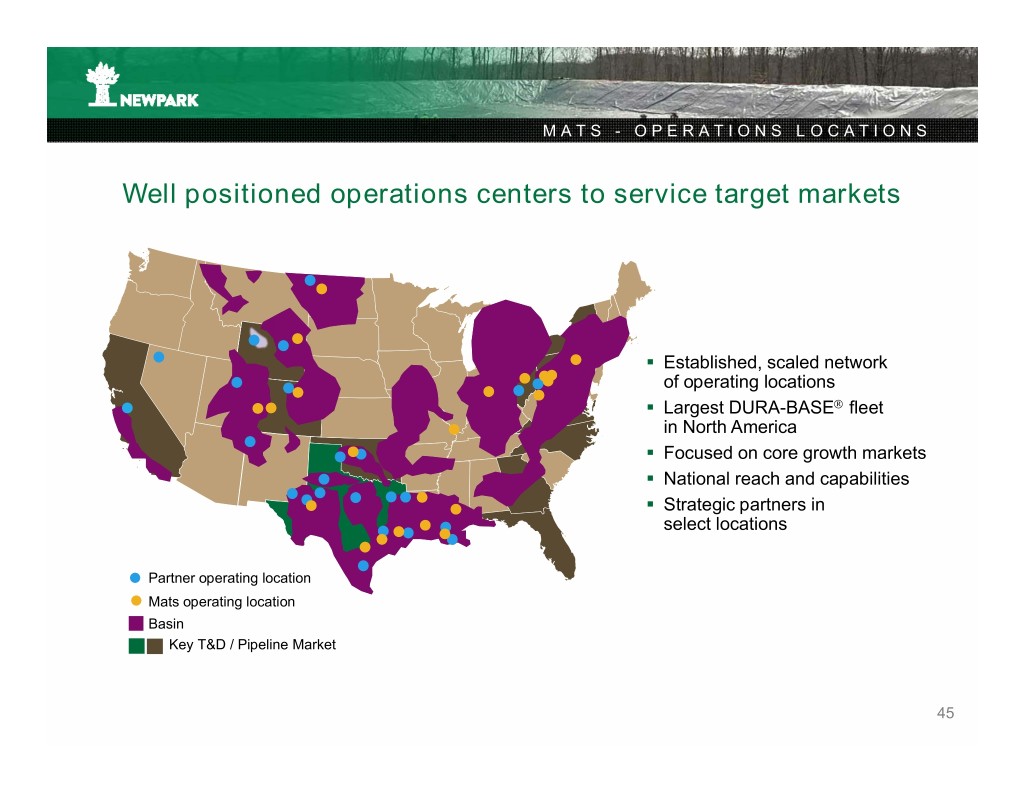
MATS - OPERATIONS LOCATIONS Well positioned operations centers to service target markets . Established, scaled network of operating locations . Largest DURA-BASE fleet in North America . Focused on core growth markets . National reach and capabilities . Strategic partners in select locations Partner operating location Mats operating location Basin Key T&D / Pipeline Market 45

MATS– REVENUES FROM PRODUCT SALES 2011-2017 Positioned as recognized global brand ~$10M ~ $150M ~$60M ~$15M ~$15M 46
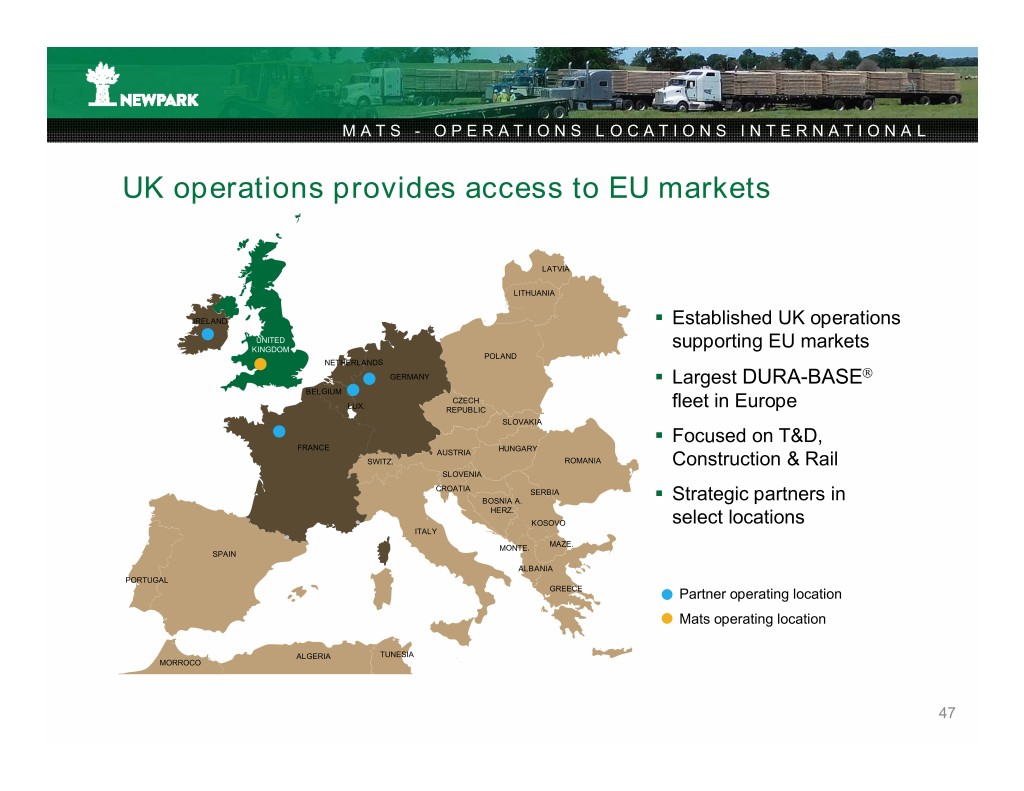
MATS - OPERATIONS LOCATIONS INTERNATIONAL UK operations provides access to EU markets LATVIA LITHUANIA IRELAND . Established UK operations UNITED KINGDOM supporting EU markets POLAND NETHERLANDS GERMANY . Largest DURA-BASE BELGIUM CZECH LUX. REPUBLIC fleet in Europe SLOVAKIA . Focused on T&D, FRANCE HUNGARY AUSTRIA SWITZ. ROMANIA Construction & Rail SLOVENIA CROATIA SERBIA BOSNIA A. . Strategic partners in HERZ. KOSOVO select locations ITALY MONTE. MAZE. SPAIN ALBANIA PORTUGAL GREECE Partner operating location Mats operating location ALGERIA TUNESIA MORROCO 47

MATS – ORGANIZATION Focused on industry needs to drive growth E&P UTILITIES PIPELINE . Experienced industry North experts focused on customer needs West . Dedicated resources delivering value proposition to expanded customer Midwest base . Strong adoption to date Texas . Supported by best in class regional operations centers LA Gulf Coast 48

MATS – BUSINESS MODEL Organized around our customers needs Rental & Services Design & Manufacturing INNOVATION Customer / Industry led innovation pipeline Best In Class Safety, Quality & Efficiency Highest Quality Product Portfolio Driven by Innovation & 20 Years With Leveraging technology, footprint & scale DURA-BASE Setting Industry Standard . OIL & GAS . MANUFACTURING . PIPELINE . APPLICATION ENGINEERING . TRANSMISSION & DISTRIBUTION . R&D . CONSTRUCTION . PRODUCT ENGINEERING 49

MATS – MANUFACTURING Strategically advantaged manufacturing facility U.S. HDPE Production Capacity . Strategically located to key raw material corridor . 20+ years of production know how . Highly automated process driving 6 quality & lean efficiency . Adequate capacity to meet sales & rental fleet needs . Agile manufacturing supporting R&D w/o impacting production Source: Roland Berger . Onsite R&D facilities 50
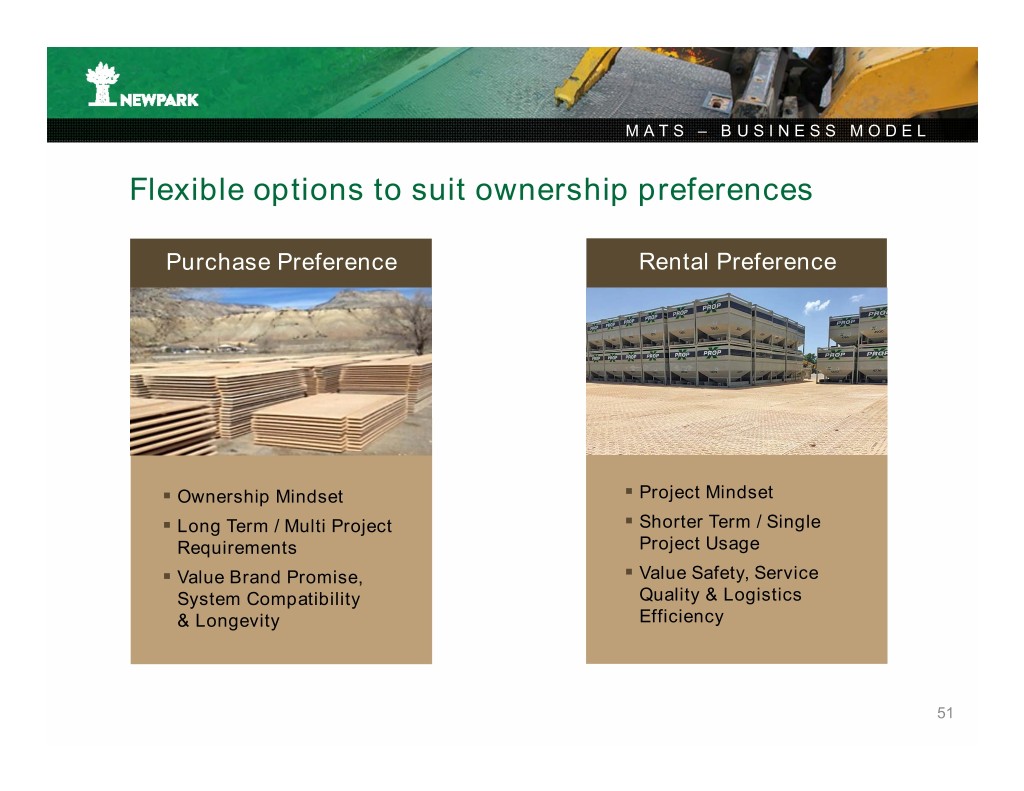
MATS – BUSINESS MODEL Flexible options to suit ownership preferences Purchase Preference Rental Preference . Ownership Mindset . Project Mindset . Long Term / Multi Project . Shorter Term / Single Requirements Project Usage . Value Brand Promise, . Value Safety, Service System Compatibility Quality & Logistics & Longevity Efficiency 51
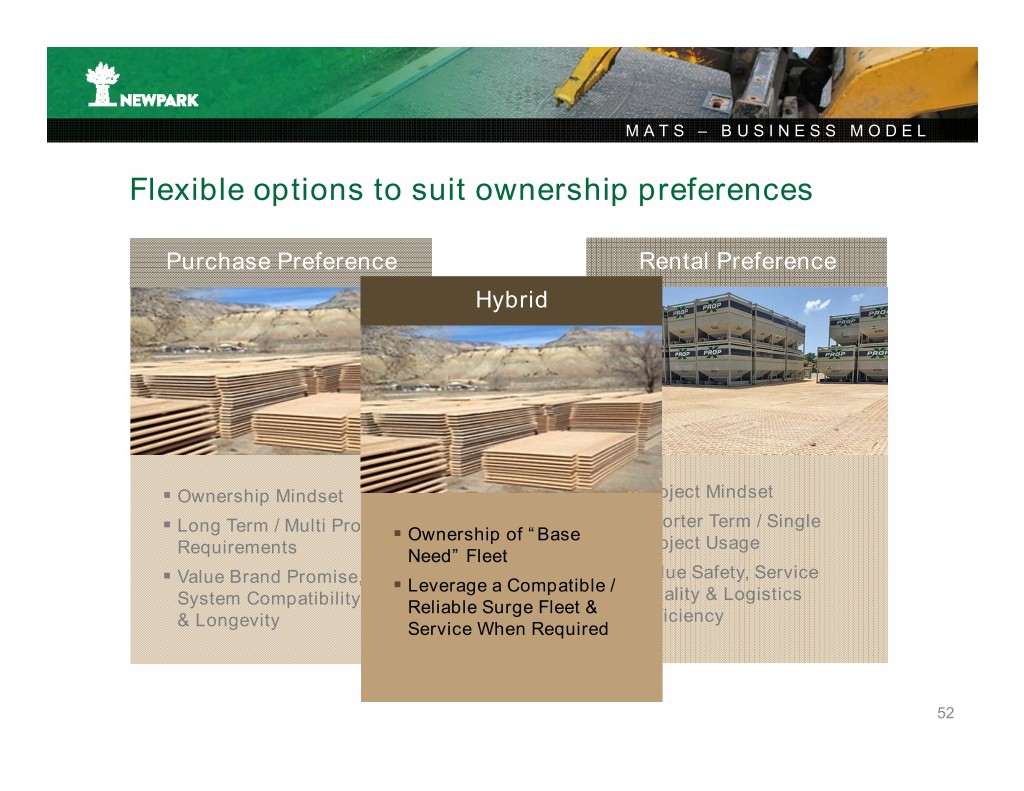
MATS – BUSINESS MODEL Flexible options to suit ownership preferences Purchase Preference Rental Preference Hybrid . Ownership Mindset . Project Mindset . Long Term / Multi Project . Shorter Term / Single . Ownership of “Base Project Usage Requirements Need” Fleet . Value Safety, Service . Value Brand Promise, . Leverage a Compatible / System Compatibility Quality & Logistics Reliable Surge Fleet & Efficiency & Longevity Service When Required 52

MATS - SUSTAINABILITY Engineered for sustainability . DURA-BASE mats & pins 100% recyclable . 100% of process water recycled during manufacturing . Composite matting requires 75 – 95% less energy than timber mat during manufacturing* . 20 – 80** years to grow and produce timber mat for 2 – 3 year life . 10+ years typical DURA-BASE life each manufacturing cycle *Cambio Solutions (2018) **Source: Sterling Lumber quoted figure (20y = Softwoods; 80y = Hardwoods) 53

MATS – OUR INNOVATION DRIVERS Lower Customer Operating Risk Safety Scale & Reliability Efficiency Environmental Sustainability 54

MATS & INTEGRATED SERVICES - INNOVATION Invasive species cost US agriculture $120bn* p.a. T-Rex Mobile Mat Washer . Timber mats organic & open structure conducive to transport of invasive species . DURA-BASE Closed, impervious design removes risk . Closed loop high pressure water system eliminates discharge while removing all mud / debris to remain onsite . Eliminates personnel risks from manual washing . Enables hundreds of mats to be cleaned a day with minimal crew size * Sources: US Fish & Wildlife Service 2012; T&D World, May 24, 2018 55
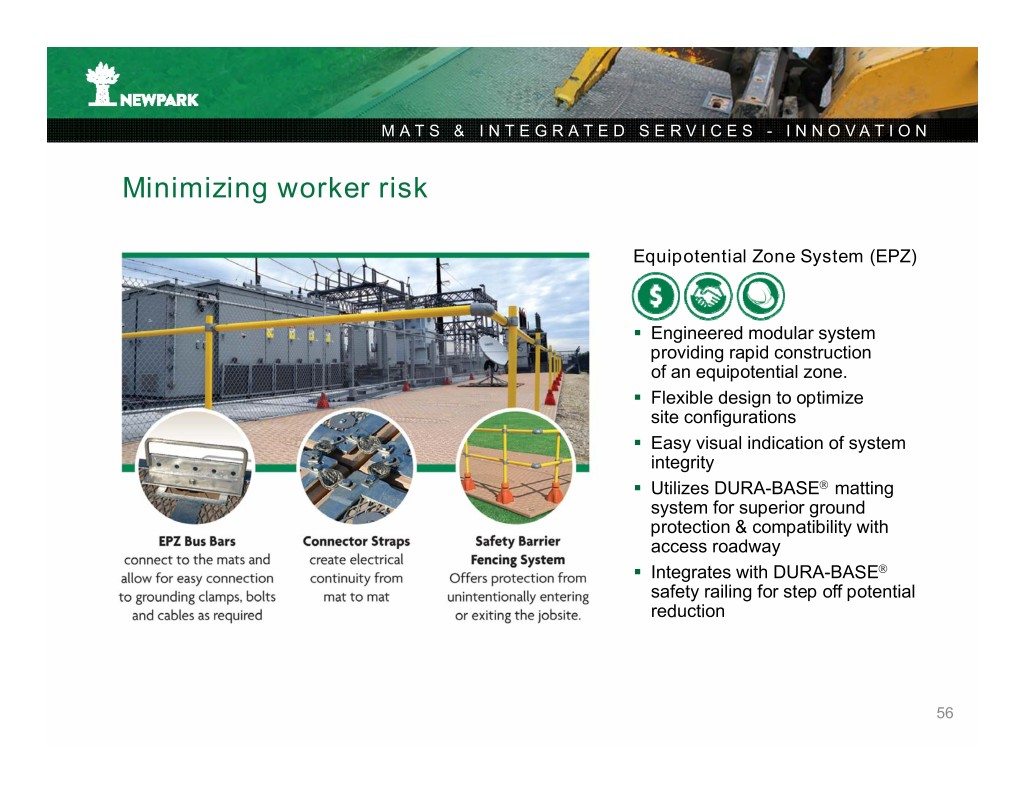
MATS & INTEGRATED SERVICES - INNOVATION Minimizing worker risk Equipotential Zone System (EPZ) . Engineered modular system providing rapid construction of an equipotential zone. . Flexible design to optimize site configurations . Easy visual indication of system integrity . Utilizes DURA-BASE matting system for superior ground protection & compatibility with access roadway . Integrates with DURA-BASE safety railing for step off potential reduction 56

MATS & INTEGRATED SERVICES - INNOVATION Water management for E&P and Pipeline is a growing issue Modular Above Ground Storage Tank (AST) . Utilizing DURA-BASE matting, modular design enables multiple size configurations to support site design limitations . Industry leading 80,000 Bbl. max capacity down to 20,000 Bbl. utilizing same hardware . Entire 80K tank moved in 4/5 non permitted loads . Ideal for pressure pumping in E&P and Pipeline integrity applications . Re-deployable as roadway or access pad 57
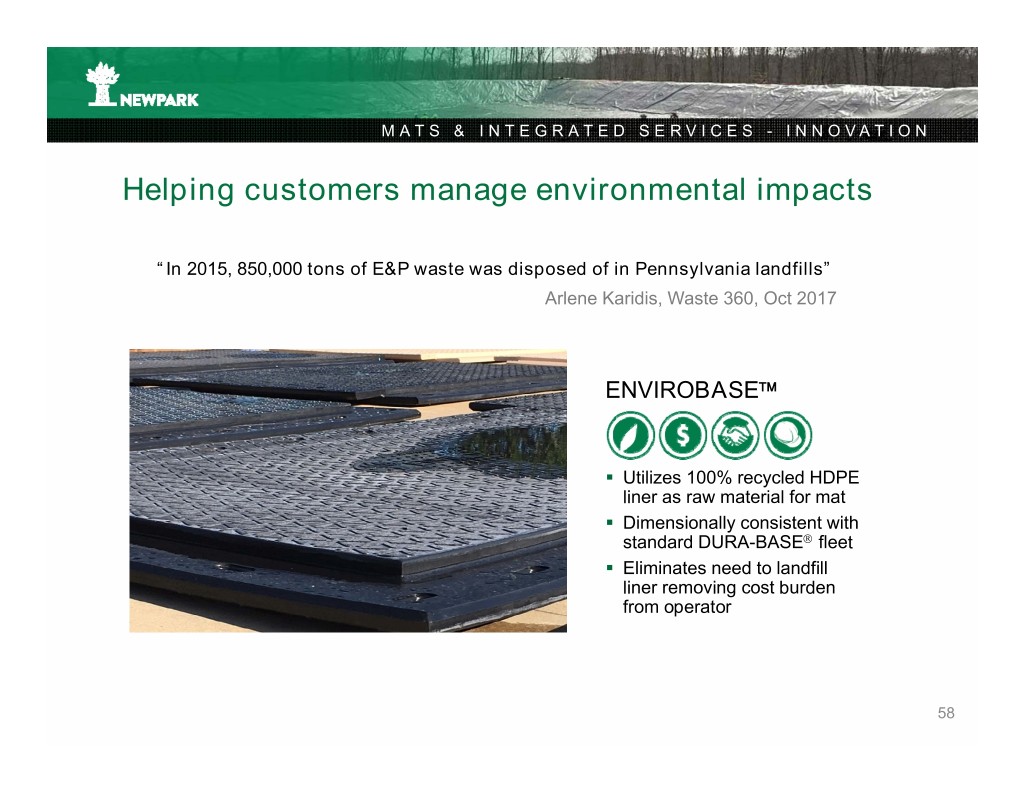
MATS & INTEGRATED SERVICES - INNOVATION Helping customers manage environmental impacts “In 2015, 850,000 tons of E&P waste was disposed of in Pennsylvania landfills” Arlene Karidis, Waste 360, Oct 2017 ENVIROBASE . Utilizes 100% recycled HDPE liner as raw material for mat . Dimensionally consistent with standard DURA-BASE fleet . Eliminates need to landfill liner removing cost burden from operator 58
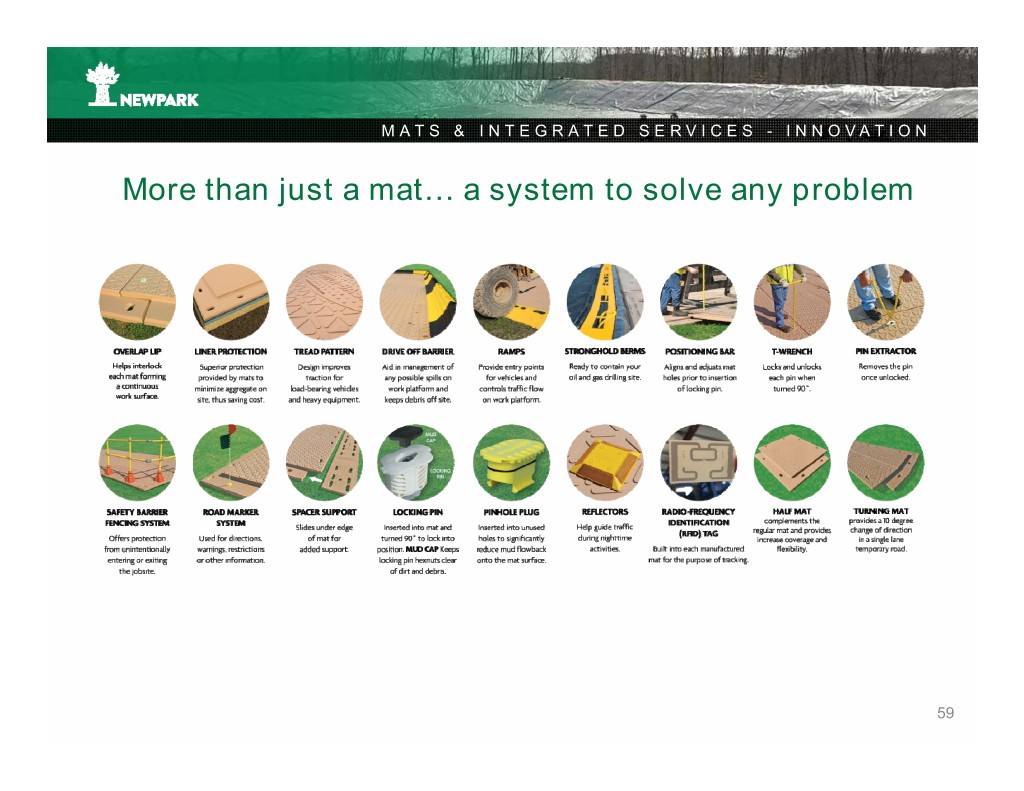
MATS & INTEGRATED SERVICES - INNOVATION More than just a mat… a system to solve any problem 59

MATS – EXTENSIVE IP PORTFOLIO PROTECTING INNOVATION 60

MATS & INTEGRATED SERVICES – VALUE PROPOSITION Strong growth pathway . Industry leading technology and manufacturing expertise . Proven history of converting markets and delivering value . Significant share capture available in scale markets . Strong, sustainable value proposition . Sustained growth through innovation… 61

APPENDIX - NON-GAAP FINANCIAL MEASURES (UNAUDITED) To help understand the Company’s financial performance, the Company has supplemented its financial results that it provides in accordance with generally accepted accounting principles (“GAAP”) with the non-GAAP financial measure of earnings before interest, taxes, depreciation and amortization (“EBITDA”). We believe this non-GAAP financial measure is frequently used by investors, securities analysts and other parties in the evaluation of our performance and/or that of other companies in our industry. In addition, management uses this measure to evaluate operating performance, and our annual cash incentive compensation plan has included performance metrics based on our consolidated EBITDA, along with other factors. The methods we use to produce this non-GAAP financial measure may differ from methods used by other companies. This measure should be considered in addition to, not as a substitute for, financial measures prepared in accordance with GAAP. Nine Months Ended September Consolidated Twelve Months Ended December 31, 30, (In thousands) 2013 2014 2015 2016 2017 2018 Net income (loss) (GAAP) (1) $ 65,323 $ 102,278 $ (90,828) $ (40,712) $ (6,148) $ 21,712 (Gain) loss from disposal of discontinued operations, net of tax ‐ (22,117) ‐ ‐ 17,367 ‐ (Income) from discontinued operations, net of tax (12,701) (1,152) ‐ ‐ ‐ ‐ Interest expense, net 11,279 10,431 9,111 9,866 13,273 10,659 Provision (benefit) for income taxes 28,725 41,048 (21,398) (24,042) 4,893 10,070 Depreciation and amortization 39,764 41,175 43,917 37,955 39,757 34,346 EBITDA (non‐GAAP) (1) $ 132,390 $ 171,663 $ (59,198) $ (16,933) $ 69,142 $ 76,787 (1) 2018 net income and EBITDA include a corporate office charge of $1.8 million associated with the retirement and transition of our Senior Vice President, General Counsel and Chief Administrative Officer, $1.1 million of charges in Brazil primarily related to severance costs associated with our planned workforce reductions in the fourth quarter of 2018 in connection with the scheduled completion of the current contract with Petrobras, $0.8 million of charges associated with the July 2018 fire at our Kenedy, Texas drilling fluids facility, and $0.6 million of non-capitalizable expenses related to the upgrade and conversion of a drilling fluids facility into a completion fluids facility. 2016 net loss and EBITDA include $13.8 million of charges associated with asset impairments and workforce reductions partially offset by gains for extinguishment of debt and adjustment for settlement of wage and hour litigation. 2015 net loss and EBITDA include $88.7 million of charges associated with goodwill and other asset impairments, workforce reductions and estimated resolution of wage and hour litigation. 62
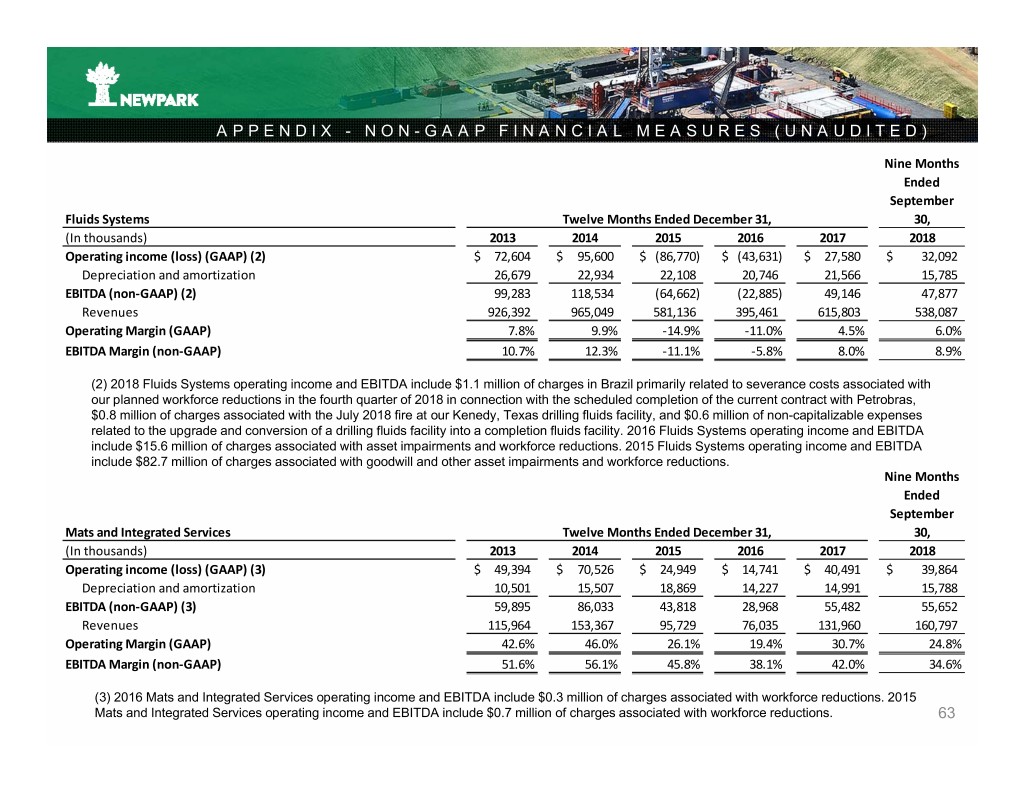
APPENDIX - NON-GAAP FINANCIAL MEASURES (UNAUDITED) Nine Months Ended September Fluids Systems Twelve Months Ended December 31, 30, (In thousands) 2013 2014 2015 2016 2017 2018 Operating income (loss) (GAAP) (2) $ 72,604 $ 95,600 $ (86,770) $ (43,631) $ 27,580 $ 32,092 Depreciation and amortization 26,679 22,934 22,108 20,746 21,566 15,785 EBITDA (non‐GAAP) (2) 99,283 118,534 (64,662) (22,885) 49,146 47,877 Revenues 926,392 965,049 581,136 395,461 615,803 538,087 Operating Margin (GAAP) 7.8% 9.9% ‐14.9% ‐11.0% 4.5% 6.0% EBITDA Margin (non‐GAAP) 10.7% 12.3% ‐11.1% ‐5.8% 8.0% 8.9% (2) 2018 Fluids Systems operating income and EBITDA include $1.1 million of charges in Brazil primarily related to severance costs associated with our planned workforce reductions in the fourth quarter of 2018 in connection with the scheduled completion of the current contract with Petrobras, $0.8 million of charges associated with the July 2018 fire at our Kenedy, Texas drilling fluids facility, and $0.6 million of non-capitalizable expenses related to the upgrade and conversion of a drilling fluids facility into a completion fluids facility. 2016 Fluids Systems operating income and EBITDA include $15.6 million of charges associated with asset impairments and workforce reductions. 2015 Fluids Systems operating income and EBITDA include $82.7 million of charges associated with goodwill and other asset impairments and workforce reductions. Nine Months Ended September Mats and Integrated Services Twelve Months Ended December 31, 30, (In thousands) 2013 2014 2015 2016 2017 2018 Operating income (loss) (GAAP) (3) $ 49,394 $ 70,526 $ 24,949 $ 14,741 $ 40,491 $ 39,864 Depreciation and amortization 10,501 15,507 18,869 14,227 14,991 15,788 EBITDA (non‐GAAP) (3) 59,895 86,033 43,818 28,968 55,482 55,652 Revenues 115,964 153,367 95,729 76,035 131,960 160,797 Operating Margin (GAAP) 42.6% 46.0% 26.1% 19.4% 30.7% 24.8% EBITDA Margin (non‐GAAP) 51.6% 56.1% 45.8% 38.1% 42.0% 34.6% (3) 2016 Mats and Integrated Services operating income and EBITDA include $0.3 million of charges associated with workforce reductions. 2015 Mats and Integrated Services operating income and EBITDA include $0.7 million of charges associated with workforce reductions. 63
