
Form 8-K Nuance Communications, For: Nov 19
UNITED STATES
SECURITIES AND EXCHANGE COMMISSION
Washington, D.C. 20549
_________________________________
FORM 8-K
_________________________________
CURRENT REPORT
Pursuant to Section 13 or 15(d)
of the Securities Exchange Act of 1934
Date of Report (Date of earliest event reported):
November 19, 2018
_________________________________
NUANCE COMMUNICATIONS, INC.
(Exact name of registrant as specified in its charter)
_________________________________
Delaware | 000-27038 | 94-3156479 | ||
(State or other jurisdiction of incorporation) | (Commission File Number) | (IRS Employer Identification No.) | ||
1 Wayside Road
Burlington, Massachusetts 01803
(Address of Principal Executive Offices)
(Zip Code)
Registrant’s telephone number, including area code: (781) 565-5000
(Former name or former address, if changed since last report)
_________________________________
Check the appropriate box below if the Form 8-K filing is intended to simultaneously satisfy the filing obligation of the registrant under any of the following provisions (see General Instruction A.2. below):
o | Written communications pursuant to Rule 425 under the Securities Act (17 CFR 230.425) |
o | Soliciting material pursuant to Rule 14a-12 under the Exchange Act (17 CFR 240.14a-12) |
o | Pre-commencement communications pursuant to Rule 14d-2(b) under the Exchange Act (17 CFR 240.14d-2(b)) |
o | Pre-commencement communications pursuant to Rule 13e-4(c) under the Exchange Act (17 CFR 240.13e-4(c)) |
Indicate by check mark whether the registrant is an emerging growth company as defined in Rule 405 of the Securities Act of 1933 (§230.405 of this chapter) or Rule 12b-2 of the Securities Exchange Act of 1934 (§240.12b-2 of this chapter).
Emerging growth company | o |
If an emerging growth company, indicate by check mark if the registrant has elected not to use the extended transition period for complying with any new or revised financial accounting standards provided pursuant to Section 13(a) of the Exchange Act. o
ITEM 2.02 Results of Operations and Financial Condition
On November 19, 2018, Nuance Communications, Inc. (the "Company") announced its financial results for the fourth quarter and fiscal year ended September 30, 2018. The press release, including the financial information contained therein, is attached hereto as Exhibit 99.1 and a set of prepared remarks regarding the results of the quarter and fiscal year ended September 30, 2018. The full text of the prepared remarks is attached hereto as Exhibit 99.2. The press release and prepared remarks are incorporated herein by reference. The press release and prepared remarks each include certain non-GAAP financial measures. A description of the non-GAAP measures, the reasons for their use, and GAAP to non-GAAP reconciliations are included in the press release and prepared remarks.
The information in this Item 2.02 and the exhibits attached hereto are being furnished and shall not be deemed to be “filed” for the purposes of Section 18 of the Securities Exchange Act of 1934, as amended (the “Exchange Act”) or otherwise subject to the liabilities of that section, nor shall they be deemed incorporated by reference into any filing under the Securities Act of 1933, as amended, or the Exchange Act, regardless of any general incorporation language in such filing.
ITEM 7.01 Regulation FD Disclosure
On November 19, 2018, the Company issued a press release announcing its plans to spin off its automotive business into a separate public company. A copy of the press release is attached hereto as Exhibit 99.3.
The information in this Item 7.01 and Exhibit 99.3 attached hereto are being furnished and shall not be deemed to be “filed” for the purposes of Section 18 of the Exchange Act or otherwise subject to the liabilities of that section, nor shall they be deemed incorporated by reference into any filing under the Securities Act of 1933, as amended, or the Exchange Act, regardless of any general incorporation language in such filing.
ITEM 9.01 Financial Statements and Exhibits
(d)Exhibits
99.1 | Press Release dated November 19, 2018 entitled “Nuance Announces Fourth Quarter and Fiscal Year 2018 Results.” | ||
99.2 | Prepared Remarks dated November 19, 2018. | ||
99.3 | Press Release dated November 19, 2018 entitled “Nuance Announces Plan to Spin Off Its Automotive Segment to Shareholders as a Separate Public Company.” | ||
SIGNATURE
Pursuant to the requirements of the Securities Exchange Act of 1934, the registrant has duly caused this report to be signed on its behalf by the undersigned hereunto duly authorized.
NUANCE COMMUNICATIONS, INC. | ||||||
Date: November 19, 2018 | By: | /s/ Daniel D. Tempesta | ||||
Daniel D. Tempesta Executive Vice President and Chief Financial Officer | ||||||
Exhibit 99.1
2018 fourth quarter and fiscal year results | ||
Press release | ||
November 19, 2018 | ||
Press Release
Nuance Announces Fourth Quarter
and Fiscal Year 2018 Results
– | Exceeded Non-GAAP Revenue, EPS, Cash Flow and Margin Expectations |
– | Announced Strategic Actions after Comprehensive Portfolio Reviews |
– | Implemented Significant Changes to Corporate Governance |
– | Executed Share Repurchases and Debt Paydown |
BURLINGTON, Mass., November 19, 2018 - Nuance Communications, Inc. (NASDAQ: NUAN) today announced financial results for its fiscal 2018 and fourth quarter ended September 30, 2018.
“The success of our fourth quarter can be measured equally by our strong financial performance as well as the tremendous progress we’ve made toward simplifying our structure, rationalizing our portfolio, enhancing our governance, and improving our internal culture,” said Mark Benjamin, chief executive officer at Nuance.
“We met or exceeded our Q4 expectations within each of our core metrics, and are pleased with what we accomplished over these last six months to enhance shareholder value. We made significant changes to our Board, bringing fresh perspectives, skills, and diversity of thought to the Company, and appointed an independent chairman to best represent shareholder interests. We also continued to pivot our capital allocation toward debt paydown and share buybacks to further enhance shareholder value. Perhaps most importantly, we conducted our strategic portfolio reviews and made definitive business decisions that will accelerate our future growth.”
Mr. Benjamin continued, “As we define this new era for Nuance, we are sharply focused on building a global, conversational AI business that is capable of sustainable, long-term revenue and earnings growth. We are transitioning to cloud-based, intelligence-driven solutions, and allocating resources to ensure maximum success in our high-growth core markets. Executing on these defined strategic priorities will enable Nuance to maintain its leadership as a truly intelligent engagement company, and we look forward to sharing our continued progress.”
Fourth Quarter Performance Summary
On a GAAP basis:
– | Revenue of $532.9 million, up 14% compared to $465.9 million a year ago |
– | Recurring revenue of 71% of total GAAP revenue, consistent with in the year-ago period |
– | Net loss of $(35.1) million, or $(0.12) per share, compared to a loss of $(65.4) million, or $(0.23) per share, in the fourth quarter last year |
– | Operating margin of 0.9%, compared to (3.8)% in the prior year period |
– | Incurred a goodwill and other asset intangible impairment of $33.0 million related to the decision during the quarter to wind down our Subscription Revenue Services (SRS) and Devices businesses |
– | Cash flow from operations of $149.4 million, compared to $(3.5) million in the fourth quarter of fiscal year 2017 |
On a non-GAAP basis:
– | Revenue of $536.2 million as reported, up 13% compared to $474.7 million in the fourth quarter last year |
– | Organic revenue grew 12% in the quarter to $536.2 million, from $479.6 million in the prior year period |
– | Recurring revenue of 71% of- total non-GAAP revenue, consistent with the year-ago period |
Page | 1 | of 14 | ||
2018 fourth quarter results | ||
Press release | ||
November 19, 2018 | ||
– | Net income of $112.5 million, or $0.38 per diluted share, compared to $60.2 million, or $0.20 per diluted share, in the fourth quarter of fiscal year 2017 |
– | Operating margin of 30.5%, compared to 20.7% in the prior year period |
– | Cash flow from operations of $149.4 million, or 133% of non-GAAP net income |
– | Net new bookings growth of 10%, to $468.5 million, up from $424.4 million a year ago |
Fiscal Year Performance Summary
On a GAAP basis:
– | Revenue of $2,051.7 million, up 6% compared to $1,939.4 million last year |
– | Recurring revenue of 71% of total GAAP revenue, compared to 73% in fiscal year 2017 |
– | Net loss of $(159.9) million, or $(0.55) per share, compared to a loss of $(151.0) million, or $(0.52) per share, in fiscal year 2017 |
– | Operating margin of (4.2)%, compared to 2.7% last year |
– | Incurred a goodwill and other intangible asset impairment of $170.9 million related to SRS business disruption in Q2 18 as well as the Q4 18 decision to wind down our SRS and Devices businesses |
– | Cash flow from operations of $444.4 million, compared to $378.9 million in fiscal year 2017 |
– | Total deferred revenue ending balance of $873.0 million, up 11% compared to $790.0 million at fiscal year-end 2017 |
– | Total cash, cash equivalents and marketable securities ending balance of $473.5 million versus $874.1 million as of September 30, 2017. |
On a non-GAAP basis:
– | Revenue of $2,069.4 million as reported, up 5% compared to $1,977.4 million last year |
– | Organic revenue grew 4% compared to (3)% in the prior year period |
– | Recurring revenue of 72% of- total non-GAAP revenue, compared to 73% in fiscal year 2017 |
– | Net income of $351.9 million, or $1.19 per diluted share, compared to net income of $309.0 million, or $1.05 per diluted share, in fiscal year 2017 |
– | Operating margin of 26.1%, compared to 26.4% last year |
– | Cash flow from operations of $444.4 million, or 126.3% of non-GAAP net income |
– | Net new bookings growth of 5%, to $1,734.6 million, up from $1,653.6 million a year ago |
Portfolio Review, Business Review and Transformation Program
Healthcare and Enterprise Focus - After conducting the strategic business review, Nuance created a comprehensive plan to simplify its operations and enhance its focus on growth markets, including the Healthcare, Enterprise and Automotive segments. Therefore, the Company will maintain its Healthcare and Enterprise business segments, where Nuance brings deep business-to-business relationships, differentiated technology and contextual expertise.
Automotive Segment Spin-Off - The Automotive segment delivers critical enabling technology for transforming the passenger experience. Therefore, becoming a pure-play next generation automotive software company represents an important step in this segment’s growth. Accordingly, in conjunction with today’s earnings announcement, Nuance announced its intention to spin off the Automotive segment into a new, independent, publicly-traded company. Additional information about the proposed transaction is available in the separate press release issued today.
Imaging Business Sale - As announced on November 12, 2018, Nuance is selling its Imaging business to Kofax for a purchase price of $400 million, in a transaction that is expected to close by the end of Q2 19.
Subscription Revenue Services (SRS) and Devices Wind-Down - During the fourth quarter, Nuance decided to wind down the Subscription Revenue Services (SRS) business because it is non-core to Nuance’s AI strengths. The Company is also commencing the wind-down of the consumer-focused Devices business.
Page | 2 | of 14 | ||
2018 fourth quarter results | ||
Press release | ||
November 19, 2018 | ||
Operational Transformation Program - In tandem with the Company’s strategic portfolio review, Nuance is optimizing its organizational structure. This process has identified $50 million in cost savings that will be implemented in fiscal year 2019, primarily during the first and second quarter.
Capital Allocation
In Q3 18, the Company implemented a capital allocation strategy for the fiscal year focused on opportunistic share repurchase and debt repayment. Accordingly, during fiscal year 2018, Nuance repurchased a total of 9.7 million shares of common stock, representing 3.3% of total shares outstanding as of September 30, 2017, at an average price of $14.03 per share, and a total purchase price of $136.1 million.
In addition, in Q4 18, the Company repaid $150 million of its 2020 5.375% high-yield bonds at par, reducing annual cash interest expense by approximately $8.1 million. As a result, total debt maturity value is approximately $2.44 billion as of September 30, 2018, down from $2.59 billion as of June 30, 2018, and the Company’s net debt leveragel ratio is 3.3.
Governance Improvements and Management Additions
Nuance refreshed its Board in September, naming four new independent directors and a new non-executive Board Chair, bringing new talent, with a wealth of relevant expertise and relevant skills. Of the nine Board members, seven have joined since December 2017 and eight are independent directors, including Lloyd Carney, who was named the new chairman. Separately, on November 9, 2018, Nuance announced that its Board had changed its Bylaws to enable holders of at least 20% of Nuance common stock outstanding to request that the Company call a special meeting of stockholders.
Business Outlook
For a complete discussion on Nuance’s fourth quarter and fiscal year 2018 results and 2019 business outlook, please see the Company’s Prepared Remarks document available at http://www.nuance.com/earnings-results/.
Please refer to the “Discussion of Non-GAAP Financial Measures,” and “GAAP to Non-GAAP Reconciliations,” included elsewhere in this release, for more information regarding the company’s use of non-GAAP financial measures.
Conference Call and Prepared Remarks
Nuance provides prepared remarks in combination with its press release. This quarter, the company is also providing a PowerPoint presentation to accompany the conference call discussion to provide insights into the business update. The prepared remarks are offered to provide shareholders and analysts with additional time and detail for analyzing results in advance of the company’s quarterly conference call. The remarks will be available at http://www.nuance.com/earnings-results/ in conjunction with this press release but will not be read on the conference call.
Nuance will host an investor conference call today that will begin at 5:00 p.m. ET and will include management comments followed by questions and answers. To access the live broadcast, and to view the PowerPoint presentation that will accompany this call, please visit the Investor Relations section of Nuance’s website at http://investors.nuance.com. The call can also be heard by dialing (877) 273-6124 or (647) 689-5393 at least five minutes prior to the call and referencing conference code 2572316. A replay will be available shortly following the conclusion of the call by dialing (800) 585-8367 or (416) 621-4642 and using the access code 2572316. The presentation will be available on the Nuance Investor Relations site after the call is completed.
About Nuance Communications, Inc.
Nuance Communications, Inc. (NASDAQ: NUAN) is the pioneer and leader in conversational AI innovations that bring intelligence to everyday work and life. The Company delivers solutions that understand, analyze and respond to human language to increase productivity and amplify human intelligence. With decades of domain and artificial intelligence expertise, Nuance works with thousands of organizations - in global industries that include healthcare,
Page | 3 | of 14 | ||
2018 fourth quarter results | ||
Press release | ||
November 19, 2018 | ||
telecommunications, automotive, financial services, and retail - to create stronger relationships and better experiences for their customers and workforce. For more information, please visit www.nuance.com.
Trademark reference: Nuance and the Nuance logo are registered trademarks or trademarks of Nuance Communications, Inc. or its affiliates in the United States and/or other countries. All other trademarks referenced herein are the property of their respective owners.
Safe Harbor and Forward-Looking Statements
Statements in this document regarding future performance and our management’s future expectations, beliefs, goals, plans or prospects constitute forward-looking statements within the meaning of the Private Securities Litigation Reform Act of 1995. Any statements that are not statements of historical fact (including statements containing the words “believes,” “plans,” “anticipates,” “expects,” "intends" or “estimates” or similar expressions) should also be considered to be forward-looking statements. There are a number of important factors that could cause actual results or events to differ materially from those indicated by such forward-looking statements, including but not limited to: the ability to effect the separation and spin-off of our Auto business; our ability to close the sale of our Imaging business, our ability to successfully wind-down certain products or business lines, fluctuations in demand for our existing and future products; fluctuations in the mix of products and services sold in specific periods; further unanticipated costs resulting from the FY17 malware incident including potential costs associated with litigation or governmental investigations that may result from the incident; our ability to control and successfully manage our expenses and cash position; our ability to develop and execute in a timely manner our productivity and cost initiatives; the effects of competition, including pricing pressure, and changing business models in the markets and industries we serve; changes to economic conditions in the United States and internationally; uncertainties associated with the transition of our chief executive officer, and the addition of a number of new directors; the imposition of tariffs or other trade measures particularly between the United States and China; potential future impairment charges related to our newly reorganized business reporting units; fluctuating currency rates; possible quality issues in our products and technologies; our ability to successfully integrate operations and employees of acquired businesses; the conversion rate of bookings into revenue; the ability to realize anticipated synergies from acquired businesses; and the other factors described in our most recent Form 10-K, Form 10-Q and other filings with the Securities and Exchange Commission. We disclaim any obligation to update any forward-looking statements as a result of developments occurring after the date of this document.
Definitions of Bookings and Net New Bookings
Bookings. Bookings represent the estimated gross revenue value of transactions at the time of contract execution, except for maintenance and support offerings. For fixed price contracts, the bookings value represents the gross total contract value. For contracts where revenue is based on transaction volume, the bookings value represents the contract price multiplied by the estimated future transaction volume during the contract term, whether or not such transaction volumes are guaranteed under a minimum commitment clause. Actual results could be different than our initial estimates. The maintenance and support bookings value represents the amounts billed in the period the customer is invoiced. Because of the inherent estimates required to determine bookings and the fact that the actual resultant revenue may differ from our initial bookings estimates, we consider bookings one indicator of potential future revenue and not as an arithmetic measure of backlog.
Net new bookings. Net new bookings represents the estimated revenue value at the time of contract execution from new contractual arrangements or the estimated revenue value incremental to the portion of the transaction value attributable to renewals under pre-existing arrangements. Constant currency for net new bookings is calculated using current period net new bookings denominated in currencies other than United States dollars, converted into United States dollars using the average exchange rate for those currencies from the prior year period rather than the actual exchange rate in effect during the current period.
Page | 4 | of 14 | ||
2018 fourth quarter results | ||
Press release | ||
November 19, 2018 | ||
Discussion of non-GAAP Financial Measures
We believe that providing the non-GAAP information to investors, in addition to the GAAP presentation, allows investors to view the financial results in the way management views the operating results. We further believe that providing this information allows investors to not only better understand our financial performance, but more importantly, to evaluate the efficacy of the methodology and information used by management to evaluate and measure such performance. The non-GAAP information included in this press release should not be considered superior to, or a substitute for, financial statements prepared in accordance with GAAP.
We utilize a number of different financial measures, both Generally Accepted Accounting Principles (“GAAP”) and non-GAAP, in analyzing and assessing the overall performance of the business, for making operating decisions and for forecasting and planning for future periods. Our annual financial plan is prepared both on a GAAP and non-GAAP basis, and the non-GAAP annual financial plan is approved by our board of directors. Continuous budgeting and forecasting for revenue and expenses are conducted on a consistent non-GAAP basis (in addition to GAAP) and actual results on a non-GAAP basis are assessed against the non-GAAP annual financial plan. The board of directors and management utilize these non-GAAP measures and results (in addition to the GAAP results) to determine our allocation of resources. In addition, and as a consequence of the importance of these measures in managing the business, we use non-GAAP measures and results in the evaluation process to establish management’s compensation. For example, our annual bonus program payments are based upon the achievement of consolidated non-GAAP revenue and consolidated non-GAAP earnings per share financial targets. We consider the use of non-GAAP revenue helpful in understanding the performance of our business, as it excludes the purchase accounting impact on acquired deferred revenue and other acquisition-related adjustments to revenue. We also consider the use of non-GAAP earnings per share helpful in assessing the organic performance of the continuing operations of our business. By organic performance we mean performance as if we had owned an acquired business in the same period a year ago. By constant currency organic performance, we mean performance excluding the effect of current foreign currency rate fluctuations. By continuing operations, we mean the ongoing results of the business excluding certain unplanned costs. While our management uses these non-GAAP financial measures as a tool to enhance their understanding of certain aspects of our financial performance, our management does not consider these measures to be a substitute for, or superior to, the information provided by GAAP financial statements. Consistent with this approach, we believe that disclosing non-GAAP financial measures to the readers of our financial statements provides such readers with useful supplemental data that, while not a substitute for GAAP financial statements, allows for greater transparency in the review of our financial and operational performance. In assessing the overall health of the business during the three and twelve months ended September 30, 2018 and 2017, our management has either included or excluded items in seven general categories, each of which is described below.
Acquisition-related revenue and cost of revenue.
We provide supplementary non-GAAP financial measures of revenue that include revenue that we would have recognized but for the purchase accounting treatment of acquisition transactions. Non-GAAP revenue also includes revenue that we would have recognized had we not acquired intellectual property and other assets from the same customer. Because GAAP accounting requires the elimination of this revenue, GAAP results alone do not fully capture all of our economic activities. These non-GAAP adjustments are intended to reflect the full amount of such revenue. We include non-GAAP revenue and cost of revenue to allow for more complete comparisons to the financial results of historical operations, forward-looking guidance and the financial results of peer companies. We believe these adjustments are useful to management and investors as a measure of the ongoing performance of the business because, although we cannot be certain that customers will renew their contracts, we have historically experienced high renewal rates on maintenance and support agreements and other customer contracts. Additionally, although acquisition-related revenue adjustments are non-recurring with respect to past acquisitions, we generally will incur these adjustments in connection with any future acquisitions.
Acquisition-related costs, net.
In recent years, we have completed a number of acquisitions, which result in operating expenses, which would not otherwise have been incurred. We provide supplementary non-GAAP financial measures, which exclude certain
Page | 5 | of 14 | ||
2018 fourth quarter results | ||
Press release | ||
November 19, 2018 | ||
transition, integration and other acquisition-related expense items resulting from acquisitions, to allow more accurate comparisons of the financial results to historical operations, forward looking guidance and the financial results of less acquisitive peer companies. We consider these types of costs and adjustments, to a great extent, to be unpredictable and dependent on a significant number of factors that are outside of our control. Furthermore, we do not consider these acquisition-related costs and adjustments to be related to the organic continuing operations of the acquired businesses and are generally not relevant to assessing or estimating the long-term performance of the acquired assets. In addition, the size, complexity and/or volume of past acquisitions, which often drives the magnitude of acquisition related costs, may not be indicative of the size, complexity and/or volume of future acquisitions. By excluding acquisition-related costs and adjustments from our non-GAAP measures, management is better able to evaluate our ability to utilize our existing assets and estimate the long-term value that acquired assets will generate for us. We believe that providing a supplemental non-GAAP measure, which excludes these items allows management and investors to consider the ongoing operations of the business both with, and without, such expenses.
These acquisition-related costs fall into the following categories: (i) transition and integration costs; (ii) professional service fees and expenses; and (iii) acquisition-related adjustments. Although these expenses are not recurring with respect to past acquisitions, we generally will incur these expenses in connection with any future acquisitions. These categories are further discussed as follows:
(i) Transition and integration costs. Transition and integration costs include retention payments, transitional employee costs, and earn-out payments treated as compensation expense, as well as the costs of integration-related activities, including services provided by third-parties.
(ii) Professional service fees and expenses. Professional service fees and expenses include financial advisory, legal, accounting and other outside services incurred in connection with acquisition activities, and disputes and regulatory matters related to acquired entities.
(iii) Acquisition-related adjustments. Acquisition-related adjustments include adjustments to acquisition-related items that are required to be marked to fair value each reporting period, such as contingent consideration, and other items related to acquisitions for which the measurement period has ended, such as gains or losses on settlements of pre-acquisition contingencies.
Amortization of acquired intangible assets.
We exclude the amortization of acquired intangible assets from non-GAAP expense and income measures. These amounts are inconsistent in amount and frequency and are significantly impacted by the timing and size of acquisitions. Providing a supplemental measure which excludes these charges allows management and investors to evaluate results “as-if” the acquired intangible assets had been developed internally rather than acquired and, therefore, provides a supplemental measure of performance in which our acquired intellectual property is treated in a comparable manner to our internally developed intellectual property. Although we exclude amortization of acquired intangible assets from our non-GAAP expenses, we believe that it is important for investors to understand that such intangible assets contribute to revenue generation. Amortization of intangible assets that relate to past acquisitions will recur in future periods until such intangible assets have been fully amortized. Future acquisitions may result in the amortization of additional intangible assets.
Non-cash expenses.
We provide non-GAAP information relative to the following non-cash expenses: (i) stock-based compensation; and (ii) non-cash interest. These items are further discussed as follows:
(i) Stock-based compensation. Because of varying valuation methodologies, subjective assumptions and the variety of award types, we believe that excluding stock-based compensation allows for more accurate comparisons of operating results to peer companies, as well as to times in our history when stock-based compensation was more or less significant as a portion of overall compensation than in the current period. We evaluate performance both with and without these measures because compensation expense related to stock-based compensation is typically non-cash and the options and restricted awards granted are influenced by the Company’s stock price and other factors such as volatility that are beyond our control. The expense related to stock-based awards is generally not controllable in the short-term and can vary significantly based
Page | 6 | of 14 | ||
2018 fourth quarter results | ||
Press release | ||
November 19, 2018 | ||
on the timing, size and nature of awards granted. As such, we do not include such charges in operating plans. Stock-based compensation will continue in future periods.
(ii) Non-cash interest. We exclude non-cash interest because we believe that excluding this expense provides senior management, as well as other users of the financial statements, with a valuable perspective on the cash-based performance and health of the business, including the current near-term projected liquidity. Non-cash interest expense will continue in future periods.
Other expenses.
We exclude certain other expenses that result from unplanned events outside the ordinary course of continuing operations, in order to measure operating performance and current and future liquidity both with and without these expenses. By providing this information, we believe management and the users of the financial statements are better able to understand the financial results of what we consider to be our organic, continuing operations. Included in these expenses are items such as restructuring charges, asset impairments and other charges (credits), net, and losses from extinguishing our convertible debt. Other items such as consulting and professional services fees related to assessing strategic alternatives and our transformation programs, implementation of the new revenue recognition standard (ASC 606), and expenses associated with the malware incident and remediation thereof are also excluded.
Non-GAAP income tax provision.
Effective Q2 2017, we changed our method of calculating our non-GAAP income tax provision. Under the prior method, we calculated our non-GAAP tax provision using a cash tax method to reflect the estimated amount we expected to pay or receive in taxes related to the period, which is equivalent to our GAAP current tax provision. Under the new method, our non-GAAP income tax provision is determined based on our non-GAAP pre-tax income. The tax effect of each non-GAAP adjustment, if applicable, is computed based on the statutory tax rate of the jurisdiction to which the adjustment relates. Additionally, as our non-GAAP profitability is higher based on the non-GAAP adjustments, we adjust the GAAP tax provision to remove valuation allowances and related effects based on the higher level of reported non-GAAP profitability. We also exclude from our non-GAAP tax provision certain discrete tax items as they occur, which in fiscal year 2018 also includes certain impacts from the Tax Cuts and Jobs Act of 2017.
Contact Information
Richard Mack Nuance Communications, Inc. Tel: 781-565-5000 Email:[email protected] | |
Financial Tables Follow
Page | 7 | of 14 | ||
2018 fourth quarter results | ||
Press release | ||
November 19, 2018 | ||
Nuance Communications, Inc.
Condensed Consolidated Statements of Operations
(in thousands, except per share amounts)
Unaudited
Three months ended September 30, | Twelve months ended September 30, | |||||||||||||||
2018 | 2017 | 2018 | 2017 | |||||||||||||
Revenues: | ||||||||||||||||
Professional services and hosting | $ | 261,369 | $ | 213,298 | $ | 1,049,448 | $ | 976,893 | ||||||||
Product and licensing | 192,454 | 170,153 | 684,230 | 635,391 | ||||||||||||
Maintenance and support | 79,082 | 82,459 | 317,983 | 327,078 | ||||||||||||
Total revenues | 532,905 | 465,910 | 2,051,661 | 1,939,362 | ||||||||||||
Cost of revenues: | ||||||||||||||||
Professional services and hosting | 161,657 | 162,348 | 681,516 | 660,849 | ||||||||||||
Product and licensing | 19,999 | 19,199 | 77,086 | 74,004 | ||||||||||||
Maintenance and support | 15,317 | 13,846 | 58,095 | 54,094 | ||||||||||||
Amortization of intangible assets | 12,977 | 16,366 | 56,873 | 64,853 | ||||||||||||
Total cost of revenues | 209,950 | 211,759 | 873,570 | 853,800 | ||||||||||||
Gross profit | 322,955 | 254,151 | 1,178,091 | 1,085,562 | ||||||||||||
Operating expenses: | ||||||||||||||||
Research and development | 82,046 | 66,978 | 305,323 | 266,097 | ||||||||||||
Sales and marketing | 95,946 | 105,929 | 388,305 | 398,130 | ||||||||||||
General and administrative | 51,941 | 43,040 | 229,774 | 166,677 | ||||||||||||
Amortization of intangible assets | 21,242 | 28,964 | 91,093 | 113,895 | ||||||||||||
Acquisition-related costs, net | 3,264 | 5,689 | 16,101 | 27,740 | ||||||||||||
Restructuring and other charges, net | 30,512 | 21,405 | 63,498 | 61,054 | ||||||||||||
Impairment of goodwill and other intangible assets | 33,034 | — | 170,941 | — | ||||||||||||
Total operating expenses | 317,985 | 272,005 | 1,265,035 | 1,033,593 | ||||||||||||
Income (loss) from operations | 4,970 | (17,854 | ) | (86,944 | ) | 51,969 | ||||||||||
Other expenses, net | (31,439 | ) | (37,692 | ) | (129,791 | ) | (170,984 | ) | ||||||||
Loss before income taxes | (26,469 | ) | (55,546 | ) | (216,735 | ) | (119,015 | ) | ||||||||
Provision (benefit) for income taxes | 8,597 | 9,878 | (56,807 | ) | 31,981 | |||||||||||
Net loss | $ | (35,066 | ) | $ | (65,424 | ) | $ | (159,928 | ) | $ | (150,996 | ) | ||||
Net loss per share: | ||||||||||||||||
Basic | $ | (0.12 | ) | $ | (0.23 | ) | $ | (0.55 | ) | $ | (0.52 | ) | ||||
Diluted | $ | (0.12 | ) | $ | (0.23 | ) | $ | (0.55 | ) | $ | (0.52 | ) | ||||
Weighted average common shares outstanding: | ||||||||||||||||
Basic | 287,052 | 288,718 | 291,318 | 289,348 | ||||||||||||
Diluted | 287,052 | 288,718 | 291,318 | 289,348 | ||||||||||||
Page | 8 | of 14 | ||
2018 fourth quarter results | ||
Press release | ||
November 19, 2018 | ||
Nuance Communications, Inc.
Condensed Consolidated Balance Sheets
(in thousands)
September 30, 2018 | September 30, 2017 | ||||||||
Unaudited | |||||||||
ASSETS | |||||||||
Current assets: | |||||||||
Cash and cash equivalents | $ | 315,963 | $ | 592,299 | |||||
Marketable securities | 135,579 | 251,981 | |||||||
Accounts receivable, net | 378,832 | 395,392 | |||||||
Prepaid expenses and other current assets | 98,257 | 88,269 | |||||||
Total current assets | 928,631 | 1,327,941 | |||||||
Marketable securities | 21,932 | 29,844 | |||||||
Land, building and equipment, net | 155,894 | 176,548 | |||||||
Goodwill | 3,504,457 | 3,590,608 | |||||||
Intangible assets, net | 549,508 | 664,474 | |||||||
Other assets | 141,957 | 142,508 | |||||||
Total assets | $ | 5,302,379 | $ | 5,931,923 | |||||
LIABILITIES AND STOCKHOLDERS' EQUITY | |||||||||
Current liabilities: | |||||||||
Current portion of long-term debt | $ | — | $ | 376,121 | |||||
Contingent and deferred acquisition payments | 14,211 | 28,860 | |||||||
Accounts payable, accrued expenses and other current liabilities | 366,160 | 340,505 | |||||||
Deferred revenue | 383,793 | 366,042 | |||||||
Total current liabilities | 764,164 | 1,111,528 | |||||||
Long-term debt | 2,185,361 | 2,241,283 | |||||||
Deferred revenue, net of current portion | 489,177 | 423,929 | |||||||
Other liabilities | 146,181 | 223,801 | |||||||
Total liabilities | 3,584,883 | 4,000,541 | |||||||
Stockholders' equity | 1,717,496 | 1,931,382 | |||||||
Total liabilities and stockholders' equity | $ | 5,302,379 | $ | 5,931,923 | |||||
Page | 9 | of 14 | ||
2018 fourth quarter results | ||
Press release | ||
November 19, 2018 | ||
Nuance Communications, Inc.
Consolidated Statements of Cash Flows
(in thousands)
Unaudited
Three months ended | Twelve months ended | |||||||||||||||
September 30, | September 30, | |||||||||||||||
2018 | 2017 | 2018 | 2017 | |||||||||||||
Cash flows from operating activities: | ||||||||||||||||
Net loss | $ | (35,066 | ) | $ | (65,424 | ) | $ | (159,928 | ) | $ | (150,996 | ) | ||||
Adjustments to reconcile net loss to net cash provided by operating activities: | ||||||||||||||||
Depreciation and amortization | 49,149 | 59,458 | 210,316 | 234,413 | ||||||||||||
Stock-based compensation | 43,848 | 32,463 | 150,785 | 154,272 | ||||||||||||
Non-cash interest expense | 12,000 | 16,383 | 49,091 | 59,295 | ||||||||||||
Deferred tax provision (benefit) | 3,901 | (1,907 | ) | (87,217 | ) | 4,855 | ||||||||||
(Gain) loss on extinguishment of debt | (348 | ) | — | (348 | ) | 18,565 | ||||||||||
Impairment of goodwill and other intangible assets | 33,034 | — | 170,941 | — | ||||||||||||
Impairment of fixed assets | 8,770 | — | 10,550 | 16,351 | ||||||||||||
Other | 1,336 | 4,144 | 2,230 | 8,403 | ||||||||||||
Changes in operating assets and liabilities, excluding effects of acquisitions: | ||||||||||||||||
Accounts receivable | 17,634 | (34,481 | ) | 19,641 | (6,349 | ) | ||||||||||
Prepaid expenses and other assets | (1,694 | ) | (130 | ) | (20,389 | ) | (14,661 | ) | ||||||||
Accounts payable | (10,304 | ) | (13,416 | ) | (14,315 | ) | (1,207 | ) | ||||||||
Accrued expenses and other liabilities | 25,176 | 13,080 | 26,847 | 9,040 | ||||||||||||
Deferred revenue | 1,967 | (13,666 | ) | 86,222 | 46,886 | |||||||||||
Net cash provided by operating activities | 149,403 | (3,496 | ) | 444,426 | 378,867 | |||||||||||
Cash flows from investing activities: | ||||||||||||||||
Capital expenditures | (9,880 | ) | (27,802 | ) | (48,845 | ) | (61,835 | ) | ||||||||
Payments for business and asset acquisitions, net of cash acquired | (945 | ) | (3,549 | ) | (110,170 | ) | (113,769 | ) | ||||||||
Purchases of marketable securities and other investments | (43,350 | ) | (140,408 | ) | (201,995 | ) | (332,470 | ) | ||||||||
Proceeds from sales and maturities of marketable securities and other investments | 64,018 | 67,420 | 323,695 | 173,864 | ||||||||||||
Net cash provided by (used in) investing activities | 9,843 | (104,339 | ) | (37,315 | ) | (334,210 | ) | |||||||||
Cash flows from financing activities: | ||||||||||||||||
Repayment and redemption of debt | (150,000 | ) | — | (481,172 | ) | (634,055 | ) | |||||||||
Proceeds from issuance of long-term debt, net of issuance costs | — | (599 | ) | — | 837,482 | |||||||||||
Payments for repurchase of common stock | (24,111 | ) | — | (136,090 | ) | (99,077 | ) | |||||||||
Acquisition payments with extended payment terms | (4,073 | ) | — | (24,842 | ) | — | ||||||||||
Proceeds from issuance of common stock from employee stock plans | 9,023 | 8,701 | 18,384 | 17,383 | ||||||||||||
Payments for taxes related to net share settlement of equity awards | (3,544 | ) | (1,576 | ) | (55,396 | ) | (54,099 | ) | ||||||||
Other financing activities | (157 | ) | (159 | ) | (1,232 | ) | (583 | ) | ||||||||
Net cash (used in) provided by financing activities | (172,862 | ) | 6,367 | (680,348 | ) | 67,051 | ||||||||||
Effects of exchange rate changes on cash and cash equivalents | (1,680 | ) | 173 | (3,099 | ) | (1,029 | ) | |||||||||
Net (decrease) increase in cash and cash equivalents | (15,296 | ) | (101,295 | ) | (276,336 | ) | 110,679 | |||||||||
Cash and cash equivalents at beginning of period | 331,259 | 693,594 | 592,299 | 481,620 | ||||||||||||
Cash and cash equivalents at end of period | $ | 315,963 | $ | 592,299 | $ | 315,963 | $ | 592,299 | ||||||||
Page | 10 | of 14 | ||
2018 fourth quarter results | ||
Press release | ||
November 19, 2018 | ||
Nuance Communications, Inc.
Supplemental Financial Information - GAAP to Non-GAAP Reconciliations
(in thousands)
Unaudited
Three months ended | Twelve months ended | |||||||||||||||
September 30, | September 30, | |||||||||||||||
2018 | 2017 | 2018 | 2017 | |||||||||||||
GAAP revenues | $ | 532,905 | $ | 465,910 | $ | 2,051,661 | $ | 1,939,362 | ||||||||
Acquisition-related revenue adjustments: professional services and hosting | 1,274 | 2,044 | 4,948 | 10,553 | ||||||||||||
Acquisition-related revenue adjustments: product and licensing | 1,886 | 6,494 | 12,401 | 26,462 | ||||||||||||
Acquisition-related revenue adjustments: maintenance and support | 148 | 204 | 372 | 1,014 | ||||||||||||
Non-GAAP revenues | $ | 536,213 | $ | 474,652 | $ | 2,069,382 | $ | 1,977,391 | ||||||||
GAAP cost of revenues | $ | 209,950 | $ | 211,759 | $ | 873,570 | $ | 853,800 | ||||||||
Cost of revenues from amortization of intangible assets | (12,977 | ) | (16,366 | ) | (56,873 | ) | (64,853 | ) | ||||||||
Cost of revenues adjustments: professional services and hosting (1) | (10,709 | ) | (4,087 | ) | (31,299 | ) | (28,962 | ) | ||||||||
Cost of revenues adjustments: product and licensing (1) | (324 | ) | (50 | ) | (816 | ) | (348 | ) | ||||||||
Cost of revenues adjustments: maintenance and support (1) | (2,085 | ) | (650 | ) | (5,126 | ) | (3,767 | ) | ||||||||
Non-GAAP cost of revenues | $ | 183,855 | $ | 190,606 | $ | 779,456 | $ | 755,870 | ||||||||
GAAP gross profit | $ | 322,955 | $ | 254,151 | $ | 1,178,091 | $ | 1,085,562 | ||||||||
Gross profit adjustments | 29,403 | 29,895 | 111,835 | 135,959 | ||||||||||||
Non-GAAP gross profit | $ | 352,358 | $ | 284,046 | $ | 1,289,926 | $ | 1,221,521 | ||||||||
GAAP income (loss) from operations | $ | 4,970 | $ | (17,854 | ) | $ | (86,944 | ) | $ | 51,969 | ||||||
Gross profit adjustments | 29,403 | 29,895 | 111,835 | 135,959 | ||||||||||||
Research and development (1) | 13,771 | 6,564 | 40,087 | 33,061 | ||||||||||||
Sales and marketing (1) | 11,123 | 10,845 | 39,656 | 45,813 | ||||||||||||
General and administrative (1) | 5,836 | 10,269 | 33,801 | 42,321 | ||||||||||||
Acquisition-related costs, net | 3,264 | 5,689 | 16,101 | 27,740 | ||||||||||||
Amortization of intangible assets | 21,242 | 28,964 | 91,093 | 113,895 | ||||||||||||
Restructuring and other charges, net | 30,512 | 21,405 | 63,498 | 61,054 | ||||||||||||
Impairment of goodwill and other intangible assets | 33,034 | — | 170,941 | — | ||||||||||||
Other (4) | 10,274 | 2,285 | 59,700 | 10,265 | ||||||||||||
Non-GAAP income from operations | $ | 163,429 | $ | 98,062 | $ | 539,768 | $ | 522,077 | ||||||||
GAAP loss before income taxes | $ | (26,469 | ) | $ | (55,546 | ) | $ | (216,735 | ) | $ | (119,015 | ) | ||||
Gross profit adjustments | 29,403 | 29,895 | 111,835 | 135,959 | ||||||||||||
Research and development (1) | 13,771 | 6,564 | 40,087 | 33,061 | ||||||||||||
Sales and marketing (1) | 11,123 | 10,845 | 39,656 | 45,813 | ||||||||||||
General and administrative (1) | 5,836 | 10,269 | 33,801 | 42,321 | ||||||||||||
Acquisition-related costs, net | 3,264 | 5,689 | 16,101 | 27,740 | ||||||||||||
Amortization of intangible assets | 21,242 | 28,964 | 91,093 | 113,895 | ||||||||||||
Restructuring and other charges, net | 30,512 | 21,405 | 63,498 | 61,054 | ||||||||||||
Non-cash interest expense | 12,000 | 16,383 | 49,091 | 59,295 | ||||||||||||
Loss on extinguishment of debt | (348 | ) | — | (348 | ) | 18,565 | ||||||||||
Impairment of goodwill and other intangible assets | 33,034 | — | 170,941 | — | ||||||||||||
Other (4) | 10,274 | 2,285 | 59,700 | 10,265 | ||||||||||||
Non-GAAP income before income taxes | $ | 143,642 | $ | 76,753 | $ | 458,720 | $ | 428,953 | ||||||||
(4) Includes approximately $8.1 million and $51.6 million in professional services costs related to evaluating strategic alternatives for certain businesses and establishing our Automotive business as an independent reporting segment, for the three and twelve months ended September 30, 2018, respectively. | ||||||||||||||||
Page | 11 | of 14 | ||
2018 fourth quarter results | ||
Press release | ||
November 19, 2018 | ||
Nuance Communications, Inc.
Supplemental Financial Information - GAAP to Non-GAAP Reconciliations, continued
(in thousands, except per share amounts)
Unaudited
Three months ended | Twelve months ended | |||||||||||||||
September 30, | September 30, | |||||||||||||||
2018 | 2017 | 2018 | 2017 | |||||||||||||
GAAP provision (benefit) for income taxes | $ | 8,597 | $ | 9,878 | $ | (56,807 | ) | $ | 31,981 | |||||||
Income tax effect of Non-GAAP adjustments | 36,854 | 44,971 | 134,086 | 184,020 | ||||||||||||
Removal of valuation allowance and other items | (6,800 | ) | (39,058 | ) | (54,040 | ) | (95,515 | ) | ||||||||
Removal of discrete items (3) | (7,496 | ) | 748 | 83,573 | (572 | ) | ||||||||||
Non-GAAP provision for income taxes | $ | 31,155 | $ | 16,539 | $ | 106,812 | $ | 119,914 | ||||||||
GAAP net loss | $ | (35,066 | ) | $ | (65,424 | ) | $ | (159,928 | ) | $ | (150,996 | ) | ||||
Acquisition-related adjustment - revenues (2) | 3,308 | 8,742 | 17,721 | 38,029 | ||||||||||||
Acquisition-related costs, net | 3,264 | 5,689 | 16,101 | 27,740 | ||||||||||||
Cost of revenue from amortization of intangible assets | 12,977 | 16,366 | 56,873 | 64,853 | ||||||||||||
Amortization of intangible assets | 21,242 | 28,964 | 91,093 | 113,895 | ||||||||||||
Restructuring and other charges, net | 30,512 | 21,405 | 63,498 | 61,054 | ||||||||||||
Loss on extinguishment of debt | (348 | ) | — | (348 | ) | 18,565 | ||||||||||
Impairment of goodwill and other intangible assets | 33,034 | — | 170,941 | — | ||||||||||||
Stock-based compensation (1) | 43,848 | 32,465 | 150,785 | 154,272 | ||||||||||||
Non-cash interest expense | 12,000 | 16,383 | 49,091 | 59,295 | ||||||||||||
Adjustment to income tax expense | (22,558 | ) | (6,661 | ) | (163,619 | ) | (87,933 | ) | ||||||||
Other (4) | 10,274 | 2,286 | 59,700 | 10,264 | ||||||||||||
Non-GAAP net income | $ | 112,487 | $ | 60,215 | $ | 351,908 | $ | 309,038 | ||||||||
Non-GAAP diluted net income per share | $ | 0.38 | $ | 0.20 | $ | 1.19 | $ | 1.05 | ||||||||
Diluted weighted average common shares outstanding | 294,088 | 295,004 | 295,381 | 295,129 | ||||||||||||
(3) As a result of the Tax Cuts and Jobs Act ("TCJA"), we remeasured certain deferred tax assets and liabilities at the lower rates and recorded approximately $92.9 million of tax benefits for fiscal year 2018. Additionally, we recorded a $5.8 million provision for the deemed repatriation of foreign cash and earnings, which is estimated based upon estimated foreign earnings and foreign income taxes. | ||||||||||||||||
(4) Includes approximately $8.1 million and $51.6 million in professional services costs costs related to evaluating strategic alternatives for certain businesses and establishing our Automotive business as an independent reporting segment, for the three and twelve months ended September 30, 2018, respectively. | ||||||||||||||||
Page | 12 | of 14 | ||
2018 fourth quarter results | ||
Press release | ||
November 19, 2018 | ||
Nuance Communications, Inc.
Supplemental Financial Information - GAAP to Non-GAAP Reconciliations, continued
(in thousands)
Unaudited
Three months ended September 30, | Twelve months ended September 30, | ||||||||||||||
2018 | 2017 | 2018 | 2017 | ||||||||||||
(1) Stock-based compensation | |||||||||||||||
Cost of professional services and hosting | $ | 10,709 | $ | 4,087 | $ | 31,299 | $ | 28,962 | |||||||
Cost of product and licensing | 324 | 50 | 816 | 348 | |||||||||||
Cost of maintenance and support | 2,085 | 650 | 5,126 | 3,767 | |||||||||||
Research and development | 13,771 | 6,564 | 40,087 | 33,061 | |||||||||||
Sales and marketing | 11,123 | 10,845 | 39,656 | 45,813 | |||||||||||
General and administrative | 5,836 | 10,269 | 33,801 | 42,321 | |||||||||||
Total | $ | 43,848 | $ | 32,465 | $ | 150,785 | $ | 154,272 | |||||||
(2) Acquisition-related revenue | |||||||||||||||
Revenues | $ | 3,308 | $ | 8,742 | $ | 17,721 | $ | 38,029 | |||||||
Total | $ | 3,308 | $ | 8,742 | $ | 17,721 | $ | 38,029 | |||||||
Page | 13 | of 14 | ||
2018 fourth quarter results | ||
Press release | ||
November 19, 2018 | ||
Nuance Communications, Inc.
Supplemental Financial Information – GAAP to Non-GAAP Reconciliations, continued
(in millions)
Unaudited
Hosting Revenues | Q1 | Q2 | Q3 | Q4 | FY | Q1 | Q2 | Q3 | Q4 | FY | ||||||||||||||||||||||||||||||
2017 | 2017 | 2017 | 2017 | 2017 | 2018 | 2018 | 2018 | 2018 | 2018 | |||||||||||||||||||||||||||||||
GAAP Revenues | $ | 193.3 | $ | 202.2 | $ | 189.4 | $ | 149.0 | $ | 733.8 | $ | 185.1 | $ | 194.4 | $ | 190.2 | $ | 201.3 | $ | 771.1 | ||||||||||||||||||||
Adjustment | 2.3 | 2.7 | 3.1 | 2.0 | 10.1 | 1.2 | 1.0 | 1.4 | 1.2 | 4.8 | ||||||||||||||||||||||||||||||
Non-GAAP Revenues | $ | 195.6 | $ | 204.8 | $ | 192.5 | $ | 150.9 | $ | 743.9 | $ | 186.3 | $ | 195.4 | $ | 191.7 | $ | 202.5 | $ | 775.9 | ||||||||||||||||||||
Maintenance and Support Revenues | Q1 | Q2 | Q3 | Q4 | FY | Q1 | Q2 | Q3 | Q4 | FY | ||||||||||||||||||||||||||||||
2017 | 2017 | 2017 | 2017 | 2017 | 2018 | 2018 | 2018 | 2018 | 2018 | |||||||||||||||||||||||||||||||
GAAP Revenues | $ | 82.5 | $ | 81.6 | $ | 80.5 | $ | 82.5 | $ | 327.1 | $ | 80.8 | $ | 78.4 | $ | 79.7 | $ | 79.1 | $ | 318.0 | ||||||||||||||||||||
Adjustment | 0.2 | 0.4 | 0.2 | 0.2 | 1.0 | 0.1 | 0.1 | 0.1 | 0.1 | 0.4 | ||||||||||||||||||||||||||||||
Non-GAAP Revenues | $ | 82.7 | $ | 82.0 | $ | 80.7 | $ | 82.7 | $ | 328.1 | $ | 80.9 | $ | 78.5 | $ | 79.8 | $ | 79.2 | $ | 318.4 | ||||||||||||||||||||
Perpetual Product and Licensing Revenues | Q1 | Q2 | Q3 | Q4 | FY | Q1 | Q2 | Q3 | Q4 | FY | ||||||||||||||||||||||||||||||
2017 | 2017 | 2017 | 2017 | 2017 | 2018 | 2018 | 2018 | 2018 | 2018 | |||||||||||||||||||||||||||||||
GAAP Revenues | $ | 78.7 | $ | 76.5 | $ | 73.5 | $ | 77.3 | $ | 306.0 | $ | 76.6 | $ | 73.0 | $ | 76.9 | $ | 98.2 | $ | 324.6 | ||||||||||||||||||||
Adjustment | 0.7 | 0.5 | 0.9 | 0.4 | 2.4 | 0.4 | 0.3 | 0.4 | 0.6 | 1.6 | ||||||||||||||||||||||||||||||
Non-GAAP Revenues | $ | 79.3 | $ | 77.0 | $ | 74.4 | $ | 77.7 | $ | 308.4 | $ | 76.9 | $ | 73.3 | $ | 77.2 | $ | 98.8 | $ | 326.2 | ||||||||||||||||||||
Recurring Product and Licensing Revenues | Q1 | Q2 | Q3 | Q4 | FY | Q1 | Q2 | Q3 | Q4 | FY | ||||||||||||||||||||||||||||||
2017 | 2017 | 2017 | 2017 | 2017 | 2018 | 2018 | 2018 | 2018 | 2018 | |||||||||||||||||||||||||||||||
GAAP Revenues | $ | 73.1 | $ | 82.8 | $ | 80.8 | $ | 92.8 | $ | 329.4 | $ | 85.2 | $ | 88.3 | $ | 91.8 | $ | 94.3 | $ | 359.7 | ||||||||||||||||||||
Adjustment | 5.1 | 7.8 | 5.0 | 6.1 | 24.1 | 5.4 | 2.7 | 1.4 | 1.3 | 10.8 | ||||||||||||||||||||||||||||||
Non-GAAP Revenues | $ | 78.2 | $ | 90.6 | $ | 85.8 | $ | 98.9 | $ | 353.5 | $ | 90.7 | $ | 90.9 | $ | 93.2 | $ | 95.6 | $ | 370.4 | ||||||||||||||||||||
Professional Services Revenues | Q1 | Q2 | Q3 | Q4 | FY | Q1 | Q2 | Q3 | Q4 | FY | ||||||||||||||||||||||||||||||
2017 | 2017 | 2017 | 2017 | 2017 | 2018 | 2018 | 2018 | 2018 | 2018 | |||||||||||||||||||||||||||||||
GAAP Revenues | $ | 60.1 | $ | 56.5 | $ | 62.1 | $ | 64.3 | $ | 243.1 | $ | 73.9 | $ | 80.2 | $ | 64.2 | $ | 60.1 | $ | 278.3 | ||||||||||||||||||||
Adjustment | 0.2 | 0.1 | 0.1 | 0.1 | 0.5 | 0.1 | — | — | — | 0.2 | ||||||||||||||||||||||||||||||
Non-GAAP Revenues | $ | 60.3 | $ | 56.7 | $ | 62.2 | $ | 64.4 | $ | 243.6 | $ | 74.0 | $ | 80.2 | $ | 64.2 | $ | 60.1 | $ | 278.5 | ||||||||||||||||||||
Total Recurring Revenues | Q1 | Q2 | Q3 | Q4 | FY | Q1 | Q2 | Q3 | Q4 | FY | ||||||||||||||||||||||||||||||
2017 | 2017 | 2017 | 2017 | 2017 | 2018 | 2018 | 2018 | 2018 | 2018 | |||||||||||||||||||||||||||||||
GAAP Revenues | $ | 353.0 | $ | 370.2 | $ | 354.5 | $ | 328.6 | $ | 1,406.4 | $ | 355.3 | $ | 365.0 | $ | 365.9 | $ | 377.9 | $ | 1,464.2 | ||||||||||||||||||||
Adjustment | 7.5 | 11.4 | 8.7 | 8.2 | 35.9 | 6.9 | 3.9 | 2.8 | 2.7 | 16.3 | ||||||||||||||||||||||||||||||
Non-GAAP Revenues | $ | 360.5 | $ | 381.7 | $ | 363.2 | $ | 336.8 | $ | 1,442.3 | $ | 362.2 | $ | 368.9 | $ | 368.7 | $ | 380.6 | $ | 1,480.5 | ||||||||||||||||||||
Schedules may not add due to rounding.
Page | 14 | of 14 | ||
Exhibit 99.2
1 | 2018 fourth quarter and fiscal year results |
Prepared remarks | |
November 19, 2018 | |
Prepared Remarks
Nuance Fourth Quarter and Fiscal Year 2018
Nuance is providing these prepared remarks, in combination with its press release, to provide shareholders and analysts additional time and detail for analyzing our results in advance of our quarterly conference call and live webcast. These prepared remarks will not be read on the call.
The conference call will begin at 5:00 p.m. ET today and will include comments on the Company’s activities, accompanied by a PowerPoint presentation to better illustrate the discussion, followed by questions and answers. To access the live broadcast and the PowerPoint, please visit the Investor Relations section of Nuance’s website at http://investors.nuance.com. The call can also be heard by dialing 877-273-6124 or 647-689-5393 at least five minutes prior to the call and referencing conference code 2572316. A replay will be available within 24 hours of the conclusion of the live call and available on the Investor Relations section of Nuance’s website at http://investors.nuance.com or by dialing 800-585-8367 or 416-621-4642 and using the access code 2572316.
These remarks and Nuance’s quarterly conference call remarks include certain forward-looking statements and non-GAAP financial measures. Please see the section, “Safe Harbor and Forward-Looking Statements” in this document for important caveats with respect to forward-looking information. Please also see the section, “Discussion of Non-GAAP Financial Measures” and the related Supplemental Financial Information in this document for more details on our non-GAAP financial measures.
Q4 18 Results Highlights
Nuance delivered on its commitments in the fourth quarter, as evidenced by strong performance across key financial metrics. In addition, we implemented significant changes to our Board of Directors and governance polices, as well as conducted a comprehensive strategic and portfolio review.
Q4 18 non-GAAP revenue of $536.2 million and non-GAAP diluted EPS of $0.38 were above the high end of our guidance range due to revenue outperformance in Devices with $10 million of unplanned source code license deals, solid performance in Healthcare, Enterprise and Automotive, and from disciplined expense management. Net new bookings for Q4 18 were within our expectations, and grew 10% over the prior year’s quarter owing to strength in Automotive, Enterprise and Devices.
We also generated $149.4 million in cash flow from operations during the quarter, above our expectations.
Our performance highlights for Q4 18 include (we remind our readers that Q4 17 results were burdened by the effects of the malware incident):
• | GAAP revenue grew 14% over the prior year to $532.9 million. |
• | Non-GAAP revenue grew 13% over the prior year to $536.2 million. |
• | Organic revenue grew 12% to $536.2 million from $479.6 million in the prior year period. |
• | Recurring revenue represented 71% of both GAAP and non-GAAP revenue, compared to 71% for both GAAP and non-GAAP for the prior year period. |
• | GAAP gross margin was 60.6%, an improvement of 610 basis points over the prior year. Non-GAAP gross margin was 65.7%, an improvement of 590 basis points over the prior year. |
 | © 2018 Nuance Communications, Inc. All rights reserved | |
2 | 2018 fourth quarter results |
Prepared remarks | |
November 19, 2018 | |
• | GAAP operating margin was 0.9%, up 480 basis points from (3.8)% in Q4 17. Non-GAAP operating margin was 30.5%, up 980 basis points from 20.7% in the fourth quarter of fiscal year 2017. Included in our GAAP results was a goodwill and other intangible asset impairment of $33.0 million related to the decision during the quarter to wind down our Subscription Revenue Services (SRS) and Devices businesses. |
• | GAAP loss per share was $(0.12) in Q4 18, compared with $(0.23) in Q4 17. |
• | Non-GAAP diluted EPS was $0.38, compared with $0.20 in Q4 17. |
• | Cash flow from operations was $149.4 million or 133% of non-GAAP net income, compared to $(3.5) million, or (6)% of non-GAAP net income, in the prior year period. |
Our performance summary for fiscal year 2018 includes the following highlights:
• | GAAP revenue grew 6% over the prior year to $2,051.7 million. |
• | Non-GAAP revenue grew 5% over the prior year, to $2,069.4 million. |
• | Organic revenue grew 4%, to $2,078.0 million from $2,007.4 million in the prior year. |
• | Recurring revenue represented 71% of GAAP and 72% of non-GAAP revenue, respectively, compared to 73% in fiscal year 2017 for both measures. |
• | GAAP gross margin was 57.4%, up 140 basis points from fiscal year 2017. Non-GAAP gross margin was 62.3%, an improvement of 60 basis points from 61.8% in the prior year. |
• | GAAP operating margin was (4.2)%, down 690 basis points from 2.7% in the prior year. Non-GAAP operating margin was 26.1%, down 30 basis points from 26.4% in the prior year. Included in our GAAP results was a goodwill and other intangible asset impairment of $170.9 million related to SRS business disruption in Q2 18 as well as the Q4 18 decision to wind down our SRS and Devices businesses. |
• | GAAP net loss was $(159.9) million, compared with $(151.0) million in fiscal year 2017. |
• | GAAP loss per share was $(0.55), compared with $(0.52) per share in fiscal year 2017. |
• | Non-GAAP diluted EPS was $1.19, compared with $1.05 in fiscal year 2017. |
• | Cash flow from operations was $444.4 million or 126% of non-GAAP net income, compared to $378.9 million, or 123% of non-GAAP net income, in the prior year. |
Portfolio Review, Business Review and Transformation Program
After completing a strategic review, Nuance has created a comprehensive plan that focuses on Healthcare and Enterprise, where we can continue our innovation in conversational AI for our customers, helping them solve mission-critical business problems. The plan also includes simplified operations and careful attention to capital allocation and leverage.
Accordingly, as we begin fiscal year 2019, the Company has announced significant decisions about its Automotive and Imaging segments.
We intend to spin off the Automotive Segment into a new, independent, publicly traded company. Our automotive business is the market leader in voice recognition and virtual assistants for car infotainment and communication systems, delivering critical enabling technology for the future of mobility. Becoming a pure-play next generation automotive software company represents an important step in this segment’s growth as it transforms the passenger experience.
We also announced the sale of our Imaging segment to Kofax for a gross purchase price of $400 million. That transaction is targeted to close during our second fiscal quarter of 2019.
| © 2018 Nuance Communications, Inc. All rights reserved | |
3 | 2018 fourth quarter results |
Prepared remarks | |
November 19, 2018 | |
In addition, during Q4 18, Nuance commenced the wind-down of its non-core SRS business, which provides services to the mobile consumer market, primarily in Brazil, India, and other emerging markets. The Company is also winding down its Devices business. These decisions resulted in a goodwill and other intangible impairment of $33.0 million during the quarter.
Additional information on the Imaging and Automotive segment transactions are available in press releases issued November 12, 2018 and November 19, 2018, respectively.
Governance Update
During Q4 18, our Board of Directors embarked on a series of changes to advance the strategic focus of the Company and address matters raised by shareholders in recent years. During the quarter, we announced significant changes to the composition and leadership of our Board, and related governance practices, including:
• | The appointment of four new independent directors; |
• | The naming of a new independent non-executive Board Chair; |
• | Refreshing all board committees, which now entirely comprise independent directors; and |
• | Adoption of a majority voting standard. |
In addition, Nuance has had active engagement with shareholders representing a majority of its outstanding shares and is incorporating their feedback into our compensation principles and practices, including utilizing a total shareholder return approach for executive compensation. Responding to that feedback, following the quarter, Nuance announced that its Board approved a change to its Bylaws allowing a shareholder or group of shareholders owning at least 20% of its outstanding common stock to request a special meeting of stockholders.
(For additional details, see the November 9, 2018 press release.)
Returning Capital to Shareholders and Strengthening the Balance Sheet
In Q3 18, the Company implemented a capital allocation strategy for the fiscal year focused on opportunistic share repurchase and debt repayment, and de-emphasizing acquisitions. From Q3 18 and through fiscal year end on September 30, 2018, Nuance repurchased a total of 9.7 million shares of common stock, representing 3.3% of total shares outstanding, at an average price of $14.03 per share, and a total purchase price of $136.1 million. During Q4 18, Nuance repurchased 1.6 million shares of its common stock, at an average price of $15.16 per share and a total purchase price of $24.1 million.
As of November 16, 2018 and since the beginning of fiscal 2018, the Company had repurchased a total of 10.1 million shares, at an aggregate purchase price of $143.2 million, and has $550.2 million still available under its existing authorization for future share repurchases.
In addition, the Company repaid $150 million of the its 2020 5.375% high-yield bonds at par, reducing annual cash interest expense by $8.1 million. As a result, total debt maturity value is $2.44 billion as of September 30, 2018, down from $2.59 billion as of June 30, 2018, and the Company’s net debt leverage ratio is 3.3x.
| © 2018 Nuance Communications, Inc. All rights reserved | |
4 | 2018 fourth quarter results |
Prepared remarks | |
November 19, 2018 | |
Q4 and Fiscal 20818 Summary of GAAP & Non-GAAP Financial Results
(for reconciliation of GAAP to non-GAAP measures, please see the tables included in this document)
($ in millions except earnings per share) | Q4 2017 | Q4 2018 | Change* | FY 2017 | FY 2018 | Change* | |
Net New Bookings % Growth | $424.4 | $468.5 | $44.0 10% | $1,653.6 | $1,734.6 | $81.0 5% | |
GAAP Revenue % Recurring Revenue | $465.9 71% | $532.9 71% | $67.0 | $1,939.4 73% | $2,051.7 71% | $112.3 | |
Non-GAAP Revenue % Recurring Revenue | $474.7 71% | $536.2 71% | $61.6 | $1,977.4 73% | $2,069.4 72% | $92.0 | |
Organic Revenue % Growth | $479.6 | $536.2 | $56.6 12% | $2,007.4 | $2,078.0 | $70.6 4% | |
GAAP Gross Profit Gross Margin % | $254.2 54.5% | $323.0 60.6% | $68.8 610 bps | $1,085.6 56.0% | $1,178.1 57.4% | $92.5 140 bps | |
Non-GAAP Gross Profit Gross Margin % | $284.0 59.8% | $352.4 65.7% | $68.3 590 bps | $1,221.5 61.8% | $1,289.9 62.3% | $68.4 60 bps | |
GAAP Operating Income GAAP Operating Margin | $(17.9) -3.8% | $5.0 0.9% | $22.8 480 bps | $52.0 2.7% | $(86.9) -4.2% | $(138.9) (690) bps | |
Non-GAAP Operating Income Non-GAAP Operating Margin | $98.1 20.7% | $163.4 30.5% | $65.4 980 bps | $522.1 26.4% | $539.8 26.1% | $17.7 (30) bps | |
GAAP Net Loss | $(65.4) | $(35.1) | $30.4 | $(151.0) | $(159.9) | $(8.9) | |
Non-GAAP Net Income | $60.2 | $112.5 | $52.3 | $309.0 | $351.9 | $42.9 | |
GAAP EPS | $(0.23) | $(0.12) | $0.10 | $(0.52) | $(0.55) | $(0.03) | |
Non-GAAP Diluted EPS | $0.20 | $0.38 | $0.18 | $1.05 | $1.19 | $0.14 | |
Cash Flow from Operations % non-GAAP Net Income | $(3.5) -6% | $149.4 133% | $152.9 | $378.9 123% | $444.4 126% | $65.6 | |
* Change in dollars, percentage and basis points calculated using actual results. May not add due to rounding for table presentation purposes. |
Q4 an Fiscal 2018 Detailed Financial Results
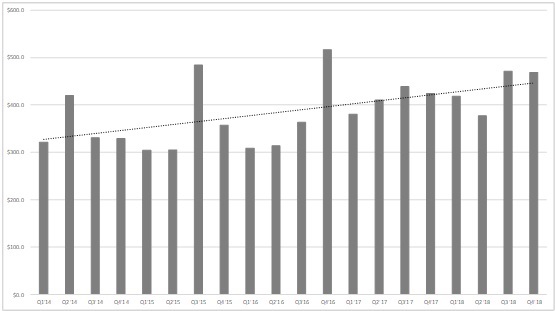
Net New Bookings
($ in millions) | Q1 2017 | Q2 2017 | Q3 2017 | Q4 2017 | FY 2017 | Q1 2018 | Q2 2018 | Q3 2018 | Q4 2018 | FY 2018 | ||
Net New Bookings | $380.3 | $410.4 | $438.5 | $424.4 | $1,653.6 | $418.4 | $376.6 | $471.1 | $468.5 | $1,734.6 | ||
Yr/yr Growth | 23% | 31% | 21% | (18)% | 10% | 10% | (8)% | 7% | 10 | % | 5 | % |
• | In Q4 18, net new bookings grew 10% year over year to $468.5 million, due primarily to growth in Automotive and Enterprise, partially offset by declines in Imaging as well as Clintegrity, which recorded a large deal in Q4 17. |
• | For the full fiscal year, net new bookings grew 5% compared to FY17, with strength in Automotive and Enterprise, offset in part by Imaging and Healthcare due to large strategic deal timing in 2017. We achieved the low end of our 5% to 7% full year growth guidance range due to the decision to begin winding down our SRS business in the fourth quarter. Had we not commenced the wind-down and instead |
| © 2018 Nuance Communications, Inc. All rights reserved | |
5 | 2018 fourth quarter results |
Prepared remarks | |
November 19, 2018 | |
continued to accept new customer contracts, we believe total net new bookings growth for the year would have approximated the midpoint of our full year guidance range.
Net New Bookings Trend
($ in millions)
Revenue
• | In Q4 18, GAAP revenue grew 14% to $532.9 million. |
• | For fiscal year 2018, GAAP revenue grew 6% to $2,051.7 million. |
• | On an as-reported basis, Q4 18 non-GAAP revenue grew 13% to $536.2 million from Q4 17. |
• | On an as-reported basis, fiscal year 2018 non-GAAP revenue grew 5% from fiscal year 2017. |
• | Organic revenue grew 12% in the quarter to $536.2 million from $479.6 million in the prior year period, led by strong performance in Dragon Medical cloud, Enterprise and Automotive, but was also aided by a favorable compare since Q4 17 included the malware incident. In Q4 18, while we continued to experience HIM erosion, HIM revenue increased by $25M year over year due to the significant revenue reduction from the malware incident in Q4 17. We also benefited from $10M of legacy IP source code license deals in our Devices business. These perpetual license deals reflect our plan to be opportunistic in monetizing our source code and IP in the Devices business, during the wind-down of that business. |
• | For fiscal year 2018, we delivered 4% organic revenue growth, driven by Dragon Medical cloud, Automotive and Enterprise, as well as strong first half performance in our EHR services business. In addition, we were aided by a favorable compare for the full year due to the 2017 malware incident. This growth was partially offset by expected declines in HIM and our Other business segment. |
| © 2018 Nuance Communications, Inc. All rights reserved | |
6 | 2018 fourth quarter results |
Prepared remarks | |
November 19, 2018 | |
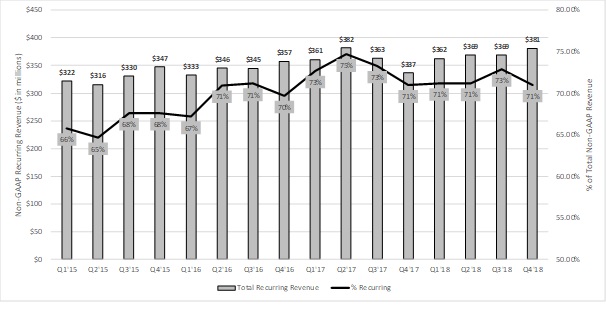
Non-GAAP Revenue by Type and as % of Total Non-GAAP Revenue*
Q1 2017 | Q2 2017 | Q3 2017 | Q4 2017 | FY 2017 | Q1 2018 | Q2 2018 | Q3 2018 | Q4 2018 | FY 2018 | |||
Hosting | $195.6 | $204.8 | $192.5 | $150.9 | $743.9 | $186.3 | $195.4 | $191.7 | $202.5 | $775.9 | ||
% of Revenue | 39% | 40% | 39% | 32% | 38% | 37% | 38% | 38% | 38 | % | 37 | % |
Maintenance and Support | $82.7 | $82.0 | $80.7 | $82.7 | $328.1 | $80.9 | $78.5 | $79.8 | $79.2 | $318.4 | ||
% of Revenue | 17% | 16% | 16% | 17% | 17% | 16% | 15% | 16% | 15 | % | 15 | % |
Perpetual Product and Licensing | $79.3 | $77.0 | $74.4 | $77.7 | $308.4 | $76.9 | $73.3 | $77.2 | $98.8 | $326.2 | ||
% of Revenue | 16% | 15% | 15% | 16% | 16% | 15% | 14% | 15% | 18 | % | 16 | % |
Recurring Product and Licensing | $78.2 | $90.6 | $85.8 | $98.9 | $353.5 | $90.7 | $90.9 | $93.2 | $95.6 | $370.4 | ||
% of Revenue | 16% | 18% | 17% | 21% | 18% | 18% | 18% | 18% | 18 | % | 18 | % |
Professional Services | $60.3 | $56.7 | $62.2 | $64.4 | $243.6 | $74.0 | $80.2 | $64.2 | $60.1 | $278.5 | ||
% of Revenue | 12% | 11% | 13% | 14% | 12% | 15% | 15% | 13% | 11 | % | 13 | % |
Total Non-GAAP Revenue | $496.0 | $511.1 | $495.6 | $474.7 | $1,977.4 | $508.8 | $518.3 | $506.0 | $536.2 | $2,069.4 | ||
Total Recurring Revenue* | $360.5 | $381.7 | $363.2 | $336.8 | $1,442.3 | $362.2 | $368.9 | $368.7 | $380.6 | $1,480.5 | ||
Recurring % of Total Non-GAAP Revenue | 73% | 75% | 73% | 71% | 73% | 71% | 71% | 73% | 71 | % | 72 | % |
* Total non-GAAP recurring revenue is the sum of hosting, maintenance and support, recurring product and licensing, as well as the portion of non-GAAP professional services revenue delivered under ongoing subscription contracts. Non-GAAP recurring product and licensing revenue comprises term-based and ratable licenses as well as revenue from royalty arrangements.
Recurring Revenue
• | In Q4 18, GAAP recurring revenue was $377.9 million, or 71% of total revenue, compared to $328.6 million, or 71% of total revenue, a year ago. Non-GAAP recurring revenue in Q4 18 was $380.6 million, or 71% of total non-GAAP revenue, compared to $336.8 million, or 71% of total non-GAAP revenue a year ago. The recurring revenue percentage remained flat year-over-year, despite the recovery of HIM revenue lost due to the malware incident in Q4 17 and continued growth in Dragon Medical cloud and Automotive recurring revenue, due to record high Enterprise license and the Devices source license deals in our perpetual product and licensing category. |
• | For fiscal year 2018, GAAP recurring revenue was $1,464.2 million, or 71% of total revenue, compared to $1,406.4 million, or 73% of total revenue, a year ago. Non-GAAP recurring revenue in FY18 was $1,480.5 million, or 72%, compared to $1,442.3 million, or 73% of total revenue, a year ago. Although recurring revenue grew with strong performance in Dragon Medical cloud and Automotive, the percentage declined due to strong first half EHR Services and record Enterprise license performance, as well as continued declines in HIM and Other segment hosting revenues. |
| © 2018 Nuance Communications, Inc. All rights reserved | |
7 | 2018 fourth quarter results |
Prepared remarks | |
November 19, 2018 | |
Estimated On-Demand Contract Values
• | At the end of the fourth quarter, the estimated three-year value of total on-demand contracts was $2,430.2 million, up from $2,307.3 million a year ago. The increase was primarily due to growth in our Dragon Medical cloud and Automotive connected services businesses, offset in part, as expected, by declines in our HIM and Other segment. |
(in millions) | Q1 2017 | Q2 2017 | Q3 2017 | Q4 2017 | Q1 2018 | Q2 2018 | Q3 2018 | Q4 2018 |
Estimated 3-Year Value of Total On-Demand Contracts | $2,499.4 | $2,568.3 | $2,359.5 | $2,307.3 | $2,351.2 | $2,335.9 | $2,394.3 | $2,430.2 |
Gross Margin
• | In Q4 18, GAAP gross margin was 60.6%, an increase of 610 basis points year-over-year. |
• | In fiscal year 2018, GAAP gross margin was 57.4%, compared to 56.0% in fiscal year 2017. |
• | In Q4 18, non-GAAP gross margin was 65.7%, an increase of 590 basis points year over year, due to revenue improvement over Q4 17 driven by the malware impact on our Q4 17 gross margin, high margin revenue contributions from the Devices source code license deals, and from Enterprise licenses, somewhat offset by increased revenues from low margin EHR services revenue. |
• | In fiscal year 2018, non-GAAP gross margin was 62.3%, compared to 61.8% in FY17. The 60 basis point improvement was driven by product mix, including growth in Dragon Medical cloud and declines in HIM revenues, the malware impact on our 2017 margins, and growth in Enterprise license and Automotive royalties. These margin-accretive dynamics were partially offset by a higher mix of low margin EHR Services revenue. |
Operating Expenses and Operating Margin
• | Q4 18 GAAP operating expenses were $318.0 million, compared to $272.0 million a year ago. GAAP operating margin was 0.9%, compared to (3.8)% in Q4 17. Included in our GAAP results was a goodwill and other intangible asset impairment of $33.0 million related to the wind-down our SRS and Devices businesses. |
| © 2018 Nuance Communications, Inc. All rights reserved | |
8 | 2018 fourth quarter results |
Prepared remarks | |
November 19, 2018 | |
• | Q4 18 Non-GAAP operating expenses were $188.9 million, compared to $186.0 million a year ago. Non-GAAP operating margin in Q4 18 was 30.5%, an increase of 980 basis points year over year, primarily due to the gross margin dynamics noted above. |
• | In fiscal year 2018, GAAP operating expenses were $1,265.0 million, compared to $1,033.6 million in fiscal year 2017. GAAP operating margin for fiscal 2018 was (4.2)%, compared to 2.7% in FY17. Included in our GAAP results was a goodwill and other intangible asset impairment of $170.9 million related to SRS business disruption in Q2 18 as well as commencing a wind-down our SRS and Devices businesses in Q4 18. |
• | In fiscal year 2018, Non-GAAP operating expenses were $750.2 million, compared to $699.4 million a year ago. Non-GAAP operating margin in fiscal year 2018 was 26.1%, a decrease of 30 basis points year over year despite the revenue growth and gross margin improvement. This is a result of planned investments in security and conversational AI research and development, as well as higher legal expenses related to IP protection. We overachieved our most recent operating margin guidance primarily due to the Devices source code license deals, which contributed approximately 40 basis points of operating margin, along with overall strong revenue performance and lower expenses from disciplined cost management. |
Interest Expense
• | GAAP net interest expense was $31.1 million in Q4 18, down $6.9 million year over year. |
• | Non-GAAP net interest expense was $19.1 million in Q4 18, down $2.5 million year over year. |
• | The decrease in GAAP and non-GAAP net interest expense in Q4 18 reflects the repayment of $331.2 million of the 2.75% convertible debt in November 2017, as well as $150 million of the 5.375% high yield bonds in September 2018, together with higher interest income on investments. |
• | For fiscal year 2018, GAAP net interest was $127.9 million, compared to $150.0 million in fiscal year 2017. |
• | For fiscal year 2018, non-GAAP net interest expense was $78.8 million compared to $90.7 million in fiscal year 2017, primarily due to the debt repayments noted above. |
Provision for Income Taxes
• | Q4 18 GAAP provision for income taxes was $8.6 million, compared to $9.9 million a year ago. |
• | Q4 18 non-GAAP provision for income taxes was $31.2 million, compared to $16.5 million a year ago. The non-GAAP effective tax rate was 21.7% in Q4 18, compared to 21.5% a year ago. |
• | Q4 18 cash taxes were $7.8 million, compared to $7.4 million in Q4 17. |
• | Fiscal year 2018 GAAP provision for income taxes was $(56.8) million, compared to $32.0 million a year ago. |
• | Fiscal year 2018 non-GAAP provision for income taxes was $106.8 million, compared to $119.9 million a year ago. The non-GAAP effective tax rate was 23.3%, compared to 28.0% in the prior year, primarily due to the change in domestic corporate tax rate. |
• | Fiscal year 2018 cash taxes totaled $30.4 million, compared to $27.1 million in FY17. |
Earnings Performance
• | GAAP loss per share in Q4 18 was $(0.12), compared to a loss of $(0.23) per share a year ago. |
• | Non-GAAP EPS in Q4 18 was $0.38 per diluted share, compared to $0.20 a year ago, above the high end of our guidance range and six cents above our mid-point. Half of the overachievement was due to the unplanned and non-recurring Devices source code license revenue deals and the other half was primarily due to overall strong revenue performance and lower expenses from disciplined cost management. |
• | For fiscal year 2018, GAAP loss per share was $(0.55), compared to a loss of $(0.52) per share a year ago. |
• | For fiscal year 2018, non-GAAP EPS was $1.19 per diluted share, compared to $1.05 a year ago. The $0.14 increase was driven by the change in domestic corporate tax rates, which contributed approximately $0.10 of additional EPS, along with higher operating profit and lower net interest expense. |
Cash Flow from Operations (CFFO)
• | CFFO in Q4 18 was $149.4 million, compared to $(3.5) million in the year-ago period. CFFO as a percent of non-GAAP net income was 133% in Q4 18 compared to (6)% in Q4 17. |
| © 2018 Nuance Communications, Inc. All rights reserved | |
9 | 2018 fourth quarter results |
Prepared remarks | |
November 19, 2018 | |
• | For fiscal year 2018, CFFO was $444.4 million, compared to $378.9 million in fiscal year 2018. For fiscal year 2018, CFFO as a percent of non-GAAP net income was 126%, compared to 123% in fiscal year 2017. |
(in millions) | Q1 2017 | Q2 2017 | Q3 2017 | Q4 2017 | FY 2017 | Q1 2018 | Q2 2018 | Q3 2018 | Q4 2018 | FY 2018 | ||
Cash Flow from Operations | $124.9 | $125.4 | $132.0 | $(3.5) | $378.9 | $86.1 | $109.3 | $99.7 | $149.4 | $444.4 | ||
Cash flow as % of non-GAAP net income | 162% | 135% | 167% | (6)% | 123% | 107% | 138% | 125% | 133 | % | 126 | % |
• | As of September 30, 2018, our balance of cash, cash equivalents and marketable securities was $473.5 million. |
Days Sales Outstanding (DSO)
• | In Q4 18, our DSOs were 64 days, down 12 days compared to a year ago, primarily due to the Malware impact on our DSOs in Q4 17. |
• | On a sequential basis, DSOs were down 7 days from Q3 18, primarily due to very strong collections in Q4 18. |
Q1 2017 | Q2 2017 | Q3 2017 | Q4 2017 | Q1 2018 | Q2 2018 | Q3 2018 | Q4 2018 | ||
Days Sales Outstanding | 71 | 69 | 66 | 76 | 78 | 72 | 71 | 64 | |
Deferred Revenue
• | We ended Q4 18 with deferred revenue of $873.0 million, up 11% compared to $790.0 million a year ago, due to up-front payments related to our bundled clinical documentation offerings in Healthcare and growth in Automotive connected services. |
(in millions) | Q1 2017 | Q2 2017 | Q3 2017 | Q4 2017 | Q1 2018 | Q2 2018 | Q3 2018 | Q4 2018 |
Total Deferred Revenue | $802.5 | $802.4 | $798.7 | $790.0 | $880.6 | $882.7 | $871.9 | $873.0 |
| © 2018 Nuance Communications, Inc. All rights reserved | |
10 | 2018 fourth quarter results |
Prepared remarks | |
November 19, 2018 | |
Segment and Business Driver Discussions
Non-GAAP Segment Revenue
($ in millions) | Q1 2017 | Q2 2017 | Q3 2017 | Q4 2017 | FY 2017 | Q1 2018 | Q2 2018 | Q3 2018 | Q4 2018 | FY 2018 | ||||||||||||||
Healthcare | $239.2 | $238.5 | $232.6 | $189.0 | $899.3 | $245.5 | $261.2 | $236.2 | $241.8 | $984.8 | ||||||||||||||
Yr/yr Organic Growth | (6)% | (5)% | (4)% | (22)% | (9)% | 1% | 8% | 0% | 27 | % | 8 | % | ||||||||||||
% of Total Revenue | 48% | 47% | 47% | 40% | 45% | 48% | 50% | 47% | 45 | % | 48 | % | ||||||||||||
Enterprise | $115.4 | $122.1 | $114.1 | $122.7 | $474.3 | $120.6 | $112.7 | $119.6 | $130.3 | $483.2 | ||||||||||||||
Yr/yr Organic Growth | 16% | 15% | 6% | 4% | 10% | 5% | (8)% | 5% | 6 | % | 2 | % | ||||||||||||
% of Total Revenue | 23% | 24% | 23% | 26% | 24% | 24% | 22% | 24% | 24 | % | 23 | % | ||||||||||||
Automotive | $58.9 | $61.7 | $63.1 | $68.5 | $252.2 | $61.5 | $69.0 | $73.8 | $75.2 | $279.4 | ||||||||||||||
Yr/yr Organic Growth | 26% | 16% | 7% | 20% | 17% | 5% | 11% | 9% | 3 | % | 7 | % | ||||||||||||
% of Total Revenue | 12% | 12% | 13% | 14% | 13% | 12% | 13% | 15% | 14 | % | 14 | % | ||||||||||||
Imaging | $52.1 | $53.0 | $49.4 | $63.2 | $217.7 | $55.6 | $48.9 | $54.2 | 54.1 | $212.9 | ||||||||||||||
Yr/yr Organic Growth | (15)% | (7 | )% | (13 | )% | (5 | )% | (10)% | 7% | (8)% | 10% | (14 | )% | (2 | )% | |||||||||
% of Total Revenue | 11% | 10% | 10% | 13% | 11% | 11% | 9% | 11% | 10 | % | 10 | % | ||||||||||||
Other | $30.5 | $35.7 | $36.4 | $31.2 | $133.8 | $25.6 | $26.5 | $22.2 | $34.7 | $109.1 | ||||||||||||||
Yr/yr Organic Growth | (36)% | (6 | )% | 6% | (18 | )% | (16)% | (23 | )% | (28 | )% | (39 | )% | 11 | % | (21 | )% | |||||||
% of Total Revenue | 6% | 7% | 7% | 7% | 7% | 5% | 5% | 4% | 6 | % | 5 | % | ||||||||||||
Total Non-GAAP Revenue | $496.0 | $511.1 | $495.6 | $474.7 | $1,977.4 | $508.8 | $518.3 | $506.0 | $536.2 | $2,069.4 | ||||||||||||||
Yr/yr Organic Growth | (3)% | 1% | (1 | )% | (9 | )% | (3)% | 2% | 1 | % | 1% | 12 | % | 4 | % | |||||||||
Yr/yr Constant Currency Organic Growth | — | % | (1 | )% | — | % | 12 | % | 3 | % | ||||||||||||||
Non-GAAP Segment Profit Margin
($ in millions) | Q1 2017 | Q2 2017 | Q3 2017 | Q4 2017 | FY 2017 | Q1 2018 | Q2 2018 | Q3 2018 | Q4 2018 | FY 2018 | ||
Healthcare | ||||||||||||
Non-GAAP Segment Profit | $78.6 | $83.3 | $70.5 | $29.8 | $262.1 | $77.4 | $87.4 | $77.7 | $88.9 | $331.4 | ||
Segment Profit Margin % | 33% | 35% | 30% | 16% | 29% | 32% | 33% | 33% | 37 | % | 34 | % |
Enterprise | ||||||||||||
Non-GAAP Segment Profit | $29.9 | $40.3 | $32.4 | $33.0 | $135.6 | $37.7 | $25.7 | $33.1 | $45.9 | $142.4 | ||
Segment Profit Margin % | 26% | 33% | 28% | 27% | 29% | 31% | 23% | 28% | 35 | % | 29 | % |
Automotive | ||||||||||||
Non-GAAP Segment Profit | $27.6 | $29.3 | $30.7 | $31.2 | $118.9 | $23.2 | $28.9 | $28.2 | $29.6 | $109.9 | ||
Segment Profit Margin % | 47% | 47% | 49% | 46% | 47% | 38% | 42% | 38% | 39 | % | 39 | % |
Imaging | ||||||||||||
Non-GAAP Segment Profit | $17.6 | $18.5 | $16.9 | $26.5 | $79.5 | $15.6 | $12.3 | $18.5 | $20.9 | $67.4 | ||
Segment Profit Margin % | 34% | 35% | 34% | 42% | 37% | 28% | 25% | 34% | 39 | % | 32 | % |
Other | ||||||||||||
Non-GAAP Segment Profit | $7.9 | $12.5 | $12.7 | $8.5 | $41.6 | $3.4 | $6.1 | $3.1 | $15.8 | $28.4 | ||
Segment Profit Margin % | 26% | 35% | 35% | 27% | 31% | 13% | 23% | 14% | 46 | % | 26 | % |
Total Non-GAAP Segment Profit | $161.6 | $184.0 | $163.2 | $128.9 | $637.7 | $157.4 | $160.3 | $160.5 | $201.2 | $679.5 | ||
Total Segment Profit Margin % | 33% | 36% | 33% | 27% | 32% | 31% | 31% | 32% | 38 | % | 33 | % |
| © 2018 Nuance Communications, Inc. All rights reserved | |
11 | 2018 fourth quarter results |
Prepared remarks | |
November 19, 2018 | |
Healthcare segment non-GAAP Q4 18 revenue grew 28% year over year on an as-reported basis, to $241.8 million, and was up 27% on an organic basis. Non-GAAP revenue growth was driven by Dragon Medical cloud, but was also aided by a favorable compare since Q4 17 included the malware incident. HIM revenue was $61.7 million in Q4 18 compared to $36.8 million in Q4 17, which was impacted by the malware incident. As discussed in prior quarters, Healthcare segment revenue has benefited from strong professional services growth, driven by EHR-implementation and optimization service offerings. Revenue from these offerings declined in Q4 18 compared to the first two quarters of this fiscal year, as expected, but performed better than our expectations during the quarter and remained above previous year levels.
Healthcare segment profit margin for Q4 18 was 37%, up 2,100 basis points from the same period last year, primarily due to the impact of malware on Q4 17 margins, coupled with continued organic revenue growth in Dragon Medical cloud.
Highlights for the Healthcare segment include:
• | Nuance and Epic delivered on a commitment made at HIMSS18 in March by launching the healthcare industry’s first and only commercially available, AI-powered virtual assistant. This announcement validates Nuance’s position as a pioneer in healthcare and reinforces the depth of our strategic development relationships with leading EHR vendors. |
• | For the sixth consecutive year, Nuance was ranked #1 in Black Book Research’s 2018 healthcare industry report for client experience, satisfaction and loyalty by hospitals and physician practices for our clinical documentation improvement and HIM solutions. |
• | Building on a history of providing hospitals’ clinical documentation improvement (CDI) teams with solutions, Nuance launched CDE One, an AI-powered, cloud-based clinical documentation excellence product suite, to help CDI teams collaborate and more efficiently manage their workflow. |
Enterprise
Non-GAAP Q4 18 revenue for our Enterprise segment grew 6% on an as-reported basis to $130.3 million, driven by strong license revenue growth. On an organic basis, revenue for the segment also grew 6% year over year.
Enterprise segment profit margin was 35% for the quarter, up 800 basis points from the prior year period due to license revenue growth and improved hosting margins.
Highlights for the Enterprise segment include:
• | Unveiled Nuance Prediction Service enabling brands to predict customers’ intents or next requests and proactively offer personalized, automated responses to quickly resolve any inquiry or concern without needing additional clarifying questions. |
• | In a first for Germany, Deutsche Telekom announced deployment of Nuance’s voice biometrics technology to offer subscribers easy and secure authentication, allowing individuals to use the sound of their voices to confirm their identities when calling for service. |
• | Landed highest combined rating of Intelligent Assistant (IA) and bot vendors for the second consecutive year in Opus Research’s "Decision Makers' Guide to Enterprise Intelligent Assistants,” topping the list for market presence, ability to scale and maturity of technology. |
• | New design wins in the quarters included Vodafone UK and BMO Bank of Montreal for Intelligent Customer Engagement; Free and Hotwire for Digital Engagement; The Kroger Company for Voice Engagement; and Centers for Medicare and Medicaid Services, Scotiabank and HSBC for Security and Biometrics. |
Automotive
Non-GAAP revenue as reported for our Automotive segment grew 10%, to $75.2 million, its highest revenue quarter to date. The business delivered 3% organic revenue growth in Q4 18, its tenth straight quarter of organic growth, and 7% organic revenue growth for the year.
| © 2018 Nuance Communications, Inc. All rights reserved | |
12 | 2018 fourth quarter results |
Prepared remarks | |
November 19, 2018 | |
Automotive segment profit margin was 39%, a decrease of 600 basis points from Q4 17, as expected, primarily as a result of increased research and development investments to support continued growth and innovation, and additional operating expenses from a Automotive acquisition in Q3 18.
Highlights for the Automotive segment include:
• | Announcing our work with KT in Asia Pacific to develop an automotive assistant built specifically for the Korean market, as well as a partnership with China’s Geely to provide AI-powered speech recognition for their joint venture with PROTON in Malaysia. |
• | New design wins include Mazda, Nissan, Daimler, Fiat-Chrysler, Volkswagen, BMW, Great Wall Motors, and SGMW. |
• | Drove end-to-end excellence and innovation in partnership with leading players in the industry, including Affectiva, to bring emotion recognition/intelligence into our automotive assistant. |
Imaging
Non-GAAP Q4 18 revenue for our Imaging segment was $54.1 million, a decline of 14% from the prior year period, both on an as reported and organic basis, primarily due to a large services project in Q4 17. Imaging segment profit margin was 39% in the quarter, down 300 basis points from the fourth quarter of fiscal year 2017, primarily due to the revenue decline.
Other
Our Other segment includes the results of our SRS and Devices businesses. The Other segment delivered non-GAAP revenue of $34.7 million in Q4 18, an increase of 11% year over year, on both an as reported and organic basis, due to strategic source code license deals in our Devices business. Consistent with our commentary in prior quarters, our SRS business continues to decline compared to prior year periods. Other segment profit margin was 46% in the quarter, up 1,800 basis points from the prior year, due to the one-time source code license deals in Devices.
As noted previously, as part of our business and portfolio review process, we are commencing a wind-down of the SRS and Devices businesses, resulting in a goodwill and other intangible asset impairment.
Guidance
Our guidance for fiscal 2019 reflects a number of changes underway within our business. As such, we note several important details, assumptions and changes for our guidance, including:
– | ASC 605 and 606: We will provide ASC 606 guidance for revenue and EPS on an annual basis only. The remainder of our guidance is on a 605 basis, which will be our primary basis for guiding 2019 quarterly and annual results. |
– | Automotive and Imaging separation costs: While we are including the full year operations of our Automotive and Imaging segment in our 2019 non-GAAP guidance, please know the separation costs associated with each of these transactions have been contemplated in our full year GAAP operating results guidance as well as our cash flow from operations expectations. We will update our non-GAAP operating guidance upon the close of each transaction. |
– | SRS and Devices: Our guidance fully contemplates the expected results of the wind-down activities of SRS and Devices which are included in our Other segment. |
– | Net New Bookings: We are eliminating guidance and reporting for Net New Bookings (NNB) based on shareholder feedback. |
– | Annualized Recurring Revenue: Consistent with our SaaS-based businesses, we are adding Annual Recurring Revenue (ARR) to our guidance and reporting. ARR represents the annualized value we have under contract at any given point in time. |
| © 2018 Nuance Communications, Inc. All rights reserved | |
13 | 2018 fourth quarter results |
Prepared remarks | |
November 19, 2018 | |
– | Segment revenue: We are providing guidance on a segment level, including a detailed break-out of the Healthcare revenue line items to provide insight into the transition to Dragon Medical cloud. |
– | A PowerPoint presentation will be available for our earnings webcast and on our Investor Relations website with additional guidance detail. |
Revenue Guidance
We encourage investors to evaluate Nuance and our progress by focusing on the growth of our segments more so than on a consolidated basis. As such, we are providing additional revenue guidance by segment on an annual basis.
For fiscal year 2019, we expect total non-GAAP revenue between $2,055 million and $2,105 million, representing organic growth between (1)% and 1%. Revenue guidance for each segment includes:
Segment | Low | High | |
Healthcare | $989.0 | $1,011.0 | |
Enterprise | $490.0 | $500.0 | |
Automotive | $306.0 | $312.0 | |
Strategic | $1,785.0 | $1,823.0 | |
Organic Growth | 2% | 4% | |
Imaging | $208.0 | $216.0 | |
Other | $62.0 | $66.0 | |
Total Nuance | $2,055.0 | $2,105.0 | |
Organic Growth | (1)% | 1% | |
Segment Margin Guidance
We expect Healthcare, Enterprise and Imaging segment margins to be similar to 2018, whereas Automotive will likely decline from 39% to between 35% and 37% due to additional investment and Other will likely decline to 21% to 24%.
Fiscal Year 2019 Guidance
As noted previously, we will provide ASC 606 guidance for revenue and EPS on an annual basis only. The remainder of our guidance is on a 605 basis.
For FY 19, under the ASC 605 standard, we expect:
• | GAAP revenue in a range of $2,048 million to $2,098 million. |
• | Non-GAAP revenue in a range of $2,055 million to $2,105 million. |
• | Organic revenue growth in a range of (1)% to 1%. |
• | Non-GAAP recurring revenue in a range of 73% to 74%. |
• | Non-GAAP gross margin of approximately 63%. |
• | Non-GAAP operating margin in a range of 26.0% to 26.5%. |
• | Non-GAAP tax rate of approximately 23%. |
• | GAAP EPS in a range of $(0.04) to $0.04 per diluted share. |
• | Non-GAAP diluted EPS in a range of $1.19 to $1.27 per diluted share. |
| © 2018 Nuance Communications, Inc. All rights reserved | |
14 | 2018 fourth quarter results |
Prepared remarks | |
November 19, 2018 | |
• | Cash flow from operations between $390 to $435 million. This assume payments of restructuring activities of $60 to $70 million, Imaging separation activities of $15 to $20 million, and Auto separation activities of $25 to $35 million. |
• | Deferred revenue is expected to grow between 3% and 5% during FY 19, driven primarily by continued growth in Automotive connected services. |
• | Non-GAAP net interest and other expense between $70 and $73 million. Our guidance does not assume any debt repayment. |
• | Cash taxes of approximately $35 million. |
• | Diluted share count of approximately 298 million. Our guidance does not contemplate any share repurchases. |
• | ARR for Dragon Medical cloud between $245.0 million and $255.0 million. |
• | Capital expenditures between $65 million and $75 million. This includes normal capital expenditures of approximately $55 million, as well as $10 million to $20 million related to Auto separation stand up activities. |
For FY 19, under the ASC 606 standard, we expect:
• | GAAP revenue in a range of $1,990 million to $2,070 million |
• | Non-GAAP revenue in a range of $1,995 million to $2,075 million |
• | GAAP EPS in a range of $(0.24) and $(0.02) per share |
• | Non-GAAP EPS in a range of $1.02 to $1.21 per diluted share |
Q1 19 Guidance
We also are providing the following guidance for our first quarter of fiscal year 2019:
($ in millions except earnings per share) | Q1 2019 GUIDANCE (ASC 605) |
GAAP Revenue | $495.0 to $509.0 |
Non-GAAP Revenue | $497.0 to $511.0 |
GAAP Diluted EPS | $(0.16) to $(0.13) |
Non-GAAP Diluted EPS | $0.27 to $0.29 |
This ends the prepared remarks.
About Nuance Communications, Inc.
Nuance Communications, Inc. (NASDAQ: NUAN) is the pioneer and leader in conversational and cognitive AI innovations that bring intelligence to everyday work and life. The Company delivers solutions that can understand, analyze and respond to human language to increase productivity and amplify human intelligence. With decades of domain and artificial intelligence expertise, Nuance works with thousands of organizations - in global industries that include healthcare, telecommunications, automotive, financial services, and retail - to create stronger relationships and better experiences for their customers and workforce. For more information, please visit www.nuance.com.
Trademark reference: Nuance and the Nuance logo are registered trademarks or trademarks of Nuance Communications, Inc. or its affiliates in the United States and/or other countries. All other trademarks referenced herein are the property of their respective owners.
Safe Harbor and Forward-Looking Statements
Statements in this document regarding future performance and our management’s future expectations, beliefs, goals, plans or prospects constitute forward-looking statements within the meaning of the Private Securities Litigation Reform Act of 1995. Any statements that are not statements of historical fact (including statements containing the words “believes,” “plans,” “anticipates,” “expects,” "intends" or “estimates” or similar expressions)
| © 2018 Nuance Communications, Inc. All rights reserved | |
15 | 2018 fourth quarter results |
Prepared remarks | |
November 19, 2018 | |
should also be considered to be forward-looking statements. There are a number of important factors that could cause actual results or events to differ materially from those indicated by such forward-looking statements, including but not limited to: the ability to effect the separation and spin-off of our Auto business; our ability to close the sale of our Imaging business, our ability to successfully wind-down certain products or business lines, fluctuations in demand for our existing and future products; fluctuations in the mix of products and services sold in specific periods; further unanticipated costs resulting from the FY17 malware incident including potential costs associated with litigation or governmental investigations that may result from the incident; our ability to control and successfully manage our expenses and cash position; our ability to develop and execute in a timely manner our productivity and cost initiatives; the effects of competition, including pricing pressure, and changing business models in the markets and industries we serve; changes to economic conditions in the United States and internationally; uncertainties associated with the transition of our chief executive officer, and the addition of a number of new directors; the imposition of tariffs or other trade measures particularly between the United States and China; potential future impairment charges related to our newly reorganized business reporting units; fluctuating currency rates; possible quality issues in our products and technologies; our ability to successfully integrate operations and employees of acquired businesses; the conversion rate of bookings into revenue; the ability to realize anticipated synergies from acquired businesses; and the other factors described in our most recent Form 10-K, Form 10-Q and other filings with the Securities and Exchange Commission. We disclaim any obligation to update any forward-looking statements as a result of developments occurring after the date of this document.
Definitions
Certain supplemental data provided in the prepared call remarks above are based upon internal Nuance definitions that are important for the reader to understand.
Non-GAAP Organic Revenue Growth. Organic revenue growth is calculated by comparing current period non-GAAP revenue to non-GAAP revenue from the corresponding prior-year period. For purposes of this calculation, prior period non-GAAP revenue is adjusted to include revenue from companies acquired by Nuance as if we had owned the acquired businesses in all periods presented. Non-GAAP organic revenue growth on a constant currency basis is calculated using current period non-GAAP revenue for entities reporting in currencies other than United States dollars, excluding United States dollar-denominated transactions recorded in those entities, converted into United States dollars using the average exchange rates from the prior-year period rather than the actual exchange rates in effect during the current period.
Bookings. Bookings represent the estimated gross revenue value of transactions at the time of contract execution, except for maintenance and support offerings. For fixed price contracts, the bookings value represents the gross total contract value. For contracts where revenue is based on transaction volume, the bookings value represents the contract price multiplied by the estimated future transaction volume during the contract term, whether or not such transaction volumes are guaranteed under a minimum commitment clause. Actual results could be different than our initial estimates. The maintenance and support bookings value represents the amounts billed in the period the customer is invoiced. Because of the inherent estimates required to determine bookings and the fact that the actual resultant revenue may differ from our initial bookings estimates, we consider bookings one indicator of potential future revenue and not as an arithmetic measure of backlog.
Net new bookings. Net new bookings represent the estimated revenue value at the time of contract execution from new contractual arrangements or the estimated revenue value incremental to the portion of the transaction value attributable to renewals under pre-existing arrangements. Constant currency for net new bookings is calculated using current period net new bookings denominated in currencies other than United States dollars converted into United States dollars using the average exchange rate for those currencies from the prior-year period rather than the actual exchange rate in effect during the current period.
| © 2018 Nuance Communications, Inc. All rights reserved | |
16 | 2018 fourth quarter results |
Prepared remarks | |
November 19, 2018 | |
Annualized line run-rate in Nuance’s healthcare on-demand business. We determine this run rate using billed equivalent line counts in a given quarter, multiplied by four.
Estimated 3-year value of total on-demand contracts. We determine this value as of the end of the period reported, by using our best estimate of three years of anticipated future revenue streams under signed on-demand contracts then in place, whether or not they are guaranteed through a minimum commitment clause. Our best estimate is based on assumptions used in evaluating the contracts and determining sales compensation, adjusted for changes in estimated launch dates, actual volumes achieved, and other factors deemed relevant. For contracts with an expiration date beyond three years, we include only the value expected within three years. For other contracts, we assume renewal consistent with historic renewal rates unless there is a known cancellation. Investors should be aware that most of these contracts are priced by volume of usage and typically have no or low minimum commitments. Actual revenue could vary from our estimates due to factors such as cancellations, non-renewals or volume fluctuations.
Segment profit. Segment profit reflects the direct controllable costs of each segment together with an allocation of sales and corporate marketing expenses, and certain research and development project costs that benefit multiple product offerings. Segment profit represents income from operations excluding stock-based compensation, amortization of intangible assets, acquisition-related costs, net, restructuring and other charges, net, costs associated with intellectual property collaboration agreements, other income (expense), net and certain unallocated corporate expenses.
Discussion of non-GAAP Financial Measures
We believe that providing the non-GAAP information to investors, in addition to the GAAP presentation, allows investors to view the financial results in the way management views the operating results. We further believe that providing this information allows investors to not only better understand our financial performance, but more importantly, to evaluate the efficacy of the methodology and information used by management to evaluate and measure such performance. The non-GAAP information included in this press release should not be considered superior to, or a substitute for, financial statements prepared in accordance with GAAP.
We utilize a number of different financial measures, both Generally Accepted Accounting Principles (“GAAP”) and non-GAAP, in analyzing and assessing the overall performance of the business, for making operating decisions and for forecasting and planning for future periods. Our annual financial plan is prepared both on a GAAP and non-GAAP basis, and the non-GAAP annual financial plan is approved by our board of directors. Continuous budgeting and forecasting for revenue and expenses are conducted on a consistent non-GAAP basis (in addition to GAAP) and actual results on a non-GAAP basis are assessed against the non-GAAP annual financial plan. The board of directors and management utilize these non-GAAP measures and results (in addition to the GAAP results) to determine our allocation of resources. In addition, and as a consequence of the importance of these measures in managing the business, we use non-GAAP measures and results in the evaluation process to establish management’s compensation. For example, our annual bonus program payments are based upon the achievement of consolidated non-GAAP revenue and consolidated non-GAAP earnings per share financial targets. We consider the use of non-GAAP revenue helpful in understanding the performance of our business, as it excludes the purchase accounting impact on acquired deferred revenue and other acquisition-related adjustments to revenue. We also consider the use of non-GAAP earnings per share helpful in assessing the organic performance of the continuing operations of our business. By organic performance we mean performance as if we had owned an acquired business in the same period a year ago. By constant currency organic performance, we mean performance excluding the effect of current foreign currency rate fluctuations. By continuing operations, we mean the ongoing results of the business excluding certain unplanned costs. While our management uses these non-GAAP financial measures as a tool to enhance their understanding of certain aspects of our financial performance, our management does not consider these measures to be a substitute for, or superior to, the information provided by GAAP financial statements. Consistent with this approach, we believe that disclosing non-
| © 2018 Nuance Communications, Inc. All rights reserved | |
17 | 2018 fourth quarter results |
Prepared remarks | |
November 19, 2018 | |
GAAP financial measures to the readers of our financial statements provides such readers with useful supplemental data that, while not a substitute for GAAP financial statements, allows for greater transparency in the review of our financial and operational performance. In assessing the overall health of the business during the three and twelve months ended June 30, 2018 and 2017, our management has either included or excluded items in seven general categories, each of which is described below.
Acquisition-related revenue and cost of revenue.
We provide supplementary non-GAAP financial measures of revenue that include revenue that we would have recognized but for the purchase accounting treatment of acquisition transactions. Non-GAAP revenue also includes revenue that we would have recognized had we not acquired intellectual property and other assets from the same customer. Because GAAP accounting requires the elimination of this revenue, GAAP results alone do not fully capture all of our economic activities. These non-GAAP adjustments are intended to reflect the full amount of such revenue. We include non-GAAP revenue and cost of revenue to allow for more complete comparisons to the financial results of historical operations, forward-looking guidance and the financial results of peer companies. We believe these adjustments are useful to management and investors as a measure of the ongoing performance of the business because, although we cannot be certain that customers will renew their contracts, we have historically experienced high renewal rates on maintenance and support agreements and other customer contracts. Additionally, although acquisition-related revenue adjustments are non-recurring with respect to past acquisitions, we generally will incur these adjustments in connection with any future acquisitions.
Acquisition-related costs, net.
In recent years, we have completed a number of acquisitions, which result in operating expenses, which would not otherwise have been incurred. We provide supplementary non-GAAP financial measures, which exclude certain transition, integration and other acquisition-related expense items resulting from acquisitions, to allow more accurate comparisons of the financial results to historical operations, forward looking guidance and the financial results of less acquisitive peer companies. We consider these types of costs and adjustments, to a great extent, to be unpredictable and dependent on a significant number of factors that are outside of our control. Furthermore, we do not consider these acquisition-related costs and adjustments to be related to the organic continuing operations of the acquired businesses and are generally not relevant to assessing or estimating the long-term performance of the acquired assets. In addition, the size, complexity and/or volume of past acquisitions, which often drives the magnitude of acquisition related costs, may not be indicative of the size, complexity and/or volume of future acquisitions. By excluding acquisition-related costs and adjustments from our non-GAAP measures, management is better able to evaluate our ability to utilize our existing assets and estimate the long-term value that acquired assets will generate for us. We believe that providing a supplemental non-GAAP measure, which excludes these items allows management and investors to consider the ongoing operations of the business both with, and without, such expenses.
These acquisition-related costs fall into the following categories: (i) transition and integration costs; (ii) professional service fees and expenses; and (iii) acquisition-related adjustments. Although these expenses are not recurring with respect to past acquisitions, we generally will incur these expenses in connection with any future acquisitions. These categories are further discussed as follows:
(i) Transition and integration costs. Transition and integration costs include retention payments, transitional employee costs, and earn-out payments treated as compensation expense, as well as the costs of integration-related activities, including services provided by third-parties.
(ii) Professional service fees and expenses. Professional service fees and expenses include financial advisory, legal, accounting and other outside services incurred in connection with acquisition activities, and disputes and regulatory matters related to acquired entities.
(iii) Acquisition-related adjustments. Acquisition-related adjustments include adjustments to acquisition-related items that are required to be marked to fair value each reporting period, such as contingent
| © 2018 Nuance Communications, Inc. All rights reserved | |
18 | 2018 fourth quarter results |
Prepared remarks | |
November 19, 2018 | |
consideration, and other items related to acquisitions for which the measurement period has ended, such as gains or losses on settlements of pre-acquisition contingencies.
Amortization of acquired intangible assets.
We exclude the amortization of acquired intangible assets from non-GAAP expense and income measures. These amounts are inconsistent in amount and frequency and are significantly impacted by the timing and size of acquisitions. Providing a supplemental measure which excludes these charges allows management and investors to evaluate results “as-if” the acquired intangible assets had been developed internally rather than acquired and, therefore, provides a supplemental measure of performance in which our acquired intellectual property is treated in a comparable manner to our internally developed intellectual property. Although we exclude amortization of acquired intangible assets from our non-GAAP expenses, we believe that it is important for investors to understand that such intangible assets contribute to revenue generation. Amortization of intangible assets that relate to past acquisitions will recur in future periods until such intangible assets have been fully amortized. Future acquisitions may result in the amortization of additional intangible assets.
Non-cash expenses.
We provide non-GAAP information relative to the following non-cash expenses: (i) stock-based compensation; and (ii) non-cash interest. These items are further discussed as follows:
(i) Stock-based compensation. Because of varying valuation methodologies, subjective assumptions and the variety of award types, we believe that excluding stock-based compensation allows for more accurate comparisons of operating results to peer companies, as well as to times in our history when stock-based compensation was more or less significant as a portion of overall compensation than in the current period. We evaluate performance both with and without these measures because compensation expense related to stock-based compensation is typically non-cash and the options and restricted awards granted are influenced by the Company’s stock price and other factors such as volatility that are beyond our control. The expense related to stock-based awards is generally not controllable in the short-term and can vary significantly based on the timing, size and nature of awards granted. As such, we do not include such charges in operating plans. Stock-based compensation will continue in future periods.
(ii) Non-cash interest. We exclude non-cash interest because we believe that excluding this expense provides senior management, as well as other users of the financial statements, with a valuable perspective on the cash-based performance and health of the business, including the current near-term projected liquidity. Non-cash interest expense will continue in future periods.
Other expenses.
We exclude certain other expenses that result from unplanned events, outside the ordinary course of continuing operations, in order to measure operating performance and current and future liquidity both with and without these expenses. By providing this information, we believe management and the users of the financial statements are better able to understand the financial results of what we consider to be our organic, continuing operations. Included in these expenses are items such as restructuring charges, asset impairments and other charges (credits), net. We also exclude other items such as losses from extinguishing our convertible debt, consulting and professional services fees related to assessing strategic alternatives and our transformation program, implementation of the new revenue recognition standard (ASC 606), and expenses associated with the malware incident and remediation thereof.
Non-GAAP income tax provision.
Effective Q2 2017, we changed our method of calculating our non-GAAP income tax provision. Under the prior method, we calculated our non-GAAP tax provision using a cash tax method to reflect the estimated amount we expected to pay or receive in taxes related to the period, which is equivalent to our GAAP current tax provision.
| © 2018 Nuance Communications, Inc. All rights reserved | |
19 | 2018 fourth quarter results |
Prepared remarks | |
November 19, 2018 | |
Under the new method, our non-GAAP income tax provision is determined based on our non-GAAP pre-tax income. The tax effect of each non-GAAP adjustment, if applicable, is computed based on the statutory tax rate of the jurisdiction to which the adjustment relates. Additionally, as our non-GAAP profitability is higher based on the non-GAAP adjustments, we adjust the GAAP tax provision to remove valuation allowances and related effects based on the higher level of reported non-GAAP profitability. We also exclude from our non-GAAP tax provision certain discrete tax items as they occur, which in fiscal year 2018 also includes certain impacts from the Tax Cuts and Jobs Act of 2017.
Financial Tables Follow
| © 2018 Nuance Communications, Inc. All rights reserved | |
20 | 2018 fourth quarter results |
Prepared remarks | |
November 19, 2018 | |
Nuance Communications, Inc.
Condensed Consolidated Statements of Operations
(in thousands, except per share amounts)
Unaudited
Three months ended September 30, | Twelve months ended September 30, | |||||||||||||||
2018 | 2017 | 2018 | 2017 | |||||||||||||
Revenues: | ||||||||||||||||
Professional services and hosting | $ | 261,369 | $ | 213,298 | $ | 1,049,448 | $ | 976,893 | ||||||||
Product and licensing | 192,454 | 170,153 | 684,230 | 635,391 | ||||||||||||
Maintenance and support | 79,082 | 82,459 | 317,983 | 327,078 | ||||||||||||
Total revenues | 532,905 | 465,910 | 2,051,661 | 1,939,362 | ||||||||||||
Cost of revenues: | ||||||||||||||||
Professional services and hosting | 161,657 | 162,348 | 681,516 | 660,849 | ||||||||||||
Product and licensing | 19,999 | 19,199 | 77,086 | 74,004 | ||||||||||||
Maintenance and support | 15,317 | 13,846 | 58,095 | 54,094 | ||||||||||||
Amortization of intangible assets | 12,977 | 16,366 | 56,873 | 64,853 | ||||||||||||
Total cost of revenues | 209,950 | 211,759 | 873,570 | 853,800 | ||||||||||||
Gross profit | 322,955 | 254,151 | 1,178,091 | 1,085,562 | ||||||||||||
Operating expenses: | ||||||||||||||||
Research and development | 82,046 | 66,978 | 305,323 | 266,097 | ||||||||||||
Sales and marketing | 95,946 | 105,929 | 388,305 | 398,130 | ||||||||||||
General and administrative | 51,941 | 43,040 | 229,774 | 166,677 | ||||||||||||
Amortization of intangible assets | 21,242 | 28,964 | 91,093 | 113,895 | ||||||||||||
Acquisition-related costs, net | 3,264 | 5,689 | 16,101 | 27,740 | ||||||||||||
Restructuring and other charges, net | 30,512 | 21,405 | 63,498 | 61,054 | ||||||||||||
Impairment of goodwill and other intangible assets | 33,034 | — | 170,941 | — | ||||||||||||
Total operating expenses | 317,985 | 272,005 | 1,265,035 | 1,033,593 | ||||||||||||
Income (loss) from operations | 4,970 | (17,854 | ) | (86,944 | ) | 51,969 | ||||||||||
Other expenses, net | (31,439 | ) | (37,692 | ) | (129,791 | ) | (170,984 | ) | ||||||||
Loss before income taxes | (26,469 | ) | (55,546 | ) | (216,735 | ) | (119,015 | ) | ||||||||
Provision (benefit) for income taxes | 8,597 | 9,878 | (56,807 | ) | 31,981 | |||||||||||
Net loss | $ | (35,066 | ) | $ | (65,424 | ) | $ | (159,928 | ) | $ | (150,996 | ) | ||||
Net loss per share: | ||||||||||||||||
Basic | $ | (0.12 | ) | $ | (0.23 | ) | $ | (0.55 | ) | $ | (0.52 | ) | ||||
Diluted | $ | (0.12 | ) | $ | (0.23 | ) | $ | (0.55 | ) | $ | (0.52 | ) | ||||
Weighted average common shares outstanding: | ||||||||||||||||
Basic | 287,052 | 288,718 | 291,318 | 289,348 | ||||||||||||
Diluted | 287,052 | 288,718 | 291,318 | 289,348 | ||||||||||||
| © 2018 Nuance Communications, Inc. All rights reserved | |
21 | 2018 fourth quarter results |
Prepared remarks | |
November 19, 2018 | |
Nuance Communications, Inc.
Condensed Consolidated Balance Sheets
(in thousands)
September 30, 2018 | September 30, 2017 | ||||||||
Unaudited | |||||||||
ASSETS | |||||||||
Current assets: | |||||||||
Cash and cash equivalents | $ | 315,963 | $ | 592,299 | |||||
Marketable securities | 135,579 | 251,981 | |||||||
Accounts receivable, net | 378,832 | 395,392 | |||||||
Prepaid expenses and other current assets | 98,257 | 88,269 | |||||||
Total current assets | 928,631 | 1,327,941 | |||||||
Marketable securities | 21,932 | 29,844 | |||||||
Land, building and equipment, net | 155,894 | 176,548 | |||||||
Goodwill | 3,504,457 | 3,590,608 | |||||||
Intangible assets, net | 549,508 | 664,474 | |||||||
Other assets | 141,957 | 142,508 | |||||||
Total assets | $ | 5,302,379 | $ | 5,931,923 | |||||
LIABILITIES AND STOCKHOLDERS' EQUITY | |||||||||
Current liabilities: | |||||||||
Current portion of long-term debt | $ | — | $ | 376,121 | |||||
Contingent and deferred acquisition payments | 14,211 | 28,860 | |||||||
Accounts payable, accrued expenses and other current liabilities | 366,160 | 340,505 | |||||||
Deferred revenue | 383,793 | 366,042 | |||||||
Total current liabilities | 764,164 | 1,111,528 | |||||||
Long-term debt | 2,185,361 | 2,241,283 | |||||||
Deferred revenue, net of current portion | 489,177 | 423,929 | |||||||
Other liabilities | 146,181 | 223,801 | |||||||
Total liabilities | 3,584,883 | 4,000,541 | |||||||
Stockholders' equity | 1,717,496 | 1,931,382 | |||||||
Total liabilities and stockholders' equity | $ | 5,302,379 | $ | 5,931,923 | |||||
| © 2018 Nuance Communications, Inc. All rights reserved | |
22 | 2018 fourth quarter results |
Prepared remarks | |
November 19, 2018 | |
Nuance Communications, Inc.
Consolidated Statements of Cash Flows
(in thousands)
Unaudited
Three months ended September 30, | Twelve months ended September 30, | |||||||||||||||
2018 | 2017 | 2018 | 2017 | |||||||||||||
Cash flows from operating activities: | ||||||||||||||||
Net loss | $ | (35,066 | ) | $ | (65,424 | ) | $ | (159,928 | ) | $ | (150,996 | ) | ||||
Adjustments to reconcile net loss to net cash provided by operating activities: | ||||||||||||||||
Depreciation and amortization | 49,149 | 59,458 | 210,316 | 234,413 | ||||||||||||
Stock-based compensation | 43,848 | 32,463 | 150,785 | 154,272 | ||||||||||||
Non-cash interest expense | 12,000 | 16,383 | 49,091 | 59,295 | ||||||||||||
Deferred tax provision (benefit) | 3,901 | (1,907 | ) | (87,217 | ) | 4,855 | ||||||||||
(Gain) loss on extinguishment of debt | (348 | ) | — | (348 | ) | 18,565 | ||||||||||
Impairment of goodwill and other intangible assets | 33,034 | — | 170,941 | — | ||||||||||||
Impairment of fixed assets | 8,770 | — | 10,550 | 16,351 | ||||||||||||
Other | 1,336 | 4,144 | 2,230 | 8,403 | ||||||||||||
Changes in operating assets and liabilities, excluding effects of acquisitions: | ||||||||||||||||
Accounts receivable | 17,634 | (34,481 | ) | 19,641 | (6,349 | ) | ||||||||||
Prepaid expenses and other assets | (1,694 | ) | (130 | ) | (20,389 | ) | (14,661 | ) | ||||||||
Accounts payable | (10,304 | ) | (13,416 | ) | (14,315 | ) | (1,207 | ) | ||||||||
Accrued expenses and other liabilities | 25,176 | 13,080 | 26,847 | 9,040 | ||||||||||||
Deferred revenue | 1,967 | (13,666 | ) | 86,222 | 46,886 | |||||||||||
Net cash provided by operating activities | 149,403 | (3,496 | ) | 444,426 | 378,867 | |||||||||||
Cash flows from investing activities: | ||||||||||||||||
Capital expenditures | (9,880 | ) | (27,802 | ) | (48,845 | ) | (61,835 | ) | ||||||||
Payments for business and asset acquisitions, net of cash acquired | (945 | ) | (3,549 | ) | (110,170 | ) | (113,769 | ) | ||||||||
Purchases of marketable securities and other investments | (43,350 | ) | (140,408 | ) | (201,995 | ) | (332,470 | ) | ||||||||
Proceeds from sales and maturities of marketable securities and other investments | 64,018 | 67,420 | 323,695 | 173,864 | ||||||||||||
Net cash provided by (used in) investing activities | 9,843 | (104,339 | ) | (37,315 | ) | (334,210 | ) | |||||||||
Cash flows from financing activities: | ||||||||||||||||
Repayment and redemption of debt | (150,000 | ) | — | (481,172 | ) | (634,055 | ) | |||||||||
Proceeds from issuance of long-term debt, net of issuance costs | — | (599 | ) | — | 837,482 | |||||||||||
Payments for repurchase of common stock | (24,111 | ) | — | (136,090 | ) | (99,077 | ) | |||||||||
Acquisition payments with extended payment terms | (4,073 | ) | — | (24,842 | ) | — | ||||||||||
Proceeds from issuance of common stock from employee stock plans | 9,023 | 8,701 | 18,384 | 17,383 | ||||||||||||
Payments for taxes related to net share settlement of equity awards | (3,544 | ) | (1,576 | ) | (55,396 | ) | (54,099 | ) | ||||||||
Other financing activities | (157 | ) | (159 | ) | (1,232 | ) | (583 | ) | ||||||||
Net cash (used in) provided by financing activities | (172,862 | ) | 6,367 | (680,348 | ) | 67,051 | ||||||||||
Effects of exchange rate changes on cash and cash equivalents | (1,680 | ) | 173 | (3,099 | ) | (1,029 | ) | |||||||||
Net (decrease) increase in cash and cash equivalents | (15,296 | ) | (101,295 | ) | (276,336 | ) | 110,679 | |||||||||
Cash and cash equivalents at beginning of period | 331,259 | 693,594 | 592,299 | 481,620 | ||||||||||||
Cash and cash equivalents at end of period | $ | 315,963 | $ | 592,299 | $ | 315,963 | $ | 592,299 | ||||||||
| © 2018 Nuance Communications, Inc. All rights reserved | |
23 | 2018 fourth quarter results |
Prepared remarks | |
November 19, 2018 | |
Nuance Communications, Inc.
Supplemental Financial Information - GAAP to Non-GAAP Reconciliations
(in thousands)
Unaudited
Three months ended | Twelve months ended | |||||||||||||||
September 30, | September 30, | |||||||||||||||
2018 | 2017 | 2018 | 2017 | |||||||||||||
GAAP revenues | $ | 532,905 | $ | 465,910 | $ | 2,051,661 | $ | 1,939,362 | ||||||||
Acquisition-related revenue adjustments: professional services and hosting | 1,274 | 2,044 | 4,948 | 10,553 | ||||||||||||
Acquisition-related revenue adjustments: product and licensing | 1,886 | 6,494 | 12,401 | 26,462 | ||||||||||||
Acquisition-related revenue adjustments: maintenance and support | 148 | 204 | 372 | 1,014 | ||||||||||||
Non-GAAP revenues | $ | 536,213 | $ | 474,652 | $ | 2,069,382 | $ | 1,977,391 | ||||||||
GAAP cost of revenues | $ | 209,950 | $ | 211,759 | $ | 873,570 | $ | 853,800 | ||||||||
Cost of revenues from amortization of intangible assets | (12,977 | ) | (16,366 | ) | (56,873 | ) | (64,853 | ) | ||||||||
Cost of revenues adjustments: professional services and hosting (1) | (10,709 | ) | (4,087 | ) | (31,299 | ) | (28,962 | ) | ||||||||
Cost of revenues adjustments: product and licensing (1) | (324 | ) | (50 | ) | (816 | ) | (348 | ) | ||||||||
Cost of revenues adjustments: maintenance and support (1) | (2,085 | ) | (650 | ) | (5,126 | ) | (3,767 | ) | ||||||||
Non-GAAP cost of revenues | $ | 183,855 | $ | 190,606 | $ | 779,456 | $ | 755,870 | ||||||||
GAAP gross profit | $ | 322,955 | $ | 254,151 | $ | 1,178,091 | $ | 1,085,562 | ||||||||
Gross profit adjustments | 29,403 | 29,895 | 111,835 | 135,959 | ||||||||||||
Non-GAAP gross profit | $ | 352,358 | $ | 284,046 | $ | 1,289,926 | $ | 1,221,521 | ||||||||
GAAP income (loss) from operations | $ | 4,970 | $ | (17,854 | ) | $ | (86,944 | ) | $ | 51,969 | ||||||
Gross profit adjustments | 29,403 | 29,895 | 111,835 | 135,959 | ||||||||||||
Research and development (1) | 13,771 | 6,564 | 40,087 | 33,061 | ||||||||||||
Sales and marketing (1) | 11,123 | 10,845 | 39,656 | 45,813 | ||||||||||||
General and administrative (1) | 5,836 | 10,269 | 33,801 | 42,321 | ||||||||||||
Acquisition-related costs, net | 3,264 | 5,689 | 16,101 | 27,740 | ||||||||||||
Amortization of intangible assets | 21,242 | 28,964 | 91,093 | 113,895 | ||||||||||||
Restructuring and other charges, net | 30,512 | 21,405 | 63,498 | 61,054 | ||||||||||||
Impairment of goodwill and other intangible assets | 33,034 | — | 170,941 | — | ||||||||||||
Other (4) | 10,274 | 2,285 | 59,700 | 10,265 | ||||||||||||
Non-GAAP income from operations | $ | 163,429 | $ | 98,062 | $ | 539,768 | $ | 522,077 | ||||||||
GAAP loss before income taxes | $ | (26,469 | ) | $ | (55,546 | ) | $ | (216,735 | ) | $ | (119,015 | ) | ||||
Gross profit adjustments | 29,403 | 29,895 | 111,835 | 135,959 | ||||||||||||
Research and development (1) | 13,771 | 6,564 | 40,087 | 33,061 | ||||||||||||
Sales and marketing (1) | 11,123 | 10,845 | 39,656 | 45,813 | ||||||||||||
General and administrative (1) | 5,836 | 10,269 | 33,801 | 42,321 | ||||||||||||
Acquisition-related costs, net | 3,264 | 5,689 | 16,101 | 27,740 | ||||||||||||
Amortization of intangible assets | 21,242 | 28,964 | 91,093 | 113,895 | ||||||||||||
Restructuring and other charges, net | 30,512 | 21,405 | 63,498 | 61,054 | ||||||||||||
Non-cash interest expense | 12,000 | 16,383 | 49,091 | 59,295 | ||||||||||||
Loss on extinguishment of debt | (348 | ) | — | (348 | ) | 18,565 | ||||||||||
Impairment of goodwill and other intangible assets | 33,034 | — | 170,941 | — | ||||||||||||
Other (4) | 10,274 | 2,285 | 59,700 | 10,265 | ||||||||||||
Non-GAAP income before income taxes | $ | 143,642 | $ | 76,753 | $ | 458,720 | $ | 428,953 | ||||||||
(4) Includes approximately $8.1 million and $51.6 million in professional services costs related to evaluating strategic alternatives for certain businesses and establishing our Automotive business as an independent reporting segment, for the three and twelve months ended September 30, 2018, respectively. | ||||||||||||||||
| © 2018 Nuance Communications, Inc. All rights reserved | |
24 | 2018 fourth quarter results |
Prepared remarks | |
November 19, 2018 | |
Nuance Communications, Inc.
Supplemental Financial Information - GAAP to Non-GAAP Reconciliations, continued
(in thousands, except per share amounts)
Unaudited
Three months ended | Twelve months ended | |||||||||||||||
September 30, | September 30, | |||||||||||||||
2018 | 2017 | 2018 | 2017 | |||||||||||||
GAAP provision (benefit) for income taxes | $ | 8,597 | $ | 9,878 | $ | (56,807 | ) | $ | 31,981 | |||||||
Income tax effect of Non-GAAP adjustments | 36,854 | 44,971 | 134,086 | 184,020 | ||||||||||||
Removal of valuation allowance and other items | (6,800 | ) | (39,058 | ) | (54,040 | ) | (95,515 | ) | ||||||||
Removal of discrete items (3) | (7,496 | ) | 748 | 83,573 | (572 | ) | ||||||||||
Non-GAAP provision for income taxes | $ | 31,155 | $ | 16,539 | $ | 106,812 | $ | 119,914 | ||||||||
GAAP net loss | $ | (35,066 | ) | $ | (65,424 | ) | $ | (159,928 | ) | $ | (150,996 | ) | ||||
Acquisition-related adjustment - revenues (2) | 3,308 | 8,742 | 17,721 | 38,029 | ||||||||||||
Acquisition-related costs, net | 3,264 | 5,689 | 16,101 | 27,740 | ||||||||||||
Cost of revenue from amortization of intangible assets | 12,977 | 16,366 | 56,873 | 64,853 | ||||||||||||
Amortization of intangible assets | 21,242 | 28,964 | 91,093 | 113,895 | ||||||||||||
Restructuring and other charges, net | 30,512 | 21,405 | 63,498 | 61,054 | ||||||||||||
Loss on extinguishment of debt | (348 | ) | — | (348 | ) | 18,565 | ||||||||||
Impairment of goodwill and other intangible assets | 33,034 | — | 170,941 | — | ||||||||||||
Stock-based compensation (1) | 43,848 | 32,465 | 150,785 | 154,272 | ||||||||||||
Non-cash interest expense | 12,000 | 16,383 | 49,091 | 59,295 | ||||||||||||
Adjustment to income tax expense | (22,558 | ) | (6,661 | ) | (163,619 | ) | (87,933 | ) | ||||||||
Other (4) | 10,274 | 2,286 | 59,700 | 10,264 | ||||||||||||
Non-GAAP net income | $ | 112,487 | $ | 60,215 | $ | 351,908 | $ | 309,038 | ||||||||
Non-GAAP diluted net income per share | $ | 0.38 | $ | 0.20 | $ | 1.19 | $ | 1.05 | ||||||||
Diluted weighted average common shares outstanding | 294,088 | 295,004 | 295,381 | 295,129 | ||||||||||||
(3) As a result of the Tax Cuts and Jobs Act ("TCJA"), we remeasured certain deferred tax assets and liabilities at the lower rates and recorded approximately $92.9 million of tax benefits for fiscal year 2018. Additionally, we recorded a $5.8 million provision for the deemed repatriation of foreign cash and earnings, which is estimated based upon estimated foreign earnings and foreign income taxes. | ||||||||||||||||
(4) Includes approximately $8.1 million and $51.6 million in professional services costs costs related to evaluating strategic alternatives for certain businesses and establishing our Automotive business as an independent reporting segment, for the three and twelve months ended September 30, 2018, respectively. | ||||||||||||||||
| © 2018 Nuance Communications, Inc. All rights reserved | |
25 | 2018 fourth quarter results |
Prepared remarks | |
November 19, 2018 | |
Nuance Communications, Inc.
Supplemental Financial Information - GAAP to Non-GAAP Reconciliations, continued
(in thousands)
Unaudited
Three months ended September 30, | Twelve months ended September 30, | |||||||||||||||
2018 | 2017 | 2018 | 2017 | |||||||||||||
GAAP operating expenses | $ | 317,985 | $ | 272,005 | $ | 1,265,035 | $ | 1,033,593 | ||||||||
Research and development (1) | (13,771 | ) | (6,564 | ) | (40,087 | ) | (33,061 | ) | ||||||||
Sales and marketing (1) | (11,123 | ) | (10,845 | ) | (39,656 | ) | (45,813 | ) | ||||||||
General and administrative (1) | (5,836 | ) | (10,269 | ) | (33,801 | ) | (42,321 | ) | ||||||||
Acquisition-related costs, net | (3,264 | ) | (5,689 | ) | (16,101 | ) | (27,740 | ) | ||||||||
Amortization of intangible assets | (21,242 | ) | (28,964 | ) | (91,093 | ) | (113,895 | ) | ||||||||
Restructuring and other charges, net | (30,512 | ) | (21,405 | ) | (63,498 | ) | (61,054 | ) | ||||||||
Impairment of Goodwill | (33,034 | ) | — | (170,941 | ) | — | ||||||||||
Other | (10,274 | ) | (2,285 | ) | (59,700 | ) | (10,265 | ) | ||||||||
Non-GAAP operating expenses | $ | 188,929 | $ | 185,984 | $ | 750,158 | $ | 699,444 | ||||||||
GAAP research and development expense | $ | 82,046 | $ | 66,978 | $ | 305,323 | $ | 266,097 | ||||||||
Stock-based compensation (1) | (13,771 | ) | (6,564 | ) | (40,087 | ) | (33,061 | ) | ||||||||
Non-GAAP research and development expense | $ | 68,275 | $ | 60,414 | $ | 265,236 | $ | 233,036 | ||||||||
GAAP sales and marketing expense | $ | 95,946 | $ | 105,929 | $ | 388,305 | $ | 398,130 | ||||||||
Stock-based compensation (1) | (11,123 | ) | (10,845 | ) | (39,656 | ) | (45,813 | ) | ||||||||
Non-GAAP sales and marketing expense | $ | 84,823 | $ | 95,084 | $ | 348,649 | $ | 352,317 | ||||||||
GAAP general and administrative expense | $ | 51,941 | $ | 43,040 | $ | 229,774 | $ | 166,677 | ||||||||
Stock-based compensation (1) | (5,836 | ) | (10,269 | ) | (33,801 | ) | (42,321 | ) | ||||||||
Other (4) | (10,274 | ) | (2,285 | ) | (59,700 | ) | (10,265 | ) | ||||||||
Non-GAAP general and administrative expense | $ | 35,831 | $ | 30,486 | $ | 136,273 | $ | 114,091 | ||||||||
| © 2018 Nuance Communications, Inc. All rights reserved | |
26 | 2018 fourth quarter results |
Prepared remarks | |
November 19, 2018 | |
Nuance Communications, Inc.
Supplemental Financial Information - GAAP to Non-GAAP Reconciliations, continued
(in thousands)
Unaudited
Three months ended September 30, | Twelve months ended September 30, | ||||||||||||||
2018 | 2017 | 2018 | 2017 | ||||||||||||
(1) Stock-based compensation | |||||||||||||||
Cost of professional services and hosting | $ | 10,709 | $ | 4,087 | $ | 31,299 | $ | 28,962 | |||||||
Cost of product and licensing | 324 | 50 | 816 | 348 | |||||||||||
Cost of maintenance and support | 2,085 | 650 | 5,126 | 3,767 | |||||||||||
Research and development | 13,771 | 6,564 | 40,087 | 33,061 | |||||||||||
Sales and marketing | 11,123 | 10,845 | 39,656 | 45,813 | |||||||||||
General and administrative | 5,836 | 10,269 | 33,801 | 42,321 | |||||||||||
Total | $ | 43,848 | $ | 32,465 | $ | 150,785 | $ | 154,272 | |||||||
(2) Acquisition-related revenue | |||||||||||||||
Revenues | $ | 3,308 | $ | 8,742 | $ | 17,721 | $ | 38,029 | |||||||
Total | $ | 3,308 | $ | 8,742 | $ | 17,721 | $ | 38,029 | |||||||
| © 2018 Nuance Communications, Inc. All rights reserved | |
27 | 2018 fourth quarter results |
Prepared remarks | |
November 19, 2018 | |
Nuance Communications, Inc.
Supplemental Financial Information – GAAP to Non-GAAP Reconciliations, continued
(in millions)
Unaudited
Hosting Revenues | Q1 | Q2 | Q3 | Q4 | FY | Q1 | Q2 | Q3 | Q4 | FY | ||||||||||||||||||||||||||||||
2017 | 2017 | 2017 | 2017 | 2017 | 2018 | 2018 | 2018 | 2018 | 2018 | |||||||||||||||||||||||||||||||
GAAP Revenues | $ | 193.3 | $ | 202.2 | $ | 189.4 | $ | 149.0 | $ | 733.8 | $ | 185.1 | $ | 194.4 | $ | 190.2 | $ | 201.3 | $ | 771.1 | ||||||||||||||||||||
Adjustment | 2.3 | 2.7 | 3.1 | 2.0 | 10.1 | 1.2 | 1.0 | 1.4 | 1.2 | 4.8 | ||||||||||||||||||||||||||||||
Non-GAAP Revenues | $ | 195.6 | $ | 204.8 | $ | 192.5 | $ | 150.9 | $ | 743.9 | $ | 186.3 | $ | 195.4 | $ | 191.7 | $ | 202.5 | $ | 775.9 | ||||||||||||||||||||
Maintenance and Support Revenues | Q1 | Q2 | Q3 | Q4 | FY | Q1 | Q2 | Q3 | Q4 | FY | ||||||||||||||||||||||||||||||
2017 | 2017 | 2017 | 2017 | 2017 | 2018 | 2018 | 2018 | 2018 | 2018 | |||||||||||||||||||||||||||||||
GAAP Revenues | $ | 82.5 | $ | 81.6 | $ | 80.5 | $ | 82.5 | $ | 327.1 | $ | 80.8 | $ | 78.4 | $ | 79.7 | $ | 79.1 | $ | 318.0 | ||||||||||||||||||||
Adjustment | 0.2 | 0.4 | 0.2 | 0.2 | 1.0 | 0.1 | 0.1 | 0.1 | 0.1 | 0.4 | ||||||||||||||||||||||||||||||
Non-GAAP Revenues | $ | 82.7 | $ | 82.0 | $ | 80.7 | $ | 82.7 | $ | 328.1 | $ | 80.9 | $ | 78.5 | $ | 79.8 | $ | 79.2 | $ | 318.4 | ||||||||||||||||||||
Perpetual Product and Licensing Revenues | Q1 | Q2 | Q3 | Q4 | FY | Q1 | Q2 | Q3 | Q4 | FY | ||||||||||||||||||||||||||||||
2017 | 2017 | 2017 | 2017 | 2017 | 2018 | 2018 | 2018 | 2018 | 2018 | |||||||||||||||||||||||||||||||
GAAP Revenues | $ | 78.7 | $ | 76.5 | $ | 73.5 | $ | 77.3 | $ | 306.0 | $ | 76.6 | $ | 73.0 | $ | 76.9 | $ | 98.2 | $ | 324.6 | ||||||||||||||||||||
Adjustment | 0.7 | 0.5 | 0.9 | 0.4 | 2.4 | 0.4 | 0.3 | 0.4 | 0.6 | 1.6 | ||||||||||||||||||||||||||||||
Non-GAAP Revenues | $ | 79.3 | $ | 77.0 | $ | 74.4 | $ | 77.7 | $ | 308.4 | $ | 76.9 | $ | 73.3 | $ | 77.2 | $ | 98.8 | $ | 326.2 | ||||||||||||||||||||
Recurring Product and Licensing Revenues | Q1 | Q2 | Q3 | Q4 | FY | Q1 | Q2 | Q3 | Q4 | FY | ||||||||||||||||||||||||||||||
2017 | 2017 | 2017 | 2017 | 2017 | 2018 | 2018 | 2018 | 2018 | 2018 | |||||||||||||||||||||||||||||||
GAAP Revenues | $ | 73.1 | $ | 82.8 | $ | 80.8 | $ | 92.8 | $ | 329.4 | $ | 85.2 | $ | 88.3 | $ | 91.8 | $ | 94.3 | $ | 359.7 | ||||||||||||||||||||
Adjustment | 5.1 | 7.8 | 5.0 | 6.1 | 24.1 | 5.4 | 2.7 | 1.4 | 1.3 | 10.8 | ||||||||||||||||||||||||||||||
Non-GAAP Revenues | $ | 78.2 | $ | 90.6 | $ | 85.8 | $ | 98.9 | $ | 353.5 | $ | 90.7 | $ | 90.9 | $ | 93.2 | $ | 95.6 | $ | 370.4 | ||||||||||||||||||||
Professional Services Revenues | Q1 | Q2 | Q3 | Q4 | FY | Q1 | Q2 | Q3 | Q4 | FY | ||||||||||||||||||||||||||||||
2017 | 2017 | 2017 | 2017 | 2017 | 2018 | 2018 | 2018 | 2018 | 2018 | |||||||||||||||||||||||||||||||
GAAP Revenues | $ | 60.1 | $ | 56.5 | $ | 62.1 | $ | 64.3 | $ | 243.1 | $ | 73.9 | $ | 80.2 | $ | 64.2 | $ | 60.1 | $ | 278.3 | ||||||||||||||||||||
Adjustment | 0.2 | 0.1 | 0.1 | 0.1 | 0.5 | 0.1 | — | — | — | 0.2 | ||||||||||||||||||||||||||||||
Non-GAAP Revenues | $ | 60.3 | $ | 56.7 | $ | 62.2 | $ | 64.4 | $ | 243.6 | $ | 74.0 | $ | 80.2 | $ | 64.2 | $ | 60.1 | $ | 278.5 | ||||||||||||||||||||
Total Recurring Revenues | Q1 | Q2 | Q3 | Q4 | FY | Q1 | Q2 | Q3 | Q4 | FY | ||||||||||||||||||||||||||||||
2017 | 2017 | 2017 | 2017 | 2017 | 2018 | 2018 | 2018 | 2018 | 2018 | |||||||||||||||||||||||||||||||
GAAP Revenues | $ | 353.0 | $ | 370.2 | $ | 354.5 | $ | 328.6 | $ | 1,406.4 | $ | 355.3 | $ | 365.0 | $ | 365.9 | $ | 377.9 | $ | 1,464.2 | ||||||||||||||||||||
Adjustment | 7.5 | 11.4 | 8.7 | 8.2 | 35.9 | 6.9 | 3.9 | 2.8 | 2.7 | 16.3 | ||||||||||||||||||||||||||||||
Non-GAAP Revenues | $ | 360.5 | $ | 381.7 | $ | 363.2 | $ | 336.8 | $ | 1,442.3 | $ | 362.2 | $ | 368.9 | $ | 368.7 | $ | 380.6 | $ | 1,480.5 | ||||||||||||||||||||
Schedules may not add due to rounding.
| © 2018 Nuance Communications, Inc. All rights reserved | |
28 | 2018 fourth quarter results |
Prepared remarks | |
November 19, 2018 | |
Nuance Communications, Inc.
Supplemental Financial Information – GAAP to Non-GAAP Reconciliations, continued
(in millions)
Unaudited
Total Revenues | Q1 | Q2 | Q3 | Q4 | FY | Q1 | Q2 | Q3 | Q4 | FY | ||||||||||||||||||||||||||||||
2017 | 2017 | 2017 | 2017 | 2017 | 2018 | 2018 | 2018 | 2018 | 2018 | |||||||||||||||||||||||||||||||
GAAP Revenues | $ | 487.7 | $ | 499.6 | $ | 486.2 | $ | 465.9 | $ | 1,939.4 | $ | 501.6 | $ | 514.2 | $ | 502.9 | $ | 532.9 | $ | 2,051.7 | ||||||||||||||||||||
Adjustment | 8.4 | 11.5 | 9.4 | 8.7 | 38.0 | 7.2 | 4.1 | 3.1 | 3.3 | 17.7 | ||||||||||||||||||||||||||||||
Non-GAAP Revenues | $ | 496.0 | $ | 511.1 | $ | 495.6 | $ | 474.7 | $ | 1,977.4 | $ | 508.8 | $ | 518.3 | $ | 506.0 | $ | 536.2 | $ | 2,069.4 | ||||||||||||||||||||
Healthcare | Q1 | Q2 | Q3 | Q4 | FY | Q1 | Q2 | Q3 | Q4 | FY | ||||||||||||||||||||||||||||||
2017 | 2017 | 2017 | 2017 | 2017 | 2018 | 2018 | 2018 | 2018 | 2018 | |||||||||||||||||||||||||||||||
GAAP Revenues | $ | 237.7 | $ | 237.3 | $ | 231.2 | $ | 186.7 | $ | 893.0 | $ | 244.0 | $ | 260.1 | $ | 235.6 | $ | 241.2 | $ | 980.7 | ||||||||||||||||||||
Adjustment | 1.5 | 1.2 | 1.4 | 2.3 | 6.3 | 1.5 | 1.1 | 0.6 | 0.6 | 4.1 | ||||||||||||||||||||||||||||||
Non-GAAP Revenues | $ | 239.2 | $ | 238.5 | $ | 232.6 | $ | 189.0 | $ | 899.3 | $ | 245.5 | $ | 261.2 | $ | 236.2 | $ | 241.8 | $ | 984.8 | ||||||||||||||||||||
Enterprise | Q1 | Q2 | Q3 | Q4 | FY | Q1 | Q2 | Q3 | Q4 | FY | ||||||||||||||||||||||||||||||
2017 | 2017 | 2017 | 2017 | 2017 | 2018 | 2018 | 2018 | 2018 | 2018 | |||||||||||||||||||||||||||||||
GAAP Revenues | $ | 111.7 | $ | 115.3 | $ | 110.2 | $ | 119.0 | $ | 456.2 | $ | 117.4 | $ | 111.4 | $ | 119.5 | $ | 129.7 | $ | 478.0 | ||||||||||||||||||||
Adjustment | 3.7 | 6.8 | 3.9 | 3.7 | 18.1 | 3.2 | 1.3 | 0.1 | 0.6 | 5.2 | ||||||||||||||||||||||||||||||
Non-GAAP Revenues | $ | 115.4 | $ | 122.1 | $ | 114.1 | $ | 122.7 | $ | 474.3 | $ | 120.6 | $ | 112.7 | $ | 119.6 | $ | 130.3 | $ | 483.2 | ||||||||||||||||||||
Automotive | Q1 | Q2 | Q3 | Q4 | FY | Q1 | Q2 | Q3 | Q4 | FY | ||||||||||||||||||||||||||||||
2017 | 2017 | 2017 | 2017 | 2017 | 2018 | 2018 | 2018 | 2018 | 2018 | |||||||||||||||||||||||||||||||
GAAP Revenues | $ | 57.9 | $ | 60.8 | $ | 62.2 | $ | 67.6 | $ | 248.4 | $ | 60.6 | $ | 68.1 | $ | 72.3 | $ | 73.7 | $ | 274.7 | ||||||||||||||||||||
Adjustment | 1.0 | 0.9 | 0.9 | 0.9 | 3.8 | 0.9 | 0.9 | 1.5 | 1.5 | 4.7 | ||||||||||||||||||||||||||||||
Non-GAAP Revenues | $ | 58.9 | $ | 61.7 | $ | 63.1 | $ | 68.5 | $ | 252.2 | $ | 61.5 | $ | 69.0 | $ | 73.8 | $ | 75.2 | $ | 279.4 | ||||||||||||||||||||
Imaging | Q1 | Q2 | Q3 | Q4 | FY | Q1 | Q2 | Q3 | Q4 | FY | ||||||||||||||||||||||||||||||
2017 | 2017 | 2017 | 2017 | 2017 | 2018 | 2018 | 2018 | 2018 | 2018 | |||||||||||||||||||||||||||||||
GAAP Revenues | $ | 50.1 | $ | 51.3 | $ | 47.9 | $ | 61.9 | $ | 211.2 | $ | 54.4 | $ | 48.0 | $ | 53.4 | $ | 53.5 | $ | 209.4 | ||||||||||||||||||||
Adjustment | 1.9 | 1.8 | 1.5 | 1.3 | 6.5 | 1.2 | 0.9 | 0.8 | 0.6 | 3.5 | ||||||||||||||||||||||||||||||
Non-GAAP Revenues | $ | 52.1 | $ | 53.0 | $ | 49.4 | $ | 63.2 | $ | 217.7 | $ | 55.6 | $ | 48.9 | $ | 54.2 | $ | 54.1 | $ | 212.9 | ||||||||||||||||||||
Other | Q1 | Q2 | Q3 | Q4 | FY | Q1 | Q2 | Q3 | Q4 | FY | ||||||||||||||||||||||||||||||
2017 | 2017 | 2017 | 2017 | 2017 | 2018 | 2018 | 2018 | 2018 | 2018 | |||||||||||||||||||||||||||||||
GAAP Revenues | $ | 30.1 | $ | 35.0 | $ | 34.8 | $ | 30.7 | $ | 130.6 | $ | 25.5 | $ | 26.5 | $ | 22.1 | $ | 34.7 | $ | 108.9 | ||||||||||||||||||||
Adjustment | 0.4 | 0.7 | 1.6 | 0.5 | 3.2 | 0.1 | — | 0.1 | — | 0.2 | ||||||||||||||||||||||||||||||
Non-GAAP Revenues | $ | 30.5 | $ | 35.7 | $ | 36.4 | $ | 31.2 | $ | 133.8 | $ | 25.6 | $ | 26.5 | $ | 22.2 | $ | 34.7 | $ | 109.1 | ||||||||||||||||||||
Schedules may not add due to rounding.
| © 2018 Nuance Communications, Inc. All rights reserved | |
29 | 2018 fourth quarter results |
Prepared remarks | |
November 19, 2018 | |
Nuance Communications, Inc.
Supplemental Financial Information - GAAP to Non-GAAP Reconciliations, continued
(in millions)
Unaudited
Q1 | Q2 | Q3 | Q4 | FY | Q1 | Q2 | Q3 | Q4 | FY | |||||||||||||||||||||||||||||||
2017 | 2017 | 2017 | 2017 | 2017 | 2018 | 2018 | 2018 | 2018 | 2018 | |||||||||||||||||||||||||||||||
Total segment revenues | $ | 496.0 | $ | 511.1 | $ | 495.6 | $ | 474.7 | $ | 1,977.4 | $ | 508.8 | $ | 518.3 | $ | 506.0 | $ | 536.2 | $ | 2,069.4 | ||||||||||||||||||||
Acquisition-related revenue adjustments | (8.4 | ) | (11.5 | ) | (9.4 | ) | (8.7 | ) | (38.0 | ) | (7.2 | ) | (4.1 | ) | (3.1 | ) | (3.3 | ) | (17.7 | ) | ||||||||||||||||||||
Total consolidated revenues | $ | 487.7 | $ | 499.6 | $ | 486.2 | $ | 466.0 | $ | 1,939.4 | $ | 501.6 | $ | 514.2 | $ | 502.9 | $ | 532.9 | $ | 2,051.7 | ||||||||||||||||||||
Total segment profit | $ | 161.6 | $ | 184.0 | $ | 163.2 | $ | 128.9 | $ | 637.7 | $ | 157.4 | $ | 160.3 | $ | 160.5 | 201.2 | $ | 679.5 | |||||||||||||||||||||
Corporate expenses and other, net | (31.0 | ) | (30.2 | ) | (31.7 | ) | (33.1 | ) | (125.9 | ) | (44.7 | ) | (65.1 | ) | (41.6 | ) | (48.1 | ) | (199.4 | ) | ||||||||||||||||||||
Acquisition-related revenues and costs of revenues adjustment | (8.4 | ) | (11.5 | ) | (9.4 | ) | (8.7 | ) | (38.0 | ) | (7.2 | ) | (4.1 | ) | (3.1 | ) | (3.3 | ) | (17.7 | ) | ||||||||||||||||||||
Stock-based compensation | (39.1 | ) | (40.3 | ) | (42.3 | ) | (32.5 | ) | (154.3 | ) | (38.0 | ) | (33.7 | ) | (35.2 | ) | (43.8 | ) | (150.8 | ) | ||||||||||||||||||||
Amortization of intangible assets | (43.4 | ) | (45.1 | ) | (44.9 | ) | (45.3 | ) | (178.7 | ) | (38.4 | ) | (37.5 | ) | (37.9 | ) | (34.2 | ) | (148.0 | ) | ||||||||||||||||||||
Acquisition-related costs, net | (9.0 | ) | (5.4 | ) | (7.6 | ) | (5.7 | ) | (27.7 | ) | (5.6 | ) | (2.4 | ) | (4.9 | ) | (3.3 | ) | (16.1 | ) | ||||||||||||||||||||
Restructuring and other charges, net | (6.7 | ) | (19.9 | ) | (13.0 | ) | (21.4 | ) | (61.1 | ) | (14.8 | ) | (8.9 | ) | (9.2 | ) | (30.5 | ) | (63.5 | ) | ||||||||||||||||||||
Impairment of goodwill | — | — | — | — | — | — | (137.9 | ) | — | (33.0 | ) | (170.9 | ) | |||||||||||||||||||||||||||
Other expenses, net | (37.6 | ) | (56.2 | ) | (39.5 | ) | (37.7 | ) | (171.0 | ) | (34.1 | ) | (32.2 | ) | (32.1 | ) | (31.4 | ) | (129.8 | ) | ||||||||||||||||||||
Loss before income taxes | $ | (13.6 | ) | $ | (24.7 | ) | $ | (25.2 | ) | $ | (55.5 | ) | $ | (119.0 | ) | $ | (25.3 | ) | $ | (161.5 | ) | $ | (3.5 | ) | $ | (26.5 | ) | $ | (216.7 | ) | ||||||||||
Schedules may not add due to rounding.
| © 2018 Nuance Communications, Inc. All rights reserved | |
30 | 2018 fourth quarter results |
Prepared remarks | |
November 19, 2018 | |
Nuance Communications, Inc.
Reconciliation of Supplemental Financial Information
GAAP and non-GAAP Revenue and Net Income per Share Guidance
(in thousands, except per share amounts)
Unaudited
Three months ended December 31, 2018 | |||||||
Low | High | ||||||
GAAP revenue | $ | 495,000 | $ | 509,000 | |||
Acquisition-related adjustment - revenue | 2,000 | 2,000 | |||||
Non-GAAP revenue | $ | 497,000 | $ | 511,000 | |||
GAAP net income per share | $ | (0.16 | ) | $ | (0.13 | ) | |
Acquisition-related adjustment - revenue | 0.01 | 0.01 | |||||
Acquisition-related costs, net | 0.01 | 0.01 | |||||
Cost of revenue from amortization of intangible assets | 0.04 | 0.04 | |||||
Amortization of intangible assets | 0.07 | 0.07 | |||||
Non-cash stock-based compensation | 0.14 | 0.14 | |||||
Non-cash interest expense | 0.04 | 0.04 | |||||
Adjustment to income tax expense | (0.03) | (0.04) | |||||
Restructuring and other charges, net | 0.07 | 0.07 | |||||
Other | 0.08 | 0.08 | |||||
Non-GAAP net income per share | $ | 0.27 | $ | 0.29 | |||
Shares used in computing GAAP and non-GAAP net income per share: | |||||||
Weighted average common shares: basic | 290,000 | 290,000 | |||||
Weighted average common shares: diluted | 295,000 | 295,000 | |||||
| © 2018 Nuance Communications, Inc. All rights reserved | |
31 | 2018 fourth quarter results |
Prepared remarks | |
November 19, 2018 | |
Nuance Communications, Inc.
Reconciliation of Supplemental Financial Information
GAAP and non-GAAP Revenue and Net Income per Share Guidance
(in thousands, except per share amounts)
Unaudited
ASC 605 | ASC 606 | |||||||||||||||
Twelve months ended September 30, 2019 | Twelve months ended September 30, 2019 | |||||||||||||||
Low | High | Low | High | |||||||||||||
GAAP revenue | $ | 2,048,000 | $ | 2,098,000 | $ | 1,990,000 | $ | 2,070,000 | ||||||||
Acquisition-related adjustment - revenue | 7,000 | 7,000 | 5,000 | 5,000 | ||||||||||||
Non-GAAP revenue | $ | 2,055,000 | $ | 2,105,000 | $ | 1,995,000 | $ | 2,075,000 | ||||||||
GAAP net income per share | $ | (0.04 | ) | $ | 0.04 | $ | (0.24 | ) | $ | (0.02 | ) | |||||
Acquisition-related adjustment - revenue | 0.03 | 0.03 | 0.02 | 0.02 | ||||||||||||
Acquisition-related costs, net | 0.04 | 0.04 | 0.04 | 0.04 | ||||||||||||
Cost of revenue from amortization of intangible assets | 0.14 | 0.14 | 0.14 | 0.14 | ||||||||||||
Amortization of intangible assets | 0.28 | 0.28 | 0.28 | 0.28 | ||||||||||||
Non-cash stock-based compensation | 0.54 | 0.54 | 0.54 | 0.54 | ||||||||||||
Non-cash interest expense | 0.17 | 0.17 | 0.17 | 0.17 | ||||||||||||
Adjustment to income tax expense | (0.28) | (0.28) | (0.24) | (0.27) | ||||||||||||
Restructuring and other charges, net | 0.15 | 0.15 | 0.15 | 0.15 | ||||||||||||
Other | 0.16 | 0.16 | 0.16 | 0.16 | ||||||||||||
Non-GAAP net income per share | $ | 1.19 | $ | 1.27 | $ | 1.02 | $ | 1.21 | ||||||||
Weighted average common shares outstanding: | ||||||||||||||||
Basic | 292,000 | 292,000 | 292,000 | 292,000 | ||||||||||||
Diluted | 298,000 | 298,000 | 298,000 | 298,000 | ||||||||||||
| © 2018 Nuance Communications, Inc. All rights reserved | |
Exhibit 99.3
Nuance Communications, Inc. | November 19, 2018 | ||
Nuance to Spin Off Its Automotive Unit | |||
Nuance Announces Plan to Spin Off Its Automotive Segment
to Shareholders as a Separate Public Company
BURLINGTON, Mass., November 19, 2018 - Nuance Communications, Inc. (NASDAQ: NUAN) today announced its intention to spin off its Automotive business segment into a new, independent, publicly traded company ("Nuance Auto"). The standalone entity will be a pure-play, next-generation automotive software company. Immediately following the transaction, which is expected to be completed before the end of fiscal 2019, Nuance shareholders will own shares of both companies. The transaction is intended to be tax-free to Nuance shareholders.
The automotive industry is evolving rapidly as new technologies transform the passenger experience through shared mobility, connectivity and enhanced driver assistance. Nuance is the market leader in voice recognition and cognitive assistants for car infotainment and communication systems and delivers critical enabling technology to help realize the future of mobility. Becoming an independent, publicly traded company represents an important step in Nuance Auto’s growth and the continued development of its conversational AI platform.
"We are incredibly proud of the Auto business we've built, and at the same time we recognize the growing excitement around automotive technology," said Mark Benjamin, CEO of Nuance. "We are excited to launch this business for long-term success by separating it into an independent, focused company. At the same time, the separation will help us become more focused on our core growth opportunities in Healthcare and Enterprise."
Nuance specializes in conversational AI technologies that help automotive manufacturers deliver connected and personalized experiences for drivers and passengers. Nuance Auto’s deeply integrated, customizable solutions power smart automotive assistants that are seamlessly integrated into the in-vehicle connected ecosystem. The business creates conversational experiences for virtually every automotive manufacturer, including Audi, BMW, Daimler, Fiat, Ford, GM, Hyundai, SAIC and Toyota, as well as virtually every major tier-one automotive supplier. Nuance Auto products ship in more than 50 million new cars each year and can be found today in more than 200 million cars, with voice commands recognized in more than 40 languages. In fiscal year 2018, which ended September 30, 2018, the business generated $279 million in revenue, with 7% organic growth and 39% segment margin.
Nuance intends to appoint an independent management team and nominate members to a separate board of directors for Nuance Auto before the transaction is completed. Nuance expects the business will be headquartered in Boston and maintain a significant presence in Montreal and Aachen, Germany, among other global locations.
The spin-off is subject to numerous conditions, including, without limitation, final approval of the Nuance board of directors; the effectiveness of a Registration Statement on Form 10; and, the approved listing of Nuance Auto’s common stock on a national securities exchange selected by Nuance. Pursuant to the spin-off, Nuance plans to distribute shares of Nuance Auto common stock as a tax-free dividend to holders of Nuance common stock as of a record date to be determined by the board of directors of Nuance. The spin-off will not require a vote of Nuance shareholders.
This press release does not constitute an offer to sell or the solicitation of an offer to buy any securities, nor will there be any sale of any securities in any state or other jurisdiction in which such offer, solicitation or sale is not permitted.
| © 2018 Nuance Communications, Inc. All rights reserved | |
Exhibit 99.3
Nuance Communications, Inc. | November 19, 2018 | ||
Nuance to Spin Off Its Automotive Unit | |||
Goldman Sachs & Co. LLC and Evercore are acting as financial advisors and Paul, Weiss, Rifkind, Wharton & Garrison LLP is serving as counsel to Nuance.
Safe Harbor and Forward-Looking Statements
Statements in this document regarding the spin off and separation and our management’s future expectations, beliefs, goals, plans or prospects constitute forward-looking statements within the meaning of the Private Securities Litigation Reform Act of 1995. Any statements that are not statements of historical fact (including statements containing the words “believes,” “plans,” “anticipates,” “expects,” "intends" or “estimates” or similar expressions) should also be considered to be forward-looking statements. There are a number of important factors that could cause actual results or events to differ materially from those indicated by such forward-looking statements, including but not limited to: the ability to effect the separation and meet the related conditions noted above; our ability to close the sale of our Imaging business, our ability to successfully wind-down certain products or business lines, fluctuations in demand for our existing and future products; fluctuations in the mix of products and services sold in specific periods; further unanticipated costs resulting from the FY17 malware incident including potential costs associated with litigation or governmental investigations that may result from the incident; our ability to control and successfully manage our expenses and cash position; our ability to develop and execute in a timely manner our productivity and cost initiatives; the effects of competition, including pricing pressure, and changing business models in the markets and industries we serve; changes to economic conditions in the United States and internationally; uncertainties associated with the transition of our chief executive officer, and the addition of a number of new directors; the imposition of tariffs or other trade measures particularly between the United States and China; potential future impairment charges related to our newly reorganized business reporting units; fluctuating currency rates; possible quality issues in our products and technologies; our ability to successfully integrate operations and employees of acquired businesses; the conversion rate of bookings into revenue; the ability to realize anticipated synergies from acquired businesses; and the other factors described in our most recent Form 10-K, Form 10-Q and other filings with the Securities and Exchange Commission. We disclaim any obligation to update any forward-looking statements as a result of developments occurring after the date of this document.
About Nuance Communications, Inc.
Nuance Communications, Inc. (NASDAQ: NUAN) is the pioneer and leader in conversational AI innovations that bring intelligence to everyday work and life. The Company delivers solutions that can understand, analyze and respond to human language to increase productivity and amplify human intelligence. With decades of domain and artificial intelligence expertise, Nuance works with thousands of organizations - in global industries that include healthcare, telecommunications, automotive, financial services, and retail - to create stronger relationships and better experiences for their customers and workforce. For more information, please visit www.nuance.com.
Trademark reference: Nuance and the Nuance logo are registered trademarks or trademarks of Nuance Communications, Inc. or its affiliates in the United States and/or other countries. All other trademarks referenced herein are the property of their respective owners.
| © 2018 Nuance Communications, Inc. All rights reserved | |
Exhibit 99.3
Nuance Communications, Inc. | November 19, 2018 | ||
Nuance to Spin Off Its Automotive Unit | |||
For Media
Kate Hickman Nuance Communications, Inc. Tel: 781-565-5000 Email:[email protected] | |
For Investors and Media
Richard Mack Nuance Communications, Inc. Tel: 781-565-5000 Email:[email protected] | |
| © 2018 Nuance Communications, Inc. All rights reserved | |