
Form 8-K MYR GROUP INC. For: Nov 14
UNITED STATES
SECURITIES AND EXCHANGE COMMISSION
WASHINGTON, D.C. 20549
Form 8-K
CURRENT REPORT
PURSUANT TO SECTION 13 OR 15(d) OF
THE SECURITIES EXCHANGE ACT OF 1934
Date of Report (Date of earliest event reported): November 14, 2018
MYR GROUP INC.
(Exact name of registrant as specified in its charter)
| Delaware | 1-08325 | 36-3158643 |
|
(State or Other Jurisdiction of Incorporation) |
(Commission File Number) |
(I.R.S. Employer Identification No.) |
|
1701 Golf Road, Suite 3-1012 Rolling Meadows, IL |
60008 | |
| (Address of Principal Executive Offices) | (ZIP Code) |
Registrant’s telephone number, including area code: (847) 290-1891
None
(Former Name or Former Address, if Changed Since Last Report)
Check the appropriate box below if the Form 8-K filing is intended to simultaneously satisfy the filing obligation of the registrant under any of the following provisions:
| ¨ | Written communications pursuant to Rule 425 under the Securities Act (17 CFR 230.425) |
| ¨ | Soliciting material pursuant to Rule 14a-12 under the Exchange Act (17 CFR 240.14a-12) |
| ¨ | Pre-commencement communications pursuant to Rule 14d-2(b) under the Exchange Act (17 CFR 240.14d-2(b)) |
| ¨ | Pre-commencement communications pursuant to Rule 13e-4(c) under the Exchange Act (17 CFR 240.13e-4(c)) |
Indicate by check mark whether the registrant is an emerging growth company as defined in Rule 405 of the Securities Act of 1933(17 CFR §230.405) or Rule 12d-2 of the Securities Exchange Act of 1934 (17 CFR §240.12b-2).
Emerging growth company ¨
If an emerging growth company, indicate by check mark if the registrant has elected not to use the extended transition period for complying with any new or revised financial accounting standards provided pursuant to Section 13(a) of the Exchange Act. ☐
| Item 7.01 | Regulation FD Disclosure. |
On November 14, 2018, MYR Group Inc. (“MYR”) posted presentation materials on the investor relations section of MYR’s website at http://investor.myrgroup.com/events-and-presentations. Members of MYR’s management may use all or portions of these materials from time to time during the quarter ending December 31, 2018 in meetings with or when making presentations to the investment community, current or potential stakeholders and others. The presentation materials are furnished herewith as Exhibit 99.1.
The information contained in the presentation materials is summary information that should be considered in the context of MYR’s filings with the Securities and Exchange Commission and other public announcements that MYR may make by press release or otherwise from time to time.
This information is not deemed “filed” for purposes of Section 18 of the Securities Exchange Act of 1934 (the “Exchange Act”) or incorporated by reference in any filing under the Securities Act of 1933 or the Exchange Act, except as shall be expressly set forth by specific reference in such a filing.
| Item 9.01 | Financial Statements and Exhibits. |
| (d) | The following exhibit is being furnished with this Current Report on Form 8-K. |
| 99.1 | MYR Group Inc. Investor Presentation 2018 Third Quarter dated November 2018. |
SIGNATURE
Pursuant to the requirements of the Securities Exchange Act of 1934, the registrant has duly caused this report to be signed on its behalf by the undersigned hereunto duly authorized.
| MYR GROUP INC. | |||
| Dated: November 14, 2018 | By: | /s/ BETTY R. JOHNSON | |
| Name: | Betty R. Johnson | ||
| Title: | Senior Vice President, Chief Financial Officer and Treasurer | ||
Exhibit 99.1

NOVEMBER UPDATE | NASDAQ: MYRG Q3 2018 INVESTOR PRESENTATION

Forward - Looking Statements Various statements in this communication, including those that express a belief, expectation, or intention, as well as those tha t are not statements of historical fact, are forward - looking statements. The forward - looking statements may include projections and estimates concerning the timing and success of specific projects and our future production, revenue, income, capital spending, segment improvements and investments. Forward - looking statements are generally accompanied by words such as “anticipate,” “believe,” “estimate,” “expect,” “intend,” “may,” “objective,” “outlook,” “plan,” “project,” “likely,” “unlikel y,” “possible,” “potential,” “should” or other words that convey the uncertainty of future events or outcomes. The forward - looking statements in this communication speak only as of the date of this communication; we disclaim any obligation to update these statements (unless required by securities laws), and we caution you not to rely on them unduly. We have based these forward - looking statements on our current expectations and assumptions about future events. While our management considers these expectations and assumptions to be reasonable, they are inherently subject to significant business, economic, competitive, regulatory and other risks, contingencies and uncertainties, most of which are difficult to predict and many of which are bey ond our control. No forward - looking statement can be guaranteed and actual results may differ materially from those projected. Forward - looking statements in this communication should be evaluated together with the many uncertainties that affect MYR Group’s business, particularly those mentioned in the risk factors and cautionary statements in Item 1A of MYR Group’s most recent Annual Report on Form 10 - K, and in any risk factors or cautionary statements contained in MYR Group’s Quarterly Reports on Form 10 - Q or Current Reports on Form 8 - K. │ Page 2 Investor Presentation │ NOVEMBER │ ©2018 MYR GROUP INC. MYR GROUP SAFE HARBOR STATEMENT MYR GROUP CONTACT Betty R. Johnson Chief Financial Officer 847.290.1891 [email protected] INVESTOR CONTACT Steve Carr Dresner Corporate Services 312.780.7211 [email protected]

│ Page 3 Investor Presentation │ NOVEMBER │ ©2018 MYR GROUP INC. Company Overview Strategy Market Overview Financial Performance Investment Outlook Appendix TABLE OF CONTENTS

│ Page 4 Investor Presentation │ NOVEMBER │ ©2018 MYR GROUP INC. Company Overview │ Strategy │ Market Overview │ Financial Performance │ Investment Outlook │ Appendix $1.40B 2017 Revenue $1.14B 2016 $1.06B 2015 $944M 2014 $903M 2013 $999M 2012 $780M 2011 $597M 2010 • AMONG TOP 5 ENR U.S. Specialty Electrical Contractors for 23 years in a row • REPORTABLE SEGMENTS Commercial & Industrial (C&I) Transmission & Distribution (T&D) • RECORD REVENUES R eached record revenues in 2017, an increase of 22.8% over 2016 For more than a century , MYR Group’s subsidiaries have served the electrical construction needs of clients. Our reputation for excellence in both our markets makes us a leader in the industry.

• Growing revenues • Backlog at an all - time high • Stable balance sheet to support growth • Since going public in August 2008, MYR has had no loss quarters, goodwill impairment charges, or extraordinary losses │ Page 5 Investor Presentation │ NOVEMBER │ ©2018 MYR GROUP INC. A MARKET LEADER POSITIONED FOR GROWTH Company Overview │ Strategy │ Market Overview │ Financial Performance │ Investment Outlook │ Appendix FAVORABLE INDUSTRY DYNAMICS STRONG MARKET POSITION • A nationwide leader in Transmission & Distribution • Growing regional presence in Commercial and Industrial • Broad geographic footprint with a strong presence in key growth markets • Network of more than 5,275 highly skilled employees that have built long - standing customer relationships NUMEROUS COMPETITIVE DIFFERENTIATORS SOLID FINANCIAL PERFORMANCE • Superior performance on key operating metrics including: • Safety • Service / customer responsiveness • Large, modern, centralized fleet, including extensive specialized equipment • Current and planned spending by utilities and transmission developers remain high • Strength in U.S. economy is driving growth in C&I construction • Growing need for additional transmission to deliver new generation of natural gas and renewable energy resources to load centers • Federal and state programs for added infrastructure spending

│ Page 6 • Transmission up to 765kV • Overhead Distribution • Underground Distribution • Foundations & Caissons • Directional Boring • Substation & Collector Systems • EPC Services • PCS / Cellular Towers • Emergency Storm Response • Fiber Optics • Underground Gas Distribution • Educational / Medical Centers • Airports / Airfield Lighting • Data Centers • Bridge, Roadway, Tunnel Lighting • Government & Office Buildings • Building Automation & Controls • Telecommunications • Transportation / Traffic Signalization • Voice, Data & Video Systems • Industrial Facilities • Water & Wastewater Treatment Plants • Renovations and Major Additions • Technical Services • Power Plant Electrical Construction Investor Presentation │ NOVEMBER │ ©2018 MYR GROUP INC. COMPREHENSIVE NORTH AMERICAN SERVICE OFFERINGS Company Overview │ Strategy │ Market Overview │ Financial Performance │ Investment Outlook │ Appendix $447 $622 $829 $722 $700 $795 $819 $879 $864 $0 $200 $400 $600 $800 $1,000 2010 2011 2012 2013 2014 2015 2016 2017 2018 Q3 LTM Millions T&D Revenue T&D Revenue 8.9% CAGR $150 $158 $170 $180 $244 $267 $324 $524 $595 $0 $100 $200 $300 $400 $500 $600 $700 2010 2011 2012 2013 2014 2015 2016 2017 2018 Q3 LTM Millions C&I Revenue C&I Revenue 19.5% CAGR Transmission & Distribution (T&D) Commercial & Industrial (C&I)

│ Page 7 Investor Presentation │ NOVEMBER │ ©2018 MYR GROUP INC. FUTURE GROWTH AND VALUE CREATION OPPORTUNITIES • Strategic expansion of MYR Group’s geographic footprint into new markets • Invest in additional fleet and labor resources to expand capacity • Leverage extensive bid knowledge and long - term customer relationships • Search for and evaluate strategic opportunities that achieve long - term growth objectives and leverage our core capabilities • Focus on acquisitions that meet clear, long - term return thresholds and are compatible with MYR Group’s values and culture • Focus on integration of processes, people, technology and equipment • On July 26, 2018, the Company’s Board of Directors approved a new $20.0 million share repurchase program that began when the previous share repurchase program expired. The new share repurchase program will expire on August 15, 2019 or when the authorized funds are exhausted Company Overview │ Strategy │ Market Overview │ Financial Performance │ Investment Outlook │ Appendix Organic Growth Expand in new and existing markets that align with MYR Group’s core capabilities Continue to evaluate targeted, strategic acquisitions to expand business and hone operating expertise $20.0 million remaining under our Share Repurchase Program Strategic Acquisitions Prudent Capital Returns We believe MYR Group is well positioned to deliver growth while driving long - term value for all our stakeholders including clients, stockholders, employees and industry partners. “ “ Rick Swartz President and CEO

MYR Group’s Strong Competitive Advantage • Added multiple new locations in the past several years through organic growth and four acquisitions • History of successful, quality project execution throughout our 125+ years in business - most importantly the most recent ten year s • Centrally managed fleet allows for greater leverage of resources to effectively service nationwide footprint • Strong, established relationships and strategic alliances with a focus on being a solution - provider for our clients • An unrivaled commitment to safety with excellent safety records, programs and culture │ Page 8 Investor Presentation │ NOVEMBER │ ©2018 MYR GROUP INC. TERRITORY COVERAGE Company Overview │ Strategy │ Market Overview │ Financial Performance │ Investment Outlook │ Appendix Westbrook, ME Coquitlam, BC, Canada Vancouver, BC, Canada Nisku, AB, Canada Aurora, IL Broadview, IL Columbus, NJ East Syracuse, NY Auburn, ME Bloomfield, CT Morgan, UT ACQUIRED LOCATIONS C&I T&D ORGANIC GROWTH LOCATIONS Las Vegas, NV Colorado Springs, CO Seattle, WA Chino, CA Chino, CA Corpus Christi, TX Topeka, KS Alvarado , TX Mansfield, TX

│ Page 9 Investor Presentation │ NOVEMBER │ ©2018 MYR GROUP INC. 2018 Acquisition Company Overview │ Strategy │ Market Overview │ Financial Performance │ Investment Outlook │ Appendix Geographic Expansion Enhance End Market Exposure Service Offering Expansion Grow Skilled Workforce July 2018 • Expanded presence in the midwestern and eastern regions of the US • Established offices in: • Broadview, IL • Aurora, IL • Columbus, NJ • East Syracuse, NY • Established a C&I presence in the regions served • Offers a wide range of commercial and industrial electrical construction services including preconstruction services, prefabrication, telecommunications, design - build/design - assist and integrated project delivery methodology • Expands our breadth of C&I service offerings across the Midwestern and eastern regions of the US and strengthens our market position in delivering cost - effective solutions to both new and existing customers • High - quality workforce and strong management team with decades of experience, who share our culture, values and commitment to delivering superior service to our customers through operational experience

│ Page 10 Source: U.S. Department of Energy | March 2018 Transmission Data Review Miles of Planned Transmission Lines Expected to be completed by 2020 “Planned […] refers to projects where: (a) Permits have been approved (b) A design is complete, or (c) The project is necessary to meet a regulatory requirement” Investor Presentation │ NOVEMBER │ ©2018 MYR GROUP INC. T&D MARKET CONDITIONS REMAIN FAVORABLE Company Overview │ Strategy │ Market Overview │ Financial Performance │ Investment Outlook │ Appendix With the project mix we anticipate going forward, which includes increased opportunities in renewable energy and storage, we are optimistic about the strong market and growth opportunities ahead . Rick Swartz President and CEO “ “ NERC Assessment Areas

│ Page 11 Source: The C Three Group, 2018 North American Electric Distribution Market Forecast, September 2018 Historical and Projected Transmission Investment (Nominal Dollars) Source: EEI Transmission Projects: At A Glance, September 2017 (Note: r=revised) Transmission Spend Drivers System Reliability Aging Electric Grid Connecting Renewables Plant Retirements Investor Presentation │ NOVEMBER │ ©2018 MYR GROUP INC. T&D MARKET CONDITIONS REMAIN FAVORABLE Company Overview │ Strategy │ Market Overview │ Financial Performance │ Investment Outlook │ Appendix “U.S . investor - owned utilities project there should be a continued uptick from 2017 to 2018, and this growth should remain relatively constant for the remainder of the decade .” Distribution Spend Drivers Reliability Upgrades Aging Infrastructure Storm Hardening Housing Starts “In 2016, EEI members’ total transmission investments reached approximately $20.8 billion (nominal $) and expect to invest an additional $90 billion in the transmission system through 2020.” U.S. and Canadian Electric Distribution Actual and Forecasted Capital Expenditures by Ownership Type

C&I’s Strong $623.8MM Backlog as of 09/30/2018 is Driven by: Hospitals Data Centers Airport Projects Transportation Work Aerospace Water / Waste Water Upgrades │ Page 12 Investor Presentation │ NOVEMBER │ ©2018 MYR GROUP INC. EXPANDING C&I MARKET Company Overview │ Strategy │ Market Overview │ Financial Performance │ Investment Outlook │ Appendix Associated General Contractors of America: “Construction spending hit a seasonally adjusted annual rate of $1.329 trillion and grew 5.5 percent for nine months of 2018 combined. Spending year - to - date through the first nine months of 2018 was 7.0 percent higher than in January through September 2017 for public construction and 5.1 percent for private construction. Within private construction, spending for residential projects increased 6.4 percent and 3.5 percent for nonresidential projects.” Source: AGC Newsroom • November 1, 2018 Dodge Momentum Index – by McGraw - Hill Construction - 12 month leading indicator of construction spending for nonresidential building - 91% correlation between construction planning reports and the US Commerce Department’s Put in Place spending over the past 10 years Dodge Momentum Index The Dodge Momentum Index dropped to 159.5 (2000=100) in September, down 2.6% from the revised August reading of 163.7, according to Dodge Data & Analytics. The commercial component fell 4.3%, while the institutional component lost 0.1 %; although the overall reading increased 0.8% from the second quarter to the third quarter due to a very strong reading in July . Source : McGraw Hill Construction Press Release Oct. 5 , 2018

│ Page 13 Investor Presentation │ NOVEMBER │ ©2018 MYR GROUP INC. STRONG LONG - TERM FINANCIAL PERFORMANCE Company Overview │ Strategy │ Market Overview │ Financial Performance │ Investment Outlook │ Appendix $597 $780 $999 $903 $944 $1,062 $1,142 $1,403 $1,458 $- $200 $400 $600 $800 $1,000 $1,200 $1,400 $1,600 2010 2011 2012 2013 2014 2015 2016 2017 2018 Q3 LTM Millions Revenue by Work Type Trans. Dist. C&I 12.2% CAGR $398 $411 $425 $451 $435 $475 $621 $689 $661 $632 $702 $679 $959 $1,013 $1,098 $0 $200 $400 $600 $800 $1,000 $1,200 1 2 3 4 1 2 3 4 1 2 3 4 1 2 3 2015 2016 2017 2018 Millions Backlog Backlog > 12 Mo 12 Mo. Backlog 33.5% CAGR $43 $49 $81 $85 $92 $83 $79 $66 $81 $- $10 $20 $30 $40 $50 $60 $70 $80 $90 $100 2010 2011 2012 2013 2014 2015 2016 2017 2018 Q3 LTM Millions EBITDA * EBITDA 8.6% CAGR $0.78 $0.87 $1.60 $1.61 $1.69 $1.30 $1.23 $1.28 $2.05 $- $0.20 $0.40 $0.60 $0.80 $1.00 $1.20 $1.40 $1.60 $1.80 $2.00 $2.20 2010 2011 2012 2013 2014 2015 2016 2017 2018 Q3 LTM Diluted EPS Diluted EPS 13.3% CAGR * For reconciliation of EBITDA to net income, see page 21

• Little off - balance - sheet leverage • Limited goodwill • Modest debt leverage • Strong liquidity position • Substantial bonding capacity • Investment in specialty equipment contributed to top - line organic growth and supports future organic growth • Executed two new equipment notes totaling $24.9 million, enabling us to move a portion of our variable - rate debt to fixed rates and to increase our liquidity │ Page 14 Investor Presentation │ NOVEMBER │ ©2018 MYR GROUP INC. BALANCE SHEET STRENGTH TO SUPPORT ADDITIONAL GROWTH Company Overview │ Strategy │ Market Overview │ Financial Performance │ Investment Outlook │ Appendix $(150) $(50) $50 $150 $250 $350 2010 2011 2012 2013 2014 2015 2016 2017 2018 Q3 Millions Liquidity Credit Facility Cash LOC Bank Debt Total Liquidity Source: S&P Capital IQ - NM (Not Meaningful) reflects negative returns and is ignored for comparison purposes. Period is September 2016 - September 2018 DY period is July 2016 – July 2018 PWR period is June 2016 – June 2018 15.9% 15.2% 10.8% 7.6% 6.4% 0.0% 2.0% 4.0% 6.0% 8.0% 10.0% 12.0% 14.0% 16.0% 18.0% DY EME MTZ MYRG PWR 3 - Year Average ROIC $21.9 $42.3 $37.2 $42.7 $39.0 $46.6 $25.4 $30.8 $45.7 0.0% 2.0% 4.0% 6.0% 8.0% 10.0% $0 $25 $50 2010 2011 2012 2013 2014 2015 2016 2017 2018 Q3 LTM Millions CAPEX Investment CAPEX Spend CAPEX % of Rev
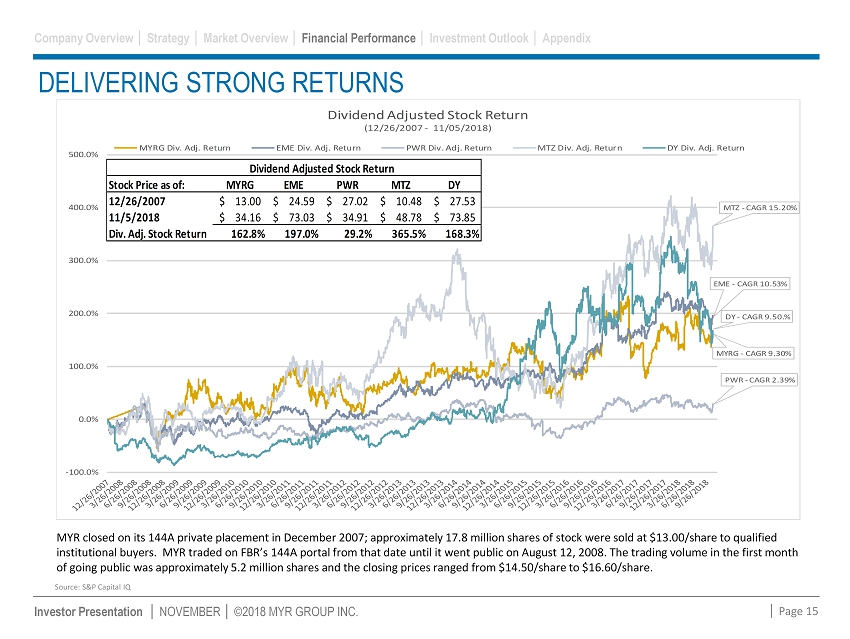
│ Page 15 Investor Presentation │ NOVEMBER │ ©2018 MYR GROUP INC. DELIVERING STRONG RETURNS Company Overview │ Strategy │ Market Overview │ Financial Performance │ Investment Outlook │ Appendix MYR closed on its 144A private placement in December 2007; approximately 17.8 million shares of stock were sold at $13.00/sha re to qualified institutional buyers. MYR traded on FBR’s 144A portal from that date until it went public on August 12, 2008. The trading vo lum e in the first month of going public was approximately 5.2 million shares and the closing prices ranged from $14.50/share to $16.60/share. Source: S&P Capital IQ MYRG - CAGR 9.30% EME - CAGR 10.53% PWR - CAGR 2.39% MTZ - CAGR 15.20% DY - CAGR 9.50.% -100.0% 0.0% 100.0% 200.0% 300.0% 400.0% 500.0% Dividend Adjusted Stock Return (12/26/2007 - 11/05/2018) MYRG Div. Adj. Return EME Div. Adj. Return PWR Div. Adj. Return MTZ Div. Adj. Return DY Div. Adj. Return Dividend Adjusted Stock Return Stock Price as of: MYRG EME PWR MTZ DY 12/26/2007 13.00$ 24.59$ 27.02$ 10.48$ 27.53$ 11/5/2018 34.16$ 73.03$ 34.91$ 48.78$ 73.85$ Div. Adj. Stock Return 162.8% 197.0% 29.2% 365.5% 168.3%
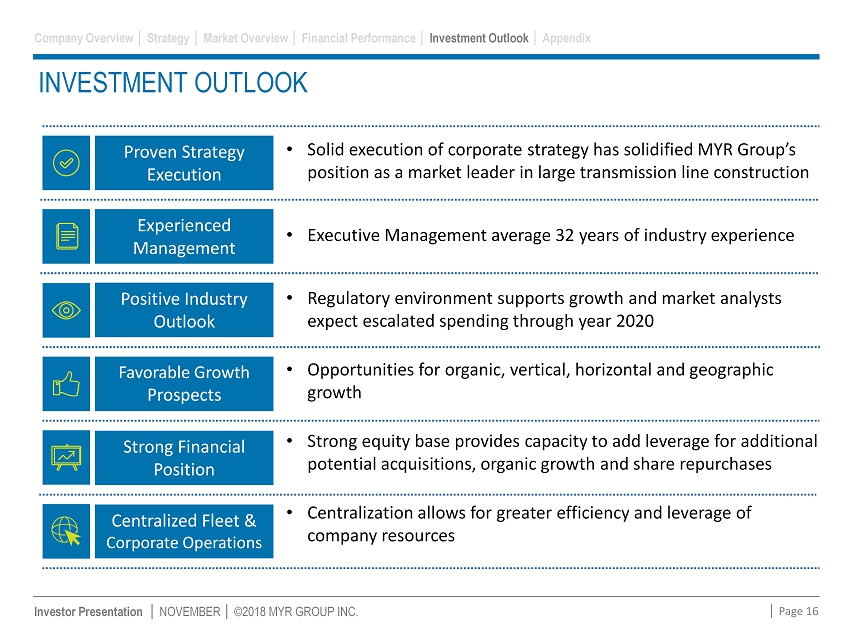
│ Page 16 Investor Presentation │ NOVEMBER │ ©2018 MYR GROUP INC. INVESTMENT OUTLOOK Company Overview │ Strategy │ Market Overview │ Financial Performance │ Investment Outlook │ Appendix • Solid execution of corporate strategy has solidified MYR Group’s position as a market leader in large transmission line construction • Executive Management average 32 years of industry experience • Regulatory environment supports growth and market analysts expect escalated spending through year 2020 • Opportunities for organic, vertical, horizontal and geographic growth • Strong equity base provides capacity to add leverage for additional potential acquisitions, organic growth and share repurchases • Centralization allows for greater efficiency and leverage of company resources Strong Financial Position Centralized Fleet & Corporate Operations Positive Industry Outlook Proven Strategy Execution Favorable Growth Prospects Experienced Management
Appendix │ Page 17 Investor Presentation │ NOVEMBER │ ©2018 MYR GROUP INC. Company Overview │ Strategy │ Market Overview │ Financial Performance │ Investment Outlook │ Appendix

│ Page 18 Investor Presentation │ NOVEMBER │ ©2018 MYR GROUP INC. CORPORATE GOVERNANCE OVERVIEW EXPERIENCED BOARD WITH INDEPENDENT OVERSIGHT • 9 of 10 directors are independent • 6 of 10 directors have significant energy / utility experience • Independent Chairman of the Board • Audit, Compensation and Nominating / Governance committees comprised solely of independent directors • Separate executive sessions of independent directors • Annual Board evaluations Company Overview │ Strategy │ Market Overview │ Financial Performance │ Investment Outlook │ Appendix STRONG CORPORATE GOVERNANCE PRACTICES • Majority voting standard for directors in uncontested elections • No “Poison Pill” in place • Effective executive compensation best practices • Majority of CEO compensation is performance based ACCOUNTABILITY & RESPONSIVENESS • Board adopted majority voting for uncontested elections in December of 2015 based on input from shareholders • Proactive investor relations outreach to ensure active, ongoing engagement

EXPERIENCED MANAGEMENT TEAM │ Page 19 Investor Presentation │ NOVEMBER │ ©2018 MYR GROUP INC. Company Overview │ Strategy │ Market Overview │ Financial Performance │ Investment Outlook │ Appendix • Experienced management team averages more than 25 years with MYR Group and approximately 32 years in our industry • Strong corporate culture focused on customer service and safety • Investment in management team for the successful execution of large, multi - year projects BETTY JOHNSON Chief Financial Officer 18 years 29 years RICK SWARTZ Chief Executive Officer 36 years 36 years GARY ENGEN Chief Legal Officer 18 years 35 years MYR Group Experience Industry Experience TOD COOPER Chief Operating Officer – T&D 27 years 29 years JEFF WANEKA Chief Operating Officer – C&I 27 years 34 years Strengths

SERVICE OFFERINGS Transmission Renewables Distribution Traffic Signalization Telecommunications Substation Foundations Industrial Storm Restoration EPC Commercial Smart Grid │ Page 20 Investor Presentation │ NOVEMBER │ ©2018 MYR GROUP INC. Company Overview │ Strategy │ Market Overview │ Financial Performance │ Investment Outlook │ Appendix
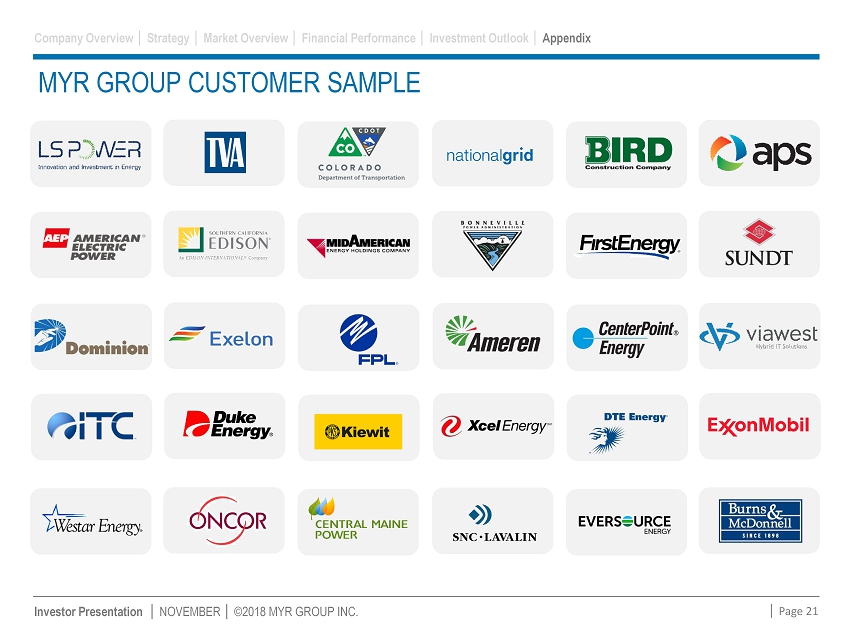
MYR GROUP CUSTOMER SAMPLE │ Page 21 Investor Presentation │ NOVEMBER │ ©2018 MYR GROUP INC. Company Overview │ Strategy │ Market Overview │ Financial Performance │ Investment Outlook │ Appendix

EBITDA RECONCILIATION │ Page 22 Investor Presentation │ NOVEMBER │ ©2018 MYR GROUP INC. Company Overview │ Strategy │ Market Overview │ Financial Performance │ Investment Outlook │ Appendix Note: LTM diluted weighted average shares outstanding were determined by adding the average shares reported for the last four quart ers and dividing by four. EBITDA is not recognized under GAAP and does not purport to be an alternative to net income as a measure of operating perform anc e or to net cash flows provided by operating activities as a measure of liquidity. EBITDA is a component of the debt to EBITDA covenant that we must report to our bank on a quarterly bas is. In addition, management considers EBITDA a useful measure because it eliminates differences which are caused by different capital structures as well as different tax rates and depreci ati on schedules when comparing our measures to our peers’ measures. ($ In Millions, Except Per Share Amounts)* FY LTM 2010 2011 2012 2013 2014 2015 2016 2017 9/30/2018 Net Income 16.1$ 18.3$ 34.3$ 34.8$ 36.5$ 27.3$ 21.4$ 21.2$ 34.0$ Interest Expense, net 1.0 0.5 0.8 0.7 0.6 0.7 1.3 2.6 3.3$ Provision for Income Taxes 9.3 10.8 20.4 20.1 21.4 17.0 16.9 3.5 5.1$ Depreciation and Amortization 16.3 19.5 25.2 29.2 33.5 38.0 39.2 38.6 38.2$ EBITDA 42.7$ 49.1$ 80.7$ 84.8$ 92.0$ 83.0$ 78.8$ 65.8$ 80.6$ Diluted Weighted Average Shares Outstanding 20.8 21.0 21.2 21.4 21.5 21.0 17.5 16.5 16.6 EBITDA per Diluted Share 2.05$ 2.34$ 3.80$ 3.96$ 4.29$ 3.95$ 4.51$ 3.99$ 4.87$ Revenue 597.1$ 780.4$ 999.0$ 902.7$ 944.0$ 1,061.7$ 1,142.5$ 1,403.3$ 1,458.3$ EBITDA is a non-GAAP financial measure that is defined as Earnings Before Income Taxes, Depreciation and Amortization. EBITDA Margin 7.15% 6.29% 8.08% 9.39% 9.75% 7.82% 6.90% 4.69% 5.53%
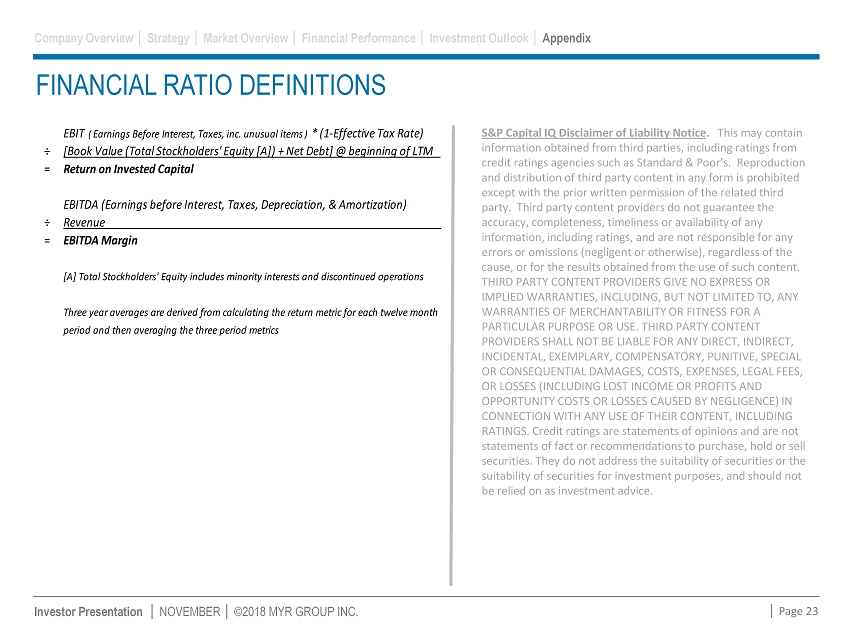
FINANCIAL RATIO DEFINITIONS │ Page 23 S&P Capital IQ Disclaimer of Liability Notice . This may contain information obtained from third parties, including ratings from credit ratings agencies such as Standard & Poor’s. Reproduction and distribution of third party content in any form is prohibited except with the prior written permission of the related third party. Third party content providers do not guarantee the accuracy, completeness, timeliness or availability of any information, including ratings, and are not responsible for any errors or omissions (negligent or otherwise), regardless of the cause, or for the results obtained from the use of such content. THIRD PARTY CONTENT PROVIDERS GIVE NO EXPRESS OR IMPLIED WARRANTIES, INCLUDING, BUT NOT LIMITED TO, ANY WARRANTIES OF MERCHANTABILITY OR FITNESS FOR A PARTICULAR PURPOSE OR USE. THIRD PARTY CONTENT PROVIDERS SHALL NOT BE LIABLE FOR ANY DIRECT, INDIRECT, INCIDENTAL, EXEMPLARY, COMPENSATORY, PUNITIVE, SPECIAL OR CONSEQUENTIAL DAMAGES, COSTS, EXPENSES, LEGAL FEES, OR LOSSES (INCLUDING LOST INCOME OR PROFITS AND OPPORTUNITY COSTS OR LOSSES CAUSED BY NEGLIGENCE) IN CONNECTION WITH ANY USE OF THEIR CONTENT, INCLUDING RATINGS. Credit ratings are statements of opinions and are not statements of fact or recommendations to purchase, hold or sell securities. They do not address the suitability of securities or the suitability of securities for investment purposes, and should not be relied on as investment advice. Investor Presentation │ NOVEMBER │ ©2018 MYR GROUP INC. Company Overview │ Strategy │ Market Overview │ Financial Performance │ Investment Outlook │ Appendix EBIT ( Earnings Before Interest, Taxes, inc. unusual items ) * (1-Effective Tax Rate) ÷ [Book Value (Total Stockholders' Equity [A]) + Net Debt] @ beginning of LTM = Return on Invested Capital EBITDA (Earnings before Interest, Taxes, Depreciation, & Amortization) ÷ Revenue = EBITDA Margin [A] Total Stockholders' Equity includes minority interests and discontinued operations Three year averages are derived from calculating the return metric for each twelve month period and then averaging the three period metrics