
Form 8-K ZAGG Inc For: Nov 06
UNITED STATES
SECURITIES AND EXCHANGE COMMISSION
WASHINGTON, D.C. 20549
____________________
FORM 8-K
CURRENT REPORT
Pursuant to Section 13 or 15(d) of the Securities Exchange Act of 1934
Date of Report (Date of earliest event reported): November 6, 2018
ZAGG INC
(Exact name of registrant as specified in its charter)
Delaware | 001-34528 | 20-2559624 | ||||||
(State or other jurisdiction of incorporation) | (Commission File Number) | (I.R.S. Employer Identification No.) | ||||||
910 West Legacy Center Way, Suite 500 Midvale, Utah 84047 | ||
(Address of principal executive offices; zip code) | ||
(801) 263-0699 | ||
(Registrant's telephone number, including area code)
Not applicable | ||
(Former name or former address, if changed since last report)
Check the appropriate box below if the Form 8-K filing is intended to simultaneously satisfy the filing obligation of the registrant under any of the following provisions:
o Written communications pursuant to Rule 425 under the Securities Act (17 CFR 230.425)
o Soliciting material pursuant to Rule 14a-12 under the Exchange Act (17 CFR 240.14a-12)
o Pre-commencement communications pursuant to Rule 14d-2(b) under the Exchange Act (17 CFR 240.14d-2(b))
o Pre-commencement communications pursuant to Rule 13e-4(c) under the Exchange Act (17 CFR 240.13e-4(c))
Indicate by check mark whether the registrant is an emerging growth company as defined in Rule 405 of the Securities Act of 1933 (§230.405 of this chapter) or Rule 12b-2 of the Securities Exchange Act of 1934 (§240.12b-2 of this chapter).
Emerging growth company o
If an emerging growth company, indicate by check mark if the registrant has elected not to use the extended transition period for complying with any new or revised financial accounting standards provided pursuant to Section 13(a) of the Exchange Act. o
Item 2.02 | Results of Operations and Financial Condition. | |||||||
On November 6, 2018, ZAGG Inc (the “Company”) issued a press release announcing the results of operations for the three and nine months ended September 30, 2018, and made publicly available certain supplemental financial information, including commentary on results of operations from Bradley J. Holiday, Chief Financial Officer (“CFO”). The supplemental financial information - financial tables is furnished with this report as Exhibit 99.1, the press release is furnished with this report as Exhibit 99.2, and the supplemental financial information - CFO commentary is furnished with this report as Exhibit 99.3.
The Company will also hold its earnings conference call on November 6, 2018. The conference call will be available to interested parties through a live audio Internet broadcast accessible at investors.ZAGG.com under the events tab. A podcast of the conference call will be archived at investors.ZAGG.com for one year. The URLs are included here as inactive textual references. Information contained on, or accessible through, our websites is not a part of, and is not incorporated by reference into, this report.
| Item 9.01 | Financial Statements and Exhibits. | |||||||
| (d) Exhibits. | ||||||||
| The following are filed as Exhibits to this Current Report on Form 8-K: | ||||||||
| Exhibit No. | Description | |||||||
The information contained in Item 2.02 and Item 9.01 of this Current Report on Form 8-K, including Exhibits 99.1, 99.2, and 99.3 shall not be deemed to be “filed” for the purposes of Section 18 of the Securities Exchange Act of 1934, as amended, or otherwise subject to the liabilities of that section, nor shall they be deemed incorporated by reference in any registration statement or other filing under the Securities Act of 1933, as amended, except as shall be expressly set forth by specific reference in any such filing.
SIGNATURES
Pursuant to the requirements of the Securities Exchange Act of 1934, the registrant has duly caused this report to be signed on its behalf by the undersigned hereunto duly authorized.
| ZAGG INC | |||||
| Dated: November 6, 2018 | /s/ Bradley J. Holiday | ||||
| Bradley J. Holiday | |||||
| Chief Financial Officer | |||||
| (Principal financial officer) | |||||
ZAGG INC AND SUBSIDIARIES
CONDENSED CONSOLIDATED BALANCE SHEETS
(in thousands, except par value)
(Unaudited)
| September 30, 2018 | December 31, 2017 | |||||||||||||
| ASSETS | ||||||||||||||
| Current assets: | ||||||||||||||
| Cash and cash equivalents | $ | 17,780 | $ | 24,989 | ||||||||||
| Accounts receivable, net of allowances of $707 and $734 | 115,801 | 123,220 | ||||||||||||
| Income tax receivable | 941 | — | ||||||||||||
| Inventories | 78,666 | 75,046 | ||||||||||||
| Prepaid expenses and other current assets | 6,649 | 4,547 | ||||||||||||
| Total current assets | 219,837 | 227,802 | ||||||||||||
| Property and equipment, net of accumulated depreciation of $15,284 and $12,540 | 13,936 | 13,444 | ||||||||||||
| Intangible assets, net of accumulated amortization of $75,151 and $66,639 | 32,505 | 39,244 | ||||||||||||
| Deferred income tax assets | 22,134 | 24,403 | ||||||||||||
| Goodwill | 12,570 | 12,272 | ||||||||||||
| Other assets | 1,667 | 3,426 | ||||||||||||
| Total assets | $ | 302,649 | $ | 320,591 | ||||||||||
| LIABILITIES AND STOCKHOLDERS’ EQUITY | ||||||||||||||
| Current liabilities: | ||||||||||||||
| Accounts payable | $ | 67,355 | $ | 96,472 | ||||||||||
| Income tax payable | — | 2,052 | ||||||||||||
| Sales returns liability | 43,506 | 34,536 | ||||||||||||
| Accrued wages and wage related expenses | 5,812 | 5,652 | ||||||||||||
| Accrued liabilities | 8,091 | 8,168 | ||||||||||||
| Deferred revenue | — | 315 | ||||||||||||
| Current portion of line of credit | — | 23,475 | ||||||||||||
| Current portion of long-term debt, net of deferred loan costs of $0 and $141 | — | 13,922 | ||||||||||||
| Total current liabilities | 124,764 | 184,592 | ||||||||||||
| Non-current portion of line of credit | 28,000 | — | ||||||||||||
| Total liabilities | 152,764 | 184,592 | ||||||||||||
| Stockholders’ equity: | ||||||||||||||
| Common stock, $0.001 par value; 100,000 shares authorized; 34,433 and 34,104 shares issued | 34 | 34 | ||||||||||||
| Treasury stock, 6,448 and 6,065 common shares at cost | (43,734) | (37,637) | ||||||||||||
| Additional paid-in capital | 95,642 | 96,145 | ||||||||||||
| Accumulated other comprehensive loss | (853) | (348) | ||||||||||||
| Retained earnings | 98,796 | 77,805 | ||||||||||||
| Total stockholders’ equity | 149,885 | 135,999 | ||||||||||||
| Total liabilities and stockholders’ equity | $ | 302,649 | $ | 320,591 | ||||||||||
ZAGG INC AND SUBSIDIARIES
CONDENSED CONSOLIDATED STATEMENT OF OPERATIONS
(in thousands, except per share amounts)
(Unaudited)
| Three Months Ended | Nine Months Ended | |||||||||||||||||||||||||
| September 30, 2018 | September 30, 2017 | September 30, 2018 | September 30, 2017 | |||||||||||||||||||||||
| Net sales | $ | 141,087 | $ | 134,398 | $ | 371,718 | $ | 342,571 | ||||||||||||||||||
| Cost of sales | 88,916 | 86,006 | 244,297 | 229,749 | ||||||||||||||||||||||
| Gross profit | 52,171 | 48,392 | 127,421 | 112,822 | ||||||||||||||||||||||
| Operating expenses: | ||||||||||||||||||||||||||
| Advertising and marketing | 3,089 | 2,627 | 8,322 | 7,703 | ||||||||||||||||||||||
| Selling, general and administrative | 27,349 | 26,720 | 78,692 | 78,727 | ||||||||||||||||||||||
| Transaction costs | 618 | 96 | 635 | 611 | ||||||||||||||||||||||
| Impairment of intangible asset | — | — | — | 1,959 | ||||||||||||||||||||||
| Amortization of intangible assets | 2,859 | 3,014 | 8,404 | 9,040 | ||||||||||||||||||||||
| Total operating expenses | 33,915 | 32,457 | 96,053 | 98,040 | ||||||||||||||||||||||
| Income from operations | 18,256 | 15,935 | 31,368 | 14,782 | ||||||||||||||||||||||
| Other income (expense): | ||||||||||||||||||||||||||
| Interest expense | (286) | (417) | (1,132) | (1,527) | ||||||||||||||||||||||
| Other (expense) income | (176) | 18 | (362) | 67 | ||||||||||||||||||||||
| Total other expense | (462) | (399) | (1,494) | (1,460) | ||||||||||||||||||||||
| Income before provision for income taxes | 17,794 | 15,536 | 29,874 | 13,322 | ||||||||||||||||||||||
| Income tax provision | (3,168) | (5,760) | (5,003) | (6,281) | ||||||||||||||||||||||
| Net income | $ | 14,626 | $ | 9,776 | $ | 24,871 | $ | 7,041 | ||||||||||||||||||
| Earnings per share attributable to stockholders: | ||||||||||||||||||||||||||
| Basic earnings per share | $ | 0.52 | $ | 0.35 | $ | 0.88 | $ | 0.25 | ||||||||||||||||||
| Diluted earnings per share | $ | 0.51 | $ | 0.34 | $ | 0.87 | $ | 0.25 | ||||||||||||||||||
ZAGG INC AND SUBSIDIARIES
RECONCILIATION OF NON-U.S. GAAP FINANCIAL INFORMATION TO U.S. GAAP
(in thousands)
(Unaudited)
| UNAUDITED SUPPLEMENTAL DATA | ||||||||||||||||||||||||||
| The following information is not a financial measure under generally accepted accounting principles ("GAAP"). In addition, it should not be construed as an alternative to any other measures of performance determined in accordance with GAAP, or as an indicator of our operating performance, liquidity or cash flows generated by operating, investing and financing activities as there may be significant factors or trends that it fails to address. We present this financial information because we believe that it is helpful to some investors as a measure of our operations. We caution investors that non-GAAP financial information, by its nature, departs from traditional accounting conventions; accordingly, its use can make it difficult to compare our results with our results from other reporting periods and with the results of other companies. | ||||||||||||||||||||||||||
| ADJUSTED EBITDA RECONCILIATION | Three Months Ended | Nine Months Ended | ||||||||||||||||||||||||
| September 30, 2018 | September 30, 2017 | September 30, 2018 | September 30, 2017 | |||||||||||||||||||||||
| Net income in accordance with U.S. GAAP | $ | 14,626 | $ | 9,776 | $ | 24,871 | $ | 7,041 | ||||||||||||||||||
| Adjustments: | ||||||||||||||||||||||||||
| a. | Stock-based compensation expense | 757 | 899 | 2,165 | 2,536 | |||||||||||||||||||||
| b. | Depreciation and amortization | 4,099 | 5,486 | 13,329 | 16,505 | |||||||||||||||||||||
| c. | Impairment of intangible asset | — | — | — | 1,959 | |||||||||||||||||||||
| d. | Other expense, net | 462 | 399 | 1,494 | 1,460 | |||||||||||||||||||||
| e. | Transaction costs | 618 | 96 | 635 | 611 | |||||||||||||||||||||
| f. | mophie restructuring charges | — | — | — | 437 | |||||||||||||||||||||
| g. | mophie employee retention bonus | — | — | — | 346 | |||||||||||||||||||||
| h. | Inventory step-up amount in connection with the BRAVEN Acquisition | 72 | — | 72 | — | |||||||||||||||||||||
| i. | Consulting fee to former CEO | — | — | 700 | — | |||||||||||||||||||||
| j | Income tax provision | 3,168 | 5,760 | 5,003 | 6,281 | |||||||||||||||||||||
| Total Adjustments | 9,176 | 12,640 | 23,398 | 30,135 | ||||||||||||||||||||||
| Adjusted EBITDA | $ | 23,802 | $ | 22,416 | $ | 48,269 | $ | 37,176 | ||||||||||||||||||
ZAGG INC AND SUBSIDIARIES
RECONCILIATION OF NON-U.S. GAAP FINANCIAL INFORMATION TO U.S. GAAP
(in thousands)
(Unaudited)
| Years Ended | ||||||||||||||
| Guidance | Actual | |||||||||||||
| ADJUSTED EBITDA RECONCILIATION (CONTINUED) | December 31, 2018 | December 31, 2017 | ||||||||||||
| Net income in accordance with U.S. GAAP | $ | 39,400 | $ | 15,100 | ||||||||||
| Adjustments: | ||||||||||||||
| a. | Adjustments to net income | 25,200 | 29,615 | |||||||||||
| b. | Income tax provision | 12,400 | 28,252 | |||||||||||
| Total Adjustments | 37,600 | 57,867 | ||||||||||||
| Adjusted EBITDA | $ | 77,000 | $ | 72,967 | ||||||||||
November 6, 2018
ZAGG Reports Record Third Quarter 2018 Results
SALT LAKE CITY, November 6, 2018 (GLOBE NEWSWIRE) – ZAGG Inc (Nasdaq: ZAGG), a leading global mobile lifestyle company, today announced financial results for the third quarter ended September 30, 2018.
Third Quarter 2018 Highlights (Comparisons versus Third Quarter 2017)
• Net sales of $141.1 million, an increase of 5% compared to $134.4 million
• Gross profit of 37% compared to 36%
• Net income of $14.6 million compared to $9.8 million
• Diluted earnings per share of $0.51 compared to $0.34
• Adjusted EBITDA of $23.8 million compared to $22.4 million
Year-to-Date 2018 Highlights (Comparisons versus Year-to-Date 2017)
• Net sales of $371.7 million, an increase of 9% compared to $342.6 million
• Gross profit of 34% compared to 33%
• Net income of $24.9 million compared to $7.0 million
• Diluted earnings per share of $0.87 compared to $0.25
• Adjusted EBITDA of $48.3 million compared to $37.2 million
"Our record third quarter was highlighted by strong growth in screen protection sales which fueled meaningful gains in gross margin and operating profit," commented Chris Ahern, Chief Executive Officer. "We are also encouraged by the performance of our wireless charging business, which continues to gain market share following the launch of our mophie wireless charge pad just 12 months ago. With respect to power cases, we recently received certification for mophie’s iPhone X compatible juice pack and expect to have product in market ahead of the holiday selling season. That said, this is later than our most recent expectations, which has put some near-term pressure on our top-line and required us to reduce our full-year revenue outlook. Looking ahead, we remain confident about the longer-term growth prospects for ZAGG and I am confident that we have the right resources and plans in place to successfully capitalize on these opportunities."
Third Quarter Results (in millions, except per share amounts)
| Three Months Ended | |||||||||||
| September 30, 2018 | September 30, 2017 | ||||||||||
| Net sales | $ | 141.1 | $ | 134.4 | |||||||
| Gross profit | $ | 52.2 | $ | 48.4 | |||||||
| Gross profit margin | 37 | % | 36 | % | |||||||
| Net income | $ | 14.6 | $ | 9.8 | |||||||
| Diluted earnings per share | $ | 0.51 | $ | 0.34 | |||||||
| Adjusted EBITDA | $ | 23.8 | $ | 22.4 | |||||||
Net sales increased 5% to $141.1 million, the highest third quarter sales result in ZAGG's history, compared to $134.4 million. The increase in net sales was primarily attributable to (1) increased sales of screen protection products driven by the new iPhone® launch as well as the introduction of the Glass + VisionGuard® screen protection products, and (2) the increase in sales of our power management products, specifically related to wireless charging accessories. These increases were partially offset by a decrease in sales of power cases and audio.
Gross profit increased 8% to $52.2 million (37% of net sales) compared to $48.4 million (36% of net sales). The increase in gross profit margin was primarily attributable to the mix of screen protection products, our highest margin product category, which increased to 63% of net sales compared to 57% of net sales during the three months ended September 30, 2018.
Operating expenses increased 4% to $33.9 million (24% of net sales) compared to $32.5 million (24% of net sales). The increase in operating expenses was primarily attributable to (1) increases in headcount to support additional growth of the Company, and (2) transaction costs incurred in connection with the acquisition of BRAVEN. These increases were partially offset by a decrease in depreciation expense resulting from lower carrying amounts of property and equipment during the three months ended September 30, 2018.
Net income increased 50% to $14.6 million compared to $9.8 million. Diluted earnings per share increased 51% to $0.51 (on 28.6 million shares) compared to $0.34 (on 28.4 million shares).
Adjusted EBITDA increased 6% to $23.8 million compared to $22.4 million.
Year-to-Date Results (in millions, except per share amounts)
| Nine Months Ended | |||||||||||
| September 30, 2018 | September 30, 2017 | ||||||||||
| Net sales | $ | 371.7 | $ | 342.6 | |||||||
| Gross profit | $ | 127.4 | $ | 112.8 | |||||||
| Gross profit margin | 34 | % | 33 | % | |||||||
| Net income | $ | 24.9 | $ | 7.0 | |||||||
| Diluted earnings per share | $ | 0.87 | $ | 0.25 | |||||||
| Adjusted EBITDA | $ | 48.3 | $ | 37.2 | |||||||
Net sales increased 9% to $371.7 million, the highest third quarter year-to-date sales result in ZAGG's history, compared to $342.6 million. The increase in net sales was primarily attributable to (1) the increase in sales of our power management products, specifically related to wireless charging accessories, and (2) increases in screen protection products driven by the new iPhone launch as well as the introduction of the Glass + VisionGuard screen protection products. These increases were partially offset by a decrease in sales of power cases and audio.
Gross profit increased 13% to $127.4 million (34% of net sales) compared to $112.8 million (33% of net sales). The increase in gross profit margin was primarily attributable to the mix of screen protection products, our highest margin product category, which increased to approximately 56% of net sales compared to approximately 52% of net sales for the nine months ended September 30, 2018.
Operating expenses decreased 2% to $96.1 million (26% of net sales) compared to $98.0 million (29% of net sales). The decrease in operating expenses was primarily attributable to (1) a decrease in depreciation expense, (2) a $2.0 million charge in 2017 related to the impairment of a patent that did not recur in 2018, and (3) operating expense synergies realized related to the mophie integration. These decreases in operating expense were partially offset by increases in headcount to support additional growth of the Company.
Net income increased 253% to $24.9 million compared to net income of $7.0 million. Diluted earnings per share increased 248% to $0.87 (on 28.6 million shares) compared to $0.25 (on 28.2 million shares).
Adjusted EBITDA increased 30% to $48.3 million compared to $37.2 million.
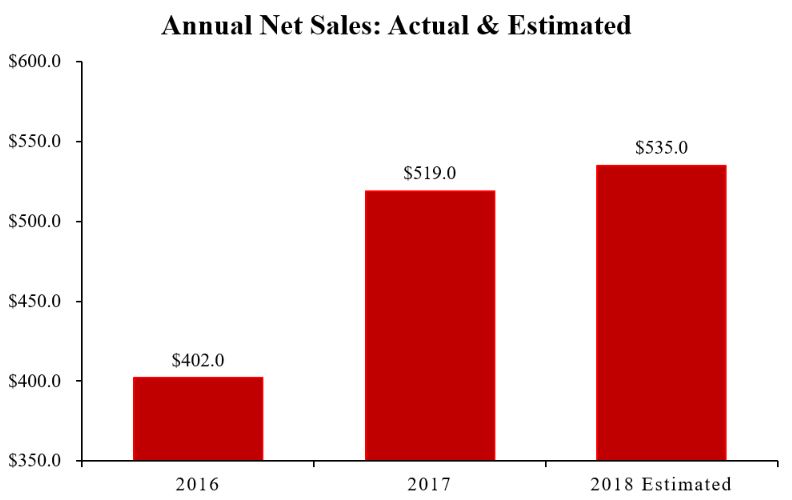
2018 Business Outlook
The Company updated its annual guidance for 2018 as follows:
• Due to the delay in the juice pack® certification, net sales of approximately $535 million
• Gross profit margin as a percentage of net sales in the low to mid 30's range
• Adjusted EBITDA at the low end of the current range of $77 million to $80 million
• Diluted earnings per share of $1.30 to $1.40
• Annual effective tax rate of approximately 24% compared to approximately 25% in the last annual business outlook
Conference Call
A conference call will be held today, November 6, 2018, at 5:00 p.m. Eastern to review these results. Interested parties may access via the Internet on the Company's website at: investors.zagg.com (the URLs are included here in this exhibit as inactive textual references and information contained on, or accessible through, our websites is not a part of, and is not incorporated by reference into, this report).
About Non-GAAP Financial Information
This press release includes Adjusted EBITDA as a non-GAAP financial measure. Readers are cautioned that Adjusted EBITDA (earnings before interest, taxes, depreciation, amortization, stock-based compensation expense, other expense, transaction costs, mophie restructuring charges, mophie employee retention bonus, consulting fee to former CEO, inventory step-up amount in conjunction with the BRAVEN acquisition, and impairment of intangible asset) is not a financial measure under U.S. generally accepted accounting principles ("GAAP"). In addition, this financial information should not be construed as an alternative to any other measure of performance determined in accordance with GAAP, or as an indicator of operating performance, liquidity or cash flows generated by operating, investing and financing activities, as there may be significant factors or trends that it fails to address. As such, it should be read only in conjunction with our consolidated financial statements prepared in accordance with GAAP. We present Adjusted EBITDA because we believe that it is helpful to some investors as a measure of performance. We caution readers that non-GAAP financial information, by its nature, departs from traditional accounting conventions. Accordingly, its use can make it difficult to compare current results with results from other reporting periods and with the financial results of other companies. We have provided a reconciliation of Adjusted EBITDA to the most directly comparable GAAP measures in the supplemental financial information attached to this press release.
Cautionary Note Regarding Forward-Looking Statements
This press release contains (and oral communications made by us may contain) ““forward-looking statements” within the meaning of the safe harbor provisions of the U.S. Private Securities Litigation Reform Act of 1995. Forward-looking statements can be identified by words such as “anticipate,” “believe,” “estimate,” “expect,” “intend,” “plan,” “predict,” “project,” “target,” “future,” “seek,” “likely,” “strategy,” “may,” “should,” “will” and similar references to future periods. Examples of forward-looking statements include, among others, statements we make regarding our outlook for the Company and statements that estimate or project future results of operations or the performance of the Company.
Forward-looking statements are neither historical facts nor assurances of future performance. Instead, they are based only on our current beliefs, expectations and assumptions regarding the future of our business, future plans and strategies, projections, anticipated events and trends, the economy and other future conditions. Because forward-looking statements relate to the future, they are subject to inherent uncertainties, risks and changes in circumstances that are difficult to predict and many of which are outside of our control. Our actual results and financial condition may differ materially from those indicated in the forward-looking statements. Therefore, you should not rely on any of these forward-looking statements. Important factors that could cause our actual results and financial condition to differ materially from those indicated in the forward-looking statements include, among others, the following:
a. the ability to design, produce, and distribute the creative product solutions required to retain existing customers and to attract new customers;
b. building and maintaining marketing and distribution functions sufficient to gain meaningful international market share for our products;
c. the ability to respond quickly with appropriate products after the adoption and introduction of new mobile devices by major manufacturers like Apple®, Samsung®, and Google®;
d. changes or delays in announced launch schedules for (or recalls or withdrawals of) new mobile devices by major manufacturers like Apple, Samsung, and Google;
e. the ability to successfully integrate new operations or acquisitions;
f. the impacts of inconsistent quality or reliability of new product offerings;
g. the impacts of lower profit margins in certain new and existing product categories, including certain mophie products;
h. the impacts of changes in global economic conditions, including on customer demand;
i. managing inventory in light of constantly shifting consumer demand;
j. the failure of information systems or technology solutions or the failure to secure information system data, failure to comply with privacy laws, security breaches, or the effect on the Company from cyber-attacks, terrorist incidents or the threat of terrorist incidents;
k. the impacts of increased tariffs and international trade disputes;
l. adoption of or changes in accounting policies, principles, or estimates; and
m. changes in tax laws and regulations.
Any forward-looking statement made by us in this press release speaks only as of the date on which such statement is made. New factors emerge from time to time and it is not possible for management to predict all such factors, nor can it assess the impact of any such factor on the business or the extent to which any factor, or combination of factors, may cause results to differ materially from those contained in any forward-looking statement. Readers should also review the risks and uncertainties listed in our most recent Annual Report on Form 10-K and other reports we file with the U.S. Securities and Exchange Commission, including (but not limited to) Item 1A - “Risk Factors” in the Form 10-K and Management's Discussion and Analysis of Financial Condition and Results of Operations and the risks described therein from time to time. We undertake no obligation to publicly update any forward-looking statement, whether written or oral, that may be made from time to time, whether as a result of new information, future developments
or otherwise. The forward-looking statements contained in this press release are intended to qualify for the safe harbor provisions of Section 27A of the Securities Act of 1933, as amended, and Section 21E of the Securities Exchange Act of 1934, as amended.
About ZAGG Inc
ZAGG Inc (NASDAQ:ZAGG) is a global leader in accessories and technologies that empower mobile lifestyles. The Company has an award-winning product portfolio that includes screen protection, mobile keyboards, power management solutions, social tech, and personal audio sold under the ZAGG®, mophie®, InvisibleShield®, IFROGZ® and BRAVEN® brands. ZAGG has operations in the United States, Ireland, and China. ZAGG products are available worldwide, and can be found at leading retailers including Best Buy, Verizon, AT&T, Sprint, Walmart, Target, Walgreens and Amazon.com. For more information, please visit the Company’s websites at www.zagg.com and www.mophie.com and follow us on Facebook, Twitter and Instagram.
# # #
CONTACT:
Investor Relations:
ICR Inc.
Brendon Frey
203-682-8216
brendon.frey@icrinc.com
Company:
ZAGG Inc
Jeff DuBois
801-506-7336
jeff.dubois@ZAGG.com
November 6, 2018
ZAGG Supplemental Financial Information - CFO Commentary
Document reference information
The commentary in this document can be referenced in the financial information found in the press release announcing the results of operations for the three and nine months ended September 30, 2018, including certain supplemental financial information, issued earlier today. The release can be found at investors.ZAGG.com, or in the Form 8-K furnished to the Securities and Exchange Commission website at sec.gov (the URLs are included here in this exhibit as inactive textual references and information contained on, or accessible through, our websites is not a part of, and is not incorporated by reference into, this report).
Three months ended September 30, 2018, and 2017 Summary Results
(In millions, except per share amounts)
| Three Months Ended | |||||||||||
| Summary of quarter-to-date financial results | September 30, 2018 | September 30, 2017 | |||||||||
| Net sales | $ | 141.1 | $ | 134.4 | |||||||
| Gross profit | $ | 52.2 | $ | 48.4 | |||||||
| Gross profit margin | 37 | % | 36 | % | |||||||
| Net income | $ | 14.6 | $ | 9.8 | |||||||
| Diluted earnings per share | $ | 0.51 | $ | 0.34 | |||||||
| Adjusted EBITDA | $ | 23.8 | $ | 22.4 | |||||||
| Diluted shares outstanding | 28.6 | 28.4 | |||||||||
| Three Months Ended | |||||||||||||||||||||||
| September 30, 2018 | September 30, 2017 | ||||||||||||||||||||||
| Net sales by category | (%) | ($) | (%) | ($) | |||||||||||||||||||
| Screen Protection | 63 | % | $ | 88.6 | 57 | % | $ | 76.3 | |||||||||||||||
| Power Management | 22 | % | $ | 31.2 | 19 | % | $ | 25.1 | |||||||||||||||
| Power Cases | 5 | % | $ | 6.6 | 12 | % | $ | 16.3 | |||||||||||||||
| Keyboards | 6 | % | $ | 7.9 | 5 | % | $ | 7.5 | |||||||||||||||
| Audio | 3 | % | $ | 4.3 | 6 | % | $ | 7.9 | |||||||||||||||
| Other | 1 | % | $ | 2.5 | 1 | % | $ | 1.3 | |||||||||||||||
| Three Months Ended | |||||||||||||||||||||||
| September 30, 2018 | September 30, 2017 | ||||||||||||||||||||||
| Net sales by channel | (%) | ($) | (%) | ($) | |||||||||||||||||||
| Indirect channel | 88 | % | $ | 123.9 | 90 | % | $ | 121.2 | |||||||||||||||
| Website | 7 | % | $ | 10.5 | 7 | % | $ | 9.1 | |||||||||||||||
| Franchisees | 5 | % | $ | 6.7 | 3 | % | $ | 4.1 | |||||||||||||||
| Three Months Ended | |||||||||||||||||||||||
| September 30, 2018 | September 30, 2017 | ||||||||||||||||||||||
| Net sales by region | (%) | ($) | (%) | ($) | |||||||||||||||||||
| Domestic | 85 | % | $ | 120.0 | 85 | % | $ | 114.0 | |||||||||||||||
| International | 15 | % | $ | 21.1 | 15 | % | $ | 20.4 | |||||||||||||||
2018 Third Quarter Results Discussion
(All comparisons are 2018 consolidated versus 2017 consolidated, unless otherwise noted)
Net sales
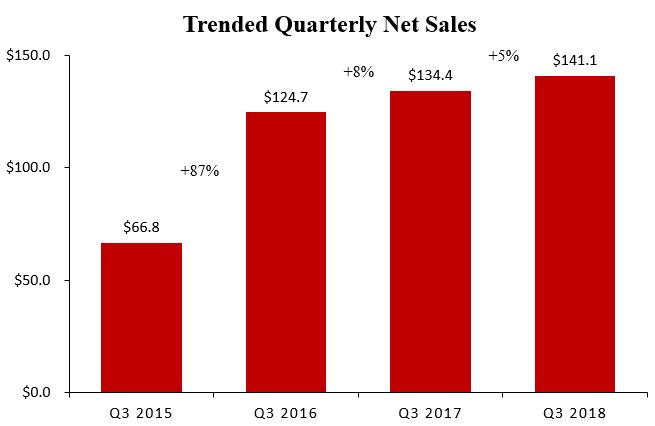
Net sales for the three months ended September 30, 2018, were $141.1 million, compared to net sales of $134.4 million for the three months ended September 30, 2017, an increase of $6.7 million, or approximately 5%. The $6.7 million increase in net sales was primarily attributable to (1) increased sales of screen protection products in key wireless and retail accounts driven by the new iPhone® launch as well as the introduction of the Glass + VisionGuard® screen protection products, and (2) the increase in sales of our power management products, specifically related to wireless charging accessories. These increases were partially offset by a decrease in sales of power cases and audio.
Gross profit
Gross profit for the three months ended September 30, 2018, was $52.2 million, or approximately 37% of net sales, an increase of $3.8 million or 8%, compared to gross profit of $48.4 million, or approximately 36% of net sales for the three months ended September 30, 2017. The increase in gross profit margin was primarily attributable to the mix of screen protection products, our highest margin product category, which increased to approximately 63% of net sales compared to approximately 57% of net sales during the three months ended September 30, 2017.
Operating expenses
Operating expenses for the three months ended September 30, 2018, were $33.9 million, compared to operating expenses of $32.5 million for the three months ended September 30, 2017, an increase of $1.4 million, or approximately 4%. The $1.4 million increase was primarily attributable to (1) increases in headcount to support additional growth of the Company, and (2) transaction costs incurred in connection with the acquisition of BRAVEN. These increases were partially offset by a decrease in depreciation expense resulting from lower carrying amounts of property and equipment during the three months ended September 30, 2018.
Net income
As a result of the factors noted above, we reported net income of $14.6 million, or diluted earnings per share of $0.51, for the three months ended September 30, 2018, compared to net income of $9.8 million, or diluted earnings per share of $0.34, for the three months ended September 30, 2017.
Adjusted EBITDA
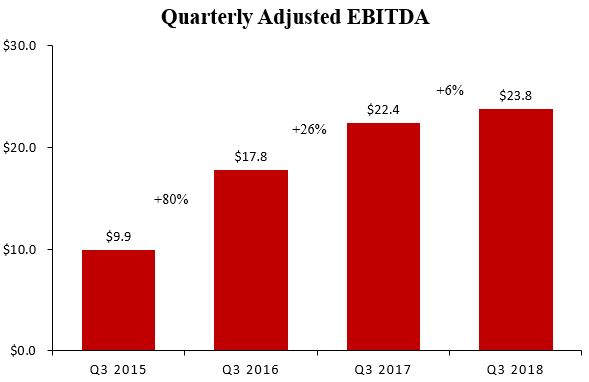
Adjusted EBITDA increased 6% to $23.8 million compared to $22.4 million.
Nine Months Ended September 30, 2018, and 2017 Summary Results
(In millions, except per share amounts)
| Nine Months Ended | |||||||||||
| Summary of year-to-date financial results | September 30, 2018 | September 30, 2017 | |||||||||
| Net sales | $ | 371.7 | $ | 342.6 | |||||||
| Gross profit | $ | 127.4 | $ | 112.8 | |||||||
| Gross profit margin | 34 | % | 33 | % | |||||||
| Net income | $ | 24.9 | $ | 7.0 | |||||||
| Diluted earnings per share | $ | 0.87 | $ | 0.25 | |||||||
| Adjusted EBITDA | $ | 48.3 | $ | 37.2 | |||||||
| Diluted shares outstanding | 28.6 | 28.2 | |||||||||
| Nine Months Ended | |||||||||||||||||||||||
| September 30, 2018 | September 30, 2017 | ||||||||||||||||||||||
| Net sales by category | (%) | ($) | (%) | ($) | |||||||||||||||||||
| Screen Protection | 56 | % | $ | 208.9 | 52 | % | $ | 178.0 | |||||||||||||||
| Power Management | 27 | % | $ | 99.7 | 18 | % | $ | 60.7 | |||||||||||||||
| Power Cases | 6 | % | $ | 22.0 | 18 | % | $ | 60.2 | |||||||||||||||
| Keyboards | 6 | % | $ | 21.1 | 6 | % | $ | 19.4 | |||||||||||||||
| Audio | 4 | % | $ | 15.4 | 6 | % | $ | 21.5 | |||||||||||||||
| Other | 1 | % | $ | 4.6 | 0 % | $ | 2.8 | ||||||||||||||||
| Nine Months Ended | |||||||||||||||||||||||
| September 30, 2018 | September 30, 2017 | ||||||||||||||||||||||
| Net sales by channel | (%) | ($) | (%) | ($) | |||||||||||||||||||
| Indirect channel | 88 | % | $ | 326.9 | 89 | % | $ | 303.9 | |||||||||||||||
| Website | 8 | % | $ | 29.4 | 8 | % | $ | 27.6 | |||||||||||||||
| Franchisees | 4 | % | $ | 15.4 | 3 | % | $ | 11.1 | |||||||||||||||
| Nine Months Ended | |||||||||||||||||||||||
| September 30, 2018 | September 30, 2017 | ||||||||||||||||||||||
| Net sales by region | (%) | ($) | (%) | ($) | |||||||||||||||||||
| Domestic | 84 | % | $ | 311.8 | 86 | % | $ | 293.9 | |||||||||||||||
| International | 16 | % | $ | 59.9 | 14 | % | $ | 48.7 | |||||||||||||||
2018 Year-to-Date Results Discussion
(All comparisons are 2018 consolidated versus 2017 consolidated, unless otherwise noted)
Net sales
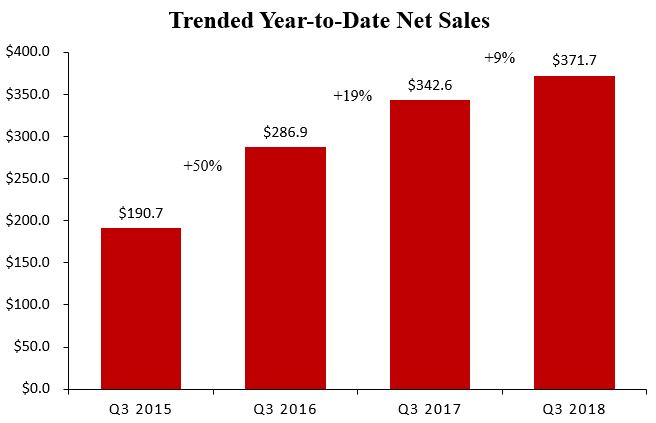
Net sales for the nine months ended September 30, 2018, were $371.7 million, compared to net sales of $342.6 million for the nine months ended September 30, 2017, an increase of $29.1 million, or approximately 9%. The $29.1 million increase in net sales was primarily attributable to (1) the increase in sales of our power management products, specifically related to wireless charging accessories, and (2) increases in screen protection products in key wireless and retail accounts driven by the new iPhone launch as well as the introduction of the Glass + VisionGuard screen protection products. These increases were partially offset by a decrease in sales of power cases and audio.
Gross profit
Gross profit for the nine months ended September 30, 2018, was $127.4 million, or approximately 34% of net sales, an increase of $14.6 million or 13%, compared to gross profit of $112.8 million, or approximately 33% of net sales for the nine months ended September 30, 2017. The increase in gross profit margin was primarily attributable to the mix of screen protection products, our highest margin product category, which increased to approximately 56% of net sales compared to approximately 52% of net sales for the nine months ended September 30, 2018.
Operating expenses
Operating expenses for the nine months ended September 30, 2018, were $96.1 million, compared to operating expenses of $98.0 million for the nine months ended September 30, 2017, a decrease of $1.9 million, or approximately 2%. The $1.9 million decrease was primarily attributable to (1) a decrease in depreciation expense resulting from lower carrying amounts of property and equipment during the nine months ended September 30, 2018, (2) a $2.0 million charge in 2017 related to the impairment of a patent that did not recur in 2018, and (3) operating expense synergies realized related to the mophie integration. These decreases in operating expense were partially offset by increases in headcount to support additional growth of the Company.
Net income
As a result of the factors noted above, we reported net income of $24.9 million, or diluted earnings per share of $0.87, for the nine months ended September 30, 2018, compared to net income of $7.0 million, or diluted earnings per share of $0.25, for the nine months ended September 30, 2017.
Adjusted EBITDA
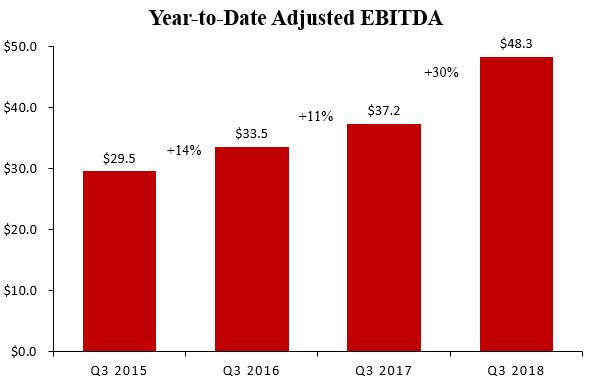
Adjusted EBITDA increased 30% to $48.3 million compared to $37.2 million.
Balance Sheet Highlights (as of September 30, 2018, December 31, 2017, and September 30, 2017)
| September 30, 2018 | December 31, 2017 | September 30, 2017 | |||||||||||||||
| Cash and cash equivalents | $ | 17.8 | $ | 25.0 | $ | 11.4 | |||||||||||
| Accounts receivable, net of allowances | $ | 115.8 | $ | 123.2 | $ | 96.8 | |||||||||||
| Inventories | $ | 78.7 | $ | 75.0 | $ | 72.0 | |||||||||||
| Total debt outstanding | $ | 28.0 | $ | 37.4 | $ | 31.7 | |||||||||||
| Line of credit | $ | 28.0 | $ | 23.5 | $ | 16.2 | |||||||||||
| Long-term debt | $ | — | $ | 13.9 | $ | 15.5 | |||||||||||
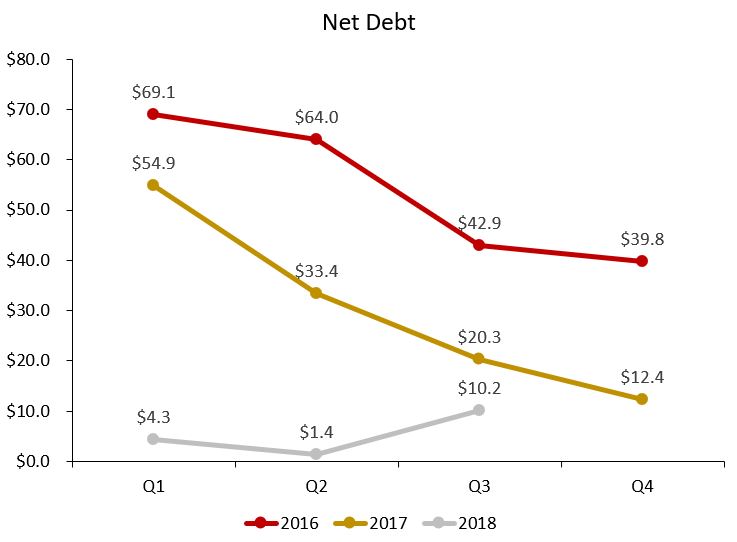
| Net debt (Total debt less cash) | $ | 10.2 | $ | 12.4 | $ | 20.3 | |||||||||||
| QTD Days sales outstanding (DSOs) | 76 | 64 | 66 | ||||||||||||||
| Inventory turns* | 7.0x | 6.9x | 6.8x | ||||||||||||||
* Inventory turns defined as trailing 12-month sales divided by period-end inventory.
Debt
The Company has effectively managed its outstanding debt balance. As of September 30, 2018, the net debt balance (total debt less cash) decreased to $10.2 million from $12.4 million as of December 31, 2017. The increase in the net debt balance in the third quarter of 2018 compared to the second quarter of 2018 was due to the acquisition of BRAVEN and share repurchases.
Market Share Information
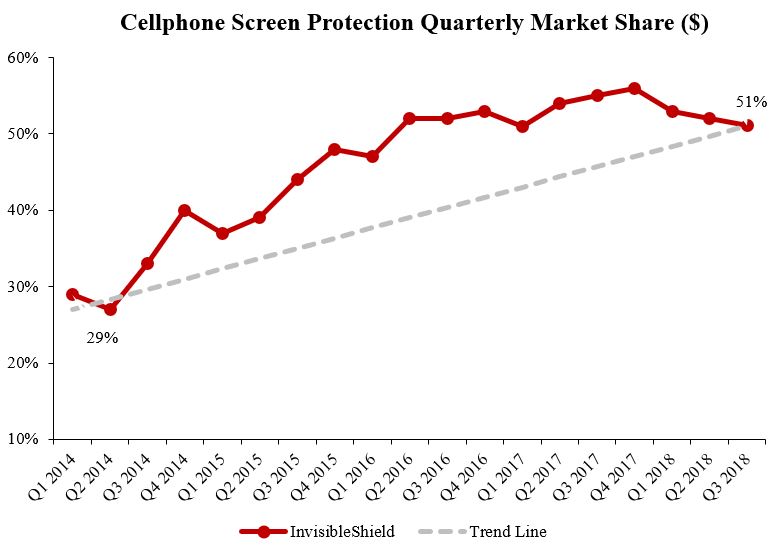
Screen Protection
The Company continues to see strong and consistent growth in cellphone screen protection market share. From the first quarter of 2014 to the third quarter of 2018, InvisibleShield cellphone screen protection quarterly dollar market share has increased from 29% to 51%.
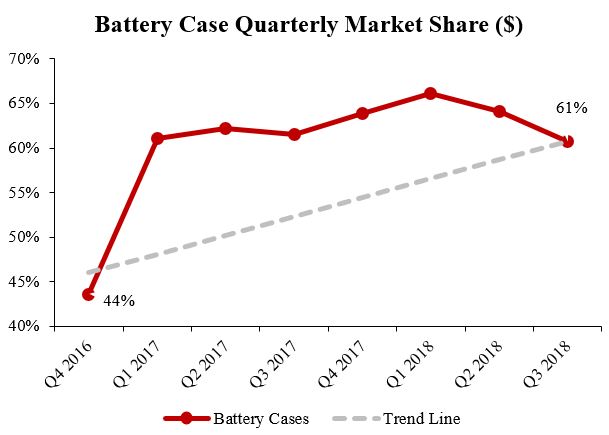
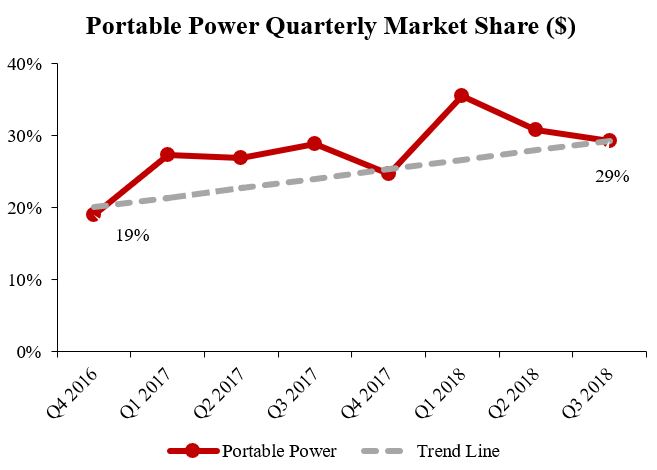
Battery Cases & Power Management
Since the fourth quarter of 2016, mophie branded battery cases and portable power packs have experienced significant growth in dollar market share due to a combination of (1) new and innovative product launches and (2) an unconstrained mophie supply chain.
Quarterly battery case dollar market share increased from 44% to 61% from fourth quarter 2016 to third quarter 2018.
Portable power dollar market share increased from 19% to 29% from fourth quarter 2016 to third quarter 2018.
2018 Business Outlook
The Company updated its annual guidance for 2018 as follows:
• Due to the delay in the juice pack® certification, net sales of approximately $535 million
• Gross profit margin as a percentage of net sales in the low to mid 30's range
• Adjusted EBITDA at the low end of the current range of $77 million to $80 million
• Diluted earnings per share of $1.30 to $1.40
• Annual effective tax rate of approximately 24% compared to approximately 25% in the last annual business outlook
About Non-GAAP Financial Information
This Supplemental Financial Information - CFO Commentary (“CFO Commentary”) includes Adjusted EBITDA as a non-GAAP financial measure. Readers are cautioned that Adjusted EBITDA (earnings before interest, taxes, depreciation, amortization, stock-based compensation expense, other expense, transaction costs, mophie restructuring charges, mophie employee retention bonus, consulting fee to former CEO, inventory step-up amount in conjunction with the BRAVEN Acquisition, and impairment of intangible asset) is not a financial measure under U.S. generally accepted accounting principles (“GAAP”). In addition, this financial information should not be construed as an alternative to any other measure of performance determined in accordance with GAAP, or as an indicator of operating performance, liquidity or cash flows generated by operating, investing and financing activities, is as there may be significant factors or trends that it fails to address. As such, it should be read only in conjunction with our consolidated financial statements prepared in accordance with GAAP. We present Adjusted EBITDA because we believe that it is helpful to some investors as a measure of performance. We caution readers that non-GAAP financial information, by its nature, departs from traditional accounting conventions. Accordingly, its use can make it difficult to compare current results with results from other reporting periods and with the financial results of other companies. We have provided a reconciliation of Adjusted EBITDA to the most directly comparable GAAP measures in the supplemental financial information attached to the press release to which this CFO Commentary is also attached.
Cautionary Note Regarding Forward-Looking Statements
This CFO Commentary contains (and oral communications made by us may contain) “forward-looking statements” within the meaning of the safe harbor provisions of the U.S. Private Securities Litigation Reform Act of 1995. Forward-looking statements can be identified by words such as “anticipate,” “believe,” “estimate,” “expect,” “intend,” “plan,” “predict,” “project,” “target,” “future,” “seek,” “likely,” “strategy,” “may,” “should,” “will” and similar references to future periods. Examples of forward-looking statements include, among others, statements we make regarding our outlook for the Company and statements that estimate or project future results of operations or the performance of the Company.
Forward-looking statements are neither historical facts nor assurances of future performance. Instead, they are based only on our current beliefs, expectations and assumptions regarding the future of our business, future plans and strategies, projections, anticipated events and trends, the economy and other future conditions. Because forward-looking statements relate to the future, they are subject to inherent uncertainties, risks and changes in circumstances that are difficult to predict and many of which are outside of our control. Our actual results and financial condition may differ materially from those indicated in the forward-looking statements. Therefore, you should not rely on any of these forward-looking statements. Important factors that could cause our actual results and financial condition to differ materially from those indicated in the forward-looking statements include, among others, the following:
a. the ability to design, produce, and distribute the creative product solutions required to retain existing customers and to attract new customers;
b. building and maintaining marketing and distribution functions sufficient to gain meaningful international market share for our products;
c. the ability to respond quickly with appropriate products after the adoption and introduction of new mobile devices by major manufacturers like Apple®, Samsung®, and Google®;
d. changes or delays in announced launch schedules for (or recalls or withdrawals of) new mobile devices by major manufacturers like Apple, Samsung, and Google;
e. the ability to successfully integrate new operations or acquisitions;
f. the impacts of inconsistent quality or reliability of new product offerings;
g. the impacts of lower profit margins in certain new and existing product categories, including certain mophie products;
h. the impacts of changes in global economic conditions, including on customer demand;
i. managing inventory in light of constantly shifting consumer demand;
j. the failure of information systems or technology solutions or the failure to secure information system data, failure to comply with privacy laws, security breaches, or the effect on the Company from cyber-attacks, terrorist incidents or the threat of terrorist incidents;
k. the impacts of increased tariffs and international trade disputes;
l. adoption of or changes in accounting policies, principles, or estimates; and
m. changes in tax laws and regulations.
Any forward-looking statement made by us in this CFO Commentary speaks only as of the date on which such statement is made. New factors emerge from time to time and it is not possible for management to predict all such factors, nor can it assess the impact of any such factor on the business or the extent to which any factor, or combination of factors, may cause results to differ materially from those contained in any forward-looking statement. Readers should also review the risks and uncertainties listed in our most recent Annual Report on Form 10-K and other reports we file with the U.S. Securities and Exchange Commission, including (but not limited to) Item 1A - “Risk Factors” in the Form 10-K and Management's Discussion and Analysis of Financial Condition and Results of Operations and the risks described therein from time to time. We undertake no obligation to publicly update any forward-looking statement, whether written or oral, that may be made from time to time, whether as a result of new information, future developments or otherwise. The forward-looking statements contained in this CFO Commentary are intended to qualify for the safe harbor provisions of Section 27A of the Securities Act of 1933, as amended, and Section 21E of the Securities Exchange Act of 1934, as amended.