
Form 8-K PACIFIC GAS & ELECTRIC For: Nov 05 Filed by: PG&E Corp
UNITED STATES
SECURITIES AND EXCHANGE COMMISSION
Washington, D.C. 20549
FORM 8-K
CURRENT REPORT
Pursuant to Section 13 or 15(d) of the Securities Exchange Act of 1934
Date of Report: November 5, 2018
(Date of earliest event reported)
| Commission |
Exact Name of Registrant as specified in its charter |
State or Other Jurisdiction of Incorporation or Organization |
IRS Employer | |||
| 1-12609 |
PG&E CORPORATION |
California | 94-3234914 | |||
| 1-2348 |
PACIFIC GAS AND ELECTRIC COMPANY |
California | 94-0742640 |

|

| |
| 77 Beale Street P.O. Box 770000 San Francisco, California 94177 (Address of principal executive offices) (Zip Code) (415) 973-1000 (Registrant’s telephone number, including area code) |
77 Beale Street P.O. Box 770000 San Francisco, California 94177 (Address of principal executive offices) (Zip Code) (415) 973-7000 (Registrant’s telephone number, including area code) |
Check the appropriate box below if the Form 8-K filing is intended to simultaneously satisfy the filing obligation of the registrant under any of the following provisions (see General Instruction A.2. below):
☐ Written communications pursuant to Rule 425 under the Securities Act (17 CFR 230.425)
☐ Soliciting material pursuant to Rule 14a-12 under the Exchange Act (17 CFR 240.14a-12)
☐ Pre-commencement communications pursuant to Rule 14d-2(b) under the Exchange Act (17 CFR 240.14d-2(b)
☐ Pre-commencement communications pursuant to Rule 13e-4(c) under the Exchange Act (17 CFR 240.13e-4(c))
Indicate by check mark whether the registrant is an emerging growth company as defined in Rule 405 of the Securities Act of 1933 (§230.405 of this chapter) or Rule 12b-2 of the Securities Exchange Act of 1934 (§240.12b-2 of this chapter).
|
Emerging growth company |
PG&E Corporation |
☐ | ||
|
Emerging growth company |
Pacific Gas and Electric Company |
☐ |
If an emerging growth company, indicate by check mark if the registrant has elected not to use the extended transition period for complying with any new or revised financial accounting standards provided pursuant to Section 13(a) of the Exchange Act.
| PG&E Corporation | ☐ | |
| Pacific Gas and Electric Company | ☐ |
Item 2.02 Results of Operations and Financial Condition
On November 5, 2018, PG&E Corporation will post on its website an earnings announcement disclosing its financial results and the financial results of its subsidiary, Pacific Gas and Electric Company (the “Utility”), for the quarter ended September 30, 2018. The earnings announcement is attached as Exhibit 99.1 to this report. PG&E Corporation also will hold a webcast conference call to discuss financial results and management’s business outlook. The earnings announcement contains information about how to access the webcast. The slide presentation, which includes supplemental information relating to PG&E Corporation and the Utility, will be used by management during the webcast and is attached as Exhibit 99.2 to this report. The Exhibits will be posted on PG&E Corporation’s website at http://investor.pgecorp.com.
The information included in this Current Report on Form 8-K is being furnished, and shall not be deemed to be “filed” for purposes of Section 18 of the Securities Exchange Act of 1934, as amended (the “Exchange Act”), or otherwise subject to the liabilities of that section, nor shall it be deemed to be incorporated by reference in any filing under the Securities Act of 1933, as amended (the “Securities Act”).
Item 7.01 Regulation FD Disclosure
Exhibits
The information included in the Exhibits to this report is incorporated by reference in response to this Item 7.01, is being “furnished” and shall not be deemed to be “filed” for purposes of Section 18 of the Exchange Act or otherwise subject to the liabilities of that section, nor shall it be deemed to be incorporated by reference in any filing under the Securities Act.
Public Dissemination of Certain Information
PG&E Corporation and the Utility routinely provide links to the Utility’s principal regulatory proceedings before the California Public Utilities Commission (“CPUC”) and the Federal Energy Regulatory Commission (“FERC”) at http://investor.pgecorp.com, under the “Regulatory Filings” tab, so that such filings are available to investors upon filing with the relevant agency. PG&E Corporation and the Utility also routinely post or provide direct links to presentations, documents, and other information that may be of interest to investors at http://investor.pgecorp.com, under the “News & Events: Events & Presentations” tab and links to certain documents and information related to the Northern California wildfires and the Butte fire which may be of interest to investors, at http://investor.pgecorp.com, under the “Wildfire Updates” tab, in order to publicly disseminate such information. It is possible that any of these filings or information included therein could be deemed to be material information. The information contained on such website is not part of this or any other report that PG&E Corporation or the Utility files with, or furnishes to, the Securities and Exchange Commission.
Item 9.01 Financial Statements and Exhibits
Exhibits
The following Exhibits are being furnished, and are not deemed to be filed:
| Exhibit 99.1 | PG&E Corporation earnings announcement dated November 5, 2018 | |
| Exhibit 99.2 | Slide presentation relating to webcast conference call | |
SIGNATURES
Pursuant to the requirements of the Securities Exchange Act of 1934, the registrants have duly caused this report to be signed on their behalf by the undersigned thereunto duly authorized.
| PG&E CORPORATION | ||||||
| By: | /s/ David S. Thomason | |||||
| Dated: November 5, 2018 |
David S. Thomason Vice President and Controller | |||||
| PACIFIC GAS AND ELECTRIC COMPANY | ||||||
| By: | /s/ David S. Thomason | |||||
| Dated: November 5, 2018 | David S. Thomason Vice President, Chief Financial Officer and Controller | |||||
Exhibit 99.1

Investor Relations Contact: 415.972.7080 | Media Inquiries Contact: 415.973.5930 | www.pgecorp.com
November 5, 2018
PG&E Corporation Reports Third-Quarter 2018 Financial Results
| ◾ | GAAP earnings were $1.09 per share for the third quarter of 2018, compared to $1.07 per share for the same period in 2017. |
| ◾ | Non-GAAP earnings from operations were $1.13 per share for the third quarter of 2018, compared to $1.12 per share for the same period in 2017. |
San Francisco, Calif. — PG&E Corporation’s (NYSE: PCG) recorded third-quarter 2018 net income available to common shareholders was $564 million, or $1.09 per share, as reported in accordance with generally accepted accounting principles (GAAP). This compares with net income available to common shareholders of $550 million, or $1.07 per share, for the third quarter of 2017.
GAAP results include items that management does not consider part of normal, ongoing operations (items impacting comparability), which totaled $18 million after-tax, or $0.04 per share, for the quarter. This was primarily driven by legal and other costs, net of probable insurance recoveries, related to the Northern California wildfires. This was partially offset by a reduction in gas-related capital disallowance estimates. Items impacting comparability for the quarter also include legal costs related to the Butte fire and costs to clear pipeline rights-of-way.
“Driven by the growing threat posed by extreme weather, PG&E is making critical investments and further enhancing our operations so that our communities are safer and more resilient. We are committed to helping meet California’s climate challenges while continuing to invest in a sustainable energy future for all of our customers,” said PG&E Corporation CEO and President Geisha Williams.
In recent months, PG&E’s work to further reduce the risk of wildfires and address public safety has included the following actions:
| ● | Creating even greater safety clearances between trees and power lines in neighborhoods that face the most extreme wildfire threat to reduce the risk of vegetation coming into contact with lines; |
| ● | Continued installation of additional weather stations and early fire detection cameras to have better situational awareness of where extreme wildfire danger could occur; and |
| ● | Proactively turning off power for safety in certain communities in the North Bay and Sierra Foothills before forecasted extreme weather in October. |
Among recent legislative and regulatory developments:
| ● | California lawmakers passed important wildfire policy reforms as outlined in Senate Bill 901. A series of upcoming regulatory filings, including PG&E’s 2020 General Rate Case, will lay out the company’s wildfire risk management programs in detail. |
| ● | The California Public Utilities Commission (CPUC) approved a revised Power Charge Indifference Adjustment for customers who choose Community Choice Aggregation programs, reducing the cost-shift to remaining bundled utility customers. |
Non-GAAP Earnings from Operations
PG&E Corporation’s non-GAAP earnings from operations, which exclude items impacting comparability (IIC), were $582 million, or $1.13 per share, in the third quarter of 2018, compared with $578 million, or $1.12 per share, during the same period in 2017.
The increase in quarter-over-quarter non-GAAP earnings from operations was primarily driven by growth in rate base earnings and probable cost recoveries of insurance premiums incurred in 2018 above amounts included in authorized revenue requirements, partially offset by the timing of operational spend in 2017.
PG&E Corporation discloses historical financial results based on “non-GAAP earnings from operations,” which is a non-GAAP financial measure, in order to provide a measure that allows investors to compare the underlying financial performance of the business from one period to another, exclusive of items impacting comparability. See the accompanying tables for a reconciliation of non-GAAP earnings from operations to consolidated income available for common shareholders.
IIC Guidance
PG&E Corporation is not providing at this time guidance for 2018 GAAP earnings and non-GAAP earnings from operations due to the uncertainty related to the Northern California wildfires. The company is providing 2018 IIC guidance of $1.65 billion to $1.82 billion after-tax for costs related to 14 of the Northern California wildfires, net of insurance, costs related to the Butte fire, net of contractor insurance, costs to clear pipeline rights-of-way, a reduction to gas-related capital disallowance estimates, and probable cost recoveries of insurance premiums incurred in 2017 above amounts included in authorized revenue requirements.
IIC guidance is based on various assumptions and forecasts related to future expenses and certain other factors.
Supplemental Financial Information
In addition to the financial information accompanying this release, presentation slides for today’s conference call with the financial community have been furnished to the Securities and Exchange Commission (SEC) and are available on PG&E Corporation’s website at:
http://investor.pgecorp.com/financials/quarterly-earnings-reports/default.aspx.
Public Dissemination of Certain Information
PG&E Corporation and Pacific Gas and Electric Company (Utility) routinely provide links to the Utility’s principal regulatory proceedings with the California Public Utilities Commission (CPUC) and the Federal Energy Regulatory Commission (FERC) at http://investor.pgecorp.com, under the “Regulatory Filings” tab, so that such filings are available to investors upon filing with the relevant agency. PG&E Corporation and the Utility also routinely post, or provide direct links to, presentations, documents, and other information that may be of interest to investors at http://investor.pgecorp.com, under the “Wildfire Updates” and “News & Events: Events & Presentations” tabs, respectively, in order to publicly disseminate such information. It is possible that any of these filings or information included therein could be deemed to be material information.
Conference Call with the Financial Community to Discuss Financial Results
Today’s call at 12:00 p.m. Eastern Time, is open to the public on a listen-only basis via webcast. Please visit http://investor.pgecorp.com/news-events/events-and-presentations/default.aspx for more information and instructions for accessing the webcast. The webcast call and the related materials will be available for replay through the website for at least one year. Alternatively, a toll-free replay of the conference call may be accessed shortly after the live call through November 19, 2018, by dialing (800) 585-8367.
International callers may dial (416) 621-4642. For both domestic and international callers, the confirmation code 7077354 will be required to access the replay.
About PG&E Corporation
PG&E Corporation (NYSE: PCG) is a Fortune 200 energy-based holding company, headquartered in San Francisco. It is the parent company of Pacific Gas and Electric Company, an energy company that serves 16 million Californians across a 70,000-square-mile service area in Northern and Central California. For more information, visit http://www.pgecorp.com. In this press release, they are together referred to as “PG&E.”
Forward-Looking Statements
This press release contains statements regarding current expectations, objectives and assumptions for future periods, including PG&E Corporation’s 2018 IIC guidance. These statements and other statements that are not purely historical constitute forward-looking statements that are necessarily subject to various risks and uncertainties. Actual results may differ materially from those described in forward-looking statements. Factors that could cause actual results to differ materially include, but are not limited to:
| ● | the impact of the Northern California wildfires, including whether the Utility will be able to timely recover costs incurred in connection thereto in excess of the Utility’s currently authorized revenue requirements; the timing and outcome of the remaining wildfire investigations and the extent to which the Utility will have liability associated with these fires; the timing and amount of insurance recoveries; and potential liabilities in connection with fines or penalties that could be imposed on the Utility if the CPUC or any other law enforcement agency were to bring an enforcement action and determined that the Utility failed to comply with applicable laws and regulations; |
| ● | the timing and outcome of the Butte fire litigation and of any proceeding to recover costs in excess of insurance through regulatory mechanisms and the timing of such recovery; and whether additional investigations and proceedings in connection with the Butte fire will be opened and any additional fines or penalties imposed on the Utility; |
| ● | whether PG&E Corporation and the Utility are able to successfully challenge the application of the doctrine of inverse condemnation to investor-owned utilities; |
| ● | whether the Utility will be able to obtain full recovery of its significantly increased insurance premiums, and the timing of any such recovery; |
| ● | whether the Utility can obtain wildfire insurance at a reasonable cost in the future, or at all, and whether insurance coverage is adequate for future losses or claims; |
| ● | the timing and outcome of any CPUC decision related to the Utility’s March 30, 2018 submissions in connection with the impact of the Tax Cuts and Jobs Act of 2017 on the Utility’s rate cases, and its implementation plan; |
| ● | the timing and outcomes of the 2019 GT&S rate case, 2020 GRC, FERC TO18, TO19, and TO20 rate cases, 2018 CEMA, WEMA, FHPMA, future cost of capital proceeding, and other ratemaking and regulatory proceedings; |
| ● | the timing and outcome of future regulatory and legislative developments in connection with SB 901, including the customer harm threshold in connection with the Northern California wildfires, and future wildfire reforms; |
| ● | the ability of PG&E Corporation and the Utility to access capital markets and other sources of financing in a timely manner on acceptable terms; |
| ● | further credit ratings downgrades that could, among other things, result in higher borrowing costs, fewer financing options, and additional collateral posting, especially if PG&E Corporation’s or the Utility’s credit ratings were to fall below investment grade; |
| ● | the cost of the Utility’s community wildfire safety program, and the timing and outcome of any proceeding to recover such cost through rates; |
| ● | the timing and outcomes of phase two of the ex parte order instituting investigation (OII) and of the safety culture OII; |
| ● | the Utility’s ability to efficiently manage capital expenditures and its operating and maintenance expenses within the authorized levels of spending and timely recover its costs through rates, and the extent to which the Utility incurs unrecoverable costs that are higher than the forecasts of such costs; |
| ● | the outcome of the probation and the monitorship, the timing and outcomes of the debarment proceeding, the Safety and Enforcement Division’s (SED) unresolved enforcement matters relating to the Utility’s compliance with natural gas-related laws and regulations, and other investigations that have been or may be commenced, and the ultimate amount of fines, penalties, and remedial and other costs that the Utility may incur as a result; and |
| ● | the other factors disclosed in PG&E Corporation and the Utility’s joint annual report on Form 10-K for the year ended December 31, 2017, their joint quarterly reports on Form 10-Q for the quarters ended March 31, 2018, June 30, 2018 and September 30, 2018, respectively, and other reports filed with the SEC, which are available on PG&E Corporation’s website at www.pgecorp.com and on the SEC website at www.sec.gov. |
PG&E CORPORATION
CONDENSED CONSOLIDATED STATEMENTS OF INCOME
| (Unaudited) | ||||||||||||||||
| Three Months Ended September 30, |
Nine Months Ended September 30, | |||||||||||||||
| (in millions, except per share amounts) | 2018 | 2017 | 2018 | 2017 | ||||||||||||
| Operating Revenues | ||||||||||||||||
| Electric |
$ | 3,466 | $ | 3,648 | $ | 9,729 | $ | 10,036 | ||||||||
| Natural gas |
915 | 869 | 2,942 | 2,999 | ||||||||||||
|
|
|
|
|
|
|
|
|
|
|
|
| |||||
| Total operating revenues |
4,381 | 4,517 | 12,671 | 13,035 | ||||||||||||
|
|
|
|
|
|
|
|
|
|
|
|
| |||||
| Operating Expenses |
||||||||||||||||
| Cost of electricity |
1,256 | 1,466 | 3,038 | 3,436 | ||||||||||||
| Cost of natural gas |
69 | 78 | 437 | 524 | ||||||||||||
| Operating and maintenance |
1,611 | 1,324 | 5,001 | 4,453 | ||||||||||||
| Wildfire-related claims, net of insurance recoveries |
(10 | ) | 53 | 2,108 | — | |||||||||||
| Depreciation, amortization, and decommissioning |
759 | 710 | 2,257 | 2,134 | ||||||||||||
|
|
|
|
|
|
|
|
|
|
|
|
| |||||
| Total operating expenses |
3,685 | 3,631 | 12,841 | 10,547 | ||||||||||||
|
|
|
|
|
|
|
|
|
|
|
|
| |||||
| Operating Income (Loss) |
696 | 886 | (170 | ) | 2,488 | |||||||||||
| Interest income |
14 | 9 | 35 | 22 | ||||||||||||
| Interest expense |
(232 | ) | (220 | ) | (678 | ) | (663 | ) | ||||||||
| Other income, net |
104 | 38 | 318 | 98 | ||||||||||||
|
|
|
|
|
|
|
|
|
|
|
|
| |||||
| Income (Loss) Before Income Taxes |
582 | 713 | (495 | ) | 1,945 | |||||||||||
| Income tax provision (benefit) |
15 | 160 | (527 | ) | 403 | |||||||||||
|
|
|
|
|
|
|
|
|
|
|
|
| |||||
| Net Income |
567 | 553 | 32 | 1,542 | ||||||||||||
| Preferred stock dividend requirement of subsidiary |
3 | 3 | 10 | 10 | ||||||||||||
|
|
|
|
|
|
|
|
|
|
|
|
| |||||
| Income Available for Common Shareholders |
$ | 564 | $ | 550 | $ | 22 | $ | 1,532 | ||||||||
|
|
|
|
|
|
|
|
|
|
|
|
| |||||
| Weighted Average Common Shares Outstanding, Basic |
517 | 513 | 516 | 511 | ||||||||||||
|
|
|
|
|
|
|
|
|
|
|
|
| |||||
| Weighted Average Common Shares Outstanding, Diluted |
517 | 516 | 517 | 514 | ||||||||||||
|
|
|
|
|
|
|
|
|
|
|
|
| |||||
| Net Earnings Per Common Share, Basic |
$ | 1.09 | $ | 1.07 | $ | 0.04 | $ | 3.00 | ||||||||
|
|
|
|
|
|
|
|
|
|
|
|
| |||||
| Net Earnings Per Common Share, Diluted |
$ | 1.09 | $ | 1.07 | $ | 0.04 | $ | 2.98 | ||||||||
|
|
|
|
|
|
|
|
|
|
|
|
| |||||
Reconciliation of PG&E Corporation’s Consolidated Income Available for Common Shareholders in Accordance with
Generally Accepted Accounting Principles (“GAAP”) to Non-GAAP Earnings from Operations
Third Quarter and Year to Date, 2018 vs. 2017
(in millions, except per share amounts)
| Three Months Ended September 30, |
Nine Months Ended September 30, | |||||||||||||||||||||||||||||||
| (in millions, except per share amounts) | Earnings | Earnings per Common Share (Diluted) |
Earnings | Earnings per Common Share (Diluted) | ||||||||||||||||||||||||||||
| 2018 | 2017 | 2018 | 2017 | 2018 | 2017 | 2018 | 2017 | |||||||||||||||||||||||||
| PG&E Corporation’s Earnings on a GAAP basis |
$ | 564 | $ | 550 | $ | 1.09 | $ | 1.07 | $ | 22 | $ | 1,532 | $ | 0.04 | $ | 2.98 | ||||||||||||||||
| Items Impacting Comparability: (1) | ||||||||||||||||||||||||||||||||
| Northern California wildfire-related costs, net of insurance (2) | 31 | — | 0.06 | — | 1,639 | — | 3.17 | — | ||||||||||||||||||||||||
| Pipeline-related expenses (3) | 9 | 12 | 0.02 | 0.02 | 25 | 45 | 0.05 | 0.09 | ||||||||||||||||||||||||
| Butte fire-related costs, net of insurance (4) | 6 | 42 | 0.01 | 0.08 | 17 | 27 | 0.03 | 0.05 | ||||||||||||||||||||||||
| Reduction in gas-related capital disallowances (5) | (27 | ) | — | (0.05 | ) | — | (27 | ) | — | (0.05 | ) | — | ||||||||||||||||||||
| 2017 insurance premium cost recoveries (6) | — | — | — | — | (23 | ) | — | (0.05 | ) | — | ||||||||||||||||||||||
| Fines and penalties (7) | — | 11 | — | 0.02 | — | 47 | — | 0.09 | ||||||||||||||||||||||||
| Diablo Canyon settlement-related disallowance (8) | — | — | — | — | — | 32 | — | 0.06 | ||||||||||||||||||||||||
| Legal and regulatory-related expenses (9) | — | 1 | — | — | — | 5 | — | 0.01 | ||||||||||||||||||||||||
| GT&S revenue timing impact (10) | — | — | — | — | — | (88 | ) | — | (0.17 | ) | ||||||||||||||||||||||
| Net benefit from derivative litigation settlement (11) | (38 | ) | (0.07 | ) | (38 | ) | (0.07 | ) | ||||||||||||||||||||||||
|
|
|
|
|
|
|
|
|
|
|
|
|
|
|
|
|
|
|
|
|
|
|
|
| |||||||||
| PG&E Corporation’s Non- GAAP Earnings from Operations (12) |
$ | 582 | $ | 578 | $ | 1.13 | $ | 1.12 | $ | 1,652 | $ | 1,562 | $ | 3.19 | $ | 3.04 | ||||||||||||||||
|
|
|
|
|
|
|
|
|
|
|
|
|
|
|
|
|
|
|
|
|
|
|
|
| |||||||||
All amounts presented in the table above are tax adjusted at PG&E Corporation’s statutory tax rate of 27.98 percent for 2018 and 40.75 percent for 2017, except for certain fines and penalties in 2017. Amounts may not sum due to rounding.
| (1) | “Items impacting comparability” represent items that management does not consider part of the normal course of operations and affect comparability of financial results between periods. See Use of Non-GAAP Financial Measures. |
| (2) | The Utility incurred costs, net of insurance, of $43 million (before the tax impact of $12 million) and $2.3 billion (before the tax impact of $637 million) during the three and nine months ended September 30, 2018, respectively, associated with the Northern California wildfires. This includes accrued charges of $2.5 billion (before the tax impact of $700 million) during the nine months ended September 30, 2018, related to estimated third-party claims in connection with 14 of the Northern California wildfires. The Utility also recorded $53 million (before the tax impact of $15 million) and $120 million (before the tax impact of $34 million) during the three and nine months ended September 30, 2018, respectively for legal and other costs. In addition, the Utility incurred costs of $40 million (before the tax impact of $11 million) during the nine months ended September 30, 2018 for Utility clean-up and repair costs. These costs were partially offset by $10 million (before the tax impact of $3 million) and $385 million (before the tax impact of $108 million) recorded during the three and nine months ended September 30, 2018, respectively, for probable insurance recoveries. |
| (in millions, pre-tax) | Three Months Ended September 30, 2018 |
Nine Months Ended September 30, 2018 | ||||||
| Third-party claims |
$ | — | $ | 2,500 | ||||
| Legal and other costs |
53 | 120 | ||||||
| Utility clean-up and repair costs |
— | 40 | ||||||
| Insurance recoveries |
(10 | ) | (385 | ) | ||||
|
|
|
|
|
|
| |||
| Northern California wildfire-related costs, net of insurance |
$ | 43 | $ | 2,275 | ||||
|
|
|
|
|
|
| |||
| (3) | The Utility incurred costs of $13 million (before the tax impact of $4 million) and $35 million (before the tax impact of $10 million) during the three and nine months ended September 30, 2018, respectively, for pipeline-related expenses incurred in connection with the multi-year effort to identify and remove encroachments from transmission pipeline rights-of-way. |
| (4) | The Utility incurred costs, net of insurance, of $9 million (before the tax impact of $3 million) and $24 million (before the tax impact of $7 million) during the three and nine months ended September 30, 2018, respectively, associated with legal costs for the Butte fire. These costs were partially offset by $7 million (before the tax impact of $2 million) recorded during the nine months ended September 30, 2018 for contractor insurance recoveries. |
| (in millions, pre-tax) | Three Months Ended September 30, 2018 |
Nine Months Ended September 30, 2018 | ||||||
| Legal costs |
$ | 9 | $ | 31 | ||||
| Insurance recoveries |
— | (7 | ) | |||||
|
|
|
|
|
|
| |||
| Butte fire-related costs, net of insurance |
$ | 9 | $ | 24 | ||||
|
|
|
|
|
|
| |||
| (5) | The Utility reduced the estimated disallowance for gas-related capital costs that were expected to exceed authorized amounts by $38 million (before the tax impact of $11 million) during the three and nine months ended September 30, 2018. The Utility had previously recorded $85 million (before the tax impact of $35 million) in 2016 for probable capital disallowances in the 2015 Gas Transmission and Storage (“GT&S”) rate case. From 2012 through 2014, the Utility had recorded cumulative charges of $665 million (before the tax impact of $271 million) for disallowed Pipeline Safety Enhancement Plan- (“PSEP”) related capital expenditures. |
| (6) | As a result of the California Public Utilities Commission’s (“CPUC”) June 2018 decision authorizing a Wildfire Expense Memorandum Account (“WEMA”), the Utility recorded $32 million (before the tax impact of $9 million) during the nine months ended September 30, 2018 for probable cost recoveries of insurance premiums incurred in 2017 above amounts included in authorized revenue requirements. |
| (7) | The Utility incurred costs of $11 million (not tax deductible) and $71 million (before the tax impact of $24 million) during the nine months ended September 30, 2017, respectively, for fines and penalties. This included disallowed expenses of $32 million (before the tax impact of $13 million) during the nine months ended September 30, 2017, associated with safety-related cost disallowances imposed by the CPUC in its April 9, 2015 decision (“San Bruno Penalty Decision”) in the gas transmission pipeline investigations. The Utility also recorded $15 million (before the tax impact of $6 million) during the nine months ended September 30, 2017, for disallowances imposed by the CPUC in its final phase two decision of the 2015 GT&S rate case for prohibited ex parte communications. In addition, the Utility recorded $11 million (not tax deductible) and $24 million (before the tax impact of $5 million) during the nine months ended September 30, 2017, for financial remedies in connection with the settlement filed with the CPUC on March 28, 2017, related to the order instituting investigation into compliance with ex parte communication rules. |
| (8) | The Utility recorded a disallowance of $47 million (before the tax impact of $15 million) during the nine months ended September 30, 2017, comprised of cancelled projects of $24 million (before the tax impact of $6 million) and disallowed license renewal costs of $23 million (before the tax impact of $9 million), as a result of the settlement agreement submitted to the CPUC in connection with the Utility’s joint proposal to retire the Diablo Canyon Power Plant. |
| (9) | The Utility incurred costs of $2 million (before the tax impact of $1 million) and $9 million (before the tax impact of $4 million) during the three and nine months ended September 30, 2017, respectively, for legal and regulatory related expenses incurred in connection with various enforcement, regulatory, and litigation activities regarding natural gas matters and regulatory communications. |
| (10) | The Utility recorded revenues of $150 million (before the tax impact of $62 million) during the nine months ended September 30, 2017 in excess of the 2017 authorized revenue requirement, which included the final component of under-collected revenues retroactive to January 1, 2015, as a result of the CPUC’s final phase two decision in the 2015 GT&S rate case. |
| (11) | PG&E Corporation recorded proceeds from insurance, net of plaintiff payments, of $65 million (before the tax impact of $27 million) during the three and nine months ended September 30, 2017, associated with the settlement agreement in connection with the San Bruno shareholder derivative litigation that was approved by the Superior Court of California, County of San Mateo, on July 18, 2017. This included $90 million (before the tax impact of $37 million) during the three and nine months ended September 30, 2017, for proceeds from insurance, partially offset by $25 million (before the tax impact of $10 million) during the three and nine months ended September 30, 2017, for plaintiff legal fees paid in connection with the settlement. |
| (12) | “Non-GAAP earnings from operations” is a non-GAAP financial measure. See Use of Non-GAAP Financial Measures. |
Key Drivers of PG&E Corporation’s Non-GAAP Earnings per Common Share (“EPS”) from Operations
Third Quarter and Year to Date (“YTD”), 2018 vs. 2017
(in millions, except per share amounts)
| Third Quarter 2018 vs. 2017 | YTD 2018 vs. 2017 | |||||||||||||||
| Earnings | Earnings per Common Share (Diluted) |
Earnings | Earnings per Common Share (Diluted) |
|||||||||||||
| 2017 Non- GAAP Earnings from Operations (1) |
$ | 578 | $ | 1.12 | $ | 1,562 | $ | 3.04 | ||||||||
| Growth in rate base earnings |
32 | 0.06 | 97 | 0.18 | ||||||||||||
| Timing of taxes (2) |
12 | 0.02 | 13 | 0.02 | ||||||||||||
| Insurance premium cost recoveries (3) |
6 | 0.01 | 33 | 0.06 | ||||||||||||
| Resolution of regulatory items (4) |
— | — | 29 | 0.06 | ||||||||||||
| Timing and duration of nuclear refueling outages |
— | — | 12 | 0.02 | ||||||||||||
| Timing of 2017 operational spend (5) |
(31) | (0.06) | (31) | (0.06) | ||||||||||||
| Decrease in authorized return on equity (6) |
(7) | (0.01) | (21) | (0.03) | ||||||||||||
| Tax impact of stock compensation (7) |
— | — | (44) | (0.08) | ||||||||||||
| Increase in shares outstanding |
— | — | — | (0.02) | ||||||||||||
| Miscellaneous |
(8) | (0.01) | 2 | — | ||||||||||||
|
|
|
|
|
|
|
|
|
|||||||||
| 2018 Non-GAAP Earnings from Operations (1) |
$ | 582 | $ | 1.13 | $ | 1,652 | $ | 3.19 | ||||||||
|
|
|
|
|
|
|
|
|
|||||||||
All amounts presented in the table above are tax adjusted at PG&E Corporation’s statutory tax rate of 27.98 percent for 2018 and 40.75 percent for 2017, except for the tax impact of stock compensation. See Footnote 7 below. Amounts may not sum due to rounding.
| (1) | See previous exhibit for a reconciliation of EPS on a GAAP basis to non-GAAP EPS from Operations. |
| (2) | Represents the timing of taxes reportable in quarterly statements in accordance with Accounting Standards Codification 740, Income Taxes, and results from variances in the percentage of quarterly earnings to annual earnings. |
| (3) | Represents insurance premium costs incurred during the three and nine months ended September 30, 2018, above amounts included in authorized revenue requirements, that are probable of recovery as a result of the CPUC’s June 2018 decision authorizing a WEMA. |
| (4) | Represents the impact of various regulatory outcomes during the nine months ended September 30, 2018. |
| (5) | Represents the timing of operational expense spending during the three and nine months ended September 30, 2018, as compared to the same period in 2017. |
| (6) | Represents the decrease in return on equity from 10.40 percent in 2017 to 10.25 percent in 2018 as a result of the 2017 CPUC final decision approving an additional extension to the original 2013 Cost of Capital decision. |
| (7) | Represents the impact of income taxes related to share-based compensation awards under the Long-Term Incentive Plan that vested during the nine months ended September 30, 2018, as compared to the same period in 2017. |
PG&E Corporation’s 2018 Items Impacting Comparability (“IIC”) Guidance
| 2018 IIC Guidance (in millions, after-tax) | Low | High | ||||||
| Estimated Items Impacting Comparability: (1) |
||||||||
| Pipeline-related expenses (2) |
$ | 36 | $ | 29 | ||||
| Butte fire-related costs, net of insurance (3) |
176 | 25 | ||||||
| Northern California wildfire-related costs, net of insurance (4) |
~1,656 | ~1,649 | ||||||
| Reduction in gas-related capital disallowances (5) |
(27 | ) | (27 | ) | ||||
| 2017 insurance premium cost recoveries (6) |
(23 | ) | (23 | ) | ||||
|
|
|
|
|
|
| |||
| Estimated IIC Guidance |
$ | ~1,818 | $ | ~1,653 | ||||
|
|
|
|
|
|
| |||
All amounts presented in the table above are tax adjusted at PG&E Corporation’s statutory tax rate of 27.98 percent.
| (1) | “Items impacting comparability” represent items that management does not consider part of the normal course of operations and affect comparability of financial results between periods. See Use of Non-GAAP Financial Measures. |
| (2) | “Pipeline-related expenses” includes costs to identify and remove encroachments from transmission pipeline rights-of-way. The pre-tax range of estimated costs is shown below. The offsetting tax impact for the low and high IIC guidance range is $14 million and $11 million, respectively. |
| 2018 | ||||||||
| (in millions, pre-tax) | Low IIC guidance range |
High IIC guidance range |
||||||
| Pipeline-related expenses |
$ | 50 | $ | 40 | ||||
|
|
|
|
|
|||||
| (3) | “Butte fire-related costs, net of insurance” refers to legal costs and estimated third-party claims associated with the Butte fire, net of contractor insurance recoveries. The pre-tax range of estimated costs shown below includes $7 million of contractor insurance recoveries. Based on the cumulative charges recorded through 2017 of $1.1 billion, the cumulative range for third-party claims is $1.1 billion to $1.3 billion. The total offsetting tax impact for the low and high IIC guidance range is $69 million and $10 million, respectively. |
| 2018 | ||||||||
| (in millions, pre-tax) | Low IIC guidance range |
High IIC guidance range |
||||||
| Legal costs, net of insurance |
$ | 45 | $ | 35 | ||||
| Third-party claims |
200 | — | ||||||
|
|
|
|
|
|||||
| Butte fire-related costs, net of insurance |
$ | 245 | $ | 35 | ||||
|
|
|
|
|
|||||
| (4) | “Northern California wildfire-related costs, net of insurance” refers to estimated third-party claims, Utility clean-up and repair costs, and legal and other costs associated with the Northern California wildfires, net of probable insurance recoveries. The pre-tax range of estimated costs shown below includes accrued charges through September 30, 2018 for estimated third-party claims in connection with 14 of the Northern California wildfires. Guidance reflects the low end of the estimated range of costs related to such third-party claims. The Utility is currently unable to estimate the high end of the range of costs related to third-party claims. The insurance recoveries estimate is based on an accounting assessment, but the actual timing and amount of insurance recoveries may vary. The total offsetting tax impact for the low and high IIC guidance range is $644 million and $641 million, respectively. |
| 2018 | ||||||||
| (in millions, pre-tax) | Low IIC guidance range |
High IIC guidance range | ||||||
| Third-party claims |
$ | 2,500 | $ | 2,500 | ||||
| Legal and other costs |
160 | 150 | ||||||
| Utility clean-up and repair costs |
40 | 40 | ||||||
| Insurance recoveries |
~(400 | ) | ~(400 | ) | ||||
|
|
|
|
|
|
| |||
| Northern California wildfire-related costs, net of insurance |
$ | ~2,300 | $ | ~2,290 | ||||
|
|
|
|
|
|
| |||
| (5) | “Reduction in gas-related capital disallowances” reflects the reduction to estimated disallowances for gas-related costs expected to exceed authorized amounts in the 2015 GT&S rate case and the Utility’s PSEP. The total offsetting tax impact for the low and high IIC guidance range is $11 million. |
| 2018 | ||||||||
| (in millions, pre-tax) | Low IIC guidance range |
High IIC guidance range | ||||||
| Reduction in gas-related capital disallowances |
$ | (38) | $ | (38) | ||||
|
|
|
|
|
|
| |||
| (6) | “2017 insurance premium cost recoveries” includes insurance premium costs incurred in 2017, above amounts included in authorized revenue requirements, that are probable of recovery as a result of the CPUC’s June 2018 decision authorizing a WEMA. The total offsetting tax impact for the low and high IIC guidance range is $9 million. |
| 2018 | ||||||||
| (in millions, pre-tax) | Low IIC guidance range |
High IIC guidance range | ||||||
| 2017 insurance premium cost recoveries |
$ | (32) | $ | (32) | ||||
|
|
|
|
|
|
| |||
Actual financial results for 2018 may differ materially from the guidance provided. For a discussion of the factors that may affect future results, see the Forward-Looking Statements.
Use of Non-GAAP Financial Measures
PG&E Corporation and Pacific Gas and Electric Company
PG&E Corporation discloses historical financial results and provides guidance based on “non-GAAP earnings from operations” in order to provide a measure that allows investors to compare the underlying financial performance of the business from one period to another, exclusive of items impacting comparability.
“Non-GAAP earnings from operations” is a non-GAAP financial measure and is calculated as income available for common shareholders less items impacting comparability. “Items impacting comparability” represent items that management does not consider part of the normal course of operations and affect comparability of financial results between periods, including Northern California wildfire- and Butte fire-related costs, net of insurance, pipeline-related expenses, reduction in gas-related capital disallowances, 2017 insurance premium cost recoveries, fines and penalties, Diablo Canyon settlement-related disallowance, legal and regulatory-related expenses, GT&S revenue timing impact, and net benefit from derivative litigation settlement. PG&E Corporation uses non-GAAP earnings from operations to understand and compare operating results across reporting periods for various purposes including internal budgeting and forecasting, short- and long-term operating planning, and employee incentive compensation. PG&E Corporation believes that non-GAAP earnings from operations provide additional insight into the underlying trends of the business, allowing for a better comparison against historical results and expectations for future performance.
Non-GAAP earnings from operations are not a substitute or alternative for GAAP measures such as consolidated income available for common shareholders and may not be comparable to similarly titled measures used by other companies.
Exhibit 99.2

THIRD QUARTER EARNINGS CALL November 5, 2018
Forward Looking Statements This presentation contains statements regarding management’s expectations and objectives for future periods as well as forecasts and estimates regarding the proposed Community Wildfire Safety Program, 2018 assumptions, 2018 IIC guidance, 2018-2023 capital expenditures, 2018-2023 weighted average ratebase, capital expenditures and ratebase assumptions, equity considerations, 2017 Tax Cuts and Jobs Act expected impact, and general earnings sensitivities for 2018. It also includes 2018 assumptions regarding capital expenditures, authorized rate base, authorized cost of capital, and certain other factors. These statements and other statements that are not purely historical constitute forward-looking statements that are necessarily subject to various risks and uncertainties. Actual results may differ materially from those described in forward-looking statements. PG&E Corporation and the Utility are not able to predict all the factors that may affect future results. Factors that could cause actual results to differ materially include, but are not limited to: • the impact of the Northern California wildfires, including whether the Utility will be able to timely recover costs incurred in connection thereto in excess of the Utility’s currently authorized revenue requirements; the timing and outcome of the remaining wildfire investigations and the extent to which the Utility will have liability associated with these fires; the timing and amount of insurance recoveries; and potential liabilities in connection with fines or penalties that could be imposed on the Utility if the CPUC or any other law enforcement agency were to bring an enforcement action and determined that the Utility failed to comply with applicable laws and regulations; • the timing and outcome of the Butte fire litigation and of any proceeding to recover costs in excess of insurance through regulatory mechanisms and the timing of such recovery; and whether additional investigations and proceedings in connection with the Butte fire will be opened and any additional fines or penalties imposed on the Utility; • whether PG&E Corporation and the Utility are able to successfully challenge the application of the doctrine of inverse condemnation to investor-owned utilities; • whether the Utility will be able to obtain full recovery of its significantly increased insurance premiums, and the timing of any such recovery; • whether the Utility can obtain wildfire insurance at a reasonable cost in the future, or at all, and whether insurance coverage is adequate for future losses or claims; • the timing and outcome of any CPUC decision related to the Utility’s March 30, 2018 submissions in connection with the impact of the Tax Cuts and Jobs Act of 2017 on the Utility’s rate cases, and its implementation plan; • the timing and outcomes of the 2019 GT&S rate case, 2020 GRC, FERC TO18, TO19, and TO20 rate cases, 2018 CEMA, WEMA, FHPMA, future cost of capital proceeding, and other ratemaking and regulatory proceedings; • the timing and outcome of future regulatory and legislative developments in connection with SB 901, including the customer harm threshold in connection with the Northern California wildfires, and future wildfire reforms; • the ability of PG&E Corporation and the Utility to access capital markets and other sources of financing in a timely manner on acceptable terms; • further credit ratings downgrades that could, among other things, result in higher borrowing costs, fewer financing options, and additional collateral posting, especially if PG&E Corporation’s or the Utility’s credit ratings were to fall below investment grade; • the cost of the Utility’s community wildfire safety program, and the timing and outcome of any proceeding to recover such cost through rates; • the timing and outcomes of phase two of the ex parte order instituting investigation (OII) and of the safety culture OII; • the Utility’s ability to efficiently manage capital expenditures and its operating and maintenance expenses within the authorized levels of spending and timely recover its costs through rates, and the extent to which the Utility incurs unrecoverable costs that are higher than the forecasts of such costs; • the outcome of the probation and the monitorship, the timing and outcomes of the debarment proceeding, the Safety and Enforcement Division’s (SED) unresolved enforcement matters relating to the Utility’s compliance with natural gas-related laws and regulations, and other investigations that have been or may be commenced, and the ultimate amount of fines, penalties, and remedial and other costs that the Utility may incur as a result; and • the other factors disclosed in PG&E Corporation and the Utility’s joint annual report on Form 10-K for the year ended December 31, 2017, their joint quarterly reports on Form 10-Q for the quarters ended March 31, 2018, June 30, 2018 and September 30, 2018, respectively, and other reports filed with the SEC, which are available on PG&E Corporation’s website at www.pgecorp.com and on the SEC website at www.sec.gov. This presentation is not complete without the accompanying statements made by management during the webcast conference call held on November 5, 2018. The statements in this presentation are made as of November 5, 2018. PG&E Corporation undertakes no obligation to update information contained herein. This presentation, including Appendices, and the accompanying press release were attached to PG&E Corporation’s Current Report on Form 8-K that was furnished to the SEC on November 5, 2018 and, along with the replay of the conference call, is also available on PG&E Corporation’s website at www.pgecorp.com. 2
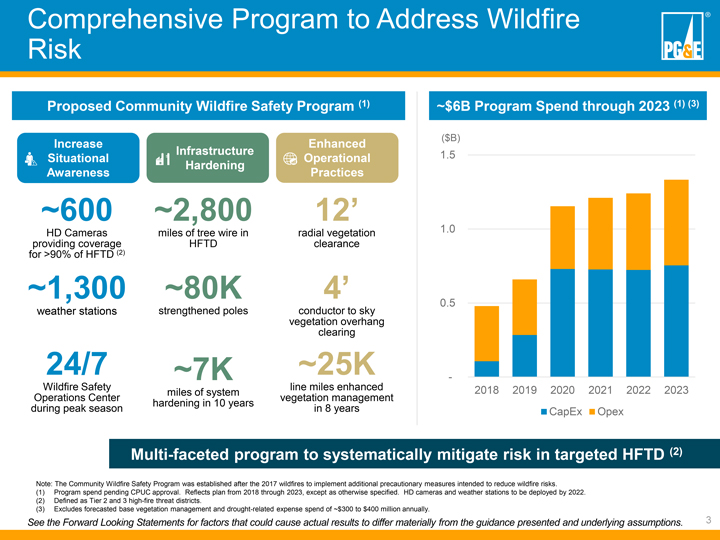
Comprehensive Program to Address Wildfire Risk Proposed Community Wildfire Safety Program (1) ~$6B Program Spend through 2023 (1) (3) ($B) Increase Enhanced Infrastructure 1.5 Situational Operational Hardening Awareness Practices ~600 ~2,800 12’ HD Cameras miles of tree wire in radial vegetation 1.0 providing coverage HFTD clearance for >90% of HFTD (2) ~1,300 ~80K 4’ 0.5 weather stations strengthened poles conductor to sky vegetation overhang clearing 24/7 ~7K ~25K Wildfire Safety line miles enhanced -miles of system 2018 2019 2020 2021 2022 2023 Operations Center vegetation management hardening in 10 years during peak season in 8 years CapEx Opex Multi-faceted program to systematically mitigate risk in targeted HFTD (2) Note: The Community Wildfire Safety Program was established after the 2017 wildfires to implement additional precautionary measures intended to reduce wildfire risks. (1) Program spend pending CPUC approval. Reflects plan from 2018 through 2023, except as otherwise specified. HD cameras and weather stations to be deployed by 2022. (2) Defined as Tier 2 and 3 high-fire threat districts. (3) Excludes forecasted base vegetation management and drought-related expense spend of ~$300 to $400 million annually. See the Forward Looking Statements for factors that could cause actual results to differ materially from the guidance presented and underlying assumptions. 3
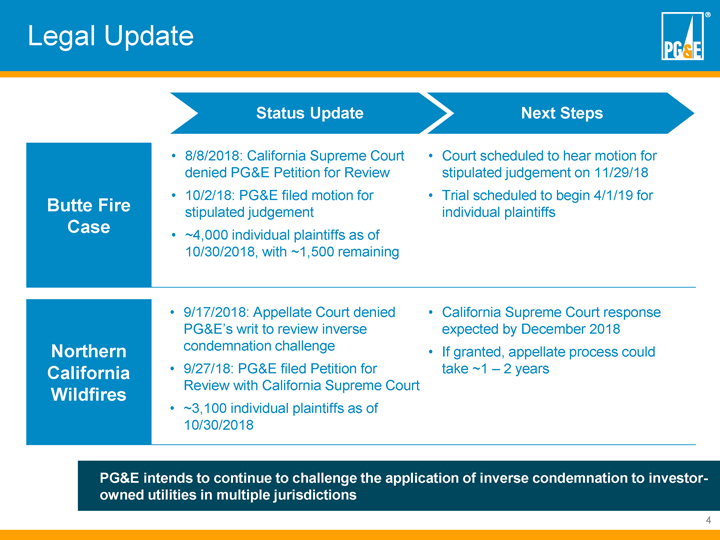
Legal Update Status Update Next Steps • 8/8/2018: California Supreme Court • Court scheduled to hear motion for denied PG&E Petition for Review stipulated judgement on 11/29/18 • 10/2/18: PG&E filed motion for • Trial scheduled to begin 4/1/19 for Butte Fire stipulated judgement individual plaintiffs Case • ~4,000 individual plaintiffs as of 10/30/2018, with ~1,500 remaining • 9/17/2018: Appellate Court denied • California Supreme Court response PG&E’s writ to review inverse expected by December 2018 Northern condemnation challenge • If granted, appellate process could California • 9/27/18: PG&E filed Petition for take ~1 – 2 years Review with California Supreme Court Wildfires • ~3,100 individual plaintiffs as of 10/30/2018 PG&E intends to continue to challenge the application of inverse condemnation to investor-owned utilities in multiple jurisdictions 4
Legal Update Status Update Next Steps 8/8/2018: California Supreme Court Court scheduled to hear motion for denied PG&E Petition for Review stipulated judgement on 11/29/18 10/2/18: PG&E filed motion for Trial scheduled to begin 4/1/19 for Butte Fire stipulated judgement individual plaintiffs Case ~4,000 individual plaintiffs as of 10/30/2018, with ~1,500 remaining 9/17/2018: Appellate Court denied California Supreme Court response PG&E’s writ to review inverse expected by December 2018 Northern condemnation challenge If granted, appellate process could California 9/27/18: PG&E filed Petition for take ~1 – 2 years Review with California Supreme Court Wildfires ~3,100 individual plaintiffs as of 10/30/2018 PG&E intends to continue to challenge the application of inverse condemnation to investor-owned utilities in multiple jurisdictions 4
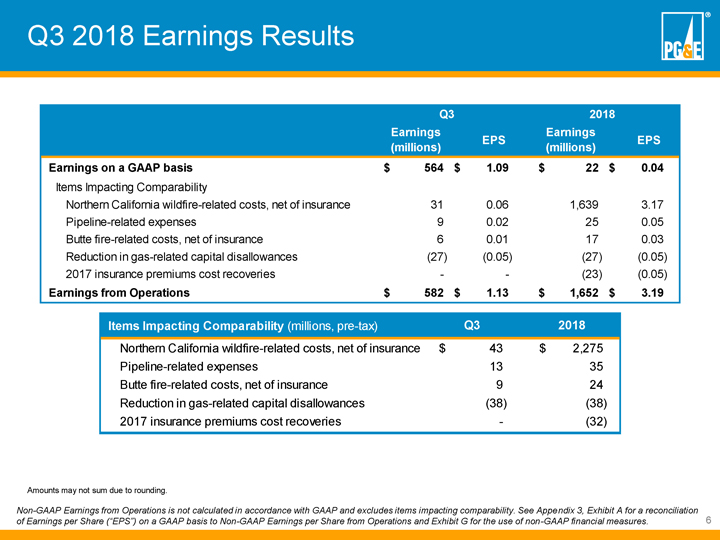
Q3 2018 Earnings Results Q3 2018 Earnings Earnings EPS EPS (millions) (millions) Earnings on a GAAP basis $ 564 $ 1.09 $ 22 $ 0.04 Items Impacting Comparability Northern California wildfire-related costs, net of insurance 31 0.06 1,639 3.17 Pipeline-related expenses 9 0.02 25 0.05 Butte fire-related costs, net of insurance 6 0.01 17 0.03 Reduction in gas-related capital disallowances (27) (0.05) (27) (0.05) 2017 insurance premiums cost recoveries - - (23) (0.05) Earnings from Operations $ 582 $ 1.13 $ 1,652 $ 3.19 Items Impacting Comparability (millions, pre-tax) Q3 2018 Northern California wildfire-related costs, net of insurance $ 43 $ 2,275 Pipeline-related expenses 13 35 Butte fire-related costs, net of insurance 9 24 Reduction in gas-related capital disallowances (38) (38) 2017 insurance premiums cost recoveries - (32) Amounts may not sum due to rounding. Non-GAAP Earnings from Operations is not calculated in accordance with GAAP and excludes items impacting comparability. See Appendix 3, Exhibit A for a reconciliation of Earnings per Share (“EPS”) on a GAAP basis to Non-GAAP Earnings per Share from Operations and Exhibit G for the use of non-GAAP financial measures. 6

Q3 2018: Quarter over Quarter Comparison Earnings per Share from Operations $1.40 $0.06 $0.02 $0.01 ($0.06) $1.20 ($0.01) ($0.01) $1.00 $0.80 $0.60 $1.12 $1.13 $0.40 $0.20 $0.00 Q3 2017 Growth in Timing of Taxes Insurance Timing of 2017 Decrease in Miscellaneous Q3 2018 EPS from Rate Base Premium Operational Spend Authorized Return EPS from Operations Earnings Cost Recoveries on Equity Operations Non-GAAP Earnings from Operations is not calculated in accordance with GAAP and excludes items impacting comparability. See Appendix 3, Exhibit A for a reconciliation of Earnings per Share (“EPS”) on a GAAP basis to Non-GAAP Earnings from Operations and Exhibit G for the use of non-GAAP financial measures. 7
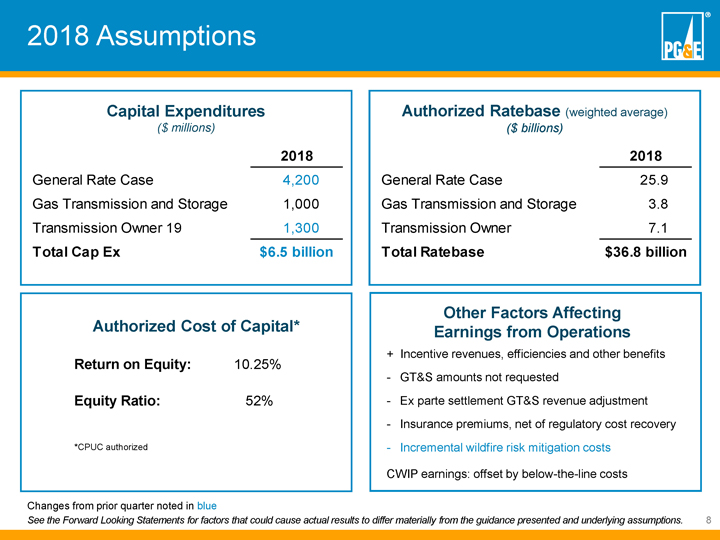
2018 Assumptions Capital Expenditures Authorized Ratebase (weighted average) ($ millions) ($ billions) 2018 2018 General Rate Case 4,200 General Rate Case 25.9 Gas Transmission and Storage 1,000 Gas Transmission and Storage 3.8 Transmission Owner 19 1,300 Transmission Owner 7.1 Total Cap Ex $6.5 billion Total Ratebase $36.8 billion Authorized Cost of Capital* Other Factors Affecting Earnings from Operations + Incentive revenues, efficiencies and other benefits Return on Equity: 10.25% - GT&S amounts not requested Equity Ratio: 52% - Ex parte settlement GT&S revenue adjustment - Insurance premiums, net of regulatory cost recovery *CPUC authorized - Incremental wildfire risk mitigation costs CWIP earnings: offset by below-the-line costs Changes from prior quarter noted in blue See the Forward Looking Statements for factors that could cause actual results to differ materially from the guidance presented and underlying assumptions. 8
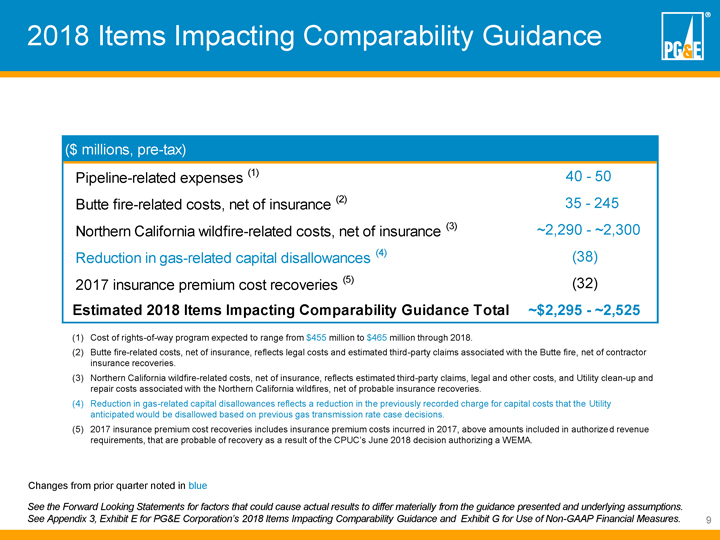
2018 Items Impacting Comparability Guidance ($ millions, pre-tax) Pipeline-related expenses (1) 40 - 50 Butte fire-related costs, net of insurance (2) 35 - 245 Northern California wildfire-related costs, net of insurance (3) ~2,290 - ~2,300 Reduction in gas-related capital disallowances (4) (38) 2017 insurance premium cost recoveries (5) (32) Estimated 2018 Items Impacting Comparability Guidance Total ~$2,295 - ~2,525 (1) Cost of rights-of-way program expected to range from $455 million to $465 million through 2018. (2) Butte fire-related costs, net of insurance, reflects legal costs and estimated third-party claims associated with the Butte fire, net of contractor insurance recoveries. (3) Northern California wildfire-related costs, net of insurance, reflects estimated third-party claims, legal and other costs, and Utility clean-up and repair costs associated with the Northern California wildfires, net of probable insurance recoveries. (4) Reduction in gas-related capital disallowances reflects a reduction in the previously recorded charge for capital costs that the Utility anticipated would be disallowed based on previous gas transmission rate case decisions. (5) 2017 insurance premium cost recoveries includes insurance premium costs incurred in 2017, above amounts included in authorized revenue requirements, that are probable of recovery as a result of the CPUC’s June 2018 decision authorizing a WEMA. Changes from prior quarter noted in blue See the Forward Looking Statements for factors that could cause actual results to differ materially from the guidance presented and underlying assumptions. See Appendix 3, Exhibit E for PG&E Corporation’s 2018 Items Impacting Comparability Guidance and Exhibit G for Use of Non-GAAP Financial Measures. 9
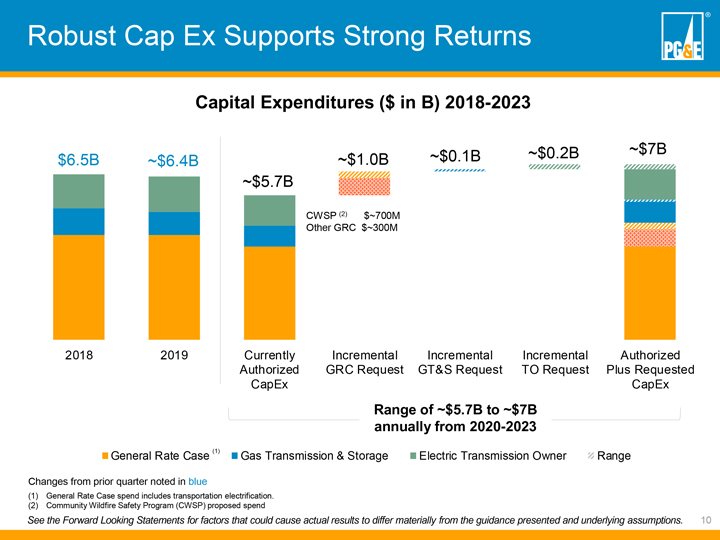
Robust Cap Ex Supports Strong Returns Capital Expenditures ($ in B) 2018-2023 ~$0.2B ~$7B $6.5B ~$6.4B ~$1.0B ~$0.1B ~$5.7B CWSP (2) $~700M Other GRC $~300M 2018 2019 Currently Incremental Incremental Incremental Authorized Authorized GRC Request GT&S Request TO Request Plus Requested CapEx CapEx Range of ~$5.7B to ~$7B annually from 2020-2023 General Rate Case (1) Gas Transmission & Storage Electric Transmission Owner Range Changes from prior quarter noted in blue (1) General Rate Case spend includes transportation electrification. (2) Community Wildfire Safety Program (CWSP) proposed spend See the Forward Looking Statements for factors that could cause actual results to differ materially from the guidance presented and underlying assumptions. 10
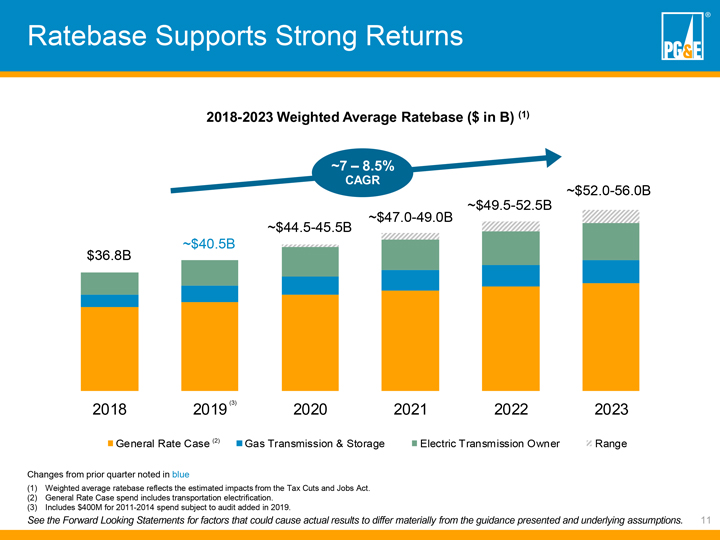
Ratebase Supports Strong Returns 2018-2023 Weighted Average Ratebase ($ in B) (1) ~7 – 8.5% CAGR ~$52.0-56.0B ~$47.0-49.0B ~$49.5-52.5B ~$44.5-45.5B ~$40.5B $36.8B 2018 2019 (3) 2020 2021 2022 2023 General Rate Case (2) Gas Transmission & Storage Electric Transmission Owner Range Changes from prior quarter noted in blue (1) Weighted average ratebase reflects the estimated impacts from the Tax Cuts and Jobs Act. (2) General Rate Case spend includes transportation electrification. (3) Includes $400M for 2011-2014 spend subject to audit added in 2019. See the Forward Looking Statements for factors that could cause actual results to differ materially from the guidance presented and underlying assumptions. 11
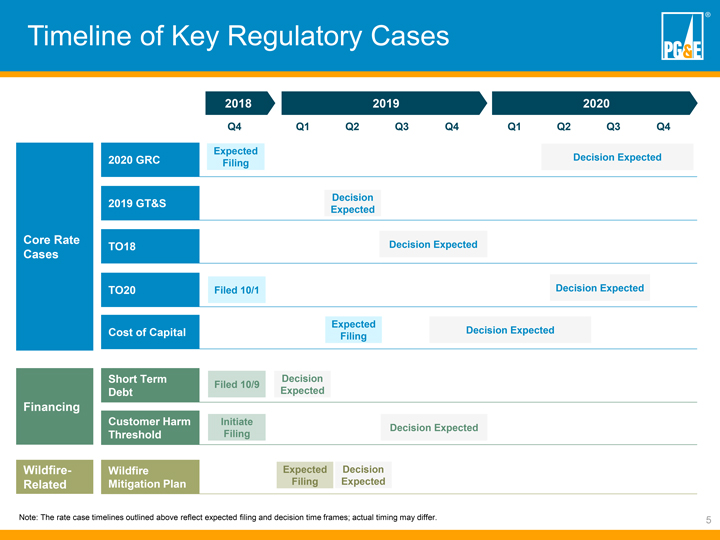
Timeline of Key Regulatory Cases 2018 2019 2020 Q4 Q1 Q2 Q3 Q4 Q1 Q2 Q3 Q4 Expected 2020 GRC Decision Expected Filing Decision 2019 GT&S Expected Core Rate Decision Expected TO18 Cases TO20 Filed 10/1 Decision Expected Expected Cost of Capital Decision Expected Filing Short Term Decision Filed 10/9 Debt Expected Financing Customer Harm Initiate Decision Expected Threshold Filing Wildfire- Wildfire Expected Decision Related Mitigation Plan Filing Expected Note: The rate case timelines outlined above reflect expected filing and decision time frames; actual timing may differ. 5
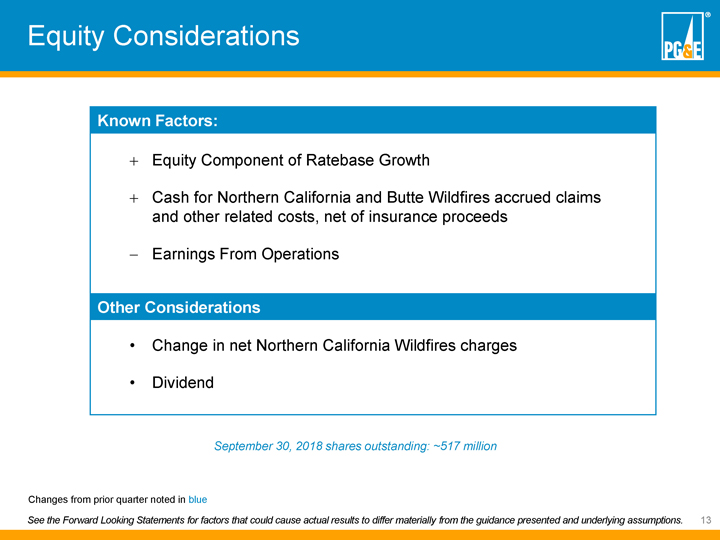
Equity Considerations Known Factors:  Equity Component of Ratebase Growth  Cash for Northern California and Butte Wildfires accrued claims and other related costs, net of insurance proceeds ï€ Earnings From Operations Other Considerations • Change in net Northern California Wildfires charges • Dividend September 30, 2018 shares outstanding: ~517 million Changes from prior quarter noted in blue See the Forward Looking Statements for factors that could cause actual results to differ materially from the guidance presented and underlying assumptions. 13

Appendix
Table of Contents Appendix 1 – Incremental Equity Factors Slide 16 Appendix 2 – Tax Cuts and Jobs Act Expected Impact Slide 17 Appendix 3 – Supplemental Earnings Materials Slides 18-31 15
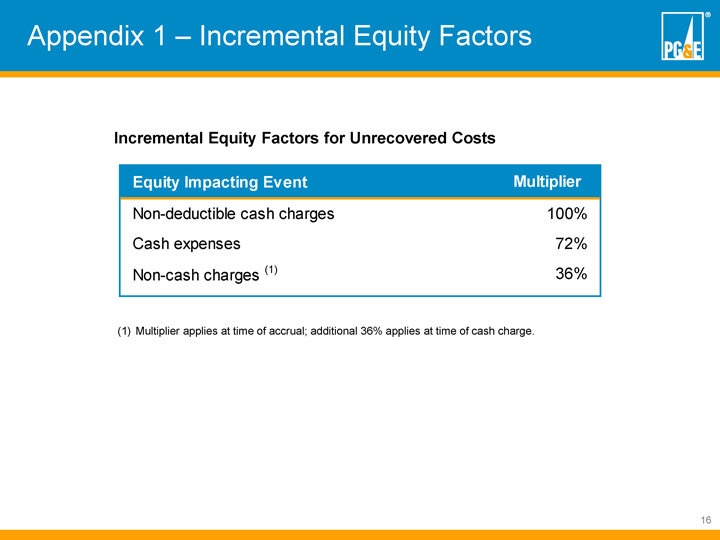
Appendix 1 – Incremental Equity Factors Incremental Equity Factors for Unrecovered Costs Equity Impacting Event Multiplier Non-deductible cash charges 100% Cash expenses 72% Non-cash charges (1) 36% (1) Multiplier applies at time of accrual; additional 36% applies at time of cash charge. 16
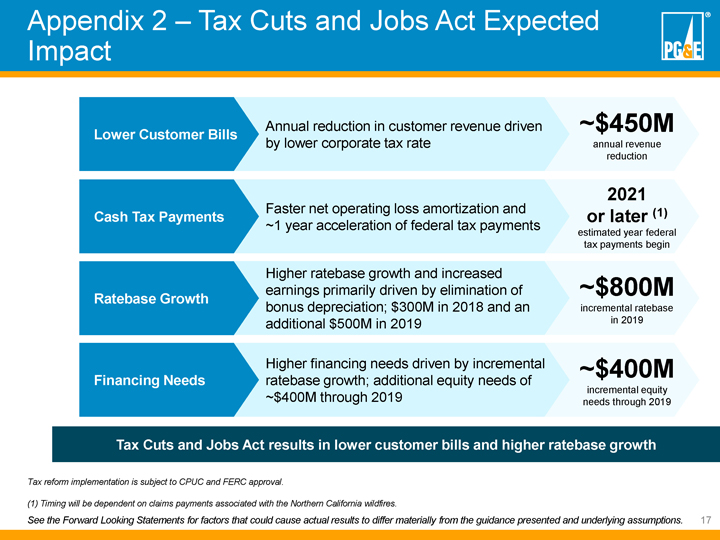
Appendix 2 – Tax Cuts and Jobs Act Expected Impact Annual reduction in customer revenue driven ~$450M Lower Customer Bills by lower corporate tax rate annual revenue reduction 2021 Faster net operating loss amortization and (1) Cash Tax Payments or later ~1 year acceleration of federal tax payments estimated year federal tax payments begin Higher ratebase growth and increased earnings primarily driven by elimination of ~$800M Ratebase Growth bonus depreciation; $300M in 2018 and an incremental ratebase additional $500M in 2019 in 2019 Higher financing needs driven by incremental ~$400M Financing Needs ratebase growth; additional equity needs of incremental equity ~$400M through 2019 needs through 2019 Tax Cuts and Jobs Act results in lower customer bills and higher ratebase growth Tax reform implementation is subject to CPUC and FERC approval. (1) Timing will be dependent on claims payments associated with the Northern California wildfires. See the Forward Looking Statements for factors that could cause actual results to differ materially from the guidance presented and underlying assumptions. 17
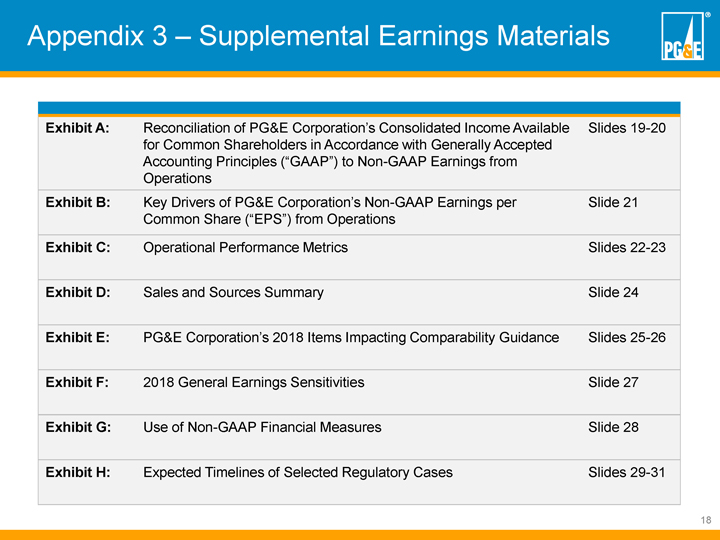
Appendix 3 – Supplemental Earnings Materials Exhibit A: Reconciliation of PG&E Corporation’s Consolidated Income Available Slides 19-20 for Common Shareholders in Accordance with Generally Accepted Accounting Principles (“GAAP”) to Non-GAAP Earnings from Operations Exhibit B: Key Drivers of PG&E Corporation’s Non-GAAP Earnings per Slide 21 Common Share (“EPS”) from Operations Exhibit C: Operational Performance Metrics Slides 22-23 Exhibit D: Sales and Sources Summary Slide 24 Exhibit E: PG&E Corporation’s 2018 Items Impacting Comparability Guidance Slides 25-26 Exhibit F: 2018 General Earnings Sensitivities Slide 27 Exhibit G: Use of Non-GAAP Financial Measures Slide 28 Exhibit H: Expected Timelines of Selected Regulatory Cases Slides 29-31 18
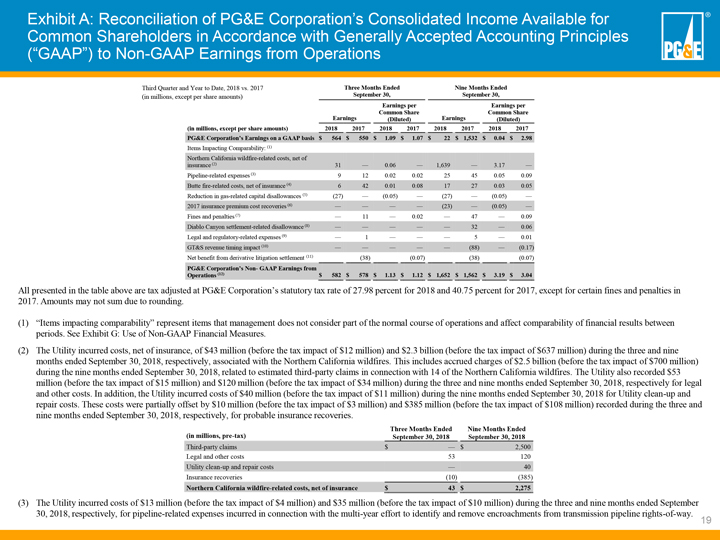
Exhibit A: Reconciliation of PG&E Corporation’s Consolidated Income Available for Common Shareholders in Accordance with Generally Accepted Accounting Principles (“GAAP”) to Non-GAAP Earnings from Operations Third Quarter and Year to Date, 2018 vs. 2017 Three Months Ended Nine Months Ended (in millions, except per share amounts) September 30, September 30, Earnings per Earnings per Earnings Common Share Earnings Common Share (Diluted) (Diluted) (in millions, except per share amounts) 2018 2017 2018 2017 2018 2017 2018 2017 PG&E Corporation’s Earnings on a GAAP basis $ 564 $ 550 $ 1.09 $ 1.07 $ 22 $ 1,532 $ 0.04 $ 2.98 Items Impacting Comparability: (1) Northern California wildfire-related costs, net of insurance (2) 31 0.06 1,639 3.17 Pipeline-related expenses (3) 9 12 0.02 0.02 25 45 0.05 0.09 Butte fire-related costs, net of insurance (4) 6 42 0.01 0.08 17 27 0.03 0.05 Reduction in gas-related capital disallowances (5) (27) (0.05) (27) (0.05) 2017 insurance premium cost recoveries (6) (23) (0.05) Fines and penalties (7) 11 0.02 47 0.09 Diablo Canyon settlement-related disallowance (8) 32 0.06 Legal and regulatory-related expenses (9) 1 5 0.01 GT&S revenue timing impact (10) (88) (0.17) Net benefit from derivative litigation settlement (11) (38) (0.07) (38) (0.07) PG&E Corporation’s Non- GAAP Earnings from Operations (12) $ 582 $ 578 $ 1.13 $ 1.12 $ 1,652 $ 1,562 $ 3.19 $ 3.04 All presented in the table above are tax adjusted at PG&E Corporation’s statutory tax rate of 27.98 percent for 2018 and 40.75 percent for 2017, except for certain fines and penalties in 2017. Amounts may not sum due to rounding. (1) “Items impacting comparability” represent items that management does not consider part of the normal course of operations and affect comparability of financial results between periods. See Exhibit G: Use of Non-GAAP Financial Measures. (2) The Utility incurred costs, net of insurance, of $43 million (before the tax impact of $12 million) and $2.3 billion (before the tax impact of $637 million) during the three and nine months ended September 30, 2018, respectively, associated with the Northern California wildfires. This includes accrued charges of $2.5 billion (before the tax impact of $700 million) during the nine months ended September 30, 2018, related to estimated third-party claims in connection with 14 of the Northern California wildfires. The Utility also recorded $53 million (before the tax impact of $15 million) and $120 million (before the tax impact of $34 million) during the three and nine months ended September 30, 2018, respectively for legal and other costs. In addition, the Utility incurred costs of $40 million (before the tax impact of $11 million) during the nine months ended September 30, 2018 for Utility clean-up and repair costs. These costs were partially offset by $10 million (before the tax impact of $3 million) and $385 million (before the tax impact of $108 million) recorded during the three and nine months ended September 30, 2018, respectively, for probable insurance recoveries. Three Months Ended Nine Months Ended (in millions, pre-tax) September 30, 2018 September 30, 2018 Third-party claims $ $ 2,500 Legal and other costs 53 120 Utility clean-up and repair costs 40 Insurance recoveries (10) (385) Northern California wildfire-related costs, net of insurance $ 43 $ 2,275 (3) The Utility incurred costs of $13 million (before the tax impact of $4 million) and $35 million (before the tax impact of $10 million) during the three and nine months ended September 30, 2018, respectively, for pipeline-related expenses incurred in connection with the multi-year effort to identify and remove encroachments from transmission pipeline rights-of-way. 19
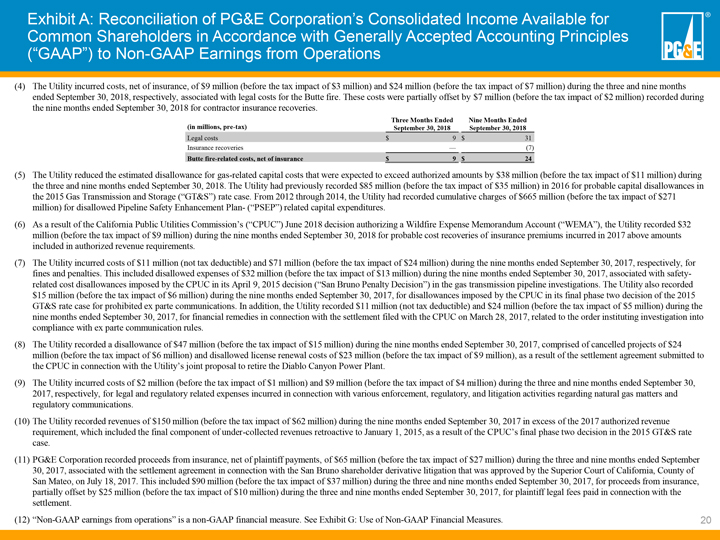
Exhibit A: Reconciliation of PG&E Corporation’s Consolidated Income Available for Common Shareholders in Accordance with Generally Accepted Accounting Principles (“GAAP”) to Non-GAAP Earnings from Operations (4) The Utility incurred costs, net of insurance, of $9 million (before the tax impact of $3 million) and $24 million (before the tax impact of $7 million) during the three and nine months ended September 30, 2018, respectively, associated with legal costs for the Butte fire. These costs were partially offset by $7 million (before the tax impact of $2 million) recorded during the nine months ended September 30, 2018 for contractor insurance recoveries. Three Months Ended Nine Months Ended (in millions, pre-tax) September 30, 2018 September 30, 2018 Legal costs $ 9 $ 31 Insurance recoveries (7) Butte fire-related costs, net of insurance $ 9 $ 24 (5) The Utility reduced the estimated disallowance for gas-related capital costs that were expected to exceed authorized amounts by $38 million (before the tax impact of $11 million) during the three and nine months ended September 30, 2018. The Utility had previously recorded $85 million (before the tax impact of $35 million) in 2016 for probable capital disallowances in the 2015 Gas Transmission and Storage (“GT&S”) rate case. From 2012 through 2014, the Utility had recorded cumulative charges of $665 million (before the tax impact of $271 million) for disallowed Pipeline Safety Enhancement Plan- (“PSEP”) related capital expenditures. (6) As a result of the California Public Utilities Commission’s (“CPUC”) June 2018 decision authorizing a Wildfire Expense Memorandum Account (“WEMA”), the Utility recorded $32 million (before the tax impact of $9 million) during the nine months ended September 30, 2018 for probable cost recoveries of insurance premiums incurred in 2017 above amounts included in authorized revenue requirements. (7) The Utility incurred costs of $11 million (not tax deductible) and $71 million (before the tax impact of $24 million) during the nine months ended September 30, 2017, respectively, for fines and penalties. This included disallowed expenses of $32 million (before the tax impact of $13 million) during the nine months ended September 30, 2017, associated with safety-related cost disallowances imposed by the CPUC in its April 9, 2015 decision (“San Bruno Penalty Decision”) in the gas transmission pipeline investigations. The Utility also recorded $15 million (before the tax impact of $6 million) during the nine months ended September 30, 2017, for disallowances imposed by the CPUC in its final phase two decision of the 2015 GT&S rate case for prohibited ex parte communications. In addition, the Utility recorded $11 million (not tax deductible) and $24 million (before the tax impact of $5 million) during the nine months ended September 30, 2017, for financial remedies in connection with the settlement filed with the CPUC on March 28, 2017, related to the order instituting investigation into compliance with ex parte communication rules. (8) The Utility recorded a disallowance of $47 million (before the tax impact of $15 million) during the nine months ended September 30, 2017, comprised of cancelled projects of $24 million (before the tax impact of $6 million) and disallowed license renewal costs of $23 million (before the tax impact of $9 million), as a result of the settlement agreement submitted to the CPUC in connection with the Utility’s joint proposal to retire the Diablo Canyon Power Plant. (9) The Utility incurred costs of $2 million (before the tax impact of $1 million) and $9 million (before the tax impact of $4 million) during the three and nine months ended September 30, 2017, respectively, for legal and regulatory related expenses incurred in connection with various enforcement, regulatory, and litigation activities regarding natural gas matters and regulatory communications. (10) The Utility recorded revenues of $150 million (before the tax impact of $62 million) during the nine months ended September 30, 2017 in excess of the 2017 authorized revenue requirement, which included the final component of under-collected revenues retroactive to January 1, 2015, as a result of the CPUC’s final phase two decision in the 2015 GT&S rate case. (11) PG&E Corporation recorded proceeds from insurance, net of plaintiff payments, of $65 million (before the tax impact of $27 million) during the three and nine months ended September 30, 2017, associated with the settlement agreement in connection with the San Bruno shareholder derivative litigation that was approved by the Superior Court of California, County of San Mateo, on July 18, 2017. This included $90 million (before the tax impact of $37 million) during the three and nine months ended September 30, 2017, for proceeds from insurance, partially offset by $25 million (before the tax impact of $10 million) during the three and nine months ended September 30, 2017, for plaintiff legal fees paid in connection with the settlement. (12) “Non-GAAP earnings from operations” is a non-GAAP financial measure. See Exhibit G: Use of Non-GAAP Financial Measures. 20
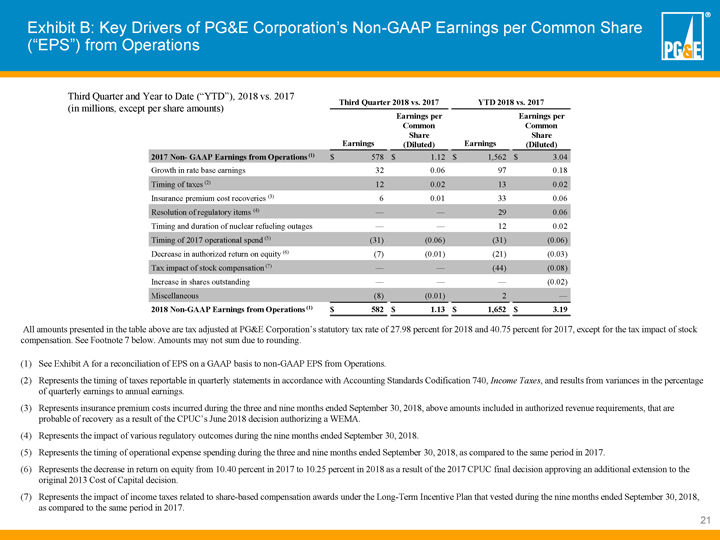
Exhibit B: Key Drivers of PG&E Corporation’s Non-GAAP Earnings per Common Share (“EPS”) from Operations Third Quarter and Year to Date (“YTD”), 2018 vs. 2017 Third Quarter 2018 vs. 2017 YTD 2018 vs. 2017 (in millions, except per share amounts) Earnings per Earnings per Common Common Share Share Earnings (Diluted) Earnings (Diluted) 2017 Non- GAAP Earnings from Operations (1) $ 578 $ 1.12 $ 1,562 $ 3.04 Growth in rate base earnings 32 0.06 97 0.18 Timing of taxes (2) 12 0.02 13 0.02 Insurance premium cost recoveries (3) 6 0.01 33 0.06 Resolution of regulatory items (4) — — 29 0.06 Timing and duration of nuclear refueling outages — — 12 0.02 Timing of 2017 operational spend (5) (31) (0.06) (31) (0.06) Decrease in authorized return on equity (6) (7) (0.01) (21) (0.03) Tax impact of stock compensation (7) — — (44) (0.08) Increase in shares outstanding — — — (0.02) Miscellaneous (8) (0.01) 2 — 2018 Non-GAAP Earnings from Operations (1) $ 582 $ 1.13 $ 1,652 $ 3.19 All amounts presented in the table above are tax adjusted at PG&E Corporation’s statutory tax rate of 27.98 percent for 2018 and 40.75 percent for 2017, except for the tax impact of stock compensation. See Footnote 7 below. Amounts may not sum due to rounding. (1) See Exhibit A for a reconciliation of EPS on a GAAP basis to non-GAAP EPS from Operations. (2) Represents the timing of taxes reportable in quarterly statements in accordance with Accounting Standards Codification 740, Income Taxes, and results from variances in the percentage of quarterly earnings to annual earnings. (3) Represents insurance premium costs incurred during the three and nine months ended September 30, 2018, above amounts included in authorized revenue requirements, that are probable of recovery as a result of the CPUC’s June 2018 decision authorizing a WEMA. (4) Represents the impact of various regulatory outcomes during the nine months ended September 30, 2018. (5) Represents the timing of operational expense spending during the three and nine months ended September 30, 2018, as compared to the same period in 2017. (6) Represents the decrease in return on equity from 10.40 percent in 2017 to 10.25 percent in 2018 as a result of the 2017 CPUC final decision approving an additional extension to the original 2013 Cost of Capital decision. (7) Represents the impact of income taxes related to share-based compensation awards under the Long-Term Incentive Plan that vested during the nine months ended September 30, 2018, as compared to the same period in 2017. 21
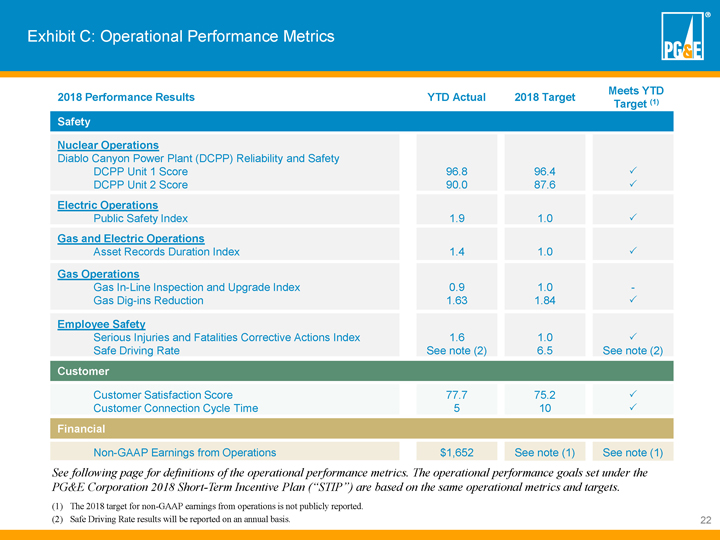
Exhibit C: Operational Performance Metrics Meets YTD 2018 Performance Results YTD Actual 2018 Target Target (1) Safety Nuclear Operations Diablo Canyon Power Plant (DCPP) Reliability and Safety DCPP Unit 1 Score 96.8 96.4 P DCPP Unit 2 Score 90.0 87.6 P Electric Operations Public Safety Index 1.9 1.0 P Gas and Electric Operations Asset Records Duration Index 1.4 1.0 P Gas Operations Gas In-Line Inspection and Upgrade Index 0.9 1.0 -Gas Dig-ins Reduction 1.63 1.84 P Employee Safety Serious Injuries and Fatalities Corrective Actions Index 1.6 1.0 P Safe Driving Rate See note (2) 6.5 See note (2) Customer Customer Satisfaction Score 77.7 75.2 P Customer Connection Cycle Time 5 10 P Financial Non-GAAP Earnings from Operations $1,652 See note (1) See note (1) See following page for definitions of the operational performance metrics. The operational performance goals set under the PG&E Corporation 2018 Short-Term Incentive Plan (“STIP”) are based on the same operational metrics and targets. (1) The 2018 target for non-GAAP earnings from operations is not publicly reported. (2) Safe Driving Rate results will be reported on an annual basis. 22
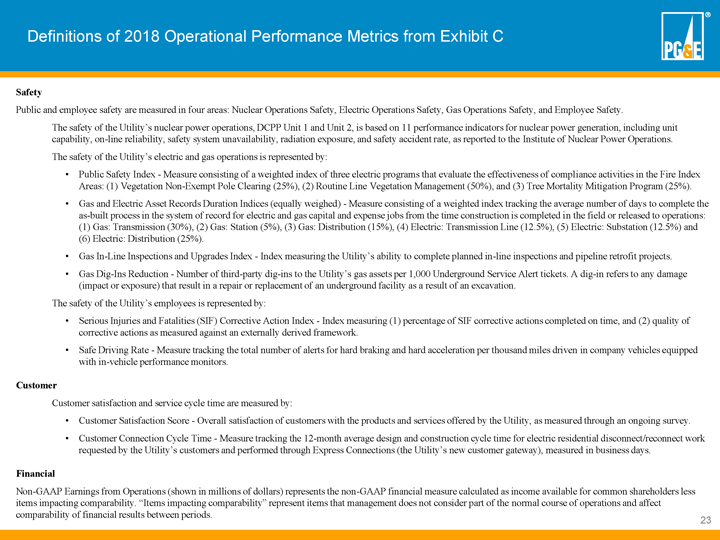
Definitions of 2018 Operational Performance Metrics from Exhibit C Safety Public and employee safety are measured in four areas: Nuclear Operations Safety, Electric Operations Safety, Gas Operations Safety, and Employee Safety. The safety of the Utility’s nuclear power operations, DCPP Unit 1 and Unit 2, is based on 11 performance indicators for nuclear power generation, including unit capability, on-line reliability, safety system unavailability, radiation exposure, and safety accident rate, as reported to the Institute of Nuclear Power Operations. The safety of the Utility’s electric and gas operations is represented by: • Public Safety Index - Measure consisting of a weighted index of three electric programs that evaluate the effectiveness of compliance activities in the Fire Index Areas: (1) Vegetation Non-Exempt Pole Clearing (25%), (2) Routine Line Vegetation Management (50%), and (3) Tree Mortality Mitigation Program (25%). • Gas and Electric Asset Records Duration Indices (equally weighed) - Measure consisting of a weighted index tracking the average number of days to complete the as-built process in the system of record for electric and gas capital and expense jobs from the time construction is completed in the field or released to operations: (1) Gas: Transmission (30%), (2) Gas: Station (5%), (3) Gas: Distribution (15%), (4) Electric: Transmission Line (12.5%), (5) Electric: Substation (12.5%) and (6) Electric: Distribution (25%). • Gas In-Line Inspections and Upgrades Index - Index measuring the Utility’s ability to complete planned in-line inspections and pipeline retrofit projects. • Gas Dig-Ins Reduction - Number of third-party dig-ins to the Utility’s gas assets per 1,000 Underground Service Alert tickets. A dig-in refers to any damage (impact or exposure) that result in a repair or replacement of an underground facility as a result of an excavation. The safety of the Utility’s employees is represented by: • Serious Injuries and Fatalities (SIF) Corrective Action Index - Index measuring (1) percentage of SIF corrective actions completed on time, and (2) quality of corrective actions as measured against an externally derived framework. • Safe Driving Rate - Measure tracking the total number of alerts for hard braking and hard acceleration per thousand miles driven in company vehicles equipped with in-vehicle performance monitors. Customer Customer satisfaction and service cycle time are measured by: • Customer Satisfaction Score - Overall satisfaction of customers with the products and services offered by the Utility, as measured through an ongoing survey. • Customer Connection Cycle Time - Measure tracking the 12-month average design and construction cycle time for electric residential disconnect/reconnect work requested by the Utility’s customers and performed through Express Connections (the Utility’s new customer gateway), measured in business days. Financial Non-GAAP Earnings from Operations (shown in millions of dollars) represents the non-GAAP financial measure calculated as income available for common shareholders less items impacting comparability. “Items impacting comparability” represent items that management does not consider part of the normal course of operations and affect comparability of financial results between periods. 23
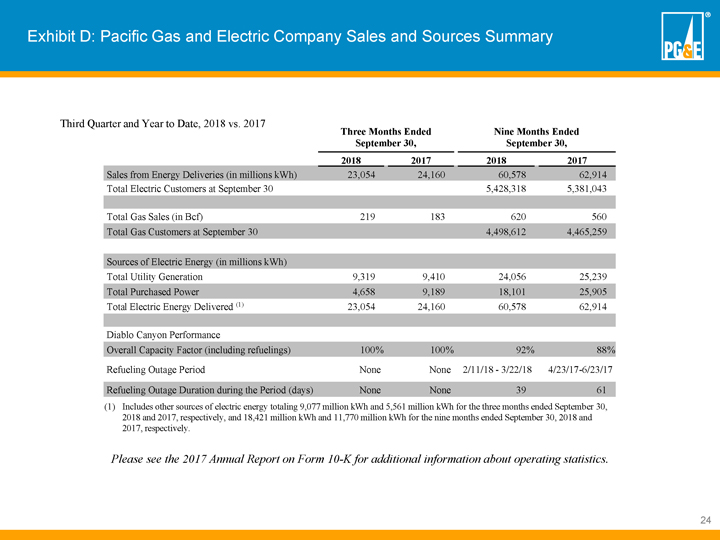
Exhibit D: Pacific Gas and Electric Company Sales and Sources Summary Third Quarter and Year to Date, 2018 vs. 2017 Three Months Ended Nine Months Ended September 30, September 30, 2018 2017 2018 2017 Sales from Energy Deliveries (in millions kWh) 23,054 24,160 60,578 62,914 Total Electric Customers at September 30 5,428,318 5,381,043 Total Gas Sales (in Bcf) 219 183 620 560 Total Gas Customers at September 30 4,498,612 4,465,259 Sources of Electric Energy (in millions kWh) Total Utility Generation 9,319 9,410 24,056 25,239 Total Purchased Power 4,658 9,189 18,101 25,905 Total Electric Energy Delivered (1) 23,054 24,160 60,578 62,914 Diablo Canyon Performance Overall Capacity Factor (including refuelings) 100% 100% 92% 88% Refueling Outage Period None None 2/11/18 - 3/22/18 4/23/17-6/23/17 Refueling Outage Duration during the Period (days) None None 39 61 (1) Includes other sources of electric energy totaling 9,077 million kWh and 5,561 million kWh for the three months ended September 30, 2018 and 2017, respectively, and 18,421 million kWh and 11,770 million kWh for the nine months ended September 30, 2018 and 2017, respectively. Please see the 2017 Annual Report on Form 10-K for additional information about operating statistics. 24
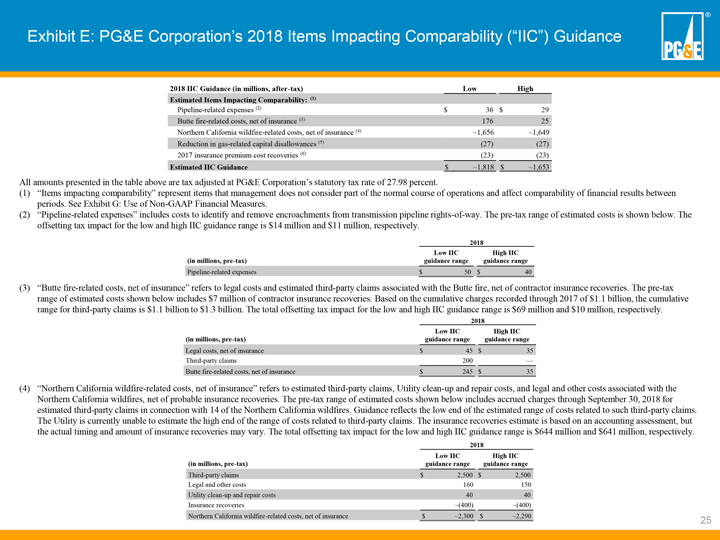
Exhibit E: PG&E Corporation’s 2018 Items Impacting Comparability (“IIC”) Guidance 2018 IIC Guidance (in millions, after-tax) Low High Estimated Items Impacting Comparability: (1) Pipeline-related expenses (2) $ 36 $ 29 Butte fire-related costs, net of insurance (3) 176 25 Northern California wildfire-related costs, net of insurance (4) ~1,656 ~1,649 Reduction in gas-related capital disallowances (5) (27) (27) 2017 insurance premium cost recoveries (6) (23) (23) Estimated IIC Guidance $ ~1,818 $ ~1,653 All amounts presented in the table above are tax adjusted at PG&E Corporation’s statutory tax rate of 27.98 percent. (1) “Items impacting comparability” represent items that management does not consider part of the normal course of operations and affect comparability of financial results between periods. See Exhibit G: Use of Non-GAAP Financial Measures. (2) “Pipeline-related expenses” includes costs to identify and remove encroachments from transmission pipeline rights-of-way. The pre-tax range of estimated costs is shown below. The offsetting tax impact for the low and high IIC guidance range is $14 million and $11 million, respectively. 2018 Low IIC High IIC (in millions, pre-tax) guidance range guidance range Pipeline-related expenses $ 50 $ 40 (3) “Butte fire-related costs, net of insurance” refers to legal costs and estimated third-party claims associated with the Butte fire, net of contractor insurance recoveries. The pre-tax range of estimated costs shown below includes $7 million of contractor insurance recoveries. Based on the cumulative charges recorded through 2017 of $1.1 billion, the cumulative range for third-party claims is $1.1 billion to $1.3 billion. The total offsetting tax impact for the low and high IIC guidance range is $69 million and $10 million, respectively. 2018 Low IIC High IIC (in millions, pre-tax) guidance range guidance range Legal costs, net of insurance $ 45 $ 35 Third-party claims 200 Butte fire-related costs, net of insurance $ 245 $ 35 (4) “Northern California wildfire-related costs, net of insurance” refers to estimated third-party claims, Utility clean-up and repair costs, and legal and other costs associated with the Northern California wildfires, net of probable insurance recoveries. The pre-tax range of estimated costs shown below includes accrued charges through September 30, 2018 for estimated third-party claims in connection with 14 of the Northern California wildfires. Guidance reflects the low end of the estimated range of costs related to such third-party claims. The Utility is currently unable to estimate the high end of the range of costs related to third-party claims. The insurance recoveries estimate is based on an accounting assessment, but the actual timing and amount of insurance recoveries may vary. The total offsetting tax impact for the low and high IIC guidance range is $644 million and $641 million, respectively. 2018 Low IIC High IIC (in millions, pre-tax) guidance range guidance range Third-party claims $ 2,500 $ 2,500 Legal and other costs 160 150 Utility clean-up and repair costs 40 40 Insurance recoveries ~(400) ~(400) Northern California wildfire-related costs, net of insurance $ ~2,300 $ ~2,290 25
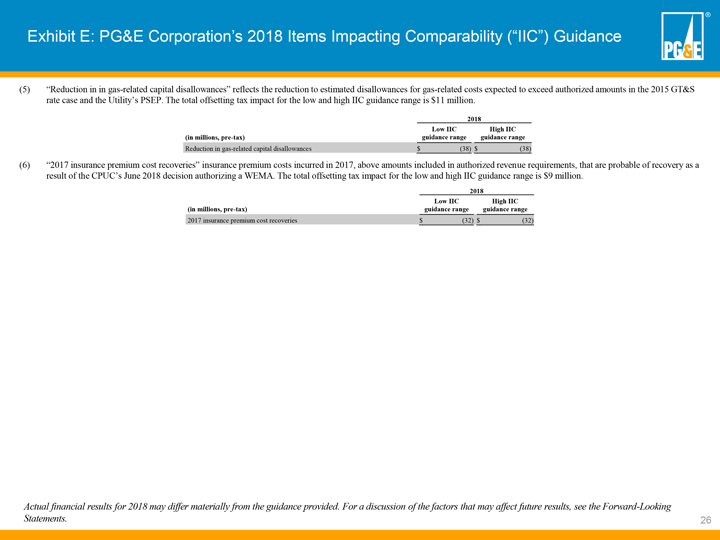
Exhibit E: PG&E Corporation’s 2018 Items Impacting Comparability (“IIC”) Guidance (5) “Reduction in in gas-related capital disallowances” reflects the reduction to estimated disallowances for gas-related costs expected to exceed authorized amounts in the 2015 GT&S rate case and the Utility’s PSEP. The total offsetting tax impact for the low and high IIC guidance range is $11 million. 2018 Low IIC High IIC (in millions, pre-tax) guidance range guidance range Reduction in gas-related capital disallowances $ (38) $ (38) (6) “2017 insurance premium cost recoveries” insurance premium costs incurred in 2017, above amounts included in authorized revenue requirements, that are probable of recovery as a result of the CPUC’s June 2018 decision authorizing a WEMA. The total offsetting tax impact for the low and high IIC guidance range is $9 million. 2018 Low IIC High IIC (in millions, pre-tax) guidance range guidance range 2017 insurance premium cost recoveries $ (32) $ (32) Actual financial results for 2018 may differ materially from the guidance provided. For a discussion of the factors that may affect future results, see the Forward-Looking Statements. 26
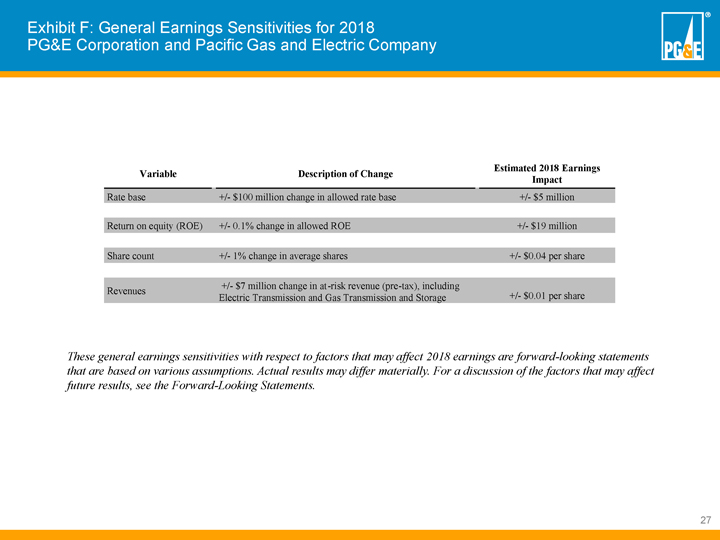
Exhibit F: General Earnings Sensitivities for 2018 PG&E Corporation and Pacific Gas and Electric Company Estimated 2018 Earnings Variable Description of Change Impact Rate base +/- $100 million change in allowed rate base +/- $5 million Return on equity (ROE) +/- 0.1% change in allowed ROE +/- $19 million Share count +/- 1% change in average shares +/- $0.04 per share +/- $7 million change in at-risk revenue (pre-tax), including Revenues Electric Transmission and Gas Transmission and Storage +/- $0.01 per share These general earnings sensitivities with respect to factors that may affect 2018 earnings are forward-looking statements that are based on various assumptions. Actual results may differ materially. For a discussion of the factors that may affect future results, see the Forward-Looking Statements. 27
Exhibit G: Use of Non-GAAP Financial Measures PG&E Corporation and Pacific Gas and Electric Company: Use of Non-GAAP Financial Measures PG&E Corporation discloses historical financial results and provides guidance based on “non-GAAP earnings from operations” in order to provide a measure that allows investors to compare the underlying financial performance of the business from one period to another, exclusive of items impacting comparability. “Non-GAAP earnings from operations” is a non-GAAP financial measure and is calculated as income available for common shareholders less items impacting comparability. “Items impacting comparability” represent items that management does not consider part of the normal course of operations and affect comparability of financial results between periods, including Northern California wildfire- and Butte fire-related costs, net of insurance, pipeline-related expenses, reduction in gas-related capital disallowances, 2017 insurance premium cost recoveries, fines and penalties, Diablo Canyon settlement-related disallowance, legal and regulatory-related expenses, GT&S revenue timing impact, and net benefit from derivative litigation settlement. PG&E Corporation uses non-GAAP earnings from operations to understand and compare operating results across reporting periods for various purposes including internal budgeting and forecasting, short- and long-term operating planning, and employee incentive compensation. PG&E Corporation believes that non-GAAP earnings from operations provide additional insight into the underlying trends of the business, allowing for a better comparison against historical results and expectations for future performance. Non-GAAP earnings from operations are not a substitute or alternative for GAAP measures such as consolidated income available for common shareholders and may not be comparable to similarly titled measures used by other companies. 28
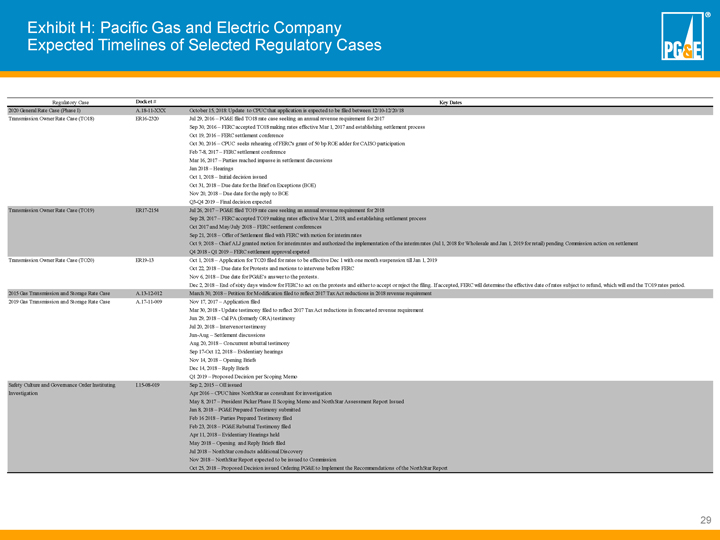
Exhibit H: Pacific Gas and Electric Company Expected Timelines of Selected Regulatory Cases Regulatory Case Docket # Key Dates 2020 General Rate Case (Phase I) A.18-11-XXX October 15, 2018: Update to CPUC that application is expected to be filed between 12/10-12/20/18 Transmission Owner Rate Case (TO18) ER16-2320 Jul 29, 2016 – PG&E filed TO18 rate case seeking an annual revenue requirement for 2017 Sep 30, 2016 – FERC accepted TO18 making rates effective Mar 1, 2017 and establishing settlement process Oct 19, 2016 – FERC settlement conference Oct 30, 2016 – CPUC seeks rehearing of FERC’s grant of 50 bp ROE adder for CAISO participation Feb 7-8, 2017 – FERC settlement conference Mar 16, 2017 – Parties reached impasse in settlement discussions Jan 2018 – Hearings Oct 1, 2018 – Initial decision issued Oct 31, 2018 – Due date for the Brief on Exceptions (BOE) Nov 20, 2018 – Due date for the reply to BOE Q3-Q4 2019 – Final decision expected Transmission Owner Rate Case (TO19) ER17-2154 Jul 26, 2017 – PG&E filed TO19 rate case seeking an annual revenue requirement for 2018 Sep 28, 2017 – FERC accepted TO19 making rates effective Mar 1, 2018, and establishing settlement process Oct 2017 and May/July 2018 – FERC settlement conferences Sep 21, 2018 – Offer of Settlement filed with FERC with motion for interim rates Oct 9, 2018 – Chief ALJ granted motion for interim rates and authorized the implementation of the interim rates (Jul 1, 2018 for Wholesale and Jan 1, 2019 for retail) pending Commission action on settlement Q4 2018 - Q1 2019 – FERC settlement approval expeted Transmission Owner Rate Case (TO20) ER19-13 Oct 1, 2018 – Application for TO20 filed for rates to be effective Dec 1 with one month suspension till Jan 1, 2019 Oct 22, 2018 – Due date for Protests and motions to intervene before FERC Nov 6, 2018 – Due date for PG&E’s answer to the protests. Dec 2, 2018 – End of sixty days window for FERC to act on the protests and either to accept or reject the filing. If accepted, FERC will determine the effective date of rates subject to refund, which will end the TO19 rates period. 2015 Gas Transmission and Storage Rate Case A.13-12-012 March 30, 2018 – Petition for Modification filed to reflect 2017 Tax Act reductions in 2018 revenue requirement 2019 Gas Transmission and Storage Rate Case A.17-11-009 Nov 17, 2017 – Application filed Mar 30, 2018 - Update testimony filed to reflect 2017 Tax Act reductions in forecasted revenue requirement Jun 29, 2018 – Cal PA (formerly ORA) testimony Jul 20, 2018 – Intervenor testimony Jun-Aug – Settlement discussions Aug 20, 2018 – Concurrent rebuttal testimony Sep 17-Oct 12, 2018 – Evidentiary hearings Nov 14, 2018 – Opening Briefs Dec 14, 2018 – Reply Briefs Q1 2019 – Proposed Decision per Scoping Memo Safety Culture and Governance Order Instituting I.15-08-019 Sep 2, 2015 – OII issued Investigation Apr 2016 – CPUC hires NorthStar as consultant for investigation May 8, 2017 – President Picker Phase II Scoping Memo and NorthStar Assessment Report Issued Jan 8, 2018 – PG&E Prepared Testimony submitted Feb 16 2018 – Parties Prepared Testimony filed Feb 23, 2018 – PG&E Rebuttal Testimony filed Apr 11, 2018 – Evidentiary Hearings held May 2018 – Opening and Reply Briefs filed Jul 2018 – NorthStar conducts additional Discovery Nov 2018 – NorthStar Report expected to be issued to Commission Oct 25, 2018 – Proposed Decision issued Ordering PG&E to Implement the Recommendations of the NorthStar Report 29
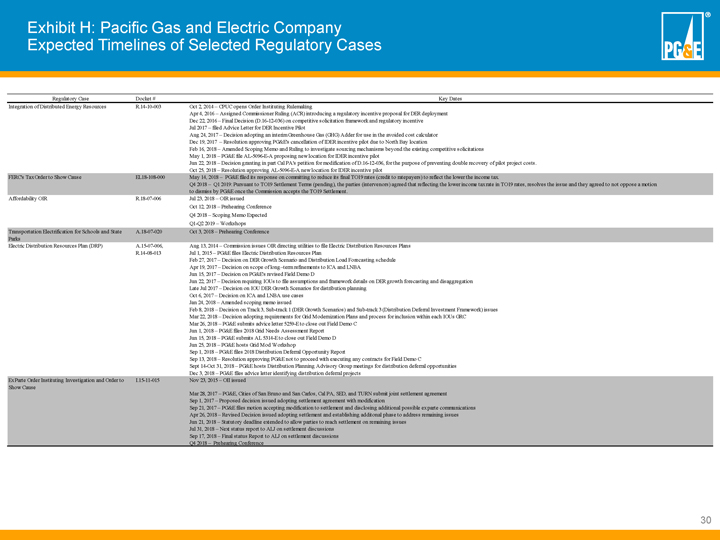
Exhibit H: Pacific Gas and Electric Company Expected Timelines of Selected Regulatory Cases Regulatory Case Docket # Key Dates Integration of Distributed Energy Resources R.14-10-003 Oct 2, 2014 – CPUC opens Order Instituting Rulemaking Apr 4, 2016 – Assigned Commissioner Ruling (ACR) introducing a regulatory incentive proposal for DER deployment Dec 22, 2016 – Final Decision (D.16-12-036) on competitive solicitation framework and regulatory incentive Jul 2017 – filed Advice Letter for DER Incentive Pilot Aug 24, 2017 – Decision adopting an interim Greenhouse Gas (GHG) Adder for use in the avoided cost calculator Dec 19, 2017 – Resolution approving PG&E’s cancellation of IDER incentive pilot due to North Bay location Feb 16, 2018 – Amended Scoping Memo and Ruling to investigate sourcing mechanisms beyond the existing competitive solicitations May 1, 2018 – PG&E file AL-5096-E-A proposing new location for IDER incentive pilot Jun 22, 2018 – Decision granting in part Cal PA’s petition for modification of D.16-12-036, for the purpose of preventing double recovery of pilot project costs. Oct 25, 2018 – Resolution approving AL-5096-E-A new location for IDER incentive pilot FERC’s Tax Order to Show Cause EL18-108-000 May 14, 2018 – PG&E filed its response on committing to reduce its final TO19 rates (credit to ratepayers) to reflect the lower the income tax. Q4 2018 – Q1 2019: Pursuant to TO19 Settlement Terms (pending), the parties (intervenors) agreed that reflecting the lower income tax rate in TO19 rates, resolves the issue and they agreed to not oppose a motion to dismiss by PG&E once the Commission accepts the TO19 Settlement. Affordability OIR R.18-07-006 Jul 23, 2018 – OIR issued Oct 12, 2018 – Prehearing Conference Q4 2018 – Scoping Memo Expected Q1-Q2 2019 – Workshops Transportation Electrification for Schools and State A.18-07-020 Oct 3, 2018 – Prehearing Conference Parks Electric Distribution Resources Plan (DRP) A.15-07-006, Aug 13, 2014 – Commission issues OIR directing utilities to file Electric Distribution Resources Plans R.14-08-013 Jul 1, 2015 – PG&E files Electric Distribution Resources Plan Feb 27, 2017 – Decision on DER Growth Scenario and Distribution Load Forecasting schedule Apr 19, 2017 – Decision on scope of long–term refinements to ICA and LNBA Jun 15, 2017 – Decision on PG&E’s revised Field Demo D Jun 22, 2017 – Decision requiring IOUs to file assumptions and framework details on DER growth forecasting and disaggregation Late Jul 2017 – Decision on IOU DER Growth Scenarios for distribution planning Oct 6, 2017 – Decision on ICA and LNBA use cases Jan 24, 2018 – Amended scoping memo issued Feb 8, 2018 – Decision on Track 3, Sub-track 1 (DER Growth Scenarios) and Sub-track 3 (Distribution Deferral Investment Framework) issues Mar 22, 2018 – Decision adopting requirements for Grid Modernization Plans and process for inclusion within each IOUs GRC Mar 26, 2018 – PG&E submits advice letter 5259-E to close out Field Demo C Jun 1, 2018 – PG&E files 2018 Grid Needs Assessment Report Jun 15, 2018 – PG&E submits AL 5314-E to close out Field Demo D Jun 25, 2018 – PG&E hosts Grid Mod Workshop Sep 1, 2018 – PG&E files 2018 Distribution Deferral Opportunity Report Sep 13, 2018 – Resolution approving PG&E not to proceed with executing any contracts for Field Demo C Sept 14-Oct 31, 2018 – PG&E hosts Distribution Planning Advisory Group meetings for distribution deferral opportunities Dec 3, 2018 – PG&E files advice letter identifying distribution deferral projects Ex Parte Order Instituting Investigation and Order to I.15-11-015 Nov 23, 2015 – OII issued Show Cause Mar 28, 2017 – PG&E, Cities of San Bruno and San Carlos, Cal PA, SED, and TURN submit joint settlement agreement Sep 1, 2017 – Proposed decision issued adopting settlement agreement with modification Sep 21, 2017 – PG&E files motion accepting modification to settlement and disclosing additional possible ex parte communications Apr 26, 2018 – Revised Decision issued adopting settlement and establishing additonal phase to address remaining issues Jun 21, 2018 – Statutory deadline extended to allow parties to reach settlement on remaining issues Jul 31, 2018 – Next status report to ALJ on settlement discussions Sep 17, 2018 – Final status Report to ALJ on settlement discussions Q4 2018 – Prehearing Conference 30
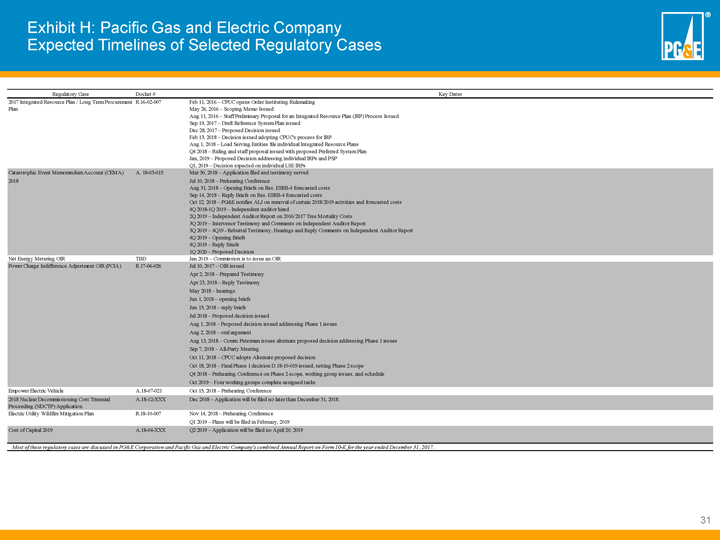
Exhibit H: Pacific Gas and Electric Company Expected Timelines of Selected Regulatory Cases Regulatory Case Docket # Key Dates 2017 Integrated Resource Plan / Long Term Procurement R.16-02-007 Feb 11, 2016 – CPUC opens Order Instituting Rulemaking Plan May 26, 2016 – Scoping Memo Issued Aug 11, 2016 – Staff Preliminary Proposal for an Integrated Resource Plan (IRP) Process Issued Sep 19, 2017 – Draft Reference System Plan issued Dec 28, 2017 – Proposed Decision issued Feb 13, 2018 – Decision issued adopting CPUC’s process for IRP Aug 1, 2018 – Load Serving Entities file individual Integrated Resource Plans Q4 2018 – Ruling and staff proposal issued with proposed Preferred System Plan Jan, 2019 – Proposed Decision addressing individual IRPs and PSP Q1, 2019 – Decision expected on individual LSE IRPs Catastrophic Event Memorandum Account (CEMA) A. 18-03-015 Mar 30, 2018 – Application filed and testimony served 2018 Jul 10, 2018 – Prehearing Conference Aug 31, 2018 – Opening Briefs on Res. ESRB-4 forecasted costs Sep 14, 2018 – Reply Briefs on Res. ESRB-4 forecasted costs Oct 12, 2018 – PG&E notifies ALJ on removal of certain 2018/2019 activities and forecasted costs 4Q 2018-1Q 2019 – Independent auditor hired 2Q 2019 – Independent Auditor Report on 2016/2017 Tree Mortality Costs 3Q 2019 – Intervenor Testimony and Comments on Independent Auditor Report 3Q 2019 – 4Q19 - Rebuttal Testimony, Hearings and Reply Comments on Independent Auditor Report 4Q 2019 – Opening Briefs 4Q 2019 – Reply Briefs 1Q 2020 – Proposed Decision Net Energy Metering OIR TBD Jan 2019 – Commission is to issue an OIR Power Charge Indifference Adjustment OIR (PCIA) R.17-06-026 Jul 10, 2017 – OIR issued Apr 2, 2018 – Prepared Testimony Apr 23, 2018 – Reply Testimony May 2018 – hearings Jun 1, 2018 – opening briefs Jun 15, 2018 – reply briefs Jul 2018 – Proposed decision issued Aug 1, 2018 – Proposed decision issued addressing Phase 1 issues Aug 2, 2018 – oral argument Aug 13, 2018 – Comm. Peterman issues alternate proposed decision addressing Phase 1 issues Sep 7, 2018 – All-Party Meeting Oct 11, 2018 – CPUC adopts Alternate proposed decision Oct 18, 2018 – Final Phase 1 decision D.18-10-019 issued, setting Phase 2 scope Q4 2018 – Prehearing Conference on Phase 2 scope, working group issues, and schedule Oct 2019 – Four working groups complete assigned tasks Empower Electric Vehicle A.18-07-021 Oct 15, 2018 – Prehearing Conference 2018 Nuclear Decommissioning Cost Triennial A.18-12-XXX Dec 2018 – Application will be filed no later than December 31, 2018. Proceeding (NDCTP) Application Electric Utility Wildfire Mitigation Plan R.18-10-007 Nov 14, 2018 – Prehearing Conference Q1 2019 – Plans will be filed in February, 2019 Cost of Capital 2019 A.18-04-XXX Q2 2019 – Application will be filed no April 20, 2019 Most of these regulatory cases are discussed in PG&E Corporation and Pacific Gas and Electric Company’s combined Annual Report on Form 10-K for the year ended December 31, 2017.