Form 8-K PennyMac Mortgage Invest For: Nov 01
UNITED STATES
SECURITIES AND EXCHANGE COMMISSION
Washington, D.C. 20549
FORM 8-K
CURRENT REPORT
Pursuant to Section 13 or 15(d) of the Securities Exchange Act of 1934
Date of Report (Date of earliest event reported): November 1, 2018
PennyMac Mortgage Investment Trust
(Exact name of registrant as specified in its charter)
|
Maryland |
001-34416 |
27-0186273 |
|
(State or other jurisdiction |
(Commission |
(IRS Employer |
|
of incorporation) |
File Number) |
Identification No.) |
|
3043 Townsgate Road, Westlake Village, California |
91361 |
|
(Address of principal executive offices) |
(Zip Code) |
(818) 224‑7442
(Registrant’s telephone number, including area code)
Not Applicable
(Former name or former address, if changed since last report)
Check the appropriate box below if the Form 8-K filing is intended to simultaneously satisfy the filing obligation of the registrant under any of the following provisions:
|
☐ |
Written communications pursuant to Rule 425 under the Securities Act (17 CFR 230.425) |
|
☐ |
Soliciting material pursuant to Rule 14a-12 under the Exchange Act (17 CFR 240.14a-12) |
|
☐ |
Pre-commencement communications pursuant to Rule 14d-2(b) under the Exchange Act (17 CFR 240.14d-2(b)) |
|
☐ |
Pre-commencement communications pursuant to Rule 13e-4(c) under the Exchange Act (17 CFR 240.13e-4(c)) |
Indicate by check mark whether the registrant is an emerging growth company as defined in Rule 405 of the Securities Act of 1933 (§230.405 of this chapter) or Rule 12b-2 of the Securities Exchange Act of 1934 (§240.12b-2 of this chapter).
Emerging growth company ☐
If an emerging growth company, indicate by check mark if the registrant has elected not to use the extended transition period for complying with any new or revised financial accounting standards provided pursuant to Section 13(a) of the Exchange Act. ☐
Item 2.02 Results of Operations and Financial Condition.
On November 1, 2018, PennyMac Mortgage Investment Trust (the “Company”) issued a press release announcing its financial results for the fiscal quarter ended September 30, 2018. A copy of the press release and the slide presentation used in connection with the Company’s recorded presentation of financial results were made available on November 1, 2018 and are furnished as Exhibit 99.1 and Exhibit 99.2, respectively.
The information in Item 2.02 of this report, including the exhibits hereto, shall not be deemed “filed” for purposes of Section 18 of the Securities Exchange Act of 1934, or otherwise subject to the liabilities of Section 18, nor shall it be deemed incorporated by reference into any disclosure document relating to the Company, except to the extent, if any, expressly set forth by specific reference in such filing.
Item 9.01 Financial Statements and Exhibits.
|
(d) |
Exhibits. |
|
Exhibit No. |
Description |
|
|
|
|
99.1 |
|
|
|
|
|
99.2 |
Pursuant to the requirements of the Securities Exchange Act of 1934, the registrant has duly caused this report to be signed on its behalf by the undersigned hereunto duly authorized.
|
|
PENNYMAC MORTGAGE INVESTMENT TRUST |
|
|
|
|
|
|
|
|
|
|
Dated: November 2, 2018 |
/s/ Andrew S. Chang |
|
|
Andrew S. Chang Senior Managing Director and Chief Financial Officer |
Exhibit 99.1

|
Media |
Investors |
|
Stephen Hagey |
Christopher Oltmann |
|
(805) 530-5817 |
(818) 224-7028 |
PennyMac Mortgage Investment Trust Reports
Third Quarter 2018 Results
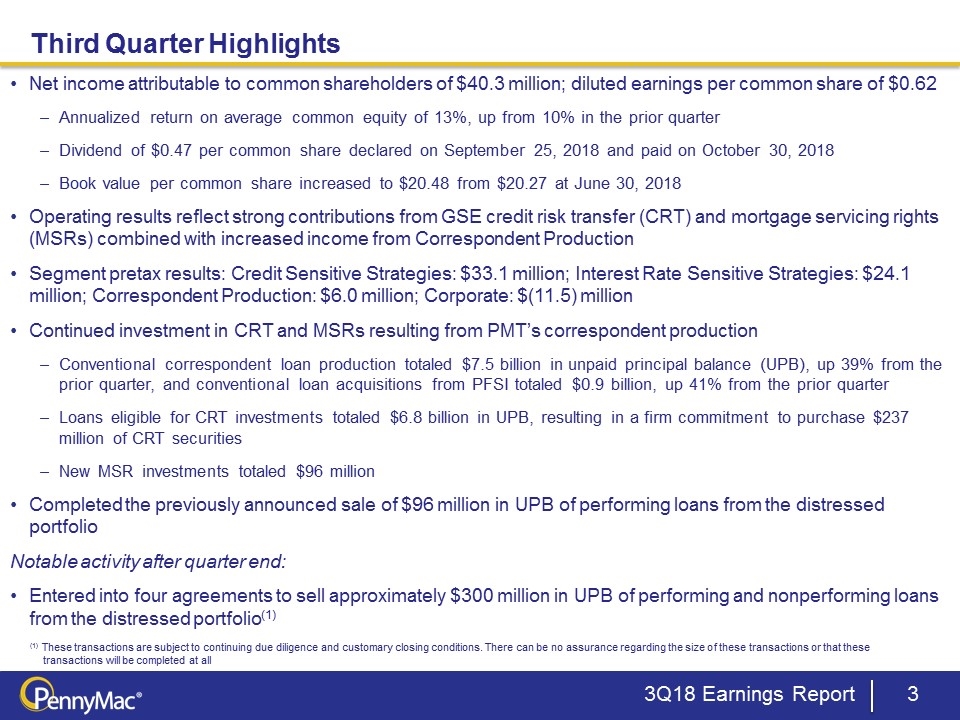
Westlake Village, CA, November 1, 2018 – PennyMac Mortgage Investment Trust (NYSE: PMT) today reported net income attributable to common shareholders of $40.3 million, or $0.62 per common share on a diluted basis for the third quarter of 2018, on net investment income of $108.5 million. PMT previously announced a cash dividend for the third quarter of 2018 of $0.47 per common share of beneficial interest, which was declared on September 25, 2018, and paid on October 30, 2018.
Third Quarter 2018 Highlights
Financial results:
|
|
• |
Net income attributable to common shareholders of $40.3 million, up from $30.2 million in the prior quarter |
|
|
• |
Diluted earnings per common share of $0.62, up 31 percent from the prior quarter |
|
|
• |
Book value per common share of $20.48 at September 30, 2018, up from $20.27 at June 30, 2018 |
|
|
• |
Annualized return on average common equity of 13 percent, up from 10 percent for the prior quarter1 |
|
|
1 |
Annualized return on average common equity is calculated based on annualized quarterly net income attributable to common shareholders as a percentage of monthly average common equity during the period. |
1
Investment and operating highlights:
|
|
• |
Continued investment in GSE credit risk transfer (CRT) and mortgage servicing rights (MSRs) resulting from PMT’s mortgage acquisitions |
|
|
o |
Correspondent production from nonaffiliates related to conventional conforming loans totaled $7.5 billion in unpaid principal balance (UPB), up 39 percent from the prior quarter |
|
|
o |
Loan acquisitions from PennyMac Financial Services, Inc. (NYSE: PFSI) totaled $0.9 billion in UPB, up 41 percent from the prior quarter |
|
|
o |
Loans eligible for CRT investments totaled $6.8 billion, resulting in a firm commitment to purchase $237 million of CRT securities |
|
|
o |
New MSR investments totaled $96 million |
Notable activity after quarter end:
|
|
• |
Entered into four agreements to sell approximately $300 million in UPB of performing and nonperforming loans from the distressed portfolio 2 |
“Our results this quarter reflect strong performance in our Credit Sensitive and Interest Rate Sensitive Strategies, and improved results from Correspondent Production,” said President and CEO David Spector. “The seasonal purchase market and our unique execution capabilities drove quarter-over-quarter volume increases in our Correspondent Production channel, with purchase mortgages representing 87 percent of our production, and accelerated growth in our organic investment strategies of CRT and MSRs. Those factors, combined with a continued strong credit environment, provided solid returns across each of our business segments. While third quarter results were adversely impacted by losses on the distressed loan portfolio, after quarter end we agreed to sell over $300 million in UPB of distressed loans, which should diminish their impact on earnings going forward. Overall, we are very pleased with this quarter’s results and the ability of PMT’s unique investment strategies to deliver attractive returns in the future.”
|
|
2 |
These transactions are subject to continuing due diligence and customary closing conditions. There can be no assurance regarding the size of these transactions or that these transactions will be completed at all. |
2
The following table presents the contributions of PMT’s segments, consisting of Correspondent Production, Credit Sensitive Strategies, Interest Rate Sensitive Strategies and Corporate:
|
|
|
Quarter ended September 30, 2018 |
|
|||||||||||||||||
|
|
|
Correspondent production |
|
|
Credit Sensitive strategies |
|
|
Interest rate sensitive strategies |
|
|
Corporate |
|
|
Total |
|
|||||
|
|
|
(in thousands) |
|
|||||||||||||||||
|
Net investment income: |
|
|
|
|
|
|
|
|
|
|
|
|
|
|
|
|
|
|
|
|
|
Net gain (loss) on investments |
|
|
|
|
|
|
|
|
|
|
|
|
|
|
|
|
|
|
|
|
|
Mortgage loans at fair value |
|
$ |
- |
|
|
$ |
(3,051 |
) |
|
$ |
- |
|
|
$ |
- |
|
|
$ |
(3,051 |
) |
|
Mortgage loans held by variable interest entity net of asset-backed secured financing |
|
|
- |
|
|
|
- |
|
|
|
(114 |
) |
|
|
- |
|
|
|
(114 |
) |
|
Mortgage-backed securities |
|
|
- |
|
|
|
(137 |
) |
|
|
(18,893 |
) |
|
|
- |
|
|
|
(19,030 |
) |
|
CRT Agreements |
|
|
- |
|
|
|
29,481 |
|
|
|
- |
|
|
|
- |
|
|
|
29,481 |
|
|
Hedging derivatives |
|
|
- |
|
|
|
- |
|
|
|
691 |
|
|
|
- |
|
|
|
691 |
|
|
Excess servicing spread investments |
|
|
- |
|
|
|
- |
|
|
|
1,706 |
|
|
|
- |
|
|
|
1,706 |
|
|
|
|
|
- |
|
|
|
26,293 |
|
|
|
(16,610 |
) |
|
|
- |
|
|
|
9,683 |
|
|
Net gain on mortgage loans acquired for sale |
|
|
12,496 |
|
|
|
12,314 |
|
|
|
- |
|
|
|
- |
|
|
|
24,810 |
|
|
Net mortgage loan servicing fees |
|
|
- |
|
|
|
5 |
|
|
|
44,389 |
|
|
|
- |
|
|
|
44,394 |
|
|
Net interest income (expense) |
|
|
|
|
|
|
|
|
|
|
|
|
|
|
|
|
|
|
|
|
|
Interest income |
|
|
22,465 |
|
|
|
8,675 |
|
|
|
30,573 |
|
|
|
611 |
|
|
|
62,324 |
|
|
Interest expense |
|
|
(12,708 |
) |
|
|
(8,792 |
) |
|
|
(25,109 |
) |
|
|
- |
|
|
|
(46,609 |
) |
|
|
|
|
9,757 |
|
|
|
(117 |
) |
|
|
5,464 |
|
|
|
611 |
|
|
|
15,715 |
|
|
Other income |
|
|
12,442 |
|
|
|
1,457 |
|
|
|
- |
|
|
|
- |
|
|
|
13,899 |
|
|
|
|
|
34,695 |
|
|
|
39,952 |
|
|
|
33,243 |
|
|
|
611 |
|
|
|
108,501 |
|
|
Expenses: |
|
|
|
|
|
|
|
|
|
|
|
|
|
|
|
|
|
|
|
|
|
Mortgage loan fulfillment and servicing fees payable to PennyMac Financial Services, Inc. |
|
|
26,256 |
|
|
|
1,271 |
|
|
|
8,800 |
|
|
|
- |
|
|
|
36,327 |
|
|
Management fees payable to PennyMac Financial Services, Inc. |
|
|
- |
|
|
|
- |
|
|
|
- |
|
|
|
6,482 |
|
|
|
6,482 |
|
|
Other |
|
|
2,485 |
|
|
|
5,619 |
|
|
|
344 |
|
|
|
5,582 |
|
|
|
14,030 |
|
|
|
|
|
28,741 |
|
|
|
6,890 |
|
|
|
9,144 |
|
|
|
12,064 |
|
|
|
56,839 |
|
|
Pretax income (loss) |
|
$ |
5,954 |
|
|
$ |
33,062 |
|
|
$ |
24,099 |
|
|
$ |
(11,453 |
) |
|
$ |
51,662 |
|
Credit Sensitive Strategies Segment
The Credit Sensitive Strategies segment primarily includes results from CRT, distressed mortgage loans and non-Agency subordinated bonds. Pretax income for the segment was $33.1 million on revenues of $40.0 million, compared to pretax income of $32.7 million on revenues of $37.4 million in the prior quarter.
Net gain on investments was $26.3 million, a decrease of 23 percent from the prior quarter.
3
Net gain on CRT investments was $29.5 million, compared to $38.5 million in the prior quarter driven by a reduced earnings contribution from market-driven value changes, partially offset by the growth in CRT investments.
PMT’s distressed mortgage loan portfolio generated realized and unrealized losses totaling $3.1 million, compared to $4.7 million of losses in the prior quarter.
The schedule below summarizes the (losses) gains on distressed mortgage loans:
|
|
|
Quarter ended |
|
|||||||||
|
|
|
September 30, 2018 |
|
|
June 30, 2018 |
|
|
September 30, 2017 |
|
|||
|
|
|
(in thousands) |
|
|||||||||
|
Valuation changes: |
|
|
|
|
|
|
|
|
|
|
|
|
|
Performing loans |
|
$ |
885 |
|
|
$ |
(4,437 |
) |
|
$ |
8,638 |
|
|
Nonperforming loans |
|
|
(2,026 |
) |
|
|
(409 |
) |
|
|
(5,841 |
) |
|
|
|
|
(1,141 |
) |
|
|
(4,846 |
) |
|
|
2,797 |
|
|
Gain on payoffs |
|
|
107 |
|
|
|
561 |
|
|
|
224 |
|
|
(Loss) gain on sale |
|
|
(2,017 |
) |
|
|
(416 |
) |
|
|
256 |
|
|
|
|
$ |
(3,051 |
) |
|
$ |
(4,701 |
) |
|
$ |
3,277 |
|
Fair value gains on performing loans in the distressed portfolio were $0.9 million while fair value losses on nonperforming loans were $2.0 million. Performing loans benefitted from improved reperformance during the quarter. Nonperforming loan losses resulted from the adverse valuation impact of higher projected costs of liquidation and protecting PMT’s lien interest (e.g., taxes, insurance, maintenance and legal fees). The nonperforming loan portfolio also incurred losses on sales of deeply delinquent loans.
The Credit Sensitive Strategies segment includes net gain on mortgage loans acquired for sale of $12.3 million, up from $4.4 million in the prior quarter, which represents the recognition of the fair value of firm commitments to acquire CRT securities under the new REMIC structure. The quarter-over-quarter increase was driven by three months of loan deliveries into the new structure this quarter, compared to one month in the prior quarter.
4
Net interest expense for the segment totaled $0.1 million, compared to $0.7 million in the prior quarter. Interest income totaled $8.7 million, a 1 percent decrease from the prior quarter, driven by a decrease in interest income from deposits securing CRT agreements, partially offset by an increase in capitalized interest from higher loan modification activity. Interest expense totaled $8.8 million, down 7 percent from the prior quarter, driven by lower financing costs related to the ongoing reduction of the distressed loan portfolio and real estate acquired upon settlement of loans (REO).
Other investment income was $1.5 million, compared to a loss of $0.4 million in the prior quarter driven by improved results from REO due to the ongoing distressed portfolio reductions. At quarter end, PMT’s inventory of REO properties totaled $95.6 million, down from $109.3 million at June 30, 2018.
Segment expenses were $6.9 million, a 46 percent increase from the prior quarter driven by higher professional services expense and activity fees paid to PFSI related to the settlement of a bulk distressed loan sale.
Interest Rate Sensitive Strategies Segment
The Interest Rate Sensitive Strategies segment includes results from investments in MSRs, excess servicing spread (ESS), Agency mortgage-backed securities (MBS), and non-Agency senior MBS and interest rate hedges. Pretax income for the segment was $24.1 million on revenues of $33.2 million, compared to pretax income of $16.4 million on revenues of $24.4 million in the prior quarter. The segment includes investments that typically have offsetting exposures to changes in interest rates. For example, in a period with increasing interest rates, MSRs and ESS typically gain in value whereas Agency MBS typically decline in value.
The results in the Interest Rate Sensitive Strategies segment consist of net gains and losses on investments, net interest income and net loan servicing fees, as well as associated expenses.
Net loss on investments for the segment totaled $16.6 million, primarily consisting of $18.9 million of losses on MBS, partially offset by $1.7 million in gains on ESS and $0.7 million in gains on hedging derivatives.
5
Net interest income for the segment was $5.5 million compared to $5.3 million in the prior quarter. Interest income totaled $30.6 million, a 20 percent increase from the prior quarter, primarily driven by growth in the MBS portfolio and placement fees on custodial deposits. Interest expense totaled $25.1 million, a 25 percent increase from the prior quarter primarily driven by higher interest rates and increased financing costs driven by the growth in investments.
Net mortgage loan servicing fees were $44.4 million, up from $27.6 million in the prior quarter. Net mortgage loan servicing fees included $49.9 million in servicing fees and $3.1 million in ancillary and other fees, reduced by $30.1 million in realization of MSR cashflows. Net mortgage loan servicing fees also included a $33.1 million increase in the value of MSRs, $12.1 million of related hedging losses and $0.6 million of MSR recapture income. PMT’s hedging activities are intended to manage the Company’s net exposure across all interest rate-sensitive strategies, which include MSRs, ESS and MBS.
The following schedule details net mortgage loan servicing fees:
|
|
|
Quarter ended |
|
|||||||||
|
|
|
September 30, 2018 |
|
|
June 30, 2018 |
|
|
September 30, 2017 |
|
|||
|
|
|
(in thousands) |
|
|||||||||
|
From non-affiliates: |
|
|
|
|
|
|
|
|
|
|
|
|
|
Servicing fees (1) |
|
$ |
49,864 |
|
|
$ |
48,667 |
|
|
$ |
42,237 |
|
|
Ancillary and other fees |
|
|
3,111 |
|
|
|
1,859 |
|
|
|
2,043 |
|
|
Effect of MSRs: |
|
|
|
|
|
|
|
|
|
|
|
|
|
Carried at fair value—change in fair value |
|
|
|
|
|
|
|
|
|
|
|
|
|
Realization of cashflows |
|
|
(30,053 |
) |
|
|
(27,997 |
) |
|
|
(2,628 |
) |
|
Other |
|
|
33,127 |
|
|
|
16,083 |
|
|
|
(1,349 |
) |
|
|
|
|
3,074 |
|
|
|
(11,914 |
) |
|
|
(3,977 |
) |
|
Loss on sale |
|
|
(123 |
) |
|
|
- |
|
|
|
- |
|
|
Carried at lower of amortized cost or fair value: |
|
|
|
|
|
|
|
|
|
|
|
|
|
Amortization |
|
|
- |
|
|
|
- |
|
|
|
(21,634 |
) |
|
Additions to impairment valuation allowance |
|
|
- |
|
|
|
- |
|
|
|
(1,702 |
) |
|
Gains (losses) on hedging derivatives |
|
|
(12,093 |
) |
|
|
(11,438 |
) |
|
|
4,576 |
|
|
|
|
|
(9,142 |
) |
|
|
(23,352 |
) |
|
|
(22,737 |
) |
|
|
|
|
43,833 |
|
|
|
27,174 |
|
|
|
21,543 |
|
|
From PFSI-MSR recpature income |
|
|
561 |
|
|
|
412 |
|
|
|
333 |
|
|
Net mortgage loan servicing fees |
|
$ |
44,394 |
|
|
$ |
27,586 |
|
|
$ |
21,876 |
|
Before January 1, 2018, PMT carried the majority of its MSRs at the lower of amortized cost or fair value. Beginning January 1, 2018 and prospectively, the Company accounts for all MSRs at fair value.
6
MSR valuation gains were primarily driven by higher mortgage rates, resulting in expectations for lower prepayment activity in the future. ESS valuation gains also benefitted from higher mortgage rates and include recapture income of $0.5 million from PFSI for prepayment activity during the quarter. When prepayment of a loan underlying PMT’s ESS results from refinancing by PFSI, PMT generally benefits from recapture income.
Segment expenses were $9.1 million, a 15 percent increase from the prior quarter, primarily driven by higher servicing expenses on a growing MSR portfolio.
Correspondent Production Segment
PMT acquires newly originated mortgage loans from correspondent sellers and typically sells or securitizes the loans, resulting in current-period income and ongoing investments in MSRs and CRT related to a portion of its production. PMT’s Correspondent Production segment generated pretax income of $6.0 million, up from $4.5 million in the prior quarter.
Through its correspondent production activities, PMT acquired $16.5 billion in UPB of loans and issued interest rate lock commitments totaling $17.7 billion in the third quarter, compared to $15.0 billion and $16.2 billion, respectively, in the prior quarter. Of the correspondent acquisitions, conventional conforming acquisitions from nonaffiliates totaled $7.5 billion and government-insured or guaranteed acquisitions totaled $9.0 billion, compared to $5.4 billion and $9.5 billion, respectively, in the prior quarter.
Segment revenues were $34.7 million, a 66 percent increase from the prior quarter. Segment revenues included a net gain on mortgage loans of $12.5 million, other income of $12.4 million, which primarily consists of volume-based origination fees, and net interest income of $9.8 million. Net gain on mortgage loans acquired for sale in the quarter increased 165 percent from the prior quarter, driven by PMT’s unique execution capabilities and improved market conditions during the quarter. Net interest income increased 34 percent from the prior quarter, primarily driven by volume growth and the recognition of incentives, which the Company is currently entitled to receive under one of its master repurchase agreements to finance mortgage loans that satisfy certain consumer relief characteristics. These incentives totaled $5.0 million, a 43 percent increase form the prior quarter. The master repurchase agreement is subject to a rolling six-month term through August 2019, unless terminated earlier at the option of the lender.
7
Segment expenses were $28.7 million, up 75 percent from the prior quarter, resulting from an $11.7 million increase in fulfillment fee expenses driven by the increase in conventional correspondent production volume and a higher weighted average fulfillment fee rate. The weighted average fulfillment fee rate in the third quarter was 35 basis points, up from 27 basis points in the prior quarter, reflecting lower discretionary reductions by PFSI to facilitate successful loan acquisitions by PMT.
Corporate Segment
The Corporate segment includes interest income from cash and short-term investments, management fees, and corporate expenses.
Segment revenues were $611,000, up from $349,000 in the prior quarter.
Management fees were $6.5 million, up 13 percent from the prior quarter primarily driven by $683,000 of incentive fees in the third quarter based on PMT’s performance.
Other segment expenses were $5.6 million, down from $5.9 million in the prior quarter.
Taxes
PMT recorded income tax expense of $5.1 million compared to $5.9 million of expense in the prior quarter.
***
“PMT’s unique investment strategies and capabilities to organically create attractive investments sourced from its loan production business are delivering strong returns,” said Executive Chairman Stanford L. Kurland. “Our correspondent business has delivered profitable volume growth this year, driving increased capital deployment into attractive CRT and MSR investments. Our new REMIC structure for CRT investments allows a greater percentage of loans to be eligible for CRT, further accelerating growth of this opportunity. Looking forward, we see tremendous opportunity in the mortgage market as we focus on product expansion in the prime non-Agency and HELOC markets to continue driving investment opportunities beyond CRT and MSRs while leveraging our mortgage market expertise and risk management capabilities.”
8
Management’s slide presentation will be available in the Investor Relations section of the Company’s website at www.pennymac-REIT.com beginning at 1:30 p.m. (Pacific Daylight Time) on Thursday, November 1, 2018.
About PennyMac Mortgage Investment Trust
PennyMac Mortgage Investment Trust is a mortgage real estate investment trust (REIT) that invests primarily in residential mortgage loans and mortgage-related assets. PMT is externally managed by PNMAC Capital Management, LLC, a controlled subsidiary of PennyMac Financial Services, Inc. (NYSE: PFSI). Additional information about PennyMac Mortgage Investment Trust is available at www.PennyMac-REIT.com.
This press release contains forward-looking statements within the meaning of Section 21E of the Securities Exchange Act of 1934, as amended, regarding management’s beliefs, estimates, projections and assumptions with respect to, among other things, the Company’s financial results, future operations, business plans and investment strategies, as well as industry and market conditions, all of which are subject to change. Words like “believe,” “expect,” “anticipate,” “promise,” “plan,” and other expressions or words of similar meanings, as well as future or conditional verbs such as “will,” “would,” “should,” “could,” or “may” are generally intended to identify forward-looking statements. Actual results and operations for any future period may vary materially from those projected herein and from past results discussed herein. Factors which could cause actual results to differ materially from historical results or those anticipated include, but are not limited to: changes in our investment objectives or investment or operational strategies, including any new lines of business or new products and services that may subject us to additional risks; volatility in our industry, the debt or equity markets, the general economy or the real estate finance and real estate markets specifically; events or circumstances which undermine confidence in the financial markets or otherwise have a broad impact on financial markets; changes in general business, economic, market, employment and political conditions, or in consumer confidence and spending habits from those expected; declines in real estate or significant changes in U.S. housing prices or activity in the U.S. housing market; the availability of, and level of competition for, attractive risk-adjusted investment opportunities in mortgage loans and mortgage-related assets that satisfy our investment objectives; the inherent difficulty in winning bids to acquire mortgage loans, and our success in doing so; the
9
concentration of credit risks to which we are exposed; the degree and nature of our competition; the availability, terms and deployment of short-term and long-term capital; the adequacy of our cash reserves and working capital; our ability to maintain the desired relationship between our financing and the interest rates and maturities of our assets; the timing and amount of cash flows, if any, from our investments; unanticipated increases or volatility in financing and other costs, including a rise in interest rates; the performance, financial condition and liquidity of borrowers; incomplete or inaccurate information or documentation provided by customers or counterparties, or adverse changes in the financial condition of our customers and counterparties; changes in the number of investor repurchases or indemnifications and our ability to obtain indemnification or demand repurchase from our correspondent sellers; increased rates of delinquency, default and/or decreased recovery rates on our investments; increased prepayments of the mortgages and other loans underlying our mortgage-backed securities or relating to our mortgage servicing rights, excess servicing spread and other investments; our exposure to market risk and declines in credit quality and credit spreads; the degree to which our hedging strategies may or may not protect us from interest rate volatility; the effect of the accuracy of or changes in the estimates we make about uncertainties, contingencies and asset and liability valuations when measuring and reporting upon our financial condition and results of operations; changes in regulations or the occurrence of other events that impact the business, operation or prospects of government sponsored enterprises; changes in government support of homeownership; changes in governmental regulations, accounting treatment, tax rates and similar matters; our ability to mitigate cybersecurity risks and cyber incidents; our exposure to risks of loss with real estate investments resulting from adverse weather conditions and man-made or natural disasters; our ability to satisfy complex rules in order to qualify as a REIT for U.S. federal income tax purposes; our ability to make distributions to our shareholders in the future; and our organizational structure and certain requirements in our charter documents. You should not place undue reliance on any forward-looking statement and should consider all of the uncertainties and risks described above, as well as those more fully discussed in reports and other documents filed by the Company with the Securities and Exchange Commission from time to time. The Company undertakes no obligation to publicly update or revise any forward-looking statements or any other information contained herein, and the statements made in this press release are current as of the date of this release only.
10
PENNYMAC MORTGAGE INVESTMENT TRUST AND SUBSIDIARIES
CONSOLIDATED BALANCE SHEETS (UNAUDITED)
|
|
|
September 30, 2018 |
|
|
June 30, 2018 |
|
|
September 30, 2017 |
|
|||
|
|
|
(in thousands except share information) |
|
|||||||||
|
ASSETS |
|
|
|
|
|
|
|
|
|
|
|
|
|
Cash |
|
$ |
88,929 |
|
|
$ |
63,035 |
|
|
$ |
99,515 |
|
|
Short-term investments |
|
|
26,736 |
|
|
|
39,484 |
|
|
|
5,646 |
|
|
Mortgage-backed securities at fair value |
|
|
2,126,507 |
|
|
|
1,698,322 |
|
|
|
1,036,669 |
|
|
Mortgage loans acquired for sale at fair value |
|
|
1,949,432 |
|
|
|
1,790,518 |
|
|
|
1,270,340 |
|
|
Mortgage loans at fair value |
|
|
633,168 |
|
|
|
749,445 |
|
|
|
1,347,943 |
|
|
Excess servicing spread purchased from PennyMac Financial Services, Inc. |
|
|
223,275 |
|
|
|
229,470 |
|
|
|
248,763 |
|
|
Firm commitment to purchase credit risk transfer security at fair value |
|
|
18,749 |
|
|
|
4,426 |
|
|
|
- |
|
|
Derivative assets |
|
|
143,577 |
|
|
|
133,239 |
|
|
|
67,288 |
|
|
Real estate acquired in settlement of loans |
|
|
95,605 |
|
|
|
109,271 |
|
|
|
185,034 |
|
|
Real estate held for investment |
|
|
45,971 |
|
|
|
46,431 |
|
|
|
42,546 |
|
|
Mortgage servicing rights |
|
|
1,109,741 |
|
|
|
1,010,507 |
|
|
|
790,335 |
|
|
Servicing advances |
|
|
48,056 |
|
|
|
53,340 |
|
|
|
61,826 |
|
|
Deposits securing credit risk transfer agreements |
|
|
662,624 |
|
|
|
651,204 |
|
|
|
545,694 |
|
|
Due from PennyMac Financial Services, Inc. |
|
|
2,351 |
|
|
|
4,010 |
|
|
|
4,725 |
|
|
Other assets |
|
|
92,857 |
|
|
|
94,147 |
|
|
|
78,719 |
|
|
Total assets |
|
$ |
7,267,578 |
|
|
$ |
6,676,849 |
|
|
$ |
5,785,043 |
|
|
LIABILITIES |
|
|
|
|
|
|
|
|
|
|
|
|
|
Assets sold under agreements to repurchase |
|
$ |
4,394,500 |
|
|
$ |
3,780,204 |
|
|
$ |
3,203,386 |
|
|
Mortgage loan participation and sale agreements |
|
|
31,578 |
|
|
|
87,751 |
|
|
|
43,988 |
|
|
Notes payable |
|
|
445,318 |
|
|
|
445,062 |
|
|
|
80,106 |
|
|
Asset-backed financing of a variable interest entity at fair value |
|
|
278,113 |
|
|
|
287,719 |
|
|
|
318,404 |
|
|
Exchangeable senior notes |
|
|
248,053 |
|
|
|
247,759 |
|
|
|
246,906 |
|
|
Assets sold to PennyMac Financial Services, Inc. under agreement to repurchase |
|
|
133,128 |
|
|
|
138,582 |
|
|
|
148,072 |
|
|
Interest-only security payable at fair value |
|
|
8,821 |
|
|
|
7,652 |
|
|
|
6,386 |
|
|
Derivative liabilities |
|
|
11,880 |
|
|
|
3,446 |
|
|
|
4,900 |
|
|
Accounts payable and accrued liabilities |
|
|
70,362 |
|
|
|
58,612 |
|
|
|
76,127 |
|
|
Due to PennyMac Financial Services, Inc. |
|
|
27,467 |
|
|
|
19,661 |
|
|
|
16,008 |
|
|
Income taxes payable |
|
|
52,382 |
|
|
|
47,289 |
|
|
|
20,148 |
|
|
Liability for losses under representations and warranties |
|
|
7,413 |
|
|
|
7,625 |
|
|
|
10,047 |
|
|
Total liabilities |
|
|
5,709,015 |
|
|
|
5,131,362 |
|
|
|
4,174,478 |
|
|
SHAREHOLDERS' EQUITY |
|
|
|
|
|
|
|
|
|
|
|
|
|
Preferred shares of beneficial interest |
|
|
299,707 |
|
|
|
299,707 |
|
|
|
299,707 |
|
|
Common shares of beneficial interest—authorized, 500,000,000 common shares of $0.01 par value; issued and outstanding 60,951,444, 60,950,754, and 65,875,618 common shares, respectively |
|
|
610 |
|
|
|
610 |
|
|
|
659 |
|
|
Additional paid-in capital |
|
|
1,284,537 |
|
|
|
1,282,971 |
|
|
|
1,362,319 |
|
|
Accumulated deficit |
|
|
(26,291 |
) |
|
|
(37,801 |
) |
|
|
(52,120 |
) |
|
Total shareholders' equity |
|
|
1,558,563 |
|
|
|
1,545,487 |
|
|
|
1,610,565 |
|
|
Total liabilities and shareholders' equity |
|
$ |
7,267,578 |
|
|
$ |
6,676,849 |
|
|
$ |
5,785,043 |
|
11
PENNYMAC MORTGAGE INVESTMENT TRUST AND SUBSIDIARIES
CONSOLIDATED STATEMENTS OF INCOME (UNAUDITED)
|
|
|
Quarter ended |
|
|||||||||
|
|
|
September 30, 2018 |
|
|
June 30, 2018 |
|
|
September 30, 2017 |
|
|||
|
|
|
(in thousands, except per share amounts) |
|
|||||||||
|
Net investment income |
|
|
|
|
|
|
|
|
|
|
|
|
|
Net mortgage loan servicing fees |
|
|
|
|
|
|
|
|
|
|
|
|
|
From nonaffiliates |
|
$ |
43,833 |
|
|
$ |
27,174 |
|
|
$ |
21,543 |
|
|
From PennyMac Financial Services, Inc. |
|
|
561 |
|
|
|
412 |
|
|
|
333 |
|
|
|
|
|
44,394 |
|
|
|
27,586 |
|
|
|
21,876 |
|
|
Net gain on mortgage loans acquired for sale |
|
|
|
|
|
|
|
|
|
|
|
|
|
From nonaffiliates |
|
|
22,121 |
|
|
|
6,251 |
|
|
|
14,692 |
|
|
From PennyMac Financial Services, Inc. |
|
|
2,689 |
|
|
|
2,891 |
|
|
|
3,275 |
|
|
|
|
|
24,810 |
|
|
|
9,142 |
|
|
|
17,967 |
|
|
Mortgage loan origination fees |
|
|
12,424 |
|
|
|
8,850 |
|
|
|
11,744 |
|
|
Net gain (loss) on investments: |
|
|
|
|
|
|
|
|
|
|
|
|
|
From nonaffiliates |
|
|
7,977 |
|
|
|
23,989 |
|
|
|
17,499 |
|
|
From PennyMac Financial Services, Inc. |
|
|
1,706 |
|
|
|
1,520 |
|
|
|
(3,665 |
) |
|
|
|
|
9,683 |
|
|
|
25,509 |
|
|
|
13,834 |
|
|
Interest income: |
|
|
|
|
|
|
|
|
|
|
|
|
|
From nonaffiliates |
|
|
58,584 |
|
|
|
48,434 |
|
|
|
47,579 |
|
|
From PennyMac Financial Services, Inc. |
|
|
3,740 |
|
|
|
3,910 |
|
|
|
3,998 |
|
|
|
|
|
62,324 |
|
|
|
52,344 |
|
|
|
51,577 |
|
|
Interest expense: |
|
|
|
|
|
|
|
|
|
|
|
|
|
To nonaffiliates |
|
|
44,797 |
|
|
|
38,167 |
|
|
|
38,161 |
|
|
To PennyMac Financial Services, Inc. |
|
|
1,812 |
|
|
|
1,898 |
|
|
|
2,116 |
|
|
|
|
|
46,609 |
|
|
|
40,065 |
|
|
|
40,277 |
|
|
Net interest income |
|
|
15,715 |
|
|
|
12,279 |
|
|
|
11,300 |
|
|
Results of real estate acquired in settlement of loans |
|
|
(310 |
) |
|
|
(2,297 |
) |
|
|
(3,143 |
) |
|
Other |
|
|
1,785 |
|
|
|
1,922 |
|
|
|
2,226 |
|
|
Net investment income |
|
|
108,501 |
|
|
|
82,991 |
|
|
|
75,804 |
|
|
Expenses |
|
|
|
|
|
|
|
|
|
|
|
|
|
Earned by PennyMac Financial Services, Inc.: |
|
|
|
|
|
|
|
|
|
|
|
|
|
Mortgage loan fulfillment fees |
|
|
26,256 |
|
|
|
14,559 |
|
|
|
23,507 |
|
|
Mortgage loan servicing fees (1) |
|
|
10,071 |
|
|
|
9,431 |
|
|
|
11,402 |
|
|
Management fees |
|
|
6,482 |
|
|
|
5,728 |
|
|
|
6,038 |
|
|
Mortgage loan collection and liquidation |
|
|
2,747 |
|
|
|
1,923 |
|
|
|
864 |
|
|
Professional services |
|
|
2,616 |
|
|
|
1,757 |
|
|
|
1,331 |
|
|
Compensation |
|
|
1,924 |
|
|
|
2,220 |
|
|
|
1,067 |
|
|
Real estate held for investment |
|
|
1,713 |
|
|
|
1,301 |
|
|
|
1,898 |
|
|
Mortgage loan origination |
|
|
2,136 |
|
|
|
1,572 |
|
|
|
2,230 |
|
|
Other |
|
|
2,894 |
|
|
|
2,214 |
|
|
|
3,301 |
|
|
Total expenses |
|
|
56,839 |
|
|
|
40,705 |
|
|
|
51,638 |
|
|
Income before provision for income taxes |
|
|
51,662 |
|
|
|
42,286 |
|
|
|
24,166 |
|
|
Provision for income taxes |
|
|
5,100 |
|
|
|
5,861 |
|
|
|
4,771 |
|
|
Net income |
|
|
46,562 |
|
|
|
36,425 |
|
|
|
19,395 |
|
|
Dividends on preferred shares |
|
|
6,235 |
|
|
|
6,234 |
|
|
|
6,125 |
|
|
Net income attributable to common shareholders |
|
$ |
40,327 |
|
|
$ |
30,191 |
|
|
$ |
13,270 |
|
|
Earnings per common share |
|
|
|
|
|
|
|
|
|
|
|
|
|
Basic |
|
$ |
0.66 |
|
|
$ |
0.49 |
|
|
$ |
0.20 |
|
|
Diluted |
|
$ |
0.62 |
|
|
$ |
0.47 |
|
|
$ |
0.20 |
|
|
Weighted-average common shares outstanding |
|
|
|
|
|
|
|
|
|
|
|
|
|
Basic |
|
|
60,950 |
|
|
|
60,903 |
|
|
|
66,636 |
|
|
Diluted |
|
|
69,417 |
|
|
|
69,370 |
|
|
|
66,636 |
|
|
Dividends declared per common share |
|
$ |
0.47 |
|
|
$ |
0.47 |
|
|
$ |
0.47 |
|
1 Mortgage loan servicing fees expense includes both special servicing for PMT’s distressed portfolio and subservicing for its mortgage servicing rights
12
PennyMac Mortgage Investment Trust November 1, 2018 Third Quarter 2018 Earnings Report Exhibit 99.2
3Q18 Earnings Report This presentation contains forward-looking statements within the meaning of Section 21E of the Securities Exchange Act of 1934, as amended, regarding management’s beliefs, estimates, projections and assumptions with respect to, among other things, the Company’s financial results, future operations, business plans and investment strategies, as well as industry and market conditions, all of which are subject to change. Words like “believe,” “expect,” “anticipate,” “promise,” “plan,” and other expressions or words of similar meanings, as well as future or conditional verbs such as “will,” “would,” “should,” “could,” or “may” are generally intended to identify forward-looking statements. Actual results and operations for any future period may vary materially from those projected herein, from past results discussed herein, or illustrative examples provided herein. Factors which could cause actual results to differ materially from historical results or those anticipated include, but are not limited to: changes in our investment objectives or investment or operational strategies, including any new lines of business or new products and services that may subject us to additional risks; volatility in our industry, the debt or equity markets, the general economy or the real estate finance and real estate markets specifically, whether the result of market events or otherwise; events or circumstances which undermine confidence in the financial markets or otherwise have a broad impact on financial markets, such as the sudden instability or collapse of large depository institutions or other significant corporations, terrorist attacks, natural or man-made disasters, or threatened or actual armed conflicts; changes in general business, economic, market, employment and political conditions, or in consumer confidence and spending habits from those expected; declines in real estate or significant changes in U.S. housing prices or activity in the U.S. housing market; the availability of, and level of competition for, attractive risk-adjusted investment opportunities in mortgage loans and mortgage-related assets that satisfy our investment objectives; the inherent difficulty in winning bids to acquire mortgage loans, and our success in doing so; the concentration of credit risks to which we are exposed; the degree and nature of our competition; our dependence on our manager and servicer, potential conflicts of interest with such entities and their affiliates, and the performance of such entities; changes in personnel and lack of availability of qualified personnel at our manager, servicer or their affiliates; the availability, terms and deployment of short-term and long-term capital; the adequacy of our cash reserves and working capital; our ability to maintain the desired relationship between our financing and the interest rates and maturities of our assets; the timing and amount of cash flows, if any, from our investments; unanticipated increases or volatility in financing and other costs, including a rise in interest rates; the performance, financial condition and liquidity of borrowers; the ability of our servicer, which also provides us with fulfillment services, to approve and monitor correspondent sellers and underwrite loans to investor standards; incomplete or inaccurate information or documentation provided by customers or counterparties, or adverse changes in the financial condition of our customers and counterparties; our indemnification and repurchase obligations in connection with mortgage loans we purchase and later sell or securitize; the quality and enforceability of the collateral documentation evidencing our ownership and rights in the assets in which we invest; increased rates of delinquency, default and/or decreased recovery rates on our investments; our ability to foreclose on our investments in a timely manner or at all; increased prepayments of the mortgages and other loans underlying our mortgage-backed securities or relating to our mortgage servicing rights , excess servicing spread and other investments; the degree to which our hedging strategies may or may not protect us from interest rate volatility; the effect of the accuracy of or changes in the estimates we make about uncertainties, contingencies and asset and liability valuations when measuring and reporting upon our financial condition and results of income; our failure to maintain appropriate internal controls over financial reporting; technologies for loans and our ability to mitigate security risks and cyber intrusions; our ability to obtain and/or maintain licenses and other approvals in those jurisdictions where required to conduct our business; our ability to detect misconduct and fraud; our ability to comply with various federal, state and local laws and regulations that govern our business; developments in the secondary markets for our mortgage loan products; legislative and regulatory changes that impact the mortgage loan industry or housing market; changes in regulations or the occurrence of other events that impact the business, operations or prospects of government agencies or government-sponsored entities, or such changes that increase the cost of doing business with such entities; the Dodd-Frank Wall Street Reform and Consumer Protection Act and its implementing regulations and regulatory agencies, and any other legislative and regulatory changes that impact the business, operations or governance of mortgage lenders and/or publicly-traded companies; the Consumer Financial Protection Bureau and its issued and future rules and the enforcement thereof; changes in government support of homeownership; changes in government or government-sponsored home affordability programs; limitations imposed on our business and our ability to satisfy complex rules for us to qualify as a real estate investment trust (REIT) for U.S. federal income tax purposes and qualify for an exclusion from the Investment Company Act of 1940 and the ability of certain of our subsidiaries to qualify as REITs or as taxable REIT subsidiaries for U.S. federal income tax purposes, as applicable, and our ability and the ability of our subsidiaries to operate effectively within the limitations imposed by these rules; changes in governmental regulations, accounting treatment, tax rates and similar matters (including changes to laws governing the taxation of REITs, or the exclusions from registration as an investment company); the effect of public opinion on our reputation; the occurrence of natural disasters or other events or circumstances that could impact our operations; and our organizational structure and certain requirements in our charter documents. You should not place undue reliance on any forward-looking statement and should consider all of the uncertainties and risks described above, as well as those more fully discussed in reports and other documents filed by the Company with the Securities and Exchange Commission from time to time. The Company undertakes no obligation to publicly update or revise any forward-looking statements or any other information contained herein, and the statements made in this presentation are current as of the date of this presentation only. Forward-Looking Statements
Third Quarter Highlights 3Q18 Earnings Report Net income attributable to common shareholders of $40.3 million; diluted earnings per common share of $0.62 Annualized return on average common equity of 13%, up from 10% in the prior quarter Dividend of $0.47 per common share declared on September 25, 2018 and paid on October 30, 2018 Book value per common share increased to $20.48 from $20.27 at June 30, 2018 Operating results reflect strong contributions from GSE credit risk transfer (CRT) and mortgage servicing rights (MSRs) combined with increased income from Correspondent Production Segment pretax results: Credit Sensitive Strategies: $33.1 million; Interest Rate Sensitive Strategies: $24.1 million; Correspondent Production: $6.0 million; Corporate: $(11.5) million Continued investment in CRT and MSRs resulting from PMT’s correspondent production Conventional correspondent loan production totaled $7.5 billion in unpaid principal balance (UPB), up 39% from the prior quarter, and conventional loan acquisitions from PFSI totaled $0.9 billion, up 41% from the prior quarter Loans eligible for CRT investments totaled $6.8 billion in UPB, resulting in a firm commitment to purchase $237 million of CRT securities New MSR investments totaled $96 million Completed the previously announced sale of $96 million in UPB of performing loans from the distressed portfolio Notable activity after quarter end: Entered into four agreements to sell approximately $300 million in UPB of performing and nonperforming loans from the distressed portfolio(1) (1) These transactions are subject to continuing due diligence and customary closing conditions. There can be no assurance regarding the size of these transactions or that these transactions will be completed at all

6 4 Current Market Environment 3Q18 Earnings Report The average rate on 30-year fixed rate mortgages increased 17 basis points over the quarter to 4.72%(1) Total mortgage originations are expected to remain flat at approximately $1.6 trillion in 2019 A strong U.S. economy and employment growth in key homebuying demographics is expected to drive growth in purchase originations Home sales have slowed recently as buyers adjust to higher mortgage rates, but are forecasted to increase in 2019 and 2020 On a national basis home price appreciation has been strong, driven by limited supply, but is expected to moderate Mortgage delinquency rates increased quarter-over-quarter, driven by seasonal factors and hurricane-related impacts The total U.S. loan delinquency rate was 3.97% as of September 30th, 2018, up from 3.74% at June 30th, 2018 but down from 4.40% at September 30th, 2017(3) Average 30-year fixed rate mortgage(2) 4.55% 4.72% Macroeconomic Forecasts(2) (1) Freddie Mac Primary Mortgage Market Survey. 4.86% as of 10/25/18 (2) Actual Mortgage Rates: Freddie Mac Primary Mortgage Market Survey. Forecasted Mortgage Rate 2019: Average of Mortgage Bankers Association, Fannie Mae, Freddie Mac. Actual Home Sales: National Association of Realtors (existing) and the Census Bureau (new). Home sales 2018-2019 Forecast: Average of Mortgage Bankers Association and Fannie Mae. Actual purchase originations: Inside Mortgage Finance. Purchase originations forecast 2018-2019: Average of Mortgage Bankers Association, Fannie Mae, Freddie Mac. All 2020 forecasts: Mortgage Bankers Association. Actual home price appreciation: FHFA Home Price Index. Forecasted home price appreciation: Mortgage Bankers Association (3) Black Knight Financial Services. Includes loans that are 30 days or more past due but not in foreclosure. 2015 2016 2017 2018E 2019E 2020E New home sales ('000s) 503 561 616 646 672 682 Existing home sales ('000s) 5,234 5,440 5,547 5,399 5,513 5,733 Total originations ($ in billions) $1,735 $2,065 $1,810 $1,640 $1,635 $1,683 Purchase originations $924 $1,037 $1,144 $1,185 $1,232 $1,273 ($ in billions) U.S. Home Price Appreciation 5.3% 5.8% 6.9% 5.8% 4.3% 2.9% (Y/Y % Change) 2015 2016 2017 2018E 2019E 2020E New home sales ('000s) 502.58 560.91666666666697 616.16666666666697 646 671.5 682 New Home Sales Existing Home Sales Total Average 30-yr Fixed Rate Mortgage Existing home sales ('000s) 5234 5440 5546.6666666666697 5398.8888888888896 5513 5733 2015 0.501 5.25 5.7510000000000003 Total originations ($ in billions) $1,735 $2,065 $1,810 $1,640 $1,635 $1,683 Purchase originations ($ in billions) $924 $1,037 $1,144 $1,185.2633333333333 $1,232.1666666666667 $1,273 2016 0.56091666666666673 5.44 6.0009166666666669 3.6540384615384613E-2 U.S. Home Price Appreciation(Y/Y % Change) 5.3% 5.8% 6.9% 5.8% 4.3% 2.9% 2017 0.61616666666666664 5.5466666666666669 6.1628333333333334 3.9898076923076925E-2 ` 2018YTD 0.638625 5.43 6.0686249999999999 4.4707499999999997E-2 2019E 0.66300000000000003 5.5720000000000001 6.2350000000000003 4.9666666666666699E-2 2020E 0.67800000000000005 5.68 6.3579999999999997 5.1999999999999998E-2
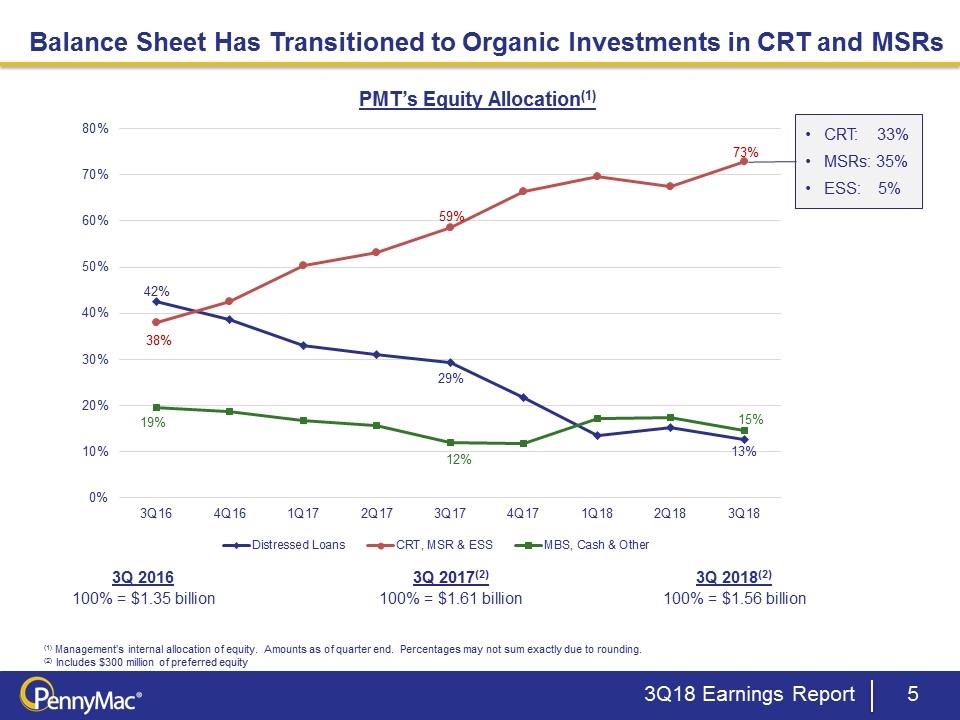
3Q 2016 100% = $1.35 billion 3Q 2018(2) 100% = $1.56 billion PMT’s Equity Allocation(1) (1) Management’s internal allocation of equity. Amounts as of quarter end. Percentages may not sum exactly due to rounding. (2) Includes $300 million of preferred equity 3Q 2017(2) 100% = $1.61 billion Balance Sheet Has Transitioned to Organic Investments in CRT and MSRs 3Q18 Earnings Report CRT: 33% MSRs: 35% ESS: 5%
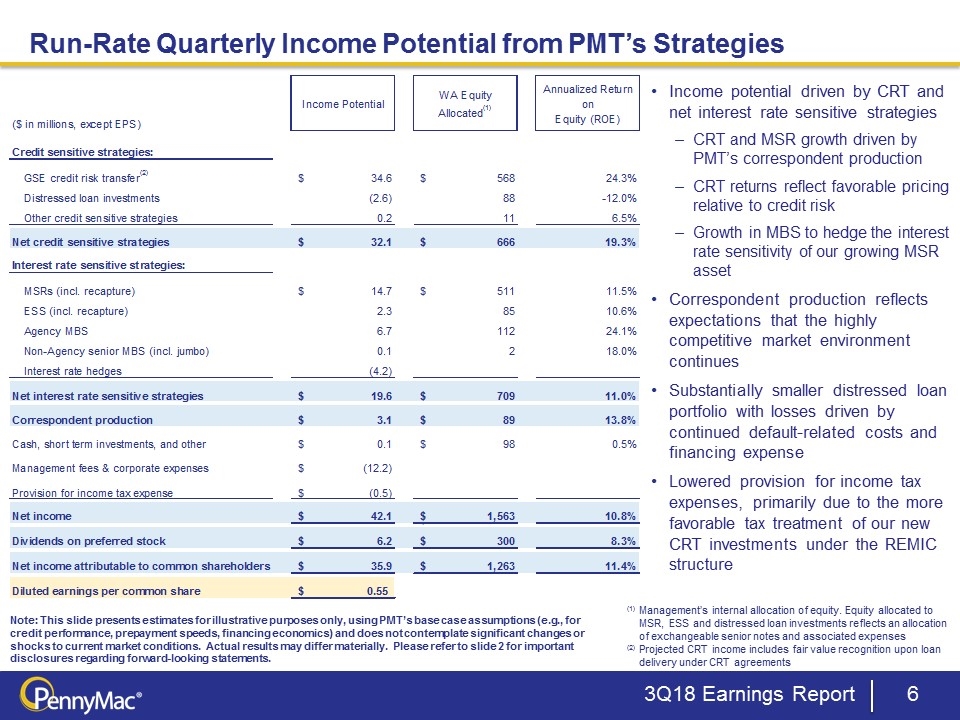
Note: This slide presents estimates for illustrative purposes only, using PMT’s base case assumptions (e.g., for credit performance, prepayment speeds, financing economics) and does not contemplate significant changes or shocks to current market conditions. Actual results may differ materially. Please refer to slide 2 for important disclosures regarding forward-looking statements. (1) Management’s internal allocation of equity. Equity allocated to MSR, ESS and distressed loan investments reflects an allocation of exchangeable senior notes and associated expenses (2) Projected CRT income includes fair value recognition upon loan delivery under CRT agreements Run-Rate Quarterly Income Potential from PMT’s Strategies 3Q18 Earnings Report Income potential driven by CRT and net interest rate sensitive strategies CRT and MSR growth driven by PMT’s correspondent production CRT returns reflect favorable pricing relative to credit risk Growth in MBS to hedge the interest rate sensitivity of our growing MSR asset Correspondent production reflects expectations that the highly competitive market environment continues Substantially smaller distressed loan portfolio with losses driven by continued default-related costs and financing expense Lowered provision for income tax expenses, primarily due to the more favorable tax treatment of our new CRT investments under the REMIC structure WA Equity Annualized Return Income Potential on Allocated(1) ($ in millions, except EPS) Equity (ROE) Credit sensitive strategies: GSE credit risk transfer(2) $ 34.6 $ 568 24.3% Distressed loan investments (2.6) 88 -12.0% Other credit sensitive strategies 0.2 11 6.5% Net credit sensitive strategies $ 32.1 $ 666 19.3% Interest rate sensitive strategies: MSRs (incl. recapture) $ 14.7 $ 511 11.5% ESS (incl. recapture) 2.3 85 10.6% Agency MBS 6.7 112 24.1% Non-Agency senior MBS (incl. jumbo) 0.1 2 18.0% Interest rate hedges (4.2) Net interest rate sensitive strategies $ 19.6 $ 709 11.0% Correspondent production $ 3.1 $ 89 13.8% Cash, short term investments, and other $ 0.1 $ 98 0.5% Management fees & corporate expenses $ (12.2) Provision for income tax expense $ (0.5) Net income $ 42.1 $ 1,563 10.8% Dividends on preferred stock $ 6.2 $ 300 8.3% Net income attributable to common shareholders $ 35.9 $ 1,263 11.4% Diluted earnings per common share $ 0.55 Run-Rate Quarterly Income Potential (Q4 2018-Q3 2019 Avg) as of 10/24/18 ($ in millions, except EPS) Income Potential WA Equity Allocated(1) Annualized Return on Equity (ROE) Credit sensitive strategies: GSE credit risk transfer(2) $34,551,957.980284058 $,567,636,303.1541424 0.24347955052723819 Distressed loan investments $-2,649,827.3757960526 $88,023,917.246209651 -0.12041397196101973 Other credit sensitive strategies $,176,312.13413394 $10,832,061.750244321 6.5% Net credit sensitive strategies $32,078,442.604622137 $,666,492,282.1186824 0.19252101469376603 Interest rate sensitive strategies: MSRs (incl. recapture) $14,676,095.16770132 $,510,548,836.97607696 0.11498288863956665 ESS (incl. recapture) $2,262,773.970265029 $85,087,998.386045843 0.10637335526445368 Agency MBS $6,738,847.6261657458 $,111,763,754.78936493 0.24118186218299789 Non-Agency senior MBS (incl. jumbo) $73,752.907526353025 $1,639,084.4294517934 0.17998562173156718 Interest rate hedges $-4,177,196.9147966066 Net interest rate sensitive strategies $19,574,272.605930656 $,709,039,674.58093953 0.11042695244098745 Correspondent production $3,063,104.7647748818 $89,029,461.51401854 0.13762207379898095 Cash, short term investments, and other $,130,698.14853836951 $98,079,906.653542906 .5% Management fees & corporate expenses $,-12,246,636.496202284 Provision for income tax expense $-,502,824.54117139452 Net income $42,097,057.86492367 $1,562,641,324.2977526 0.10775871962917834 $0 Dividends on preferred stock $6,235,937.5 $,299,707,489.41000003 8.3% Net income attributable to common shareholders $35,861,119.586492367 $1,262,933,834.8877525 0.11358035898905074 Diluted earnings per common share $0.5518859854754764
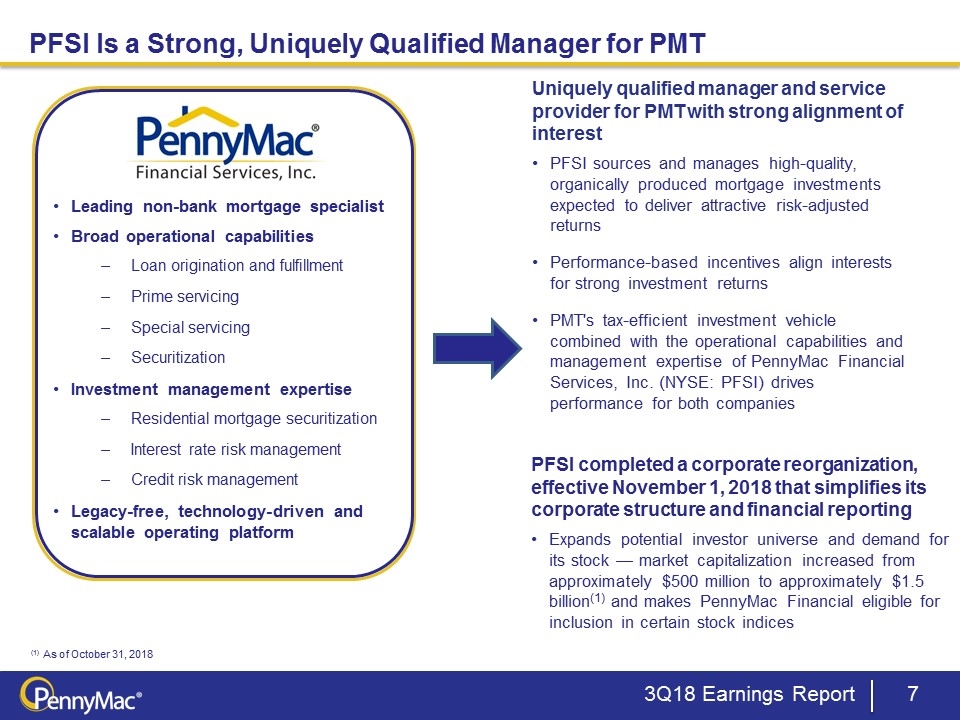
PFSI Is a Strong, Uniquely Qualified Manager for PMT 3Q18 Earnings Report Uniquely qualified manager and service provider for PMT with strong alignment of interest PFSI sources and manages high-quality, organically produced mortgage investments expected to deliver attractive risk-adjusted returns Performance-based incentives align interests for strong investment returns PMT's tax-efficient investment vehicle combined with the operational capabilities and management expertise of PennyMac Financial Services, Inc. (NYSE: PFSI) drives performance for both companies Leading non-bank mortgage specialist Broad operational capabilities Loan origination and fulfillment Prime servicing Special servicing Securitization Investment management expertise Residential mortgage securitization Interest rate risk management Credit risk management Legacy-free, technology-driven and scalable operating platform PFSI completed a corporate reorganization, effective November 1, 2018 that simplifies its corporate structure and financial reporting Expands potential investor universe and demand for its stock — market capitalization increased from approximately $500 million to approximately $1.5 billion(1) and makes PennyMac Financial eligible for inclusion in certain stock indices (1) As of October 31, 2018
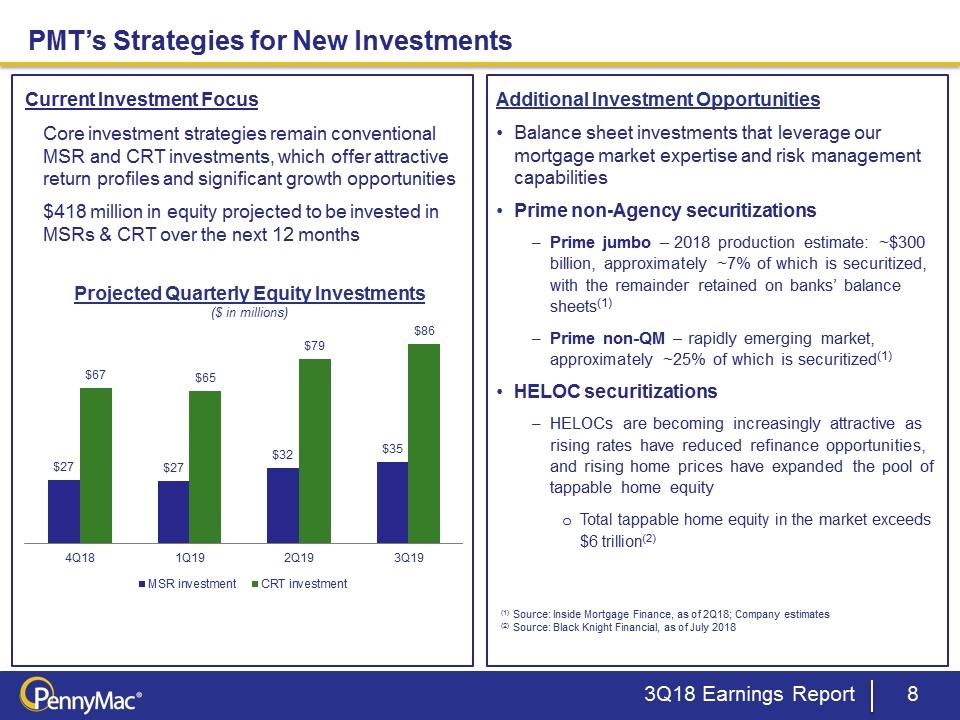
4 Projected Quarterly Equity Investments ($ in millions) PMT’s Strategies for New Investments 3Q18 Earnings Report Current Investment Focus Core investment strategies remain conventional MSR and CRT investments, which offer attractive return profiles and significant growth opportunities $418 million in equity projected to be invested in MSRs & CRT over the next 12 months Additional Investment Opportunities Balance sheet investments that leverage our mortgage market expertise and risk management capabilities Prime non-Agency securitizations Prime jumbo – 2018 production estimate: ~$300 billion, approximately ~7% of which is securitized, with the remainder retained on banks’ balance sheets(1) Prime non-QM – rapidly emerging market, approximately ~25% of which is securitized(1) HELOC securitizations HELOCs are becoming increasingly attractive as rising rates have reduced refinance opportunities, and rising home prices have expanded the pool of tappable home equity Total tappable home equity in the market exceeds $6 trillion(2) (1) Source: Inside Mortgage Finance, as of 2Q18; Company estimates (2) Source: Black Knight Financial, as of July 2018

Mortgage Investment Activities
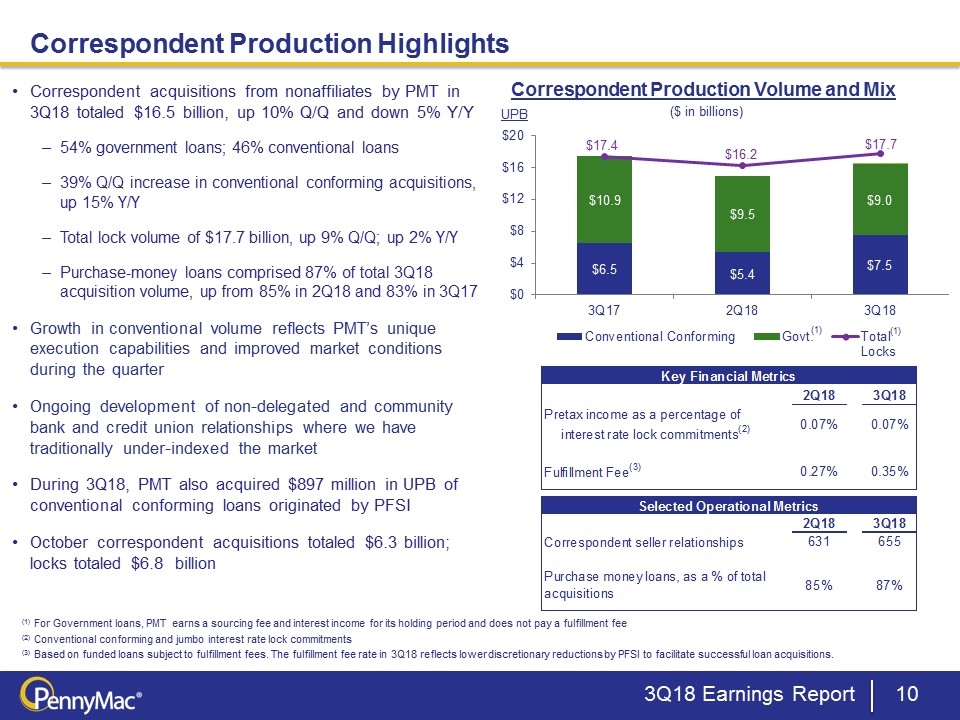
Correspondent Production Volume and Mix (1) For Government loans, PMT earns a sourcing fee and interest income for its holding period and does not pay a fulfillment fee (2) Conventional conforming and jumbo interest rate lock commitments (3) Based on funded loans subject to fulfillment fees. The fulfillment fee rate in 3Q18 reflects lower discretionary reductions by PFSI to facilitate successful loan acquisitions. ($ in billions) UPB (1) (1) Correspondent acquisitions from nonaffiliates by PMT in 3Q18 totaled $16.5 billion, up 10% Q/Q and down 5% Y/Y 54% government loans; 46% conventional loans 39% Q/Q increase in conventional conforming acquisitions, up 15% Y/Y Total lock volume of $17.7 billion, up 9% Q/Q; up 2% Y/Y Purchase-money loans comprised 87% of total 3Q18 acquisition volume, up from 85% in 2Q18 and 83% in 3Q17 Growth in conventional volume reflects PMT’s unique execution capabilities and improved market conditions during the quarter Ongoing development of non-delegated and community bank and credit union relationships where we have traditionally under-indexed the market During 3Q18, PMT also acquired $897 million in UPB of conventional conforming loans originated by PFSI October correspondent acquisitions totaled $6.3 billion; locks totaled $6.8 billion Correspondent Production Highlights 3Q18 Earnings Report Locks Key Financial Metrics 2Q18 3Q18 Pretax income as a percentage of 0.07% 0.07% interest rate lock commitments(2) Fulfillment Fee(3) 0.27% 0.35% Selected Operational Metrics 2Q18 3Q18 Correspondent seller relationships 631 655 Purchase money loans, as a % of total acquisitions 85% 87% Selected Operational Metrics $4.4000000000000004 Gov't 0.60273972602739723 1Q17 2Q17 $2.9 Fulfillment 0.39726027397260266 PCG Correspondent seller relationships 557 589 $7.3000000000000007 Purchase money loans, as a % of total acquisitions 0.72570000000000001 0.82 WA FICO 2Q17 3Q17 PCG Government-insured 694 693 Conventional 753 749 CRT Metrics ($ in millions) CDL WA FICO 2Q18 3Q18 2Q17 3Q17 CRT investment (non-REMIC) $770 $788.97799999999995 Government-insured 690 692 Commitment to fund CRT agreements $597.06600000000003 $578.50800000000004 Conventional 740 741 Firm commitment to purchase CRT securities $57.823 $294.69799999999998 Key Financial Metrics 2Q18 3Q18 PCG PTI 10.3 Pretax income as a percentage of interest rate lock commitments(2) 6.9999999999999999E-4 6.9999999999999999E-4 PCG conv IRLCs 8535.3469399999994 PTI as % of IRLCs 1.2067464945953329E-3 Fulfillment Fee(3) 2.7000000000000001E-3 3.5000000000000001E-3 Selected Operational Metrics 2Q18 3Q18 Correspondent seller relationships 631 655 Purchase money loans, as a % of total acquisitions 0.85 0.87
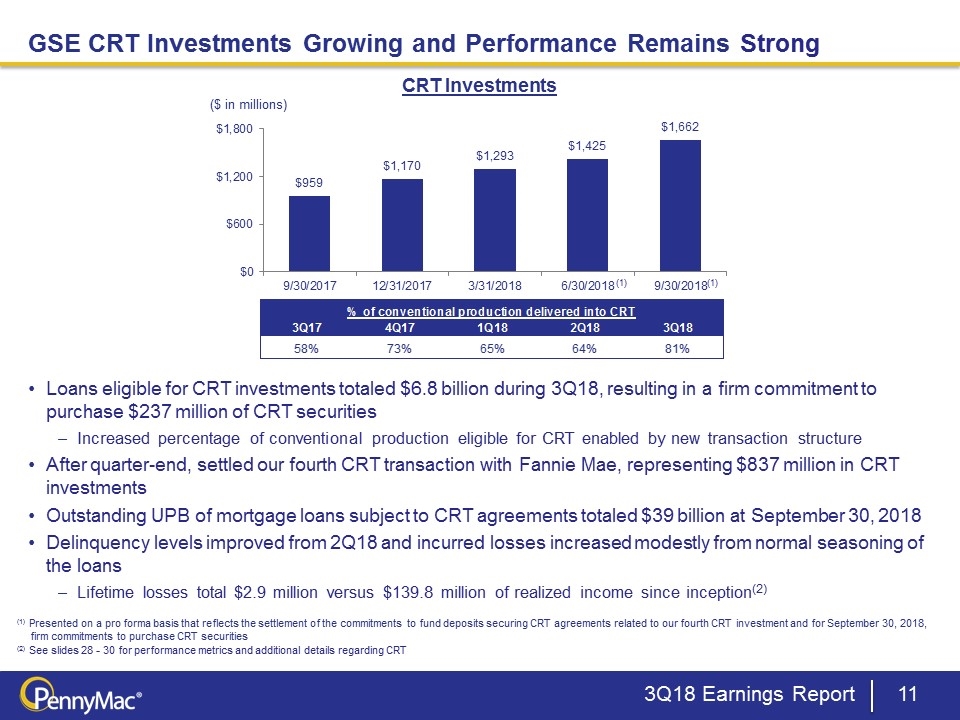
GSE CRT Investments Growing and Performance Remains Strong Loans eligible for CRT investments totaled $6.8 billion during 3Q18, resulting in a firm commitment to purchase $237 million of CRT securities Increased percentage of conventional production eligible for CRT enabled by new transaction structure After quarter-end, settled our fourth CRT transaction with Fannie Mae, representing $837 million in CRT investments Outstanding UPB of mortgage loans subject to CRT agreements totaled $39 billion at September 30, 2018 Delinquency levels improved from 2Q18 and incurred losses increased modestly from normal seasoning of the loans Lifetime losses total $2.9 million versus $139.8 million of realized income since inception(2) (1) Presented on a pro forma basis that reflects the settlement of the commitments to fund deposits securing CRT agreements related to our fourth CRT investment and for September 30, 2018, firm commitments to purchase CRT securities (2) See slides 28 - 30 for performance metrics and additional details regarding CRT CRT Investments 3Q18 Earnings Report ($ in millions) (1) (1) % of conventional production delivered into CRT 3Q17 4Q17 1Q18 2Q18 3Q18 58% 73% 65% 64% 81% 3Q17 4Q17 1Q18 2Q18 3Q18 Return Excluding Market-Driven Fair Value Changes 0.187 0.187 0.186 0.20300000000000001 0.20899999999999999 Return From Market-Driven Fair Value Changes 2.2% 0.48900000000000005 3.2% 0.183 0.13399999999999998 Total ROE 0.20899999999999999 0.67600000000000005 0.218 0.38600000000000001 0.34299999999999997 3Q17 4Q17 1Q18 2Q18 3Q18 % of conventional production delivered into CRT PCG conv $6,530.360000000001 $5,891.1504007399999 $4,225.6310000000003 $5,396.3696957799984 $7,500.8800168199896 3Q17 4Q17 1Q18 2Q18 3Q18 CDL conv $513.43499999999995 $645.765852 $707.89181599999995 $633.68352399999992 $827.61793922000004 0.58209936549749408 0.73429118783463709 0.64816172424805041 0.64335649445167331 0.80974838793342352 BDL Conv $3.5166300000000001 $31.904705000000003 $69.722358999999997 Total conv $7,043.4709999999995 $6,536.9162527400003 $4,937.394460000007 $6,061.9579247799984 $8,398.2203150399891 CRT deliverables 4100 4800 $3,200 $3,900 6800 3Q17 4Q17 1Q18 2Q18 3Q18 % of conventional production delivered into CRT 0.58209936549749408 0.73429118783463709 0.64816172424805041 0.64335649445167331 0.80969535745831656
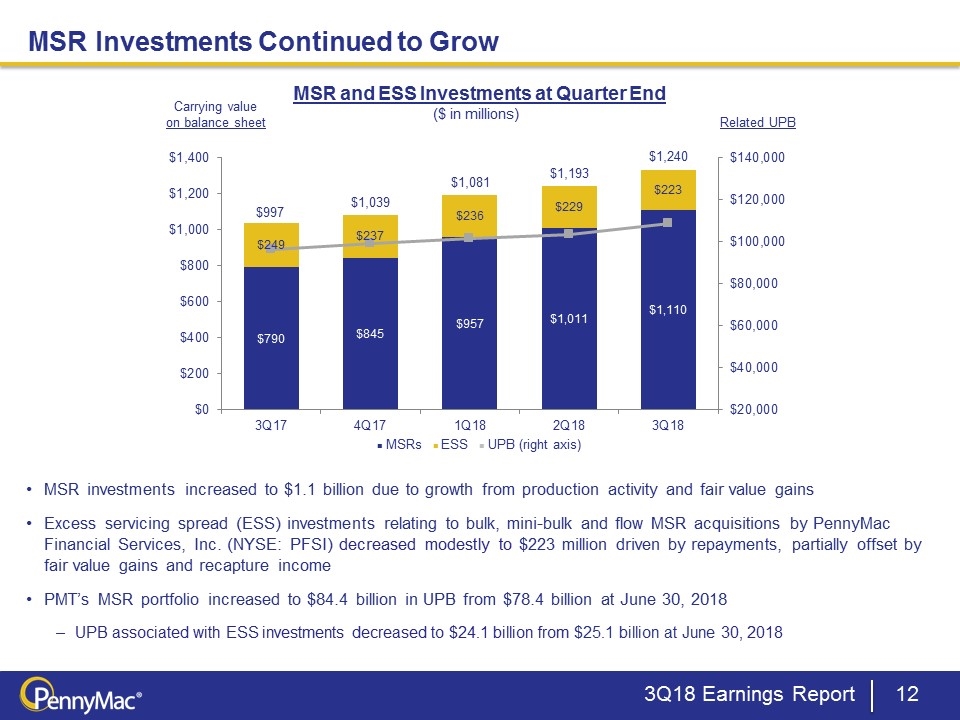
($ in millions) MSR investments increased to $1.1 billion due to growth from production activity and fair value gains Excess servicing spread (ESS) investments relating to bulk, mini-bulk and flow MSR acquisitions by PennyMac Financial Services, Inc. (NYSE: PFSI) decreased modestly to $223 million driven by repayments, partially offset by fair value gains and recapture income PMT’s MSR portfolio increased to $84.4 billion in UPB from $78.4 billion at June 30, 2018 UPB associated with ESS investments decreased to $24.1 billion from $25.1 billion at June 30, 2018 MSR and ESS Investments at Quarter End Carrying value on balance sheet Related UPB ■ MSRs ■ ESS ■ UPB (right axis) MSR Investments Continued to Grow 3Q18 Earnings Report
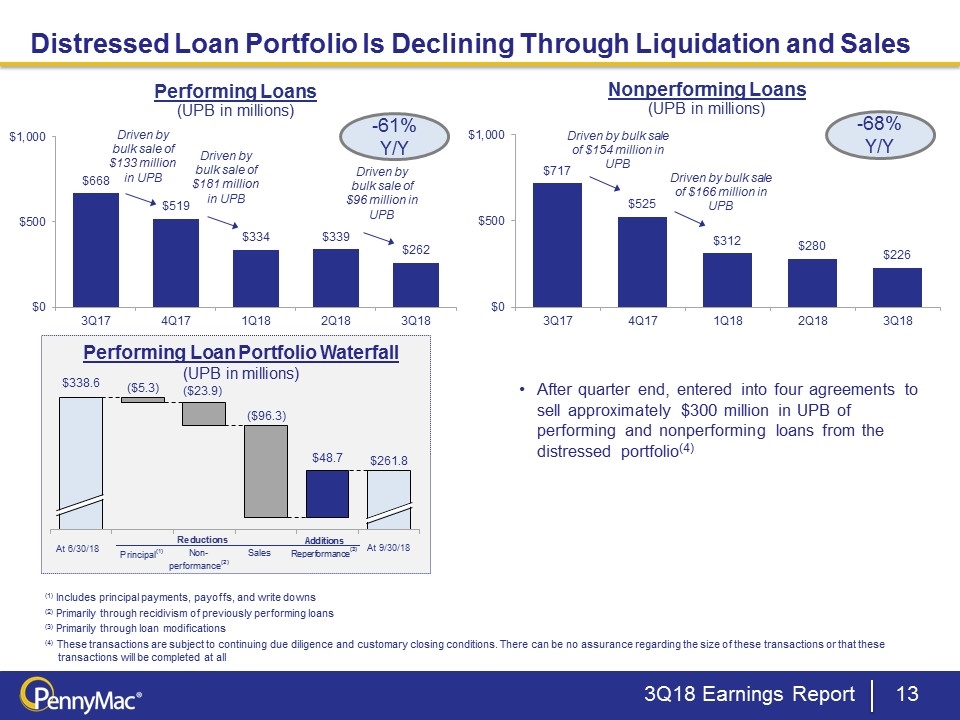
After quarter end, entered into four agreements to sell approximately $300 million in UPB of performing and nonperforming loans from the distressed portfolio(4) (1) Includes principal payments, payoffs, and write downs (2) Primarily through recidivism of previously performing loans (3) Primarily through loan modifications (4) These transactions are subject to continuing due diligence and customary closing conditions. There can be no assurance regarding the size of these transactions or that these transactions will be completed at all Performing Loan Portfolio Waterfall (UPB in millions) -68% Y/Y At 9/30/18 At 6/30/18 ($96.3) $261.8 Driven by bulk sale of $133 million in UPB Driven by bulk sale of $166 million in UPB Driven by bulk sale of $181 million in UPB Driven by bulk sale of $154 million in UPB Distressed Loan Portfolio Is Declining Through Liquidation and Sales $48.7 3Q18 Earnings Report Driven by bulk sale of $96 million in UPB -61% Y/Y Value Bounds Start End 0 0 $,111,611,716.76000001 $,161,902,183.62 $,273,513,900.38 $0.27351390038000001 194.4 185024614 182.1 6.7545304777594795E-2 306813148 Base Fall Rise Flow At 3/31/17 0 200000000 748757106 At 3/31/17 Payoffs/Pay downs/Write downs 185024614 14975386 0 -14975386 Payoffs/Pay downs/Write downs New Adds via Re-performance 185024614 0 121788534 121788534 New Adds via Re-performance Departures via Non-performance 254522741 52290407 0 -52290407 Departures via Non-performance At 6/30/17 254522741 At 6/30/17 748757106 -14975386 121788534 -52290407 803279847 733.78172000000006 681.4913130000001 Base Fall Rise At 3/31/17 0 0 748.75710600000002 Payoffs 733.78172000000006 14.975386 0 Non-performance 681.4913130000001 52.290407000000002 0 Re-performance 681.4913130000001 0 121.788534 At 6/30/17 803.27984700000013 -0.13867822318526546 7.2096128170894502E-2 Additions Performance(4) Reductions Payoffs Non-performance Sales Reductions Payoffs Non-performance Sales Reductions Principal(1) Non-performance(2) Sales Reductions Payoffs Non-performance(3) At 3/31/17 At 6/30/17 Value Bounds Start End 0 0 $,111,611,716.76000001 $,161,902,183.62 $,273,513,900.38 $0.27351390038000001 194.4 185024614 182.1 6.7545304777594795E-2 306813148 Base Fall Rise Flow At 3/31/17 0 200000000 748757106 At 3/31/17 Payoffs/Pay downs/Write downs 185024614 14975386 0 -14975386 Payoffs/Pay downs/Write downs New Adds via Re-performance 185024614 0 121788534 121788534 New Adds via Re-performance Departures via Non-performance 254522741 52290407 0 -52290407 Departures via Non-performance At 6/30/17 254522741 At 6/30/17 748757106 -14975386 121788534 -52290407 803279847 791.58929899999998 730.25556899999992 Base Fall Rise At 3/31/17 0 0 803.27984700000002 Payoffs 791.58929899999998 11.690548 0 791.58929899999998 Non-performance 730.25556899999992 61.333730000000003 0 730.25556899999992 585.38006799999994 144.87550100000001 585.38006799999994 Re-performance 585.38006799999994 0 82.269296999999995 At 6/30/17 667.64936499999999 585.38006799999994 -0.13867822318526546 7.2096128170894502E-2 Additions Reperformance(3) Reductions Payoffs Non-performance Sales Reductions Payoffs Non-performance Sales Reductions Payoffs(1) Non-performance(2) Sales(3) Reductions Payoffs Non-performance(3) At 3/31/17 At 6/30/17

Financial Results
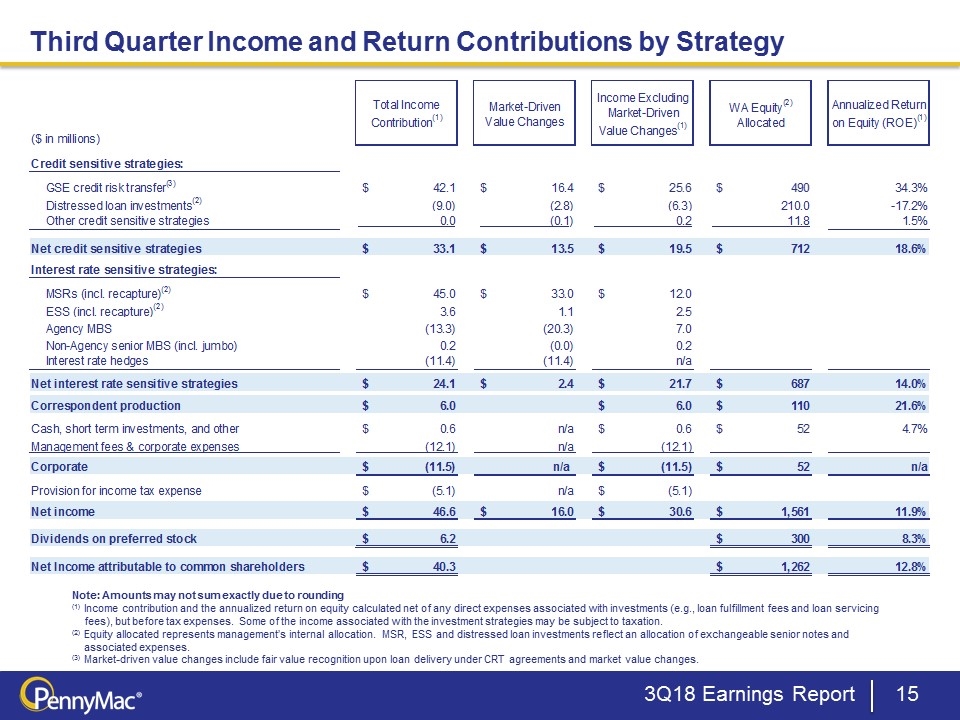
Note: Amounts may not sum exactly due to rounding (1) Income contribution and the annualized return on equity calculated net of any direct expenses associated with investments (e.g., loan fulfillment fees and loan servicing fees), but before tax expenses. Some of the income associated with the investment strategies may be subject to taxation. (2) Equity allocated represents management’s internal allocation. MSR, ESS and distressed loan investments reflect an allocation of exchangeable senior notes and associated expenses. (3) Market-driven value changes include fair value recognition upon loan delivery under CRT agreements and market value changes. Third Quarter Income and Return Contributions by Strategy 3Q18 Earnings Report Income Excluding Market-Driven Value Changes(1) Total Income Contribution(1) WA Equity(2) Allocated Annualized Return on Equity (ROE)(1) Market-Driven Value Changes(1) ($ in millions) Credit sensitive strategies: GSE credit risk transfer(3) $ 42.1 $ 16.4 $ 25.6 $ 490 34.3% Distressed loan investments(2) (9.0) (2.8) (6.3) 210.0 -17.2% Other credit sensitive strategies 0.0 (0.1) 0.2 11.8 1.5% Net credit sensitive strategies $ 33.1 $ 13.5 $ 19.5 $ 712 18.6% Interest rate sensitive strategies: MSRs (incl. recapture)(2) $ 45.0 $ 33.0 $ 12.0 ESS (incl. recapture)(2) 3.6 1.1 2.5 Agency MBS (13.3) (20.3) 7.0 Non-Agency senior MBS (incl. jumbo) 0.2 (0.0) 0.2 Interest rate hedges (11.4) (11.4) n/a Net interest rate sensitive strategies $ 24.1 $ 2.4 $ 21.7 $ 687 14.0% Correspondent production $ 6.0 $ 6.0 $ 110 21.6% Cash, short term investments, and other $ 0.6 n/a $ 0.6 $ 52 4.7% Management fees & corporate expenses (12.1) n/a (12.1) Corporate $ (11.5) n/a $ (11.5) $ 52 n/a Provision for income tax expense $ (5.1) n/a $ (5.1) Net income $ 46.6 $ 16.0 $ 30.6 $ 1,561 11.9% Dividends on preferred stock $ 6.2 $ 300 8.3% Net Income attributable to common shareholders $ 40.3 $ 1,262 12.8% Q3 2018 ($ in millions) Total Income Contribution(1) Market-Driven Value Changes Income Excluding Market-Driven Value Changes(1) WA Equity(2)Allocated Annualized Return on Equity (ROE)(1) Credit sensitive strategies: GSE credit risk transfer(3) $42,055,141.310000002 $16,411,514.609999998 $25,643,626.700000003 $,490,165,801.76499993 0.34319115008486445 $,215,138,011.87956327 Distressed loan investments(2) $-9,037,448.161435768 $-2,754,981 $-6,282,467.1614357689 $,209,988,141.52196211 -0.17215159096001742 Other credit sensitive strategies $43,756.2800929055 $-,133,467.80880000012 $,177,223.81160092916 $11,848,748.617760001 1.5% $,440,163,143.82723999 Net credit sensitive strategies $33,061,449.151365165 $13,523,065.801199997 $19,538,383.350165166 $,712,002,691.90472198 0.18573777614756179 Interest rate sensitive strategies: MSRs (incl. recapture)(2) $44,982,042.578726932 $33,004,038.719999999 $11,978,003.85872693 $,509,264,682.9538691 0.36276602064878599 $,-12,506,671.545565844 ESS (incl. recapture)(2) $3,631,257.6127088256 $1,109,654.77 $2,521,602.8427088256 $93,244,575.637500018 0.16197209020791764 $0 Agency MBS $,-13,302,024.699999999 $,-20,259,007.560000002 $6,956,982.8600000031 $92,586,833.64339936 -0.53188695501735317 $0 Non-Agency senior MBS (incl. jumbo) $,191,148.5839907087 $,-15,772.669999999562 $,206,920.72839907045 $1,584,246.9275000095 0.54510763448589605 $0 Interest rate hedges $,-11,402,133.16 $,-11,402,133.16 n/a Net interest rate sensitive strategies $24,100,290.389834829 $2,436,780.999999964 $21,663,510.289834831 $,687,104,847.35861766 0.14030051153026588 Correspondent production $5,953,513.5400000028 $5,953,513.5400000028 $,110,141,286.66524017 0.21621369135063467 Cash, short term investments, and other $,610,451.92000000004 n/a $,610,451.92000000004 $52,057,864.82182999 4.7% Management fees & corporate expenses $,-12,063,763.18 n/a $,-12,063,763.18 Corporate $,-11,453,311.26 n/a $,-11,453,311.26 $52,057,864.82182999 n/a Provision for income tax expense $-5,099,846 n/a $-5,099,846 Net income $46,562,095.821200006 $15,959,845.901199993 $30,602,249.920000009 $1,561,306,690.7504098 0.11929006926581708 Dividends on preferred stock $6,235,937.5 $,299,707,489.41000003 8.3% Net Income attributable to common shareholders $40,326,158.321200006 $1,261,599,201.3404098 0.12785727282755005 Diluted O/S (MM) 69.417461000000003 Diluted EPS $0.62
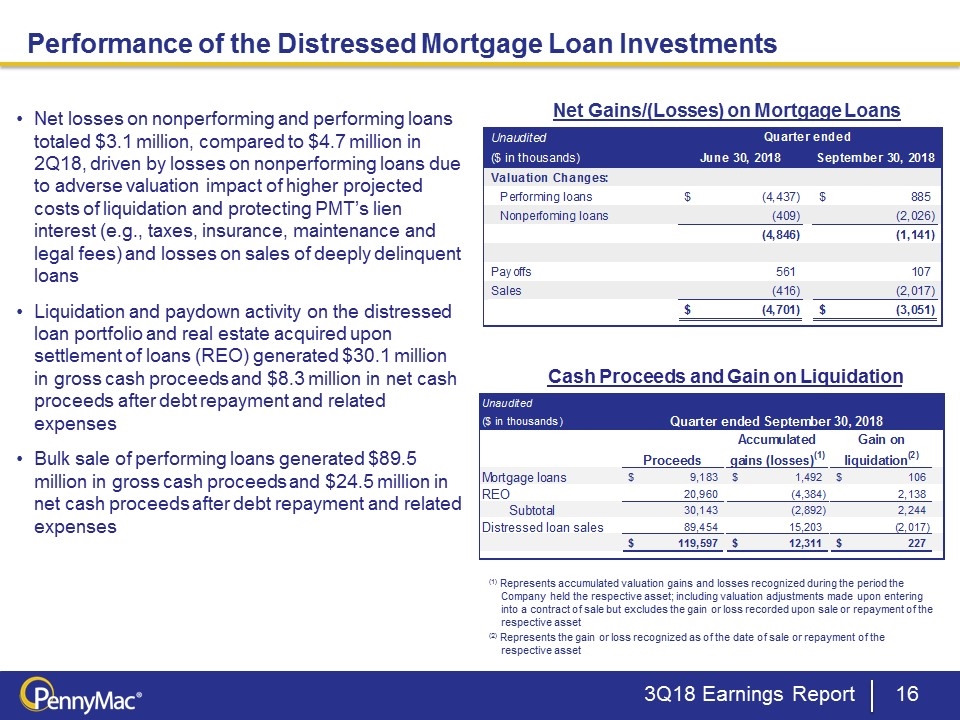
Net losses on nonperforming and performing loans totaled $3.1 million, compared to $4.7 million in 2Q18, driven by losses on nonperforming loans due to adverse valuation impact of higher projected costs of liquidation and protecting PMT’s lien interest (e.g., taxes, insurance, maintenance and legal fees) and losses on sales of deeply delinquent loans Liquidation and paydown activity on the distressed loan portfolio and real estate acquired upon settlement of loans (REO) generated $30.1 million in gross cash proceeds and $8.3 million in net cash proceeds after debt repayment and related expenses Bulk sale of performing loans generated $89.5 million in gross cash proceeds and $24.5 million in net cash proceeds after debt repayment and related expenses Net Gains/(Losses) on Mortgage Loans Cash Proceeds and Gain on Liquidation (1) Represents accumulated valuation gains and losses recognized during the period the Company held the respective asset; including valuation adjustments made upon entering into a contract of sale but excludes the gain or loss recorded upon sale or repayment of the respective asset (2) Represents the gain or loss recognized as of the date of sale or repayment of the respective asset Unaudited Performance of the Distressed Mortgage Loan Investments 3Q18 Earnings Report Unaudited Quarter ended ($ in thousands) June 30, 2018 September 30, 2018 Valuation Changes: Performing loans $ (4,437) $ 885 Nonperfoming loans (409) (2,026) (4,846) (1,141) Payoffs 561 107 Sales (416) (2,017) $ (4,701) $ (3,051) Unaudited ($ in thousands) Quarter ended September 30, 2018 Accumulated gains (losses)(1) Gain on liquidation(2) Proceeds Mortgage loans $ 9,183 $ 1,492 $ 106 REO 20,960 (4,384) 2,138 Subtotal 30,143 (2,892) 2,244 Distressed loan sales 89,454 15,203 (2,017) $ 119,597 $ 12,311 $ 227 Unaudited Quarter ended Unaudited ($ in thousands) $43,281 $43,373 ($ in thousands Valuation Changes: Valuation Changes: Performing loans $-4,437 $885 Performing loans Nonperfoming loans -,409 -2,026 Nonperforming loans -4,846 -1,141 Payoffs 561 107 Sales -,416 -2,017 $-4,701 $-3,051 Unaudited Unaudited Quarter ended March 31, 2016 ($ in thousands) Quarter ended September 30, 2018 ($ in thousands) Quarter ended March 31, 2016 Quarter ended June 30, 2017 Accumulated Gain on 2,712 2,756 Accumulated Gain on Proceeds gains (losses)(1) liquidation(2) Proceeds gains (losses)(1) liquidation(2) Mortgage loans $9,183 $1,492 $106 Mortgage loans $32,257 $3,832 $1,385 REO 20,960 -4,384 2,138 Subtotal 30,143 -2,892 2,244 Distressed loan sales 89,454 15,203 -2,017 $,119,597 $12,311 $227 REO 29,186 23,042 38,386 -4,229 2,636 #REF! #REF! $70,643 $-,397 $4,021 (1) Represents valuation gains and losses recognized during the period the Company held the respective asset, but excludes the gain or loss recorded upon sale or repayment of the respective asset Unaudited ($ in thousands) Quarter ended September 30, 2017 (2) Represents the gain or loss recognized as of the date of sale or repayment of the respective asset Accumulated Gain on Proceeds gains (losses) liquidation Mortgage loans $25,748 $3,520 $255 REO 39,276 -3,807 3,280 Subtotal 65,024 -,287 3,535 Distressed Loan Sales ,131,507 22,995 229 Cash Proceeds and Gain on Liquidation $,196,531 $22,708 $3,764 Unaudited Quarter ended March 31, 2016 ($ in thousands) Quarter ended March 31, 2016 Quarter ended March 31, 2017 2,712 2,756 Accumulated Gain on Proceeds gains (losses)(1) liquidation(2) Mortgage loans $25,376 $2,980 $387 REO 29,186 23,042 63,201 -4,175 4,979 Subtotal 5,529 4,951 88,577 -1,195 5,366 Distressed Loan Sales(3) 241 181 73,536 9,573 45 34,956 28,174 $,162,113 $8,378 $5,411 (1) Represents valuation gains and losses recognized during the period the Company held the respective asset, but excludes the gain or loss recorded upon sale or repayment of the respective asset (2) Represents the gain or loss recognized as of the date of sale or repayment of the respective asset Get from IR-8 Gains in Liquidations 73.536000000000001

Appendix
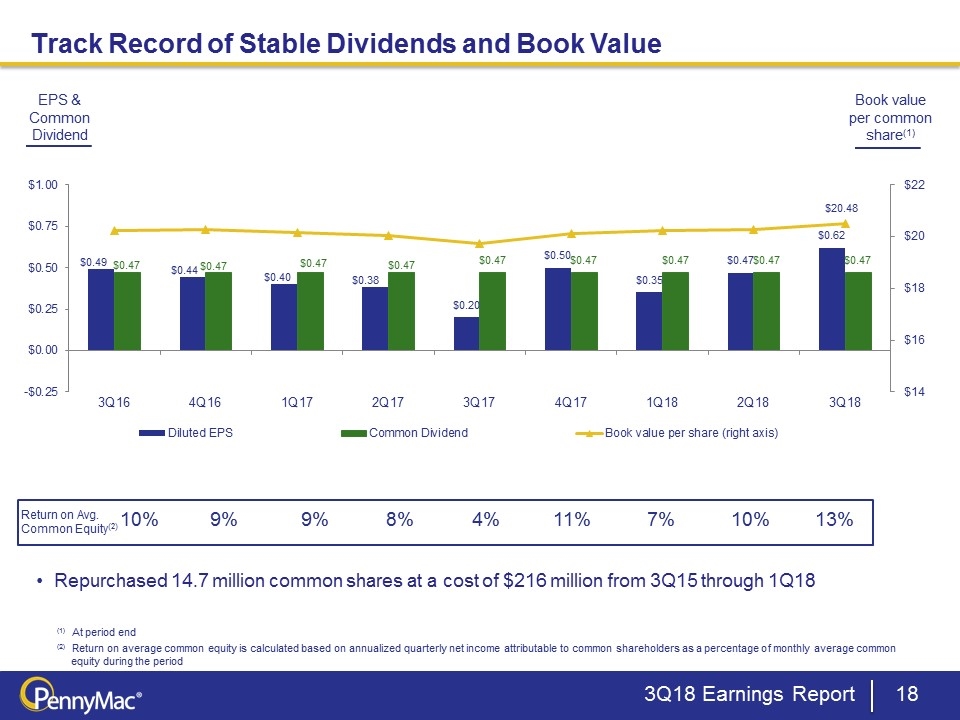
Book value per common share(1) 10% 9% Return on Avg. Common Equity(2) (1) At period end (2) Return on average common equity is calculated based on annualized quarterly net income attributable to common shareholders as a percentage of monthly average common equity during the period 9% EPS & Common Dividend 8% 4% 11% 7% 10% 13% Track Record of Stable Dividends and Book Value 3Q18 Earnings Report Repurchased 14.7 million common shares at a cost of $216 million from 3Q15 through 1Q18 Return on Avg. 10% 9% 9% 8% 4% 11% 7% 10% 13% Common Equity(2)
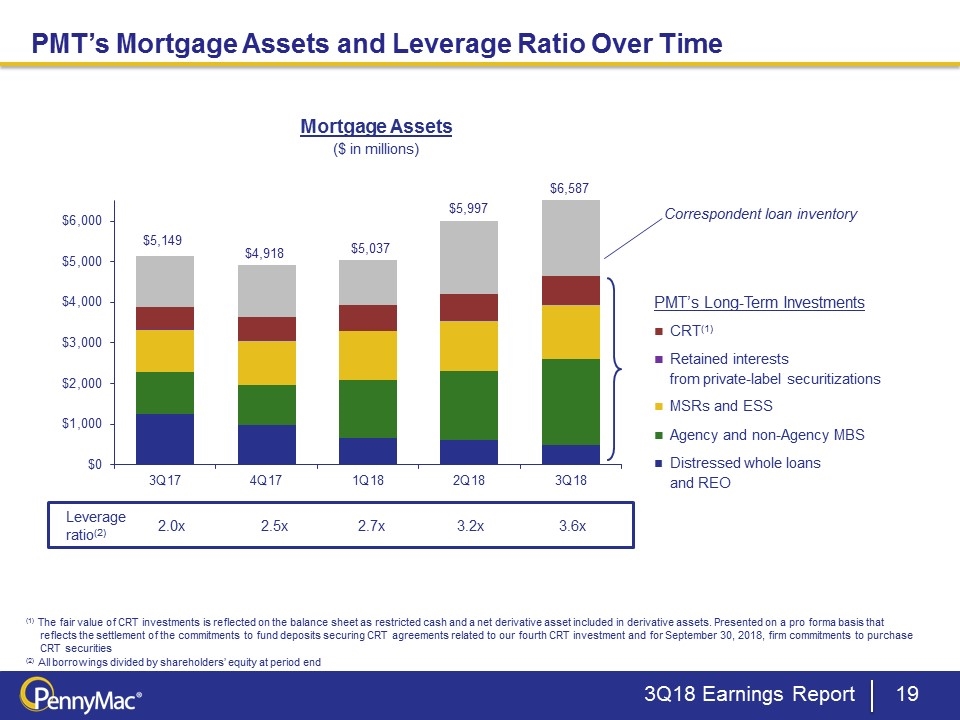
Correspondent loan inventory PMT’s Long-Term Investments ■ CRT(1) ■ Retained interests from private-label securitizations ■ MSRs and ESS ■ Agency and non-Agency MBS ■ Distressed whole loans and REO Leverage ratio(2) (1) The fair value of CRT investments is reflected on the balance sheet as restricted cash and a net derivative asset included in derivative assets. Presented on a pro forma basis that reflects the settlement of the commitments to fund deposits securing CRT agreements related to our fourth CRT investment and for September 30, 2018, firm commitments to purchase CRT securities (2) All borrowings divided by shareholders’ equity at period end Mortgage Assets ($ in millions) 2.0x 2.5x 2.7x 3.2x 3.6x PMT’s Mortgage Assets and Leverage Ratio Over Time 3Q18 Earnings Report $5,149 $4,918 $5,037 $5,997 $6,587
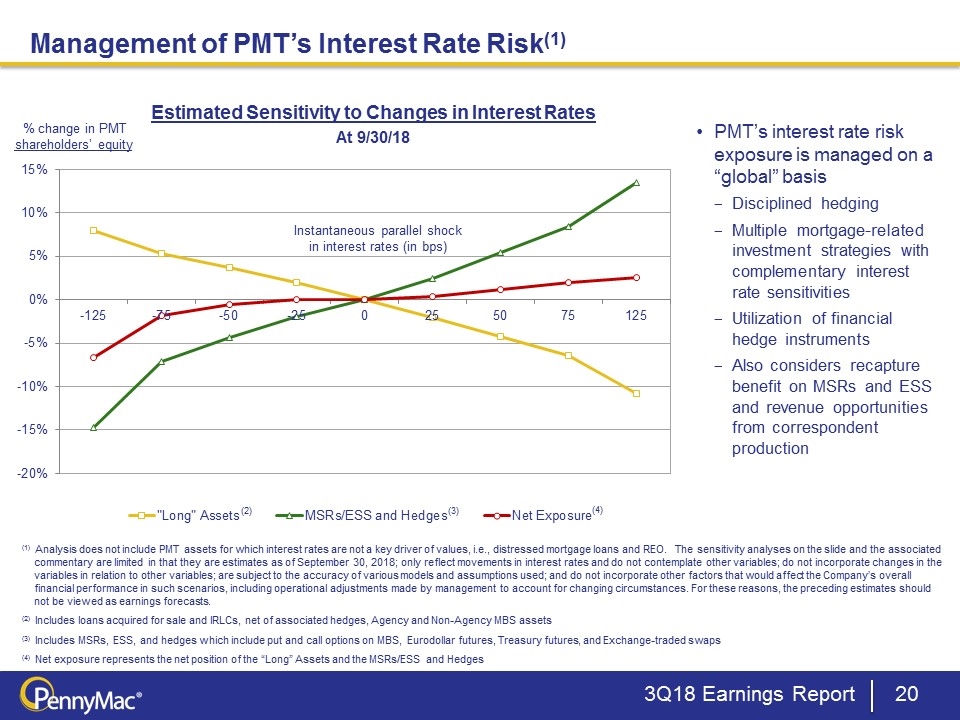
(2) PMT’s interest rate risk exposure is managed on a “global” basis Disciplined hedging Multiple mortgage-related investment strategies with complementary interest rate sensitivities Utilization of financial hedge instruments Also considers recapture benefit on MSRs and ESS and revenue opportunities from correspondent production Estimated Sensitivity to Changes in Interest Rates % change in PMT shareholders’ equity At 9/30/18 (1) Analysis does not include PMT assets for which interest rates are not a key driver of values, i.e., distressed mortgage loans and REO. The sensitivity analyses on the slide and the associated commentary are limited in that they are estimates as of September 30, 2018; only reflect movements in interest rates and do not contemplate other variables; do not incorporate changes in the variables in relation to other variables; are subject to the accuracy of various models and assumptions used; and do not incorporate other factors that would affect the Company’s overall financial performance in such scenarios, including operational adjustments made by management to account for changing circumstances. For these reasons, the preceding estimates should not be viewed as earnings forecasts. (2) Includes loans acquired for sale and IRLCs, net of associated hedges, Agency and Non-Agency MBS assets (3) Includes MSRs, ESS, and hedges which include put and call options on MBS, Eurodollar futures, Treasury futures, and Exchange-traded swaps (4) Net exposure represents the net position of the “Long” Assets and the MSRs/ESS and Hedges (3) (4) Instantaneous parallel shock in interest rates (in bps) Management of PMT’s Interest Rate Risk(1) 3Q18 Earnings Report
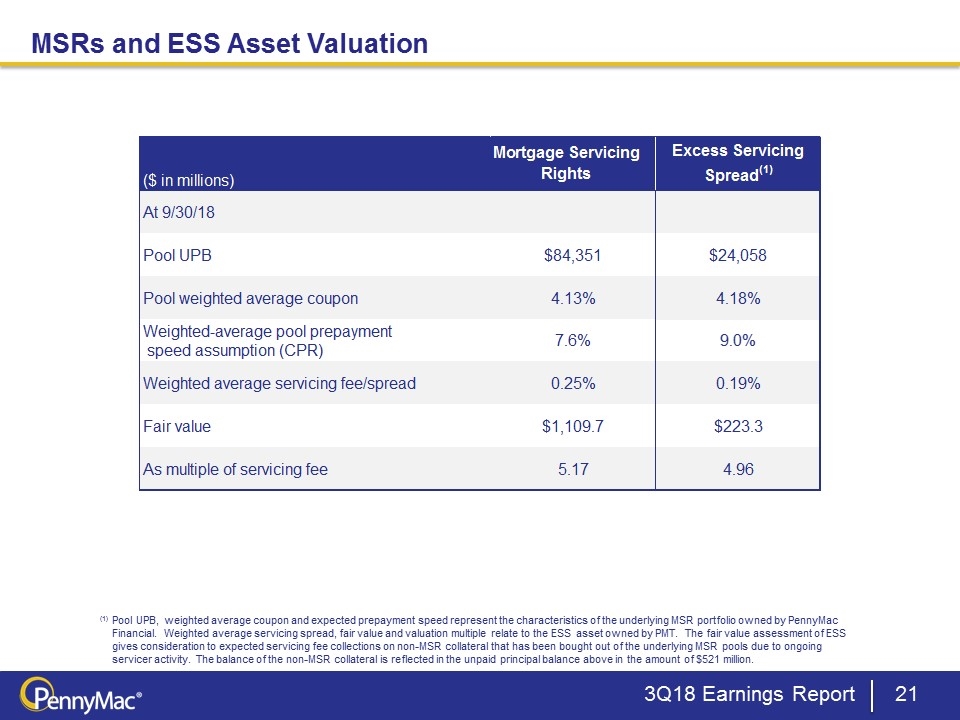
MSRs and ESS Asset Valuation Unaudited (1) Pool UPB, weighted average coupon and expected prepayment speed represent the characteristics of the underlying MSR portfolio owned by PennyMac Financial. Weighted average servicing spread, fair value and valuation multiple relate to the ESS asset owned by PMT. The fair value assessment of ESS gives consideration to expected servicing fee collections on non-MSR collateral that has been bought out of the underlying MSR pools due to ongoing servicer activity. The balance of the non-MSR collateral is reflected in the unpaid principal balance above in the amount of $521 million. 3Q18 Earnings Report Mortgage Servicing Rights Excess Servicing Spread(1) ($ in millions) At 9/30/18 Pool UPB $84,351 $24,058 Pool weighted average coupon 4.13% 4.18% Weighted-average pool prepayment speed assumption (CPR) 7.6% 9.0% Weighted average servicing fee/spread 0.25% 0.19% Fair value $1,109.7 $223.3 As multiple of servicing fee 5.17 4.96 ($ in millions) Mortgage Servicing Rights Excess Servicing Spread(1) At 9/30/18 Pool UPB $84,351.430814610096 $24,058.366252399999 Pool weighted average coupon 4.1322711990567126E-2 4.1772552571827194E-2 Weighted-average pool prepayment speed assumption (CPR) 7.6% 9.3% Weighted average servicing fee/spread 2.543391829706804E-3 1.8701503225463005E-3 Fair value $1,109.74127339047 $223.27453272293201 As multiple of servicing fee 5.1726847729595899 4.9624545313832398 ($ in millions) Mortgage Servicing Rights Excess Servicing Spread(1) At 3/31/18 At fair value At fair value Pool UPB $75,252.63015119958 $26,236.838945650034 Pool weighted average coupon 4.0014690630369991E-2 4.1681673425661619E-2 Weighted-average pool prepayment speed assumption (CPR) 7.9688304750860237 9.9% Weighted average servicing fee/spread 2.5402945128695609E-3 1.8694624798234673E-3 Fair value $956.8007658070818 $236.00186336438546 As multiple of servicing fee 5.005172314198246 4.8115739984614798
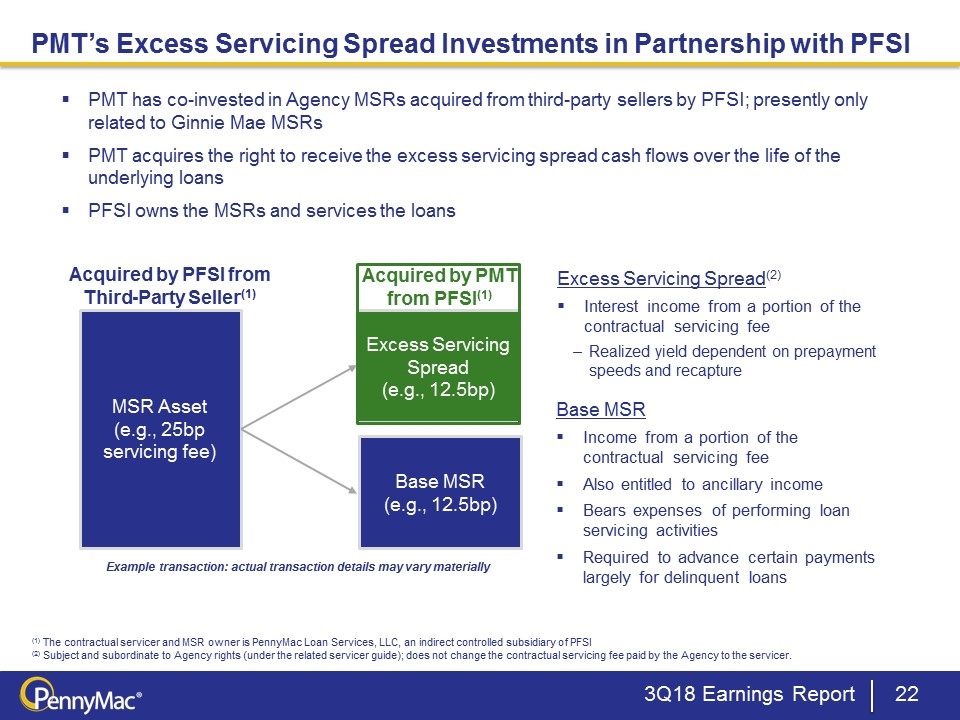
(1) The contractual servicer and MSR owner is PennyMac Loan Services, LLC, an indirect controlled subsidiary of PFSI (2) Subject and subordinate to Agency rights (under the related servicer guide); does not change the contractual servicing fee paid by the Agency to the servicer. Excess Servicing Spread (e.g., 12.5bp) MSR Asset (e.g., 25bp servicing fee) Acquired by PFSI from Third-Party Seller(1) PMT has co-invested in Agency MSRs acquired from third-party sellers by PFSI; presently only related to Ginnie Mae MSRs PMT acquires the right to receive the excess servicing spread cash flows over the life of the underlying loans PFSI owns the MSRs and services the loans Excess Servicing Spread(2) Interest income from a portion of the contractual servicing fee Realized yield dependent on prepayment speeds and recapture Base MSR Income from a portion of the contractual servicing fee Also entitled to ancillary income Bears expenses of performing loan servicing activities Required to advance certain payments largely for delinquent loans Base MSR (e.g., 12.5bp) Acquired by PMT from PFSI(1) Example transaction: actual transaction details may vary materially PMT’s Excess Servicing Spread Investments in Partnership with PFSI 3Q18 Earnings Report
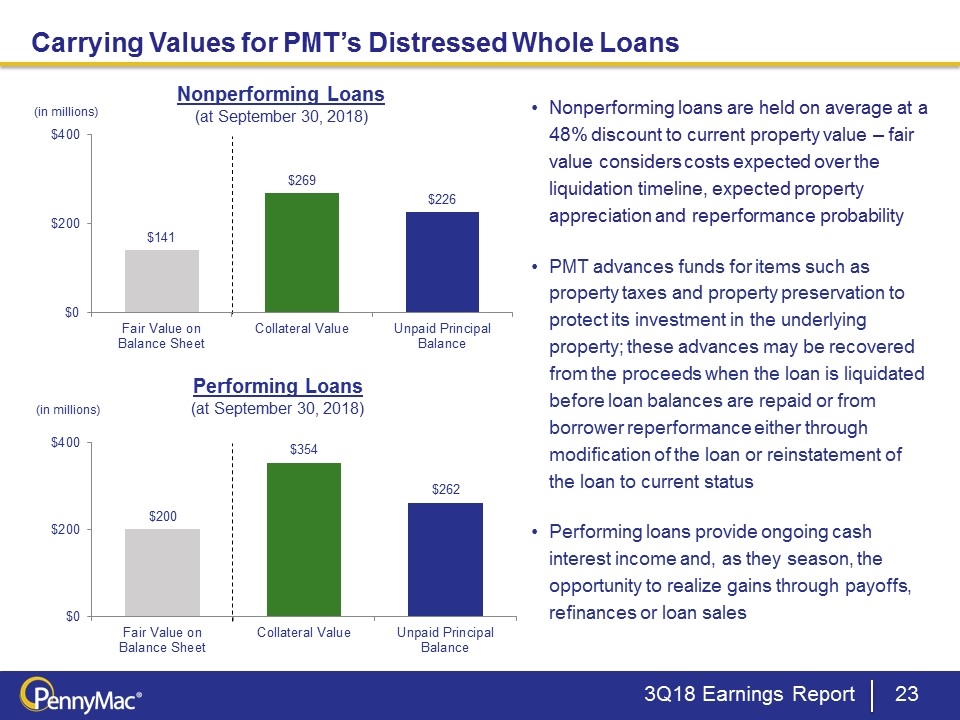
Nonperforming Loans (at September 30, 2018) Performing Loans (at September 30, 2018) Nonperforming loans are held on average at a 48% discount to current property value – fair value considers costs expected over the liquidation timeline, expected property appreciation and reperformance probability PMT advances funds for items such as property taxes and property preservation to protect its investment in the underlying property; these advances may be recovered from the proceeds when the loan is liquidated before loan balances are repaid or from borrower reperformance either through modification of the loan or reinstatement of the loan to current status Performing loans provide ongoing cash interest income and, as they season, the opportunity to realize gains through payoffs, refinances or loan sales (in millions) (in millions) Carrying Values for PMT’s Distressed Whole Loans 3Q18 Earnings Report
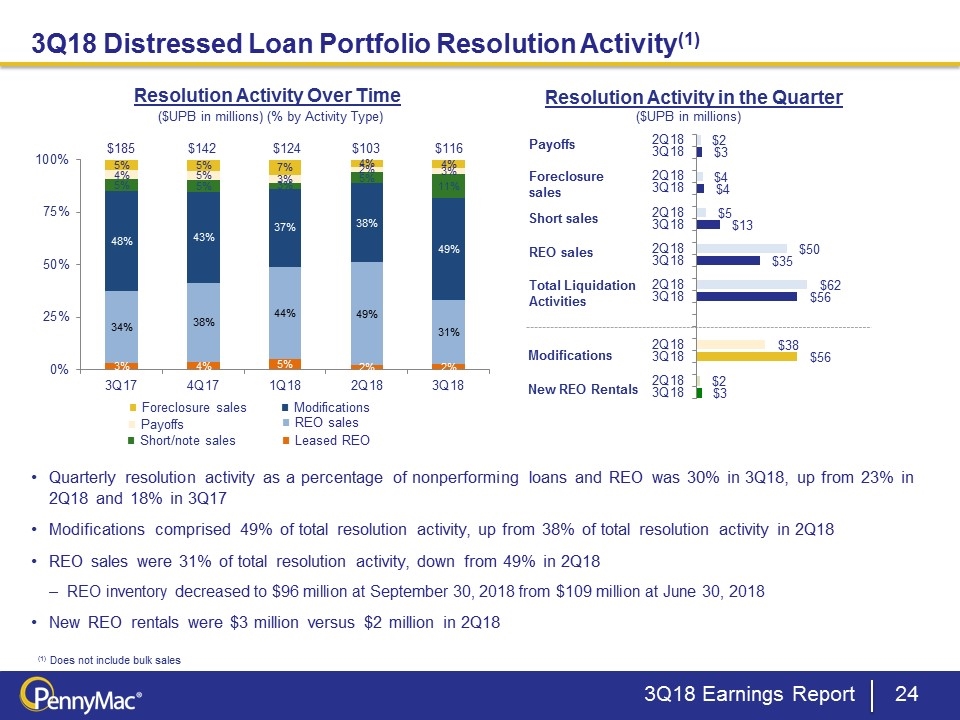
Payoffs Foreclosure sales Short sales REO sales Modifications ($UPB in millions) Resolution Activity in the Quarter Total Liquidation Activities Resolution Activity Over Time ($UPB in millions) (% by Activity Type) $185 $142 Quarterly resolution activity as a percentage of nonperforming loans and REO was 30% in 3Q18, up from 23% in 2Q18 and 18% in 3Q17 Modifications comprised 49% of total resolution activity, up from 38% of total resolution activity in 2Q18 REO sales were 31% of total resolution activity, down from 49% in 2Q18 REO inventory decreased to $96 million at September 30, 2018 from $109 million at June 30, 2018 New REO rentals were $3 million versus $2 million in 2Q18 $124 New REO Rentals $103 (1) Does not include bulk sales 3Q18 Distressed Loan Portfolio Resolution Activity(1) 3Q18 Earnings Report $116 ■ Foreclosure sales ■ Payoffs ■ Short/note sales ■ REO sales ■ Modifications ■ Leased REO
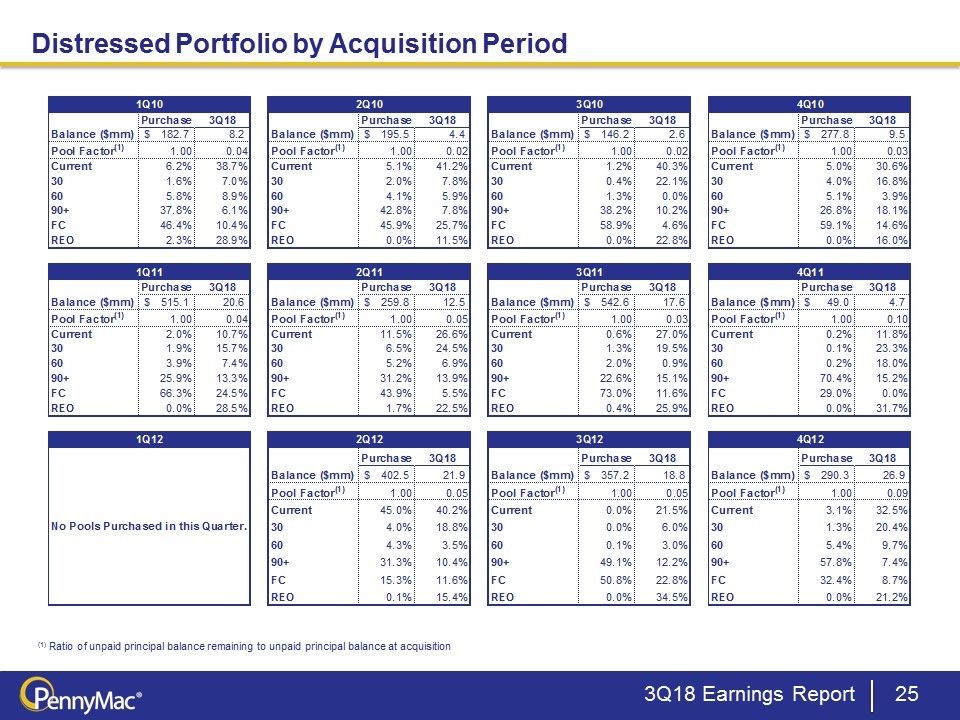
(1) Ratio of unpaid principal balance remaining to unpaid principal balance at acquisition Distressed Portfolio by Acquisition Period 3Q18 Earnings Report 1Q10 2Q10 3Q10 4Q10 Purchase 3Q18 Purchase 3Q18 Purchase 3Q18 Purchase 3Q18 Balance ($mm) $ 182.7 8.2 Balance ($mm) $ 195.5 4.4 Balance ($mm) $ 146.2 2.6 Balance ($mm) $ 277.8 9.5 Pool Factor(1) 1.00 0.04 Pool Factor(1) 1.00 0.02 Pool Factor(1) 1.00 0.02 Pool Factor(1) 1.00 0.03 Current 6.2% 38.7% Current 5.1% 41.2% Current 1.2% 40.3% Current 5.0% 30.6% 30 1.6% 7.0% 30 2.0% 7.8% 30 0.4% 22.1% 30 4.0% 16.8% 60 5.8% 8.9% 60 4.1% 5.9% 60 1.3% 0.0% 60 5.1% 3.9% 90+ 37.8% 6.1% 90+ 42.8% 7.8% 90+ 38.2% 10.2% 90+ 26.8% 18.1% FC 46.4% 10.4% FC 45.9% 25.7% FC 58.9% 4.6% FC 59.1% 14.6% REO 2.3% 28.9% REO 0.0% 11.5% REO 0.0% 22.8% REO 0.0% 16.0% 1Q11 2Q11 3Q11 4Q11 Purchase 3Q18 Purchase 3Q18 Purchase 3Q18 Purchase 3Q18 Balance ($mm) $ 515.1 20.6 Balance ($mm) $ 259.8 12.5 Balance ($mm) $ 542.6 17.6 Balance ($mm) $ 49.0 4.7 Pool Factor(1) 1.00 0.04 Pool Factor(1) 1.00 0.05 Pool Factor(1) 1.00 0.03 Pool Factor(1) 1.00 0.10 Current 2.0% 10.7% Current 11.5% 26.6% Current 0.6% 27.0% Current 0.2% 11.8% 30 1.9% 15.7% 30 6.5% 24.5% 30 1.3% 19.5% 30 0.1% 23.3% 60 3.9% 7.4% 60 5.2% 6.9% 60 2.0% 0.9% 60 0.2% 18.0% 90+ 25.9% 13.3% 90+ 31.2% 13.9% 90+ 22.6% 15.1% 90+ 70.4% 15.2% FC 66.3% 24.5% FC 43.9% 5.5% FC 73.0% 11.6% FC 29.0% 0.0% REO 0.0% 28.5% REO 1.7% 22.5% REO 0.4% 25.9% REO 0.0% 31.7% 1Q12 2Q12 3Q12 4Q12 Purchase 3Q18 Purchase 3Q18 Purchase 3Q18 Balance ($mm) $ 402.5 21.9 Balance ($mm) $ 357.2 18.8 Balance ($mm) $ 290.3 26.9 Pool Factor(1) 1.00 0.05 Pool Factor(1) 1.00 0.05 Pool Factor(1) 1.00 0.09 Current 45.0% 40.2% Current 0.0% 21.5% Current 3.1% 32.5% No Pools Purchased in this Quarter. 30 4.0% 18.8% 30 0.0% 6.0% 30 1.3% 20.4% 60 4.3% 3.5% 60 0.1% 3.0% 60 5.4% 9.7% 90+ 31.3% 10.4% 90+ 49.1% 12.2% 90+ 57.8% 7.4% FC 15.3% 11.6% FC 50.8% 22.8% FC 32.4% 8.7% REO 0.1% 15.4% REO 0.0% 34.5% REO 0.0% 21.2% 1Q10 2Q10 3Q10 4Q10 Purchase 3Q18 Purchase 3Q18 Purchase 3Q18 Purchase 3Q18 Balance ($mm) $182.672582201057 8.1731385599999982 Balance ($mm) $195.49637637999993 4.4157307299999999 Balance ($mm) $146.16193093000001 2.60571712 Balance ($mm) $277.81527073999996 9.5207136500000011 Pool Factor(1) 1 4.4742010330834928E-2 Pool Factor(1) 1 2.258727661231345E-2 Pool Factor(1) 1 1.7827604653416436E-2 Pool Factor(1) 1 3.4269943565881908E-2 Current 6.2% 0.3872066240854235 Current 5.1% 0.41232091613520999 Current 1.2% 0.40307349632795136 Current 5.2% 0.3058252382162549 30 1.6% 7.4% 30 2.3% 7.8% 30 .4% 0.22092644500105985 30 4.2% 0.16820924658310671 60 5.8% 8.9% 60 4.1% 5.9% 60 1.3% 0.0% 60 5.8% 3.9% 90+ 0.37751962406759487 6.5% 90+ 0.42798263179756652 7.8% 90+ 0.382033460318353 0.1023496096153369 90+ 0.26823853620970328 0.18115513010939049 FC 0.46419279351222298 0.10421713442724261 FC 0.45929744234986214 0.25714826365782495 FC 0.58920656604656152 4.6% FC 0.59076838092028339 0.14572716510594771 REO 2.3% 0.28853139986409332 REO 0.0% 0.11529662271775343 REO 0.0% 0.22790508434008366 REO 0.0% 0.15980628616007161 1Q11 2Q11 3Q11 4Q11 Purchase 3Q18 Purchase 3Q18 Purchase 3Q18 Purchase 3Q18 Balance ($mm) $515.06181411999989 20.634686869999992 Balance ($mm) $259.77640001999998 12.455831820000002 Balance ($mm) $542.58631182000011 17.616774100000001 Balance ($mm) $49.030928989999992 4.7173132000000004 Pool Factor(1) 1 4.0062544541872191E-2 Pool Factor(1) 1 4.7948280979492504E-2 Pool Factor(1) 1 3.2468150626409953E-2 Pool Factor(1) 1 9.6210969222347606E-2 Current 1.9657515374729567 0.10664584996438088 Current 0.11510263621983363 0.2664887811563274 Current .6% 0.27018807206025308 Current .2% 0.11757851482068225 30 1.9% 0.15707207094633269 30 6.5% 0.24549102092805875 30 1.3% 0.19463907923982518 30 87349884822159887.9% 0.23329940229535745 60 3.9% 7.4% 60 5.2% 6.9% 60 2.2% .9% 60 .2% 0.18017739419973217 90+ 0.25935027693370794 0.13279085392779694 90+ 0.31153207325134025 0.13927489669654194 90+ 0.22641709500175353 0.15086457854959948 90+ 0.70432946899789106 0.15195186743165581 FC 0.66302490871597985 0.24474409337135727 FC 0.43895799272459313 5.5% FC 0.73029441058117417 0.11562849012180952 FC 0.29025570151653785 0.0% REO 0.0% 0.28523184224118053 REO 1.7% 0.22468900675956618 REO .4% 0.25943581293921458 REO 0.0% 0.31699282125257233 1Q12 2Q12 3Q12 4Q12 No Pools Purchased in this Quarter. Purchase 3Q18 Purchase 3Q18 Purchase 3Q18 Balance ($mm) $402.45030485000052 21.859567680000005 Balance ($mm) $357.15906187000053 18.752002630000003 Balance ($mm) $290.26023193999981 26.936147809999987 Pool Factor(1) 1 5.4316191133579599E-2 Pool Factor(1) 1 5.2503225122775672E-2 Pool Factor(1) 1 9.2799994094843838E-2 Current 0.45015742064731151 0.40233550218134956 Current 0.0% 0.21500924672171931 Current 3.6% 0.32540307514744066 30 3.9764924953814423 0.18822599377226107 30 2643453577956948.3% 5.9921747141947798 30 1.3% 0.20429835805834923 60 4.3% 3.5% 60 .1% 3.2% 60 5.4% 9.7% 90+ 0.31333999423109132 0.10405636485121923 90+ 0.49066117735460413 0.12213447945746154 90+ 0.578160596883591 7.4% FC 0.15289854528234162 0.11601516311414992 FC 0.50802216807827427 0.22759075199639087 FC 0.32398010475454603 8.7% REO 79773998461663616.8% 0.15447403944266846 REO 0.0% 0.34510836243414067 REO 0.0% 0.21225919794950807 1Q13 2Q13 3Q13 4Q13 Purchase 2Q18 Purchase 2Q18 Purchase 2Q18 Purchase 2Q18 Balance ($mm) $366.18001965000002 32.190545299999997 Balance ($mm) $397.26270838999989 53.429747519999985 Balance ($mm) $929.48776080999994 123.39474583000003 Balance ($mm) $507.25326598999976 94.880065000000002 Pool Factor(1) 1 8.7909070873850984E-2 Pool Factor(1) 1 0.13449474715745796 Pool Factor(1) 1 0.13275564351968225 Pool Factor(1) 1 0.18704673062049937 Current 1.6% 0.38928746199276093 Current 4.8% 0.32061465859608834 Current .8% 0.2145386343797131 Current 1.4% 0.12622245378942351 30 1.5% 0.19874153793847041 30 7.4% 0.16699025101438472 30 .3% 8.9% 30 .2% 5.7% 60 3.5% 4.2% 60 7.6% 4.6% 60 .7% 3.3% 60 49456176395509983.5% 5.8% 90+ 0.82228762991438109 0.13174804901487641 90+ 0.45320655965837436 0.13722747814324687 90+ 0.58595936406453941 0.16573783221025823 90+ 0.38327758085609415 0.2114381579523581 FC 0.11200811442197979 6.1% FC 0.34857030802412398 7.2% FC 0.39623865562150751 0.15016562614042062 FC 0.60015642926585211 0.25292173714257038 REO 0.0% 0.17699499113486594 REO 41969753636255736.4% 0.2565123000978014 REO 0.0% 0.3476524701392143 REO 0.0% 0.2943378060501961 1Q14 2Q14 3Q14 4Q14 Purchase 2Q18 Purchase 2Q18 No Pools Purchased in this Quarter. Purchase 2Q18 Balance ($mm) $438.97483355999952 99.946829669999971 Balance ($mm) $37.864462410000002 7.7135911100000003 Balance ($mm) $330.8 53.922001030000011 Pool Factor(1) 1 0.22768236816550699 Pool Factor(1) 1 0.20371584908499432 Pool Factor(1) 1 0.16302065593699422 Current 6.2% 0.12126371091526385 Current .7% 0.39423482352566658 Current 1.6% 0.23184798674375157 30 .7% 7.2% 30 .6% 0.18400347643005929 30 1.6% 9.3% 60 .7% 2.4% 60 1.4% 0.13633706855897884 60 7.0999999999999994 6.8% 90+ 0.37474172053536514 0.2365478740852591 90+ 0.59012298175660305 8.9% 90+ 0.52700000000000002 0.14121923954126667 FC 0.53788599573038365 0.18801436015574216 FC 0.38217975613403099 6.7% FC 0.36899999999999999 0.22440509122181584 REO 1.0978773113063386 0.36126260732047899 REO 0.0% 0.12905843799646258 REO 0.0% 0.24187706466500905 1Q15 Purchase 2Q18 No distressed loan acquisitions since 1Q15 Balance ($mm) $310.2 66.349907279999996 Pool Factor(1) 1 0.21392151734714485 Current 1.8% 0.24705616197509181 30 .3% 9.8% 60 1.1% 3.3% 90+ 0.66700000000000004 0.17016003371873889 FC 0.311 0.19422597782415468 REO 0.0% 0.25759984438067168
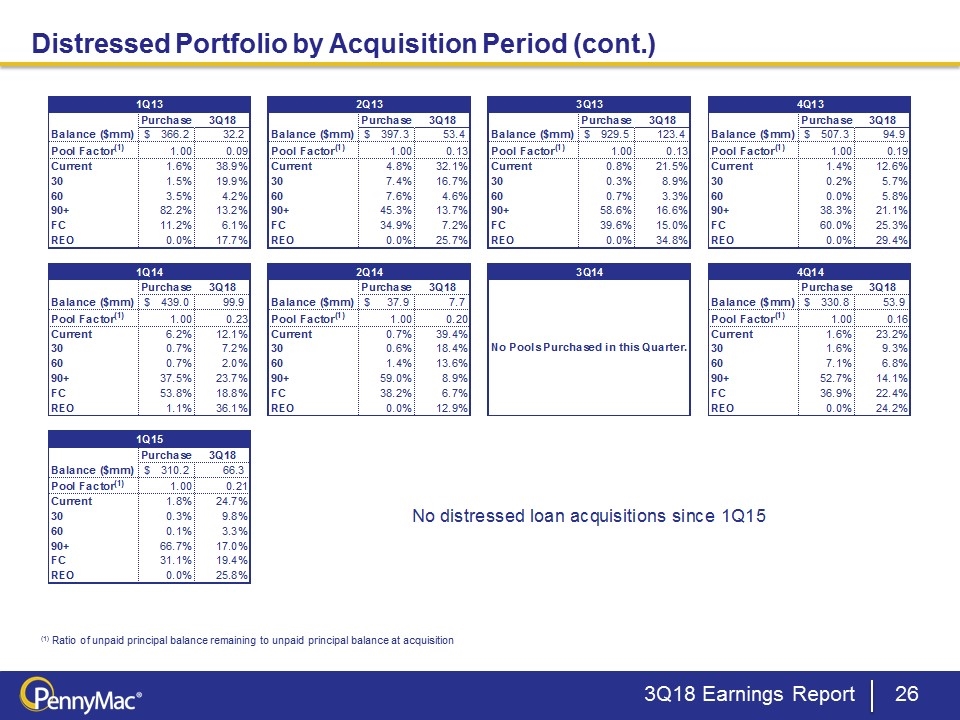
(1) Ratio of unpaid principal balance remaining to unpaid principal balance at acquisition Distressed Portfolio by Acquisition Period (cont.) 3Q18 Earnings Report Update 1Q13 2Q13 3Q13 4Q13 Purchase 3Q18 Purchase 3Q18 Purchase 3Q18 Purchase 3Q18 Balance ($mm) $ 366.2 32.2 Balance ($mm) $ 397.3 53.4 Balance ($mm) $ 929.5 123.4 Balance ($mm) $ 507.3 94.9 Pool Factor(1) 1.00 0.09 Pool Factor(1) 1.00 0.13 Pool Factor(1) 1.00 0.13 Pool Factor(1) 1.00 0.19 Current 1.6% 38.9% Current 4.8% 32.1% Current 0.8% 21.5% Current 1.4% 12.6% 30 1.5% 19.9% 30 7.4% 16.7% 30 0.3% 8.9% 30 0.2% 5.7% 60 3.5% 4.2% 60 7.6% 4.6% 60 0.7% 3.3% 60 0.0% 5.8% 90+ 82.2% 13.2% 90+ 45.3% 13.7% 90+ 58.6% 16.6% 90+ 38.3% 21.1% FC 11.2% 6.1% FC 34.9% 7.2% FC 39.6% 15.0% FC 60.0% 25.3% REO 0.0% 17.7% REO 0.0% 25.7% REO 0.0% 34.8% REO 0.0% 29.4% 1Q14 2Q14 3Q14 4Q14 Purchase 3Q18 Purchase 3Q18 Purchase 3Q18 Balance ($mm) $ 439.0 99.9 Balance ($mm) $ 37.9 7.7 Balance ($mm) $ 330.8 53.9 Pool Factor(1) 1.00 0.23 Pool Factor(1) 1.00 0.20 Pool Factor(1) 1.00 0.16 Current 6.2% 12.1% Current 0.7% 39.4% Current 1.6% 23.2% 30 0.7% 7.2% 30 0.6% 18.4% No Pools Purchased in this Quarter. 30 1.6% 9.3% 60 0.7% 2.0% 60 1.4% 13.6% 60 7.1% 6.8% 90+ 37.5% 23.7% 90+ 59.0% 8.9% 90+ 52.7% 14.1% FC 53.8% 18.8% FC 38.2% 6.7% FC 36.9% 22.4% REO 1.1% 36.1% REO 0.0% 12.9% REO 0.0% 24.2% 1Q15 Purchase 3Q18 Balance ($mm) $ 310.2 66.3 Pool Factor(1) 1.00 0.21 Current 1.8% 24.7% 30 0.3% 9.8% No distressed loan acquisitions since 1Q15 60 0.1% 3.3% 90+ 66.7% 17.0% FC 31.1% 19.4% REO 0.0% 25.8% 1Q10 2Q10 3Q10 4Q10 Purchase 3Q18 Purchase 3Q18 Purchase 3Q18 Purchase 3Q18 Balance ($mm) $182.672582201057 8.1731385599999982 Balance ($mm) $195.49637637999993 4.4157307299999999 Balance ($mm) $146.16193093000001 2.60571712 Balance ($mm) $277.81527073999996 9.5207136500000011 Pool Factor(1) 1 4.4742010330834928E-2 Pool Factor(1) 1 2.258727661231345E-2 Pool Factor(1) 1 1.7827604653416436E-2 Pool Factor(1) 1 3.4269943565881908E-2 Current 6.2% 0.3872066240854235 Current 5.1% 0.41232091613520999 Current 1.2% 0.40307349632795136 Current 5.2% 0.3058252382162549 30 1.6% 7.4% 30 2.3% 7.8% 30 .4% 0.22092644500105985 30 4.2% 0.16820924658310671 60 5.8% 8.9% 60 4.1% 5.9% 60 1.3% 0.0% 60 5.8% 3.9% 90+ 0.37751962406759487 6.5% 90+ 0.42798263179756652 7.8% 90+ 0.382033460318353 0.1023496096153369 90+ 0.26823853620970328 0.18115513010939049 FC 0.46419279351222298 0.10421713442724261 FC 0.45929744234986214 0.25714826365782495 FC 0.58920656604656152 4.6% FC 0.59076838092028339 0.14572716510594771 REO 2.3% 0.28853139986409332 REO 0.0% 0.11529662271775343 REO 0.0% 0.22790508434008366 REO 0.0% 0.15980628616007161 1Q11 2Q11 3Q11 4Q11 Purchase 3Q18 Purchase 3Q18 Purchase 3Q18 Purchase 3Q18 Balance ($mm) $515.06181411999989 20.634686869999992 Balance ($mm) $259.77640001999998 12.455831820000002 Balance ($mm) $542.58631182000011 17.616774100000001 Balance ($mm) $49.030928989999992 4.7173132000000004 Pool Factor(1) 1 4.0062544541872191E-2 Pool Factor(1) 1 4.7948280979492504E-2 Pool Factor(1) 1 3.2468150626409953E-2 Pool Factor(1) 1 9.6210969222347606E-2 Current 1.9657515374729567 0.10664584996438088 Current 0.11510263621983363 0.2664887811563274 Current .6% 0.27018807206025308 Current .2% 0.11757851482068225 30 1.9% 0.15707207094633269 30 6.5% 0.24549102092805875 30 1.3% 0.19463907923982518 30 87349884822159887.9% 0.23329940229535745 60 3.9% 7.4% 60 5.2% 6.9% 60 2.2% .9% 60 .2% 0.18017739419973217 90+ 0.25935027693370794 0.13279085392779694 90+ 0.31153207325134025 0.13927489669654194 90+ 0.22641709500175353 0.15086457854959948 90+ 0.70432946899789106 0.15195186743165581 FC 0.66302490871597985 0.24474409337135727 FC 0.43895799272459313 5.5% FC 0.73029441058117417 0.11562849012180952 FC 0.29025570151653785 0.0% REO 0.0% 0.28523184224118053 REO 1.7% 0.22468900675956618 REO .4% 0.25943581293921458 REO 0.0% 0.31699282125257233 1Q12 2Q12 3Q12 4Q12 No Pools Purchased in this Quarter. Purchase 3Q18 Purchase 3Q18 Purchase 3Q18 Balance ($mm) $402.45030485000052 21.859567680000005 Balance ($mm) $357.15906187000053 18.752002630000003 Balance ($mm) $290.26023193999981 26.936147809999987 Pool Factor(1) 1 5.4316191133579599E-2 Pool Factor(1) 1 5.2503225122775672E-2 Pool Factor(1) 1 9.2799994094843838E-2 Current 0.45015742064731151 0.40233550218134956 Current 0.0% 0.21500924672171931 Current 3.6% 0.32540307514744066 30 3.9764924953814423 0.18822599377226107 30 2643453577956948.3% 5.9921747141947798 30 1.3% 0.20429835805834923 60 4.3% 3.5% 60 .1% 3.2% 60 5.4% 9.7% 90+ 0.31333999423109132 0.10405636485121923 90+ 0.49066117735460413 0.12213447945746154 90+ 0.578160596883591 7.4% FC 0.15289854528234162 0.11601516311414992 FC 0.50802216807827427 0.22759075199639087 FC 0.32398010475454603 8.7% REO 79773998461663616.8% 0.15447403944266846 REO 0.0% 0.34510836243414067 REO 0.0% 0.21225919794950807 1Q13 2Q13 3Q13 4Q13 Purchase 3Q18 Purchase 3Q18 Purchase 3Q18 Purchase 3Q18 Balance ($mm) $366.18001965000002 32.190545299999997 Balance ($mm) $397.26270838999989 53.429747519999985 Balance ($mm) $929.48776080999994 123.39474583000003 Balance ($mm) $507.25326598999976 94.880065000000002 Pool Factor(1) 1 8.7909070873850984E-2 Pool Factor(1) 1 0.13449474715745796 Pool Factor(1) 1 0.13275564351968225 Pool Factor(1) 1 0.18704673062049937 Current 1.6% 0.38928746199276093 Current 4.8% 0.32061465859608834 Current .8% 0.2145386343797131 Current 1.4% 0.12622245378942351 30 1.5% 0.19874153793847041 30 7.4% 0.16699025101438472 30 .3% 8.9% 30 .2% 5.7% 60 3.5% 4.2% 60 7.6% 4.6% 60 .7% 3.3% 60 49456176395509983.5% 5.8% 90+ 0.82228762991438109 0.13174804901487641 90+ 0.45320655965837436 0.13722747814324687 90+ 0.58595936406453941 0.16573783221025823 90+ 0.38327758085609415 0.2114381579523581 FC 0.11200811442197979 6.1% FC 0.34857030802412398 7.2% FC 0.39623865562150751 0.15016562614042062 FC 0.60015642926585211 0.25292173714257038 REO 0.0% 0.17699499113486594 REO 41969753636255736.4% 0.2565123000978014 REO 0.0% 0.3476524701392143 REO 0.0% 0.2943378060501961 1Q14 2Q14 3Q14 4Q14 Purchase 3Q18 Purchase 3Q18 No Pools Purchased in this Quarter. Purchase 3Q18 Balance ($mm) $438.97483355999952 99.946829669999971 Balance ($mm) $37.864462410000002 7.7135911100000003 Balance ($mm) $330.8 53.922001030000011 Pool Factor(1) 1 0.22768236816550699 Pool Factor(1) 1 0.20371584908499432 Pool Factor(1) 1 0.16302065593699422 Current 6.2% 0.12126371091526385 Current .7% 0.39423482352566658 Current 1.6% 0.23184798674375157 30 .7% 7.2% 30 .6% 0.18400347643005929 30 1.6% 9.3% 60 .7% 2.4% 60 1.4% 0.13633706855897884 60 7.0999999999999994 6.8% 90+ 0.37474172053536514 0.2365478740852591 90+ 0.59012298175660305 8.9% 90+ 0.52700000000000002 0.14121923954126667 FC 0.53788599573038365 0.18801436015574216 FC 0.38217975613403099 6.7% FC 0.36899999999999999 0.22440509122181584 REO 1.0978773113063386 0.36126260732047899 REO 0.0% 0.12905843799646258 REO 0.0% 0.24187706466500905 1Q15 Purchase 3Q18 No distressed loan acquisitions since 1Q15 Balance ($mm) $310.2 66.349907279999996 Pool Factor(1) 1 0.21392151734714485 Current 1.8% 0.24705616197509181 30 .3% 9.8% 60 1.1% 3.3% 90+ 0.66700000000000004 0.17016003371873889 FC 0.311 0.19422597782415468 REO 0.0% 0.25759984438067168
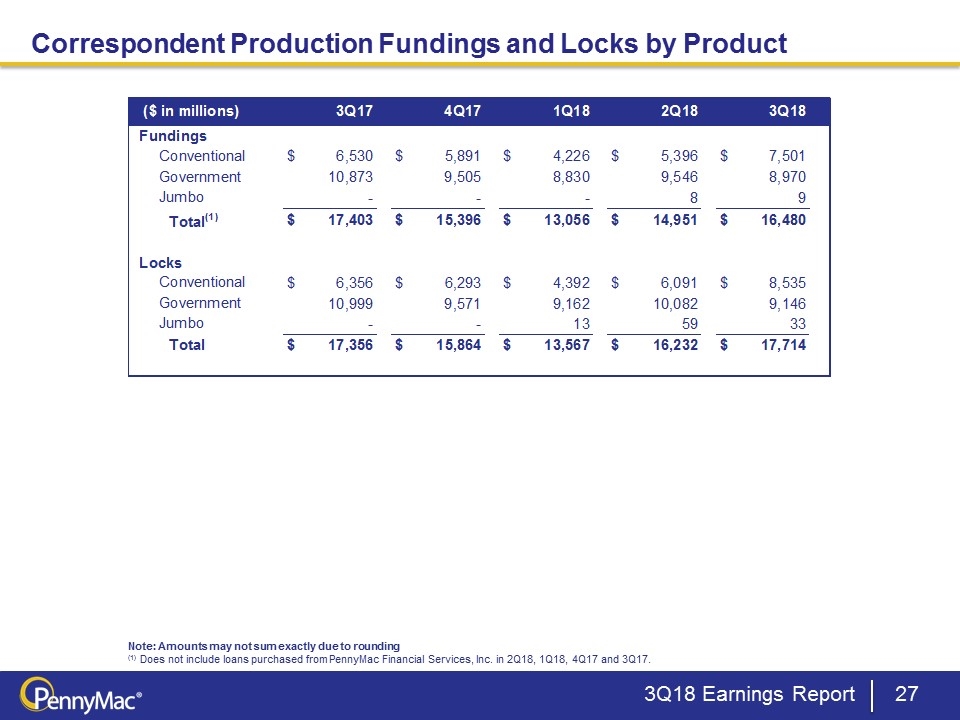
Correspondent Production Fundings and Locks by Product Note: Amounts may not sum exactly due to rounding (1) Does not include loans purchased from PennyMac Financial Services, Inc. in 2Q18, 1Q18, 4Q17 and 3Q17. 3Q18 Earnings Report ($ in millions) 3Q17 4Q17 1Q18 2Q18 3Q18 Fundings Conventional $ 6,530 $ 5,891 $ 4,226 $ 5,396 $ 7,501 Government 10,873 9,505 8,830 9,546 8,970 Jumbo - - - 8 9 Total(1) $ 17,403 $ 15,396 $ 13,056 $ 14,951 $ 16,480 Locks Conventional $ 6,356 $ 6,293 $ 4,392 $ 6,091 $ 8,535 Government 10,999 9,571 9,162 10,082 9,146 Jumbo - - 13 59 33 Total $ 17,356 $ 15,864 $ 13,567 $ 16,232 $ 17,714 ($ in millions) 3Q17 4Q17 1Q18 2Q18 3Q18 Fundings Conventional $6,530.360000000001 $5,891.1504007399999 $4,225.6310000000003 $5,396 $7,501 Government 10873.405000000001 9504.8030605200001 8830.4058649199997 9546 8970.2080000000005 Jumbo - - - 8 9.1389999999999993 Total(1) $17,403.440999999999 $15,395.95346126 $13,056.36864919999 $14,951 $16,479.675999999999 Locks Conventional $6,356.3441639400007 $6,293.2366228800001 $4,391.9986879999997 $6,091 $8,535 Government 10999.3008760595 9570.8870151197007 9162.2598610001005 10082 9146 Jumbo - - 12.89655 59 33 Total $17,355.645039999501 $15,864.123637999701 $13,567.1550990001 $16,232 $17,714
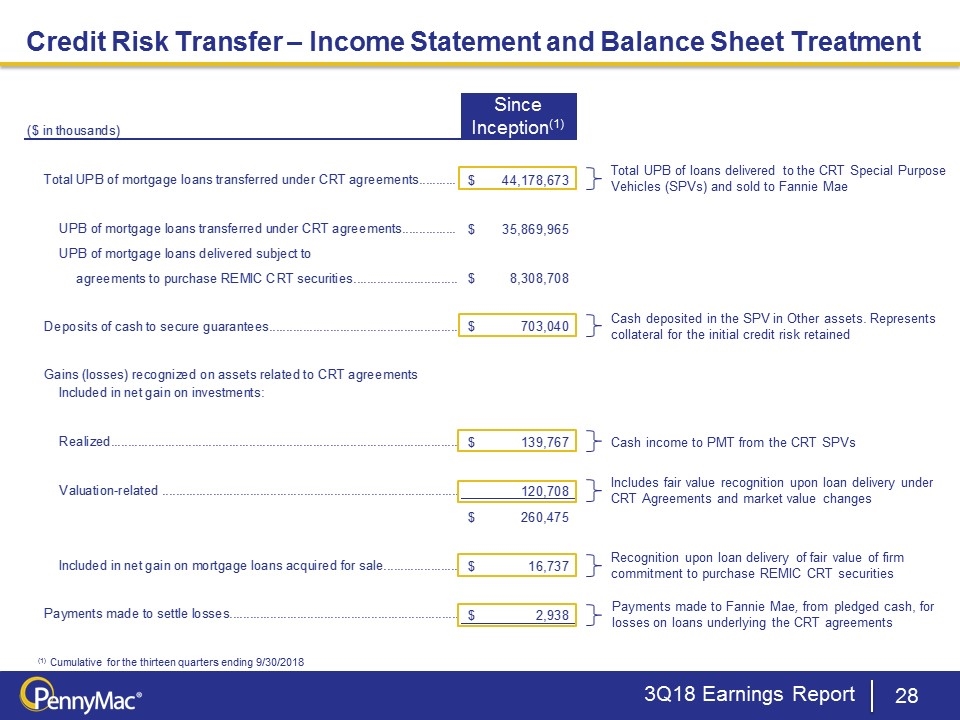
Cash deposited in the SPV in Other assets. Represents collateral for the initial credit risk retained Includes fair value recognition upon loan delivery under CRT Agreements and market value changes Payments made to Fannie Mae, from pledged cash, for losses on loans underlying the CRT agreements Cash income to PMT from the CRT SPVs Total UPB of loans delivered to the CRT Special Purpose Vehicles (SPVs) and sold to Fannie Mae (1) Cumulative for the thirteen quarters ending 9/30/2018 Credit Risk Transfer – Income Statement and Balance Sheet Treatment Recognition upon loan delivery of fair value of firm commitment to purchase REMIC CRT securities Since Inception(1) 3Q18 Earnings Report Since Inception I c n(1)(1) ($ in thousands) Total UPB of mortgage loans transferred under CRT agreements $ 44,178,673 UPB of mortgage loans transferred under CRT agreements $ 35,869,965 UPB of mortgage loans delivered subject to agreements to purchase REMIC CRT securities $ 8,308,708 Deposits of cash to secure guarantees $ 703,040 Gains (losses) recognized on assets related to CRT agreements Included in net gain on investments: Realized $ 139,767 Valuation-related 120,708 $ 260,475 Included in net gain on mortgage loans acquired for sale $ 16,737 Payments made to settle losses $ 2,938 ($ in thousands) Since Inception(1) As of December 31, 2017 1Q18 Activity 2Q18 Activity 3Q18 Activity 4Q18 Activity As of December 31, 2018 Year ended December 31, 2017 Total UPB of mortgage loans transferred under CRT agreements $44,178,673 UPB of mortgage loans transferred under CRT agreements $35,869,965 $30,322,988 $3,210,478 $2,336,499 $0 $35,869,965 $14,529,548 UPB of mortgage loans delivered subject to agreements to purchase REMIC CRT securities $8,308,708 $1,535,372 $6,773,336 $8,308,708 Deposits of cash to secure guarantees $,703,040 ,606,594 41,789 36,099 18,558 ,703,040 $,152,641 Gains (losses) recognized on assets related to CRT agreements Included in net gain on investments: Realized $,139,767 74,860 19,329 22,211 23,367 ,139,767 $51,731 Valuation-related ,120,708 92,994 5,355 15,174 7,185 ,120,708 $83,030 $,260,475 ,167,854 24,684 37,385 30,552 0 ,260,475 $,134,761 Included in net gain on mortgage loans acquired for sale $16,737 4,426 12,311 $16,737 Payments made to settle losses $2,938 $1,486 $828 $181 $443 $2,938 $1,396 ($ in thousands) At June 30, 2018 UPB of mortgage loans subject to guarantee obligation $38,745,966 Delinquency Current to 89 days delinquent $38,666,737 90 or more days delinquent $48,575 Foreclosure $9,339 Bankruptcy $21,315 Carrying value of CRT agreements Deposits securing CRT agreements $,662,624 Derivative assets $,126,354 Firm commitment to purchase CRT security $18,749 Commitments to fund deposits securing CRT agreements $,578,508 Firm commitments to purchase CRT securities $,294,698
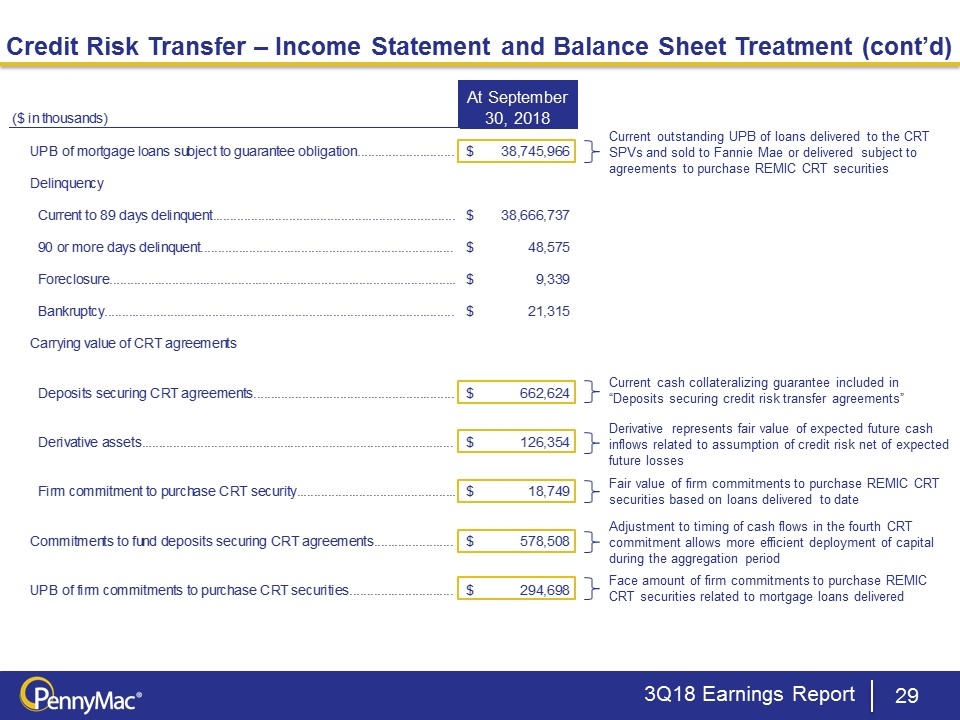
Current outstanding UPB of loans delivered to the CRT SPVs and sold to Fannie Mae or delivered subject to agreements to purchase REMIC CRT securities Credit Risk Transfer – Income Statement and Balance Sheet Treatment (cont’d) Current cash collateralizing guarantee included in “Deposits securing credit risk transfer agreements” Derivative represents fair value of expected future cash inflows related to assumption of credit risk net of expected future losses Fair value of firm commitments to purchase REMIC CRT securities based on loans delivered to date Adjustment to timing of cash flows in the fourth CRT commitment allows more efficient deployment of capital during the aggregation period Face amount of firm commitments to purchase REMIC CRT securities related to mortgage loans delivered At September 30, 2018 3Q18 Earnings Report At September At June30, 20183 , 2018 ($ in thousands) UPB of mortgage loans subject to guarantee obligation $ 38,745,966 Delinquency Current to 89 days delinquent $ 38,666,737 90 or more days delinquent $ 48,575 Foreclosure $ 9,339 Bankruptcy $ 21,315 Carrying value of CRT agreements Deposits securing CRT agreements $ 662,624 Derivative assets $ 126,354 Firm commitment to purchase CRT security $ 18,749 Commitments to fund deposits securing CRT agreements $ 578,508 UPB of firm commitments to purchase CRT securities $ 294,698 ($ in thousands) Since Inception(1) As of December 31, 2017 1Q18 Activity 2Q18 Activity 3Q18 Activity 4Q18 Activity As of December 31, 2018 Year ended December 31, 2017 Total UPB of mortgage loans transferred under CRT agreements $44,178,673 UPB of mortgage loans transferred under CRT agreements $35,869,965 $30,322,988 $3,210,478 $2,336,499 $0 $35,869,965 $14,529,548 UPB of mortgage loans delivered subject to agreements to purchase REMIC CRT securities $8,308,708 $1,535,372 $6,773,336 $8,308,708 Deposits of cash to secure guarantees $,703,040 ,606,594 41,789 36,099 18,558 ,703,040 $,152,641 Gains (losses) recognized on assets related to CRT agreements Included in net gain on investments: Realized $,139,767 74,860 19,329 22,211 23,367 ,139,767 $51,731 Valuation-related ,120,708 92,994 5,355 15,174 7,185 ,120,708 $83,030 $,260,475 ,167,854 24,684 37,385 30,552 0 ,260,475 $,134,761 Included in net gain on mortgage loans acquired for sale $16,737 4,426 12,311 $16,737 Payments made to settle losses $2,938 $1,486 $828 $181 $443 $2,938 $1,396 ($ in thousands) At June 30, 2018 UPB of mortgage loans subject to guarantee obligation $38,745,966 Delinquency Current to 89 days delinquent $38,666,737 90 or more days delinquent $48,575 Foreclosure $9,339 Bankruptcy $21,315 Carrying value of CRT agreements Deposits securing CRT agreements $,662,624 Derivative assets $,126,354 Firm commitment to purchase CRT security $18,749 Commitments to fund deposits securing CRT agreements $,578,508 UPB of firm commitments to purchase CRT securities $,294,698
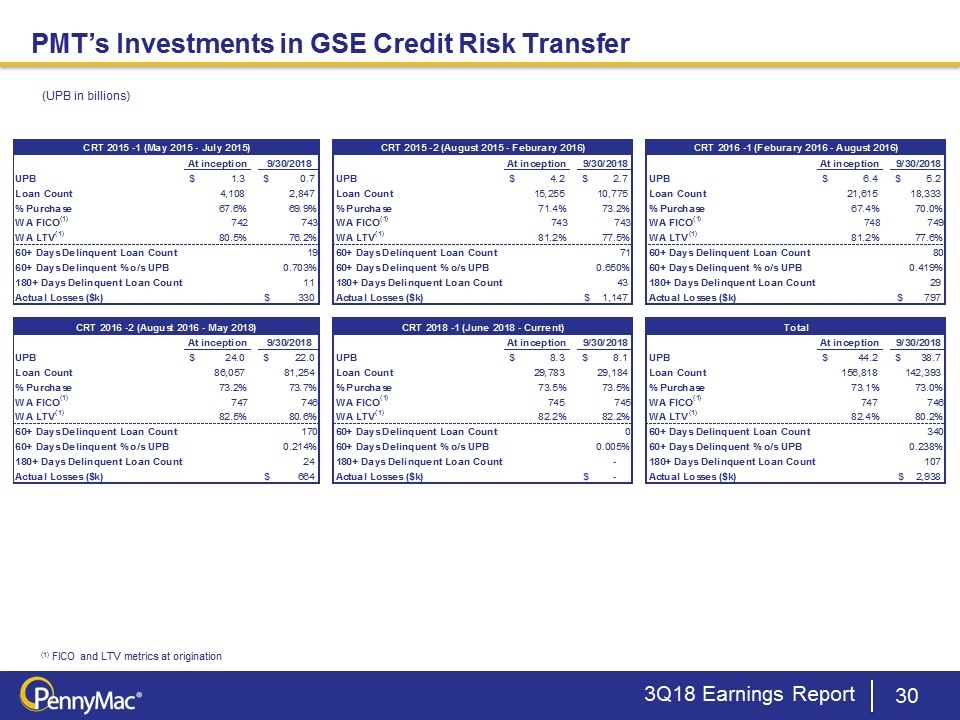
(1) FICO and LTV metrics at origination (UPB in billions) PMT’s Investments in GSE Credit Risk Transfer 3Q18 Earnings Report CRT 2015 -1 (May 2015 - July 2015) CRT 2015 -2 (August 2015 - Feburary 2016) CRT 2016 -1 (Feburary 2016 - August 2016) At inception 9/30/2018 At inception 9/30/2018 At inception 9/30/2018 UPB $ 1.3 $ 0.7 UPB $ 4.2 $ 2.7 UPB $ 6.4 $ 5.2 Loan Count 4,108 2,847 Loan Count 15,255 10,775 Loan Count 21,615 18,333 % Purchase 67.6% 69.9% % Purchase 71.4% 73.2% % Purchase 67.4% 70.0% WA FICO(1) 742 743 WA FICO(1) 743 743 WA FICO(1) 748 749 WA LTV(1) 80.5% 76.2% WA LTV(1) 81.2% 77.5% WA LTV(1) 81.2% 77.6% 60+ Days Delinquent Loan Count 19 60+ Days Delinquent Loan Count 71 60+ Days Delinquent Loan Count 80 60+ Days Delinquent % o/s UPB 0.703% 60+ Days Delinquent % o/s UPB 0.650% 60+ Days Delinquent % o/s UPB 0.419% 180+ Days Delinquent Loan Count 11 180+ Days Delinquent Loan Count 43 180+ Days Delinquent Loan Count 29 Actual Losses ($k) $ 330 Actual Losses ($k) $ 1,147 Actual Losses ($k) $ 797 CRT 2016 -2 (August 2016 - May 2018) CRT 2018 -1 (June 2018 - Current) Total At inception 9/30/2018 At inception 9/30/2018 At inception 9/30/2018 UPB $ 24.0 $ 22.0 UPB $ 8.3 $ 8.1 UPB $ 44.2 $ 38.7 Loan Count 86,057 81,254 Loan Count 29,783 29,184 Loan Count 156,818 142,393 % Purchase 73.2% 73.7% % Purchase 73.5% 73.5% % Purchase 73.1% 73.0% WA FICO(1) 747 746 WA FICO(1) 745 745 WA FICO(1) 747 746 WA LTV(1) 82.5% 80.6% WA LTV(1) 82.2% 82.2% WA LTV(1) 82.4% 80.2% 60+ Days Delinquent Loan Count 170 60+ Days Delinquent Loan Count 0 60+ Days Delinquent Loan Count 340 60+ Days Delinquent % o/s UPB 0.214% 60+ Days Delinquent % o/s UPB 0.005% 60+ Days Delinquent % o/s UPB 0.238% 180+ Days Delinquent Loan Count 24 180+ Days Delinquent Loan Count - 180+ Days Delinquent Loan Count 107 Actual Losses ($k) $ 664 Actual Losses ($k) $ - Actual Losses ($k) $ 2,938 ($ in billions) CRT 2015 -1 (May 2015 - July 2015) CRT 2015 -2 (August 2015 - Feburary 2016) CRT 2016 -1 (Feburary 2016 - August 2016) At inception 43373 At inception 43373 At inception 43373 UPB $1.32 $0.72226950603999995 UPB $4.2 $2.7325724278000001 UPB $6.4 $5.2417195570100006 Loan Count 4,108 2,847 Loan Count 15,255 10,775 Loan Count 21,615 18,333 % Purchase 0.67599805258033097 0.69863013698630105 % Purchase 0.71399541134054401 0.73234338747099703 % Purchase 0.67400000000000004 0.69999454535536998 WA FICO(1) 741.62092290717601 743.02682117122197 WA FICO(1) 742.59141710737094 743.37805191687096 WA FICO(1) 748.14379736670799 749.35814770617696 WA LTV(1) 0.80542303113345803 0.76173786926109999 WA LTV(1) 0.81227108641329104 0.77466547649200002 WA LTV(1) 0.81213195516699999 0.7759840685253 60+ Days Delinquent Loan Count 19 60+ Days Delinquent Loan Count 71 60+ Days Delinquent Loan Count 80 60+ Days Delinquent % o/s UPB .703% 60+ Days Delinquent % o/s UPB .65% 60+ Days Delinquent % o/s UPB .419% 180+ Days Delinquent Loan Count 11 180+ Days Delinquent Loan Count 43 180+ Days Delinquent Loan Count 29 Actual Losses ($k) $330 Actual Losses ($k) $1,147 Actual Losses ($k) $797 CRT 2016 -2 (August 2016 - May 2018) CRT 2018 -1 (June 2018 - Current) Total At inception 43373 At inception 43373 At inception 43373 UPB $24.026818736589998 $21.95154533825 UPB $8.2979568711999985 $8.0979568711999992 UPB $44.244775607790004 $38.746063700299999 Loan Count 86,057 81,254 Loan Count 29,783 29,184 Loan Count ,156,818 ,142,393 % Purchase 0.73231658537844102 0.73744061830802099 % Purchase 0.73478654558044099 0.73478654558044099 % Purchase 0.73136433879872498 0.72966715308635444 WA FICO(1) 747 746.20880232900299 WA FICO(1) 745.192866068169 745.192866068169 WA FICO(1) 746.57420847996696 746.16357189559437 WA LTV(1) 0.82499999999999996 0.80645170228270002 WA LTV(1) 0.82194894891619996 0.82194894891619996 WA LTV(1) 0.82389303189784702 0.80249361352516979 60+ Days Delinquent Loan Count 170 60+ Days Delinquent Loan Count 0 60+ Days Delinquent Loan Count 340 60+ Days Delinquent % o/s UPB .214% 60+ Days Delinquent % o/s UPB 54347189914680702.543% 60+ Days Delinquent % o/s UPB .238% 180+ Days Delinquent Loan Count 24 180+ Days Delinquent Loan Count 0 180+ Days Delinquent Loan Count 107 Actual Losses ($k) $664 Actual Losses ($k) $0 Actual Losses ($k) $2,938
