
Form 8-K Internap Corp For: Nov 01
UNITED STATES
SECURITIES AND EXCHANGE COMMISSION
WASHINGTON, D.C. 20549
FORM 8-K
CURRENT REPORT
PURSUANT TO SECTION 13 OR 15(d) OF THE
SECURITIES EXCHANGE ACT OF 1934
Date of Report (Date of earliest event reported):
November 1, 2018
Internap Corporation
(Exact Name of Registrant as Specified in Charter)
|
Delaware
|
001-31989
|
91-2145721
|
|
(State or Other Jurisdiction
of Incorporation)
|
(Commission File Number)
|
(IRS Employer
Identification Number
|
|
12120 Sunset Hills Road, Suite 330, Reston, Virginia
(Address of Principal Executive Offices)
|
20190
(Zip Code)
|
Registrant’s telephone number, including area code: (404) 302-9700
Not applicable
(Former Name or Former Address, if Changed Since Last Report)
Check the appropriate box below if the Form 8-K filing is intended to simultaneously satisfy the filing obligation of the registrant under any of the
following provisions (see General Instruction A.2. below):
| ☐ |
Written communications pursuant to Rule 425 under the Securities Act (17 CFR 230.425)
|
| ☐ |
Soliciting material pursuant to Rule 14a-12 under the Securities Act (17 CFR 240.14a-12)
|
| ☐ |
Pre-commencement communications pursuant to Rule 14d-2(b) under the Securities Act (17 CFR 240.14d-2(b))
|
| ☐ |
Pre-commencement communications pursuant to Rule 13e-4(c) under the Securities Act (17 CFR 240.13e-2(c))
|
Indicate by check mark whether the registrant is an emerging growth company as defined in Rule 405 of the Securities Act of 1933 (§230.405 of this chapter) or
Rule 12b-2 of the Securities Exchange Act of 1934 (§240.12b-2 of this chapter).
Emerging growth company ☐
If an emerging growth company, indicate by check mark if the registrant has elected not to use the extended transition period for complying with any new or
revised financial accounting standards provided pursuant to Section 13(a) of the Exchange Act. ☐
|
Item 2.02
|
Results of Operations and Financial Condition.
|
On November 1, 2018, Internap Corporation (the “Company”) issued a press release announcing its financial results for the quarter ended September 30, 2018. A copy of the press release is attached hereto as Exhibit 99.1 and is incorporated herein by reference.
On November 1, 2018, the Company will host a conference call to discuss its results for the quarter ended September 30, 2018. A copy of the presentation to be used during the conference call is attached hereto as Exhibit 99.2 and is incorporated herein by reference.
Copies of the press release and the presentation were posted to the Investor
Relations section of the Company’s website at http://www.INAP.com on November 1, 2018.
The information contained herein and in the accompanying exhibits shall not be incorporated by reference into any filing of the Company,
whether made before or after the date hereof, regardless of any general incorporation language in such filing, unless expressly incorporated by specific reference to this or such filing. The information in this report, including the exhibits
hereto, shall be deemed to be “furnished” and therefore shall not be deemed to be “filed” for purposes of Section 18 of the Securities Exchange Act of 1934, as amended, or otherwise subject to the liabilities of that section or Sections 11 and
12(a)(2) of the Securities Act of 1933, as amended.
|
Item 7.01
|
Regulation FD Disclosure.
|
The information in Item 2.02 is incorporated by reference herein.
The information contained herein and in the accompanying exhibits shall not be incorporated by reference into any filing of the Company,
whether made before or after the date hereof, regardless of any general incorporation language in such filing, unless expressly incorporated by specific reference to this or such filing. The information in this report, including the exhibits
hereto, shall be deemed to be “furnished” and therefore shall not be deemed to be “filed” for purposes of Section 18 of the Securities Exchange Act of 1934, as amended, or otherwise subject to the liabilities of that section or Sections 11 and
12(a)(2) of the Securities Act of 1933, as amended.
|
Item 9.01
|
Financial Statements and Exhibits.
|
|
(d)
|
Exhibits
|
The following exhibits are furnished with this Current Report on Form 8-K:
|
Exhibit No.
|
Description
|
|
|
Press Release, dated November 1, 2018
|
||
|
Presentation, dated November 1, 2018
|
SIGNATURES
Pursuant to the requirements of the Securities Exchange Act of 1934, the registrant has duly caused this report to be signed on its behalf by the undersigned
hereunto duly authorized.
|
INTERNAP CORPORATION
|
||
|
Date: November 1, 2018
|
By:
|
/s/ James C. Keeley
|
|
James C. Keeley
|
||
|
Chief Financial Officer
|
||
Exhibit 99.1

INAP Reports Third Quarter 2018 Financial Results
| • |
Reported Revenue of $83.0 Million up 1.2% Sequentially and 20.4% Year-over-Year
|
| • |
GAAP Net Loss of $(15.1) Million, or GAAP Net Loss Margin of (18.2)%
|
| • |
Adjusted EBITDA of $29.4 Million up 3.5% Sequentially and 26.2% Year-over-Year; Adjusted
EBITDA Margin of 35.4% up 80 Basis Points Quarter-over-Quarter and up 160 Basis Points Year-over-Year
|
| • |
Cash Flow from Operations was $10.3 Million, with Capital Expenditures of $12.0 Million
|
| • |
Subsequent to Quarter-End, INAP Closed $40 Million Common Stock Offering to Continue to
Gain Flexibility and Fuel Organic Growth
|
RESTON, VA - (November 1, 2018) Internap
Corporation (NASDAQ: INAP), a global provider of high-performance data center services, including colocation, cloud and network, announced today financial results for the third quarter of 2018.
“We are committed to growing INAP, winning larger deals with more consistency than ever before,” stated Peter D. Aquino, President and
Chief Executive Officer. “With our wholesale and retail marketing strategy, our backlog continues to replenish at over $20 million for the last two quarters. We recently recorded our largest colocation deal of the year, selling nearly 1 MW of
capacity in our Dallas Flagship data center. Through September, our sales team has booked three large wholesale colocation deals worth over $15 million in total contract value, and are positioned to do much more with the addition of assets in
Phoenix, Atlanta and London. In addition, the upselling of our new cloud platform is also providing new growth prospects for INAP, both domestically and abroad. As we continue to swap out less profitable sites for our own data center facilities to
provide our customers with premier Tier 3 infrastructure products, we are building a more valuable portfolio for the future. The purpose of the recent equity raise was to continue to fuel our sales growth, accelerate customer installations, and
position INAP to gain greater flexibility for potential future accretive deals.”
Revenue
2018 results include SingleHop LLC (“SingleHop”) operations beginning March 1, 2018, and are therefore not comparable to prior periods.
For the third quarter:
| · |
Revenue totaled $83.0 million in the third quarter of 2018, an increase of 1.2% sequentially and 20.4% year-over-year. The sequential increase was primarily due to organic
colocation growth, and the acquisition of INAP’s new Phoenix facility, offset by planned data center closures. The increase year-over-year was primarily due to revenue from organic colocation growth, and the addition of SingleHop.
|
Beginning with the first quarter of 2018, INAP redefined its segment reporting by geography into INAP US and INAP INTL.
| o |
INAP US revenue totaled $65.7 million in the third quarter of 2018, an increase of 2.5% sequentially and 24.0% year-over-year. The sequential increase was primarily due to
colocation and cloud growth. The increase year-over-year was primarily due to revenue from organic growth, and the addition of SingleHop.
|
| o |
INAP INTL revenue totaled $17.3 million in the third quarter of 2018, a decrease of 3.4% sequentially and an increase of 8.5% year-over-year. The modest decrease
sequentially in top line revenue was primarily driven by declines in legacy managed services and iWeb. The increase year-over-year was primarily due to revenue from the INAP Japan consolidation, the addition of SingleHop and lower
churn.
|
Third Quarter 2018 Financial Summary
|
($ in thousands)
|
3Q 2018
|
2Q 2018
|
3Q 2017
|
QoQ
Growth
|
YoY
Growth
|
|||||||||||||||
|
Net Revenues
|
$
|
82,972
|
$
|
81,962
|
$
|
68,907
|
1.2
|
%
|
20.4
|
%
|
||||||||||
|
Operating Costs and Expenses
|
$
|
80,798
|
$
|
79,835
|
$
|
68,175
|
1.2
|
%
|
18.5
|
%
|
||||||||||
|
Depreciation and Amortization
|
$
|
23,431
|
$
|
22,590
|
$
|
20,917
|
3.7
|
%
|
12.0
|
%
|
||||||||||
|
Exit Activities, Restructuring and Impairments
|
$
|
2,347
|
$
|
826
|
$
|
745
|
184.1
|
%
|
215.0
|
%
|
||||||||||
|
All Other Operating Costs and Expenses
|
$
|
55,020
|
$
|
56,419
|
$
|
46,513
|
(2.5
|
)%
|
18.3
|
%
|
||||||||||
|
GAAP Net Loss Attributable to INAP Shareholders
|
$
|
(15,106
|
)
|
$
|
(13,923
|
)
|
$
|
(10,895
|
)
|
8.5
|
%
|
38.7
|
%
|
|||||||
|
GAAP Net Loss Margin
|
(18.2
|
)%
|
(17.0
|
)%
|
(15.8
|
)%
|
||||||||||||||
|
Minus Stock-Based Compensation and Other Items
|
$
|
3,872
|
$
|
3,760
|
$
|
757
|
3.0
|
%
|
411.5
|
%
|
||||||||||
|
Normalized Net Loss2
|
$
|
(11,234
|
)
|
$
|
(10,163
|
)
|
$
|
(10,138
|
)
|
10.5
|
%
|
10.8
|
%
|
|||||||
|
Adjusted EBITDA1
|
$
|
29,386
|
$
|
28,384
|
$
|
23,277
|
3.5
|
%
|
26.2
|
%
|
||||||||||
|
Adjusted EBITDA Margin1
|
35.4
|
%
|
34.6
|
%
|
33.8
|
%
|
||||||||||||||
|
Capital Expenditures (CapEx)
|
$
|
12,003
|
$
|
11,083
|
$
|
10,965
|
8.3
|
%
|
9.5
|
%
|
||||||||||
|
Adjusted EBITDA less CapEx1
|
$
|
17,383
|
$
|
17,301
|
$
|
12,312
|
0.5
|
%
|
41.2
|
%
|
||||||||||
Net Loss, Normalized Net Loss, Adjusted EBITDA and Business Unit Contribution
| ● |
GAAP net loss attributable to INAP shareholders was $(15.1) million, or $(0.75) per share in the third quarter of 2018 compared with $(13.9) million, or $(0.69) per share
in the second quarter of 2018. GAAP net loss in third quarter of 2017 was $(10.9) million.
|
| ● |
Normalized net loss was $(11.2) million in the third quarter of 2018 compared with $(10.2) million in the second quarter of 2018 and $(10.1) million in the third quarter of
2017.
|
| ● |
Adjusted EBITDA totaled $29.4 million in the third quarter of 2018, an increase of 3.5% compared with $28.4 million in the second quarter of 2018, and a 26.2% increase
compared with $23.2 million in the third quarter of 2017. Adjusted EBITDA margin was 35.4% in the third quarter, up 80 basis points compared to 34.6% in the second quarter, and up 160 basis points compared to 33.8% in third quarter of
2017. The increase in Adjusted EBITDA was primarily driven by the addition of SingleHop and INAP’s initiative to exit less profitable data center sites.
|
2
Business Unit Contribution3 - INAP US and INAP INTL
business unit contribution for third quarter of 2018 is as follows:
INAP US, includes colocation, cloud, and network services. Cloud contains AgileCloud, Managed Hosting, and SingleHop.
| o |
INAP US business unit contribution totaled $29.8 million in the third quarter, a 2.2% increase compared to the second quarter of 2018 and a 27.7% increase from the third
quarter of 2017. As a percent of revenue, INAP US business unit contribution margin was 45.4% in the third quarter of 2018, slightly down 20 basis points sequentially and up 130 basis points year-over-year. INAP US business unit
contribution increased year-over-year primarily due to the Company’s data center portfolio management strategy to expand margins.
|
INAP INTL, includes colocation, cloud, and network services. Cloud contains AgileCloud, Managed Hosting, Ubersmith, iWeb, and SingleHop.
| o |
INAP INTL business unit contribution totaled $5.8 million in the third quarter of 2018, a 3.4% decrease compared with the second quarter of 2018 and a 4.1% decrease from
the third quarter of 2017. As a percent of revenue, INAP INTL business unit contribution margin was 33.6% in the third quarter of 2018, slightly down 10 basis points sequentially and 440 basis points year-over-year. INAP INTL business
contribution decreased primarily due to consolidation of INAP Japan with currently lower margins.
|
“We expect the operations improvements will continue to expand margins into 2019,” said Jim Keeley, Chief Financial Officer. “As we
narrow guidance with one quarter to go in 2018, we are confident that we can maintain momentum to strengthen INAP’s portfolio into 2019.”
Balance Sheet and Cash
Flow Statement
| ● |
Cash and cash equivalents totaled $11.8 million at September 30, 2018. Total debt was $696.2 million, net of discount and prepaid costs, at the end of the third quarter of
2018, including $262.0 million in capital lease obligations. As previously reported, in August 2018, INAP entered into a Fifth Amendment to INAP’s Credit Agreement, to increase the aggregate revolving commitment capacity by $10.0
million to $35.0 million.
|
| ● |
Cash generated from operations for the three months ended September 30, 2018 was $10.3 million compared to $15.3 million in second quarter of 2018, and $3.3 million in the
third quarter of 2017. Capital expenditures over the same periods were $12.0 million, compared to $11.1 million and $11.0 million, respectively. Adjusted EBITDA less CapEx1 was $17.4 million, compared to $17.3 million in second quarter of 2018 and $12.3 million in third quarter of 2017. Free cash flow4 over
the same periods was $(1.7) million, compared to $4.3 million and $(7.7) million, respectively. Unlevered free cash flow4 was $14.1 million for the third
quarter of 2018, compared to $19.8 million in second quarter of 2018 and $3.3 million in third quarter of 2017.
|
| ● |
On October 23, 2018, INAP completed an underwritten public offering of 4,210,527 shares of common stock at a public offering price of $9.50 per share. The net proceeds to
the Company from the offering were approximately $36.6 million, after deducting underwriting discounts and commissions and other estimated offering expenses. INAP granted the underwriters a 30-day option to purchase up to 631,579
additional shares of common stock on the same terms and conditions as the shares offered in the public offering.
|
3
Business Outlook
INAP’s outlook for 2018, as noted above, includes projected results of acquired SingleHop operations as of March 1, 2018. With three
quarters of actuals results, the Company is narrowing its full-year 2018 revenue, Adjusted EBITDA and capital expenditures range within its previous outlook, as shown in the table below.
|
Full-Year 2018 Expected Range
|
||||
|
Original Guidance,
as of 3/9/2018
|
Revised Guidance,
as of 8/2/2018
|
Narrowed Guidance within
Previous Range, as of 11/1/2018
|
||
|
Revenue
|
$320 million - $330 million
|
$320 million - $330 million
|
$320 million - $324 million
|
|
|
Adjusted EBITDA (non-GAAP)
|
$105 million - $115 million
|
$110 million - $120 million
|
$111 million - $114 million
|
|
|
Capital Expenditures
|
$40 million - $45 million
|
$40 million - $45 million
|
$40 million - $43 million
|
|
| 1. |
Adjusted EBITDA, Adjusted EBITDA margin and Adjusted EBITDA less CapEx are non-GAAP financial measures which we define in an attachment to this press release entitled
“Non-GAAP (Adjusted) Financial Measures.” Reconciliations between GAAP information and non-GAAP information related to Adjusted EBITDA and Adjusted EBITDA margin are contained in the table entitled “Reconciliation of GAAP Net Loss to
Adjusted EBITDA and Forward Looking Adjusted EBITDA.” Adjusted EBITDA margin is Adjusted EBITDA as a percentage of revenue. A reconciliation between GAAP information and non-GAAP information related to Adjusted EBITDA less CapEx is
contained in the table entitled “Reconciliation of GAAP Net Cash Flows provided by Operating Activities to Adjusted EBITDA less CapEx.”
|
| 2. |
Normalized net loss is a non-GAAP financial measure which we define in an attachment to this press release entitled “Non-GAAP (Adjusted) Financial Measures.”
Reconciliations between GAAP information and non-GAAP information related to normalized net loss are contained in the table entitled “Reconciliation of Net Loss Attributable to INAP Shareholders to Normalized Net Loss to INAP
Shareholders.”
|
| 3. |
Business unit contribution and business unit contribution margin are non-GAAP financial measures which we define in an attachment to this press release entitled “Non-GAAP
(Adjusted) Financial Measures.” Reconciliations between GAAP and non-GAAP information related to business unit contribution and business unit contribution margin are contained in the table entitled “Business Unit Contribution and
Business Unit Contribution Margin” in the attachment. Business unit contribution margin is business unit contribution as a percentage of revenue.
|
| 4. |
Free cash flow and unlevered free cash flow are non-GAAP financial measures which we define in the attachment to the press release entitled “Non-GAAP (Adjusted) Financial
Measures.” Reconciliations between GAAP and non-GAAP information related to free cash flow and unlevered free cash flow are contained in the table entitled “Free Cash Flow and Unlevered Free Cash Flow.”
|
4
Conference Call Information
INAP’s third quarter 2018 conference call will be held today at 8:30 a.m. ET. Listeners may connect to a simultaneous webcast of the call, which will
include accompanying presentation slides, on the Investor Relations section of INAP’s web site at http://ir.inap.com/events-and-presentations.
The call can also be accessed by dialing 877-334-0775. International callers should dial 631-291-4567. An online archive of the webcast will be archived in
the Investor Relations section of the Company’s website. An audio-only telephonic replay will be accessible from Thursday, November 1, 2018 at 11:30 a.m. ET through Wednesday, November 6, 2018 at 855-859-2056 using replay code 8998493.
International callers can listen to the archived event at 404-537-3406 with the same code.
About INAP
Internap Corporation (NASDAQ: INAP) is a global provider of high-performance data center services, including colocation, cloud and network. INAP partners
with its customers, who range from the Fortune 500 to emerging start-ups, to create secure, scalable and reliable IT infrastructure solutions that meet the customer’s unique business requirements. INAP operates in 53, primarily Tier 3, data centers
in 21 metropolitan markets and has 102 POPs around the world. INAP has over 1 million gross square feet in its portfolio, and approximately 600,000 square feet of sellable data center space. For more information, visit www.inap.com.
Forward-Looking Statements
This press release contains forward-looking statements. Forward-looking statements include statements regarding industry trends, our future financial
position and performance, business strategy, revenues and expenses in future periods, projected levels of growth and other matters that do not relate strictly to historical facts. These statements are often identified by words such as “may,”
“will,” “seeks,” “anticipates,” “believes,” “estimates,” “expects,” “projects,” “forecasts,” “plans,” “intends,” “continue,” “could” or “should,” that an “opportunity” exists, that we are “positioned” for a particular result, statements regarding
our vision or similar expressions or variations. These statements are based on the beliefs and expectations of our management team based on information available at the time such statements are made. Such forward-looking statements are not
guarantees of future performance and are subject to risks and uncertainties that could cause actual results to differ materially from those contemplated by such forward-looking statements. Therefore, actual future results and trends may differ
materially from what is forecast in such forward-looking statements due to a variety of factors, including, without limitation: to drive growth while reducing costs; our ability to maintain current customers and obtain new ones, whether in a
cost-effective manner or at all; the robustness of the IT infrastructure services market; our ability to achieve or sustain profitability; our ability to expand margins and drive higher returns on investment; our ability to sell into new and
existing data center space; the actual performance of our IT infrastructure services and improving operations; our ability to correctly forecast capital needs, demand planning and space utilization; our ability to respond successfully to
technological change and the resulting competition; the geographic concentration of the company’s data centers in certain markets and any adverse developments in local economic conditions or the demand for data center space in these markets;
ability to identify any suitable strategic transactions; INAP’s ability to realize anticipated revenue, growth, synergies and cost savings from the acquisition of SingleHop; INAP’s ability to successfully integrate SingleHop’s sales, operations,
technology, and products generally; the availability of services from Internet network service providers or network service providers providing network access loops and local loops on favorable terms, or at all; failure of third party suppliers to
deliver their products and services on favorable terms, or at all; failures in our network operations centers, data centers, network access points or computer systems; our ability to provide or improve Internet infrastructure services to our
customers; our ability to protect our intellectual property; our substantial amount of indebtedness, our possibility to raise additional capital when needed, on attractive terms, or at all, our ability to service existing debt or maintain
compliance with financial and other covenants contained in our credit agreement; our compliance with and changes in complex laws and regulations in the U.S. and internationally; our ability to attract and retain qualified management and other
personnel; and volatility in the trading price of INAP common stock.
These risks and other important factors discussed under the caption “Risk Factors” in our most recent Annual Report on Form 10-K filed with the SEC, and
our other reports filed with the SEC could cause actual results to differ materially from those indicated by the forward-looking statements made in this press release.
5
Given these risks and uncertainties, investors should not place undue reliance on forward-looking statements as a prediction of actual results. All
forward-looking statements attributable to INAP or persons acting on its behalf are expressly qualified in their entirety by the foregoing forward-looking statements. All such statements speak only as of the date made, and INAP undertakes no
obligation to update or revise publicly any forward-looking statements, whether as a result of new information, future events or otherwise.
###
|
Investor Contacts
|
|
|
Richard Ramlall
|
Carolyn Capaccio/Jody Burfening
|
|
Chief Communications Officer INAP
|
LHA
|
|
404-302-9982
|
212-838-3777
|
6
INTERNAP CORPORATION AND SUBSIDIARIES
CONDENSED CONSOLIDATED STATEMENTS OF OPERATIONS
AND COMPREHENSIVE LOSS
(In thousands, except per share amounts)
(Unaudited)
|
Three Months Ended September 30,
|
Nine Months Ended September 30,
|
|||||||||||||||
|
2018
|
2017
|
2018
|
2017
|
|||||||||||||
|
Net revenues
|
82,972
|
68,907
|
239,135
|
210,682
|
||||||||||||
|
Operating costs and expenses:
|
||||||||||||||||
|
Cost of sales and services, exclusive of depreciation and amortization
|
28,866
|
24,945
|
81,880
|
80,419
|
||||||||||||
|
Costs of customer support
|
7,984
|
6,237
|
24,212
|
19,634
|
||||||||||||
|
Sales, general and administrative
|
18,170
|
15,331
|
57,625
|
47,466
|
||||||||||||
|
Depreciation and amortization
|
23,431
|
20,917
|
67,097
|
57,596
|
||||||||||||
|
Exit activities, restructuring and impairments
|
2,347
|
745
|
3,140
|
6,396
|
||||||||||||
|
Total operating costs and expenses
|
80,798
|
68,175
|
233,954
|
211,511
|
||||||||||||
|
Income (loss) from operations
|
2,174
|
732
|
5,181
|
(829
|
)
|
|||||||||||
|
Interest expense
|
16,898
|
12,299
|
47,786
|
37,581
|
||||||||||||
|
Loss on foreign currency, net
|
195
|
197
|
5
|
485
|
||||||||||||
|
Total non-operating expenses
|
17,093
|
12,496
|
47,791
|
38,066
|
||||||||||||
|
Loss before income taxes and equity in earnings of equity-method investment
|
(14,919
|
)
|
(11,764
|
)
|
(42,610
|
)
|
(38,895
|
)
|
||||||||
|
Provision for income taxes
|
162
|
221
|
404
|
689
|
||||||||||||
|
Equity in earnings of equity-method investment, net of taxes
|
-
|
(1,122
|
)
|
-
|
(1,207
|
)
|
||||||||||
|
Net loss
|
(15,081
|
)
|
(10,863
|
)
|
(43,014
|
)
|
(38,377
|
)
|
||||||||
|
Less net income attributable to non-controlling interest
|
25
|
32
|
75
|
32
|
||||||||||||
|
Net loss attributable to INAP stockholders
|
(15,106
|
)
|
(10,895
|
)
|
(43,089
|
)
|
(38,409
|
)
|
||||||||
|
Other comprehensive (loss) income:
|
||||||||||||||||
|
Foreign currency translation adjustment
|
(98
|
)
|
(91
|
)
|
24
|
14
|
||||||||||
|
Unrealized gain on foreign currency contracts
|
-
|
-
|
-
|
145
|
||||||||||||
|
Total other comprehensive (loss) income
|
(98
|
)
|
(91
|
)
|
24
|
159
|
||||||||||
|
Comprehensive loss
|
$
|
(15,204
|
)
|
$
|
(10,986
|
)
|
$
|
(43,065
|
)
|
$
|
(38,250
|
)
|
||||
|
Basic and diluted net loss per share
|
$
|
(0.75
|
)
|
$
|
(0.56
|
)
|
$
|
(2.16
|
)
|
$
|
(2.04
|
)
|
||||
|
Weighted average shares outstanding used in computing basic and diluted net loss per share
|
20,206
|
19,929
|
19,968
|
18,645
|
||||||||||||
7
INTERNAP CORPORATION AND SUBSIDIARIES
CONDENSED CONSOLIDATION BALANCE SHEETS
(In thousands, except par value amounts)
(Unaudited)
|
September 30,
2018
|
December 31,
2017
|
|||||||
|
ASSETS
|
||||||||
|
Current assets:
|
||||||||
|
Cash and cash equivalents
|
$
|
11,844
|
$
|
14,603
|
||||
|
Accounts receivable, net of allowance for doubtful accounts of $1,418 and $1,487, respectively
|
22,999
|
17,794
|
||||||
|
Contract assets
|
8,026
|
—
|
||||||
|
Prepaid expenses and other assets
|
9,497
|
8,673
|
||||||
|
Total current assets
|
52,366
|
41,070
|
||||||
|
Property and equipment, net
|
477,423
|
458,565
|
||||||
|
Intangible assets, net
|
74,738
|
25,666
|
||||||
|
Goodwill
|
116,705
|
50,209
|
||||||
|
Non-current contract assets
|
12,756
|
—
|
||||||
|
Deposits and other assets
|
12,050
|
11,015
|
||||||
|
Total assets
|
$
|
746,038
|
$
|
586,525
|
||||
|
LIABILITIES AND STOCKHOLDERS’ DEFICIT
|
||||||||
|
Current liabilities:
|
||||||||
|
Accounts payable
|
$
|
32,243
|
$
|
20,388
|
||||
|
Accrued liabilities
|
17,866
|
15,908
|
||||||
|
Deferred revenues
|
4,696
|
4,861
|
||||||
|
Capital lease obligations
|
9,399
|
11,711
|
||||||
|
Revolving credit facility
|
18,500
|
5,000
|
||||||
|
Term loan, less discount and prepaid costs of $3,912 and $2,133, respectively
|
444
|
867
|
||||||
|
Exit activities and restructuring liability
|
3,255
|
4,152
|
||||||
|
Other current liabilities
|
3,637
|
1,707
|
||||||
|
Total current liabilities
|
90,040
|
64,594
|
||||||
|
Capital lease obligations
|
252,599
|
223,749
|
||||||
|
Term loan, less discount and prepaid costs of $10,625 and $7,655, respectively
|
415,251
|
287,845
|
||||||
|
Exit activities and restructuring liability
|
162
|
664
|
||||||
|
Deferred rent
|
940
|
1,310
|
||||||
|
Deferred tax liability
|
1,952
|
1,651
|
||||||
|
Other long-term liabilities
|
4,060
|
7,744
|
||||||
|
Total liabilities
|
$
|
765,004
|
$
|
587,557
|
||||
| Commitments and contingencies |
||||||||
| Stockholders' deficit: |
||||||||
|
Preferred stock, $0.001 par value; 5,000 shares authorized; no shares issued or outstanding
|
— |
— |
||||||
|
Common stock, $0.001 par value; 50,000 shares authorized; 21,302 and 20,804 shares issued and outstanding, respectively
|
21
|
21
|
||||||
|
Additional paid-in capital
|
1,330,751
|
1,327,084
|
||||||
|
Treasury stock, at cost, 329 and 293, respectively
|
(7,645
|
)
|
(7,159
|
)
|
||||
|
Accumulated deficit
|
(1,343,609
|
)
|
(1,323,723
|
)
|
||||
|
Accumulated items of other comprehensive loss
|
(1,300
|
)
|
(1,324
|
)
|
||||
|
Total INAP stockholders’ deficit
|
(21,782
|
)
|
(5,101
|
)
|
||||
|
Non-controlling interest
|
2,816
|
4,069
|
||||||
|
Total stockholders’ deficit
|
$
|
(18,966
|
)
|
$
|
(1,032
|
)
|
||
|
Total liabilities and stockholders’ deficit
|
$
|
746,038
|
$
|
586,525
|
||||
8
INTERNAP CORPORATION AND SUBSIDIARIES
CONDENSED CONSOLIDATED STATEMENTS OF CASH FLOWS
(In thousands)
(Unaudited)
|
Nine Months Ended
September 30,
|
||||||||
|
2018
|
2017
|
|||||||
|
Cash Flows from Operating Activities:
|
||||||||
|
Net loss
|
$
|
(43,014
|
)
|
$
|
(38,377
|
)
|
||
|
Adjustments to reconcile net loss to net cash provided by operating activities:
|
||||||||
|
Depreciation and amortization
|
67,097
|
57,596
|
||||||
|
(Gain) loss on disposal of fixed asset
|
(98
|
)
|
503
|
|||||
|
Amortization of debt discount and issuance costs
|
2,798
|
1,890
|
||||||
|
Stock-based compensation expense, net of capitalized amount
|
3,573
|
2,061
|
||||||
|
Equity in earnings of equity-method investment
|
—
|
(1,207
|
)
|
|||||
|
Provision for doubtful accounts
|
706
|
808
|
||||||
|
Non-cash change in capital lease obligations
|
(241
|
)
|
564
|
|||||
|
Non-cash change in exit activities and restructuring liability
|
3,198
|
5,824
|
||||||
|
Non-cash change in deferred rent
|
(851
|
)
|
(3,335
|
)
|
||||
|
Deferred taxes
|
65
|
209
|
||||||
|
Loss on extinguishment and modification of debt
|
—
|
6,785
|
||||||
|
Other, net
|
(6
|
)
|
(49
|
)
|
||||
|
Changes in operating assets and liabilities:
|
||||||||
|
Accounts receivable
|
(4,990
|
)
|
243
|
|||||
|
Prepaid expenses, deposits and other assets
|
(3,531
|
)
|
1,979
|
|||||
|
Accounts payable
|
9,372
|
(3,498
|
)
|
|||||
|
Accrued and other liabilities
|
(601
|
)
|
1,691
|
|||||
|
Deferred revenues
|
617
|
(1,233
|
)
|
|||||
|
Exit activities and restructuring liability
|
(4,597
|
)
|
(4,727
|
)
|
||||
|
Asset retirement obligation
|
(141
|
)
|
191
|
|||||
|
Other liabilities
|
(199
|
)
|
22
|
|||||
|
Net cash provided by operating activities
|
29,157
|
27,940
|
||||||
|
Cash Flows from Investing Activities:
|
||||||||
|
Purchases of property and equipment
|
(27,317
|
)
|
(23,198
|
)
|
||||
|
Proceeds from disposal of property and equipment
|
570
|
206
|
||||||
|
Business acquisition, net of cash acquired
|
(131,748
|
)
|
3,838
|
|||||
|
Acquisition of non-controlling interests
|
(1,130
|
)
|
—
|
|||||
|
Additions to acquired and developed technology
|
(2,128
|
)
|
(635
|
)
|
||||
|
Net cash used in investing activities
|
$
|
(161,753
|
)
|
$
|
(19,789
|
)
|
||
|
Cash Flows from Financing Activities:
|
||||||||
|
Proceeds from credit agreements
|
148,500
|
295,500
|
||||||
|
Proceeds from stock issuance
|
—
|
40,165
|
||||||
|
Principal payments on credit agreements
|
(3,267
|
)
|
(327,250
|
)
|
||||
|
Debt issuance costs
|
(7,696
|
)
|
(8,277
|
)
|
||||
|
Payments on capital lease obligations
|
(7,202
|
)
|
(6,562
|
)
|
||||
|
Proceeds from exercise of stock options
|
(210
|
)
|
159
|
|||||
|
Acquisition of common stock for income tax withholdings
|
(487
|
)
|
(222
|
)
|
||||
|
Other, net
|
175
|
(302
|
)
|
|||||
|
Net cash provided by (used in) financing activities
|
129,813
|
(6,789
|
)
|
|||||
|
Effect of exchange rates on cash and cash equivalents
|
24
|
217
|
||||||
|
Net (decrease) increase in cash and cash equivalents
|
(2,759
|
)
|
1,579
|
|||||
|
Cash and cash equivalents at beginning of period
|
14,603
|
10,389
|
||||||
|
Cash and cash equivalents at end of period
|
$
|
11,844
|
$
|
11,968
|
||||
|
Supplemental Disclosures of Cash Flow Information:
|
||||||||
|
Cash paid for interest
|
$
|
44,324
|
$
|
25,898
|
||||
|
Non-cash acquisition of property and equipment under capital leases
|
33,381
|
169,679
|
||||||
|
Additions to property and equipment included in accounts payable
|
4,004
|
701
|
||||||
9
INTERNAP CORPORATION
NON-GAAP (ADJUSTED) FINANCIAL MEASURES
In addition to providing financial measurements based on accounting principles generally accepted in the United States of America (“GAAP”), this earnings
press release includes additional financial measures that are not prepared in accordance with GAAP (“non-GAAP”), including Adjusted EBITDA, Adjusted EBITDA margin, Adjusted EBITDA less CapEx, normalized net loss, business unit contribution,
business unit contribution margin, free cash flow and unlevered free cash flow. A reconciliation of non-GAAP financial measures to the most directly comparable GAAP financial measures can be found below.
We define the following non-GAAP measures as follows:
| • |
Adjusted EBITDA is a non-GAAP measure and is GAAP net loss attributable to INAP shareholders plus depreciation and amortization, interest expense, provision (benefit) for
income taxes, other expense (income), (gain) loss on disposal of property and equipment, exit activities, restructuring and impairments, stock-based compensation, non-income tax contingency, strategic alternatives and related costs,
organizational realignment costs, pre-acquisition costs and claim settlement.
|
| • |
Adjusted EBITDA margin is Adjusted EBITDA as a percentage of revenues.
|
| • |
Adjusted EBITDA less CapEx is Adjusted EBITDA less capital expenditures with Adjusted EBITDA for this non-GAAP measure defined as net cash flow provided by operating
activities plus cash paid for interest, cash paid for taxes, cash paid for exit activities and restructuring, cash paid for strategic alternatives and related costs, cash paid for organizational realignment costs, payment of debt lender
fees and other working capital changes less capital expenditures.
|
| • |
Normalized net loss is net loss attributable to INAP shareholders plus exit activities, restructuring and impairments, stock-based compensation, non-income tax contingency,
strategic alternatives and related costs, organizational realignment costs, pre-acquisition costs, claim settlement and debt extinguishment and modification expenses.
|
| • |
Business unit contribution is business unit revenues less direct costs of sales and services, customer support, and sales and marketing, exclusive of depreciation and
amortization.
|
| • |
Business unit contribution margin is business unit contribution as a percentage of business unit revenue.
|
| • |
Free cash flow is net cash flows provided by operating activities minus capital expenditures.
|
| • |
Unlevered free cash flow is free cash flow plus cash interest expense.
|
We believe that presentation of these non-GAAP financial measures provides useful information to investors regarding our results of operations.
We believe that excluding depreciation and amortization and loss (gain) on disposals of property and equipment, as well as impairments and restructuring,
to calculate Adjusted EBITDA provides supplemental information and an alternative presentation that is useful to investors’ understanding of our current ongoing operating results and trends. Not only are depreciation and amortization expenses based
on historical costs of assets that may have little bearing on present or future replacement costs, but also they are based on management estimates of remaining useful lives. Loss on disposals of property and equipment is also based on historical
costs of assets that may have little bearing on replacement costs. Impairments and restructuring expenses primarily reflect goodwill impairments and subsequent plan adjustments in sublease income assumptions for certain properties included in our
previously disclosed restructuring plans.
We believe that excluding interest expense, provision (benefit) for income taxes and other expense (income) from non-GAAP financial measures provides
supplemental information and an alternative presentation useful to investors’ understanding of our core operating results and trends. Investors have indicated that they consider financial measures of our results of operations excluding interest
expense, provision (benefit) for income taxes and other expense (income) as important supplemental information useful to their understanding of our historical results and estimating our future results.
10
INTERNAP CORPORATION
NON-GAAP (ADJUSTED) FINANCIAL MEASURES (Continued)
We also believe that, in excluding the effects of interest expense, provision (benefit) for income taxes and other expense (income), our non-GAAP financial
measures provide investors with transparency into what management uses to measure and forecast our results of operations, to compare on a consistent basis our results of operations for the current period to that of prior periods and to compare our
results of operations on a more consistent basis against that of other companies, in making financial and operating decisions and to establish certain management compensation.
We believe that exit activities, restructuring and impairment charges, non-income tax contingency, strategic alternatives and related costs, organizational
realignment costs, pre-acquisition costs, claim settlement costs, and debt extinguishment and modification expense are unique costs, and consequently, we do not consider these charges as a normal component of expenses related to current and ongoing
operations.
Similarly, we believe that excluding the effects of stock-based compensation from non-GAAP financial measures provides supplemental information and an
alternative presentation useful to investors’ understanding of our current ongoing operating results and trends. Management believes that investors consider financial measures of our results of operations excluding stock-based compensation as
important supplemental information useful to their understanding of our historical results and estimating our future results.
We also believe that, in excluding the effects of stock-based compensation, our non-GAAP financial measures provide investors with transparency into what
management uses to measure and forecast our results of operations, to compare on a consistent basis our results of operations for the current period to that of prior periods and to compare our results of operations on a more consistent basis
against that of other companies, in making financial and operating decisions and to establish certain management compensation.
Stock-based compensation is an important part of total compensation, especially from the perspective of employees. We believe, however, that supplementing
GAAP net loss by providing normalized net loss, excluding the effect of exit activities, restructuring and impairments, stock-based compensation, non-income tax contingency, strategic alternatives and related costs, organizational realignment cost,
pre-acquisition costs, claim settlement costs, and debt extinguishment and modification expenses in all periods, is useful to investors because it enables additional and more meaningful period-to-period comparisons.
11
INTERNAP CORPORATION
NON-GAAP (ADJUSTED) FINANCIAL MEASURES (Continued)
Adjusted EBITDA is not a measure of financial performance calculated in accordance with GAAP, and should be viewed as a supplement to - not a substitute
for - our results of operations presented on the basis of GAAP. Adjusted EBITDA does not purport to represent cash flow provided by operating activities as defined by GAAP. Our statements of cash flows present our cash flow activity in accordance
with GAAP. Furthermore, Adjusted EBITDA is not necessarily comparable to similarly-titled measures reported by other companies.
We believe Adjusted EBITDA is used by and is useful to investors and other users of our financial statements in evaluating our operating performance
because it provides them with an additional tool to compare business performance across companies and across periods. We believe that:
| • |
EBITDA is widely used by investors to measure a company’s operating performance without regard to items such as interest expense, income taxes, depreciation and
amortization, which can vary substantially from company-to-company depending upon accounting methods and book value of assets, capital structure and the method by which assets were acquired; and
|
| • |
investors commonly adjust EBITDA information to eliminate the effect of disposals of property and equipment, impairments, restructuring and stock-based compensation which
vary widely from company-to-company and impair comparability.
|
Our management uses Adjusted EBITDA:
| • |
as a measure of operating performance to assist in comparing performance from period-to-period on a consistent basis;
|
| • |
as a measure for planning and forecasting overall expectations and for evaluating actual results against such expectations; and
|
| • |
in communications with the board of directors, analysts and investors concerning our financial performance.
|
Our presentation of business unit contribution and business unit contribution margin excludes depreciation and amortization in order to allow investors to
see the business through the eyes of management.
We also have excluded depreciation and amortization from business unit contribution and business unit contribution margin because, as noted above, they are
based on estimated useful lives of tangible and intangible assets. Further, depreciation and amortization are based on historical costs incurred to build out our deployed network and the historical costs of these assets may not be indicative of
current or future capital expenditures.
Free cash flow and unlevered free cash flow are used in addition to and in conjunction with results presented in accordance with GAAP. Free cash flow and
unlevered free cash flow should not be relied upon to the exclusion of GAAP financial measures. Free cash flow and unlevered free cash flow reflect an additional way of viewing our liquidity that, when viewed with our GAAP results, provides a more
complete understanding of factors and trends affecting our cash flows. Management strongly encourages investors to review our financial statements and publicly-filed reports in their entirety and to not rely on any single financial measure.
We use free cash flow and unlevered free cash flow, and ratios based on it, to conduct and evaluate our business because, although it is similar to cash
flow from operations, we believe it is a useful measure of cash flows since capital expenditures are a necessary component of ongoing operations. In limited circumstances in which proceeds from sales of fixed assets exceed capital expenditures,
free cash flow would exceed cash flow from operations. However, since we do not anticipate being a net seller of fixed assets, we expect free cash flow to be less than operating cash flows.
Free cash flow and unlevered free cash flow have limitations due to the fact that they do not represent the residual cash flow available for discretionary
expenditures. For example, free cash flow does not incorporate payments made to service our debt or capital lease obligations. Therefore, we believe it is important to view free cash flow as a complement to our entire consolidated statements of
cash flows.
12
INTERNAP CORPORATION
NON-GAAP (ADJUSTED) FINANCIAL MEASURES (Continued)
Adjusted EBITDA less CapEx is used in addition to and in conjunction with results presented in accordance with GAAP. Adjusted EBITDA less CapEx should not
be relied upon to the exclusion of GAAP financial measures. Adjusted EBITDA less CapEx reflects an additional way of viewing our liquidity that, when viewed with our GAAP results, provides a more complete understanding of factors and trends
affecting our cash flows. Management strongly encourages investors to review our financial statements and publicly-filed reports in their entirety and to not rely on any single financial measure.
We use Adjusted EBITDA less CapEx, and ratios based on it, to conduct and evaluate our business because, although it is similar to cash flow from
operations, we believe it is a useful measure of cash flows since capital expenditures are a necessary component of ongoing operations.
Adjusted EBITDA less CapEx has limitations due to the fact that it does not represent the residual cash flow available for discretionary expenditures.
Adjusted EBITDA less CapEx does not incorporate payments made to service our debt or capital lease obligations. Therefore, we believe it is important to view Adjusted EBITDA less CapEx as a complement to our entire consolidated statements of cash
flows.
Adjusted EBITDA, as presented, may not be comparable to similarly titled measures of other companies. Adjusted EBITDA is presented as we understand
certain investors use it as one measure of our historical ability to service debt. Also Adjusted EBITDA is used in our debt covenants.
Although we believe, for the foregoing reasons, that our presentation of non-GAAP financial measures provides useful supplemental information to investors
regarding our results of operations, our non-GAAP financial measures should only be considered in addition to, and not as a substitute for, or superior to, any measure of financial performance prepared in accordance with GAAP.
13
INTERNAP CORPORATION
NON-GAAP (ADJUSTED) FINANCIAL MEASURES (Continued)
RECONCILIATION OF GAAP NET LOSS TO ADJUSTED EBITDA AND FORWARD LOOKING ADJUSTED EBITDA
A reconciliation of GAAP net loss to Adjusted EBITDA for each of the periods indicated is as follows (in thousands):
|
Three Months Ended
|
||||||||||||||||||||||||
|
September 30, 2018
|
June 30, 2018
|
September 30, 2017
|
||||||||||||||||||||||
|
Reconciliation of GAAP Net Loss Attributable to INAP Shareholders to Adjusted EBITDA:
|
Amount
|
Percent
|
Amount
|
Percent
|
Amount
|
Percent
|
||||||||||||||||||
|
Net revenues
|
$
|
82,972
|
100.0
|
%
|
$
|
81,962
|
100.0
|
%
|
$
|
68,907
|
100.0
|
%
|
||||||||||||
|
Net loss (GAAP) attributable to INAP Shareholders
|
$ |
(15,106
|
) |
(18.2
|
)%
|
$ |
(13,923
|
) |
(17.0
|
)%
|
$ |
(10,895)
|
(15.8
|
)%
|
||||||||||
|
Add:
|
||||||||||||||||||||||||
|
Depreciation and amortization
|
23,431
|
28.2
|
%
|
22,590
|
27.6
|
%
|
20,917
|
30.4
|
%
|
|||||||||||||||
|
Interest expense
|
16,898
|
20.4
|
%
|
15,860
|
19.4
|
%
|
12,299
|
17.8
|
%
|
|||||||||||||||
|
Provision for income taxes
|
162
|
0.2
|
%
|
141
|
0.2
|
%
|
221
|
0.3
|
%
|
|||||||||||||||
|
Other expense (income)
|
195
|
0.2
|
%
|
31
|
0.0
|
%
|
(925
|
)
|
(1.3
|
)%
|
||||||||||||||
|
Gain on disposal of property and equipment, net
|
(66
|
)
|
(0.1
|
)%
|
(75
|
)
|
(0.1
|
)%
|
(162
|
)
|
(0.2
|
)%
|
||||||||||||
|
Exit activities, restructuring and impairments
|
2,347
|
2.8
|
%
|
826
|
1.0
|
%
|
745
|
1.1
|
%
|
|||||||||||||||
|
Stock-based compensation
|
1,341
|
1.6
|
%
|
1,374
|
1.7
|
%
|
929
|
1.3
|
%
|
|||||||||||||||
|
Non-income tax contingency
|
36
|
0.0
|
%
|
800
|
1.0
|
%
|
-
|
-
|
||||||||||||||||
|
Strategic alternatives and related costs
|
25
|
0.0
|
%
|
23
|
0.0
|
%
|
32
|
0.0
|
%
|
|||||||||||||||
|
Organizational realignment costs
|
118
|
0.1
|
%
|
431
|
0.5
|
%
|
14
|
0.0
|
%
|
|||||||||||||||
|
Acquisition costs
|
5
|
0.0
|
%
|
306
|
0.4
|
%
|
102
|
0.1
|
%
|
|||||||||||||||
|
Adjusted EBITDA (non-GAAP)
|
$
|
29,386
|
35.4
|
%
|
$
|
28,384
|
34.6
|
%
|
$
|
23,277
|
33.8
|
%
|
||||||||||||
14
A reconciliation of forward looking Adjusted EBITDA for full-year 2018 is as follows (in millions):
|
Narrowed
|
||||||||||||||||||||||||
|
Guidance within
|
||||||||||||||||||||||||
|
Original Guidance,
|
Revised Guidance,
|
Previous Range,
|
||||||||||||||||||||||
|
as of 3/9/2018
|
as of 8/2/2018
|
as of 11/1/2018
|
||||||||||||||||||||||
|
Low
|
High
|
Low
|
High
|
Low
|
High
|
|||||||||||||||||||
|
Amount
|
Amount
|
Amount
|
Amount
|
Amount
|
Amount
|
|||||||||||||||||||
|
Net revenues
|
$
|
320
|
$
|
330
|
$
|
320
|
$
|
330
|
$
|
320
|
$
|
324
|
||||||||||||
|
Net loss (GAAP) attributable to INAP Shareholders
|
$
|
(48
|
)
|
$
|
(38
|
)
|
$
|
(47
|
)
|
$
|
(37
|
)
|
$
|
(54
|
)
|
$
|
(51
|
)
|
||||||
|
Add:
|
||||||||||||||||||||||||
|
Depreciation and amortization
|
70
|
70
|
86
|
86
|
88
|
88
|
||||||||||||||||||
|
Interest expense
|
59
|
59
|
61
|
61
|
65
|
65
|
||||||||||||||||||
|
Provision for income taxes
|
1
|
1
|
0
|
0
|
0
|
0
|
||||||||||||||||||
|
Exit activities, restructuring and impairments
|
11
|
11
|
2
|
2
|
4
|
4
|
||||||||||||||||||
|
Stock-based compensation
|
11
|
11
|
4
|
4
|
4
|
4
|
||||||||||||||||||
|
Non-income tax contingency and acquisition costs
|
1
|
1
|
4
|
4
|
4
|
4
|
||||||||||||||||||
|
Other costs
|
0
|
0
|
0
|
0
|
0
|
0
|
||||||||||||||||||
|
Adjusted EBITDA (non-GAAP)
|
$
|
105
|
$
|
115
|
$
|
110
|
$
|
120
|
$
|
111
|
$
|
114
|
||||||||||||
15
INTERNAP CORPORATION
NON-GAAP (ADJUSTED) FINANCIAL MEASURES (Continued)
RECONCILIATION OF GAAP NET CASH FLOWS PROVIDED BY OPERATING ACTIVITIES
TO ADJUSTED EBITDA LESS CAPEX
A reconciliation of GAAP Net Cash Flows Provided by Operating Activities to Adjusted EBITDA less CapEx for each of the periods indicated is as follows (in
thousands):
|
Three Months Ended
|
||||||||||||
|
Reconciliation of GAAP Net Cash Flows Provided by Operating Activities to Adjusted
EBITDA less CapEx:
|
September 30,
2018
|
June 30,
2018
|
September 30,
2017
|
|||||||||
|
Net Cash Flows provided by operating activites:
|
$
|
10,288
|
$
|
15,342
|
$
|
3,306
|
||||||
|
Add:
|
||||||||||||
|
Cash paid for interest
|
15,815
|
15,509
|
10,999
|
|||||||||
|
Cash paid for income taxes
|
64
|
126
|
(24
|
)
|
||||||||
|
Cash paid for exit activities and restructuring
|
1,921
|
1,287
|
2,887
|
|||||||||
|
Cash paid for strategic alternatives and related costs
|
25
|
23
|
203
|
|||||||||
|
Cash paid for orgainzational realignment costs
|
118
|
431
|
-
|
|||||||||
|
Cash paid for acquisition costs
|
5
|
306
|
-
|
|||||||||
|
Other working capital changes
|
1,150
|
(4,640
|
)
|
5,906
|
||||||||
|
Adjusted EBITDA (non-GAAP)
|
$
|
29,386
|
$
|
28,384
|
$
|
23,277
|
||||||
|
Less:
|
||||||||||||
|
Capital Expenditures (CapEx)
|
$
|
12,003
|
$
|
11,083
|
$
|
10,965
|
||||||
|
Adjusted EBITDA less CapEx (non-GAAP)
|
$
|
17,383
|
$
|
17,301
|
$
|
12,312
|
||||||
16
INTERNAP CORPORATION
NON-GAAP (ADJUSTED) FINANCIAL MEASURES (Continued)
RECONCILIATION OF NET LOSS ATTRIBUTABLE TO INAP SHAREHOLDERS TO
NORMALIZED NET LOSS TO INAP SHAREHOLDERS
Reconciliations of net loss attributable to INAP Shareholders, the most directly comparable GAAP measure, to normalized net loss attributable to INAP
Shareholders (in thousands):
|
Three Months Ended
|
||||||||||||
|
September 30,
2018
|
June 30,
2018
|
September 30,
2017
|
||||||||||
|
Net loss (GAAP) attributable to INAP Shareholders
|
$
|
(15,106
|
)
|
$
|
(13,923
|
)
|
$
|
(10,895
|
)
|
|||
|
Exit activities, restructuring and impairments
|
2,347
|
826
|
745
|
|||||||||
|
Stock-based compensation
|
1,341
|
1,374
|
929
|
|||||||||
|
Strategic alternatives, realignment, and related costs
|
143
|
454
|
46
|
|||||||||
|
Acquisition costs
|
5
|
306
|
102
|
|||||||||
|
Non-income tax contingency
|
36
|
800
|
-
|
|||||||||
|
INAP Japan fair market valuation
|
-
|
-
|
(1,065
|
)
|
||||||||
|
Normalized net loss (non-GAAP)
|
$
|
(11,234
|
)
|
$
|
(10,163
|
)
|
$
|
(10,138
|
)
|
|||
17
INTERNAP CORPORATION
NON-GAAP (ADJUSTED) FINANCIAL MEASURES (Continued)
BUSINESS UNIT CONTRIBUTION AND BUSINESS UNIT CONTRIBUTION MARGIN
Business unit contribution and business unit contribution margin, which includes direct costs of sales and service, customer support and sales and
marketing for each of the periods indicated is as follows (in thousands):
|
Three Months Ended
|
||||||||||||
|
September 30,
2018
|
June 30,
2018
|
September 30,
2017
|
||||||||||
|
Revenues:
|
||||||||||||
|
INAP US
|
$
|
65,678
|
$
|
64,067
|
$
|
52,970
|
||||||
|
INAP INTL
|
17,294
|
17,895
|
15,937
|
|||||||||
|
Total
|
82,972
|
81,962
|
68,907
|
|||||||||
|
Direct costs of sales and services, customer support and sales and marketing:
|
||||||||||||
|
INAP US
|
35,842
|
34,873
|
29,600
|
|||||||||
|
INAP INTL
|
11,478
|
11,872
|
9,874
|
|||||||||
|
Total
|
47,320
|
46,745
|
39,474
|
|||||||||
|
Business Unit Contribution:
|
||||||||||||
|
INAP US
|
29,836
|
29,194
|
23,370
|
|||||||||
|
INAP INTL
|
5,816
|
6,023
|
6,063
|
|||||||||
|
Total
|
$
|
35,652
|
$
|
35,217
|
$
|
29,433
|
||||||
|
Business Unit Contribution Margin:
|
||||||||||||
|
INAP US
|
45.4
|
%
|
45.6
|
%
|
44.1
|
%
|
||||||
|
INAP INTL
|
33.6
|
%
|
33.7
|
%
|
38.0
|
%
|
||||||
|
Total
|
43.0
|
%
|
43.0
|
%
|
42.7
|
%
|
||||||
18
INTERNAP CORPORATION
NON-GAAP (ADJUSTED) FINANCIAL MEASURES (Continued)
FREE CASH FLOW AND UNLEVERED FREE CASH FLOW
Free cash flow and unlevered free cash flow are non-GAAP measures. Free cash flow is net cash flows provided by operating activities minus capital
expenditures. Unlevered free cash flow is free cash flow plus cash interest expense (in thousands):
|
Three Months Ended
|
||||||||||||
|
September 30,
2018
|
June 30,
2018
|
September 30,
2017
|
||||||||||
|
Net cash flows provided by operating activities
|
$
|
10,288
|
$
|
15,342
|
$
|
3,306
|
||||||
|
Capital expenditures:
|
||||||||||||
|
Maintenance capital
|
(3,597
|
)
|
(4,197
|
)
|
(1,715
|
)
|
||||||
|
Growth capital
|
(8,406
|
)
|
(6,886
|
)
|
(9,250
|
)
|
||||||
|
Free cash flow (non-GAAP)
|
(1,715
|
)
|
4,259
|
(7,659
|
)
|
|||||||
|
Cash paid for interest
|
15,815
|
15,509
|
10,999
|
|||||||||
|
Unlevered free cash flow (non-GAAP)
|
$
|
14,100
|
$
|
19,768
|
$
|
3,340
|
||||||
19
DATA CENTER PORTFOLIO
The following table presents an overview of the portfolio of data center properties that INAP leases as of September 30, 2018:
|
Market
|
Gross Square
Feet (SF)1
|
Supporting
Infrastructure2
|
Office &
Other
|
Data Center
Footprint SF3
|
Current
Raised Floor SF4
|
Occupied
SF
|
Occupied
SF %
|
Power Adjusted
SF% (Estimated)5
|
|
Phoenix6
|
214,968
|
87,059
|
61,210
|
66,717
|
44,650
|
30,861
|
69%
|
71%
|
|
Atlanta
|
208,298
|
64,248
|
75,344
|
68,706
|
44,987
|
30,077
|
67%
|
68%
|
|
Montreal
|
126,965
|
34,572
|
46,833
|
45,560
|
25,050
|
23,890
|
95%
|
89%
|
|
New York/New Jersey
|
114,920
|
16,405
|
28,468
|
70,047
|
47,507
|
26,063
|
55%
|
83%
|
|
Dallas
|
112,085
|
23,763
|
21,023
|
67,299
|
30,432
|
17,427
|
57%
|
66%
|
|
Los Angeles
|
109,181
|
9,623
|
12,366
|
87,192
|
18,020
|
13,418
|
74%
|
100%
|
|
Seattle
|
100,497
|
31,326
|
21,552
|
47,619
|
38,619
|
23,391
|
61%
|
65%
|
|
Santa Clara/San Jose
|
88,659
|
23,852
|
23,667
|
41,140
|
40,840
|
23,455
|
57%
|
87%
|
|
Boston
|
45,637
|
18,785
|
5,199
|
21,653
|
21,653
|
10,407
|
48%
|
55%
|
|
Houston
|
43,913
|
7,925
|
15,599
|
20,389
|
20,389
|
9,296
|
46%
|
54%
|
|
Chicago
|
14,002
|
1,551
|
-
|
12,451
|
12,076
|
10,129
|
84%
|
94%
|
|
Other7
|
26,163
|
-
|
981
|
25,165
|
20,755
|
15,648
|
75%
|
76%
|
|
Total
|
1,205,288
|
319,109
|
312,242
|
573,938
|
364,978
|
234,062
|
64%
|
74%
|
|
(1)
|
Represents total SF subject to our lease.
|
|
(2)
|
Represents total SF for mechanical and utility rooms.
|
|
(3)
|
Represents total SF that is currently leased or available for lease but excludes supporting infrastructure, office space, and common area.
|
|
(4)
|
Represents data center footprint SF less unbuilt SF.
|
|
(5)
|
Calculation of occupied SF based on SF available to sell based on power constraints.
|
|
(6)
|
Includes new Phoenix facility acquired in July 2018.
|
|
(7)
|
Represents Miami, Northern Virginia, Oakland/San Francisco, London, Amsterdam,
Frankfurt, Hong Kong, Singapore, Sydney, Tokyo, and Osaka.
|
20
Exhibit 99.2

© 2018 Internap Corporation (INAP) 3rd Quarter 2018 Earnings Report Peter D. AquinoPresident &
Chief Executive OfficerJames C. KeeleyChief Financial OfficerNovember 1, 2018

* FORWARD-LOOKING STATEMENTS © 2018 Internap Corporation (INAP) Certain statements in this
presentation contain “forward-looking statements” within the meaning of the Private Securities Litigation Reform Act of 1995. Forward-looking statements include statements regarding industry trends, our future financial position and
performance, business strategy, revenues and expenses in future periods, projected levels of growth and other matters that do not relate strictly to historical facts. These statements are often identified by words such as “may,” “will,”
“seeks,” “anticipates,” “believes,” “estimates,” “expects,” “projects,” “forecasts,” “plans,” “intends,” “continue,” “could” or “should,” that an “opportunity” exists, that we are “positioned” for a particular result, statements regarding our
vision or similar expressions or variations. These statements are based on the beliefs and expectations of our management team based on information available at the time such statements are made. Such forward-looking statements are not
guarantees of future performance and are subject to risks and uncertainties that could cause actual results to differ materially from those contemplated by such forward-looking statements. Therefore, actual future results and trends may differ
materially from what is forecast in such forward-looking statements due to a variety of factors, including, without limitation: our ability to drive growth while reducing costs; our ability to maintain current customers and obtain new ones,
whether in a cost-effective manner or at all; the robustness of the IT infrastructure services market; our ability to achieve or sustain profitability; our ability to expand margins and drive higher returns on investment; our ability to sell
into new and existing data center space; the actual performance of our IT infrastructure services and our ability to improve operations; our ability to correctly forecast capital needs, demand and space utilization; our ability to respond
successfully to technological change and the resulting competition; the geographic concentration of our data centers in certain markets and any adverse developments in local economic conditions or the demand for data center space in these
markets; our ability to identify any suitable strategic transactions; our ability to realize anticipated revenue, growth, synergies and cost savings from the acquisition of SingleHop LLC (“SingleHop”); our ability to successfully integrate
SingleHop’s sales, operations, technology, and products generally; the availability of services from Internet network service providers or network service providers providing network access loops and local loops on favorable terms, or at all;
the failure of third party suppliers to deliver their products and services on favorable terms, or at all; failures in our network operations centers, data centers, network access points or computer systems; our ability to provide or improve
Internet infrastructure services to our customers; our ability to protect our intellectual property; our substantial amount of indebtedness, our ability to raise additional capital when needed, on attractive terms, or at all, and our ability to
service existing debt or maintain compliance with financial and other covenants contained in our credit agreement; our compliance with and changes in complex laws and regulations in the U.S. and internationally; our ability to attract and
retain qualified management and other personnel; and volatility in the trading price of our common stock. These risks and other important factors discussed under the caption “Risk Factors” in our most recent Annual Report on Form 10-K filed
with the SEC and our other reports filed with the SEC could cause actual results to differ materially from those expressed or implied by forward-looking statements made by us or on our behalf. Given these risks and uncertainties, investors
should not place undue reliance on forward-looking statements as a prediction of actual results. All forward-looking statements attributable to us or persons acting on our behalf are expressly qualified in their entirety by the foregoing
forward-looking statements. All such statements speak only as of the date made, and we undertake no obligation to update or revise publicly any forward-looking statements, whether as a result of new information, future events or otherwise.

* NON-GAAP MEASURES In addition to results presented in accordance with GAAP, this presentation
includes non-GAAP financial measures. INAP believes these non-GAAP financial measures provide additional information that is useful to investors in helping to understand our underlying performance and trends. Non-GAAP financial measures have
inherent limitations, which are not required to be uniformly applied. Readers should be aware of these limitations and should be cautious with respect to the use of such measures. To compensate for these limitations, we use non-GAAP financial
measures as comparative tools, together with GAAP financial measures, to assist in the evaluation of our operating performance or financial condition. Our method of calculating these non-GAAP financial measures may differ from methods used by
other companies. These non-GAAP financial measures should not be considered in isolation or as a substitute for those financial measures prepared in accordance with GAAP.We have provided in this presentation reconciliations of the non-GAAP
financial measures included in this presentation to the most directly comparable GAAP financial measures. Reconciliations of non-GAAP financial measures are also available in the attachment to our third quarter 2018 earnings press release
available on our website at www.ir.inap.com. © 2018 Internap Corporation (INAP)

* INAP CONTINUES TO IMPROVE ITS DATA CENTER PORTFOLIO FOR THE FUTURE © 2018 Internap Corporation
(INAP) INAP’s Financings Aimed at Accelerating Growth and Gaining Flexibility for Future Transactions New data center assets establishing INAP Flagships in key marketsPhoenix – London – Atlanta Margin expansion continues as non-core asset
exits wind down Record margins posted in the Third Quarter 2018INAP Cloud Services are contributing to new growth prospects globallySingleHop and iWeb are being integrated into the INAP Cloud suiteManagement is allocating capital to accelerate
installs of larger dealsSales momentum continues as the current backlog exceeds $20+ Million
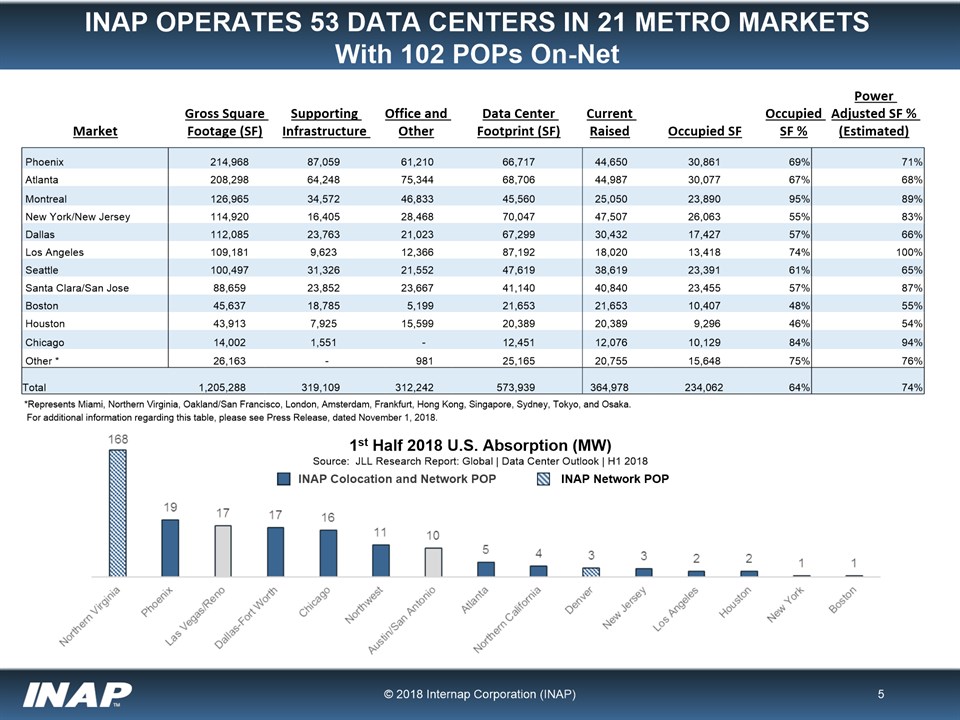
© 2018 Internap Corporation (INAP) * INAP OPERATES 53 DATA CENTERS IN 21 METRO MARKETSWith 102 POPs
On-Net 1st Half 2018 U.S. Absorption (MW)Source: JLL Research Report: Global | Data Center Outlook | H1 2018 INAP Colocation and Network POP *Represents Miami, Northern Virginia, Oakland/San Francisco, London, Amsterdam, Frankfurt, Hong
Kong, Singapore, Sydney, Tokyo, and Osaka. For additional information regarding this table, please see Press Release, dated November 1, 2018. Phoenix 214,968 87,059 61,210 66,717 44,650 30,861 69% 71% Atlanta 208,298
64,248 75,344 68,706 44,987 30,077 67% 68% Montreal 126,965 34,572 46,833 45,560 25,050 23,890 95% 89% New York/New Jersey 114,920 16,405 28,468 70,047 47,507 26,063 55% 83%
Dallas 112,085 23,763 21,023 67,299 30,432 17,427 57% 66% Los Angeles 109,181 9,623 12,366 87,192 18,020 13,418 74% 100% Seattle 100,497 31,326 21,552 47,619 38,619 23,391
61% 65% Santa Clara/San Jose 88,659 23,852 23,667 41,140 40,840 23,455 57% 87% Boston 45,637 18,785 5,199 21,653 21,653 10,407 48% 55% Houston 43,913 7,925 15,599 20,389 20,389
9,296 46% 54% Chicago 14,002 1,551 - 12,451 12,076 10,129 84% 94% Other * 26,163 - 981 25,165 20,755 15,648 75% 76% Total 1,205,288 319,109 312,242 573,939 364,978 234,062
64% 74% Market Gross Square Footage (SF) Supporting Infrastructure Office and Other Data Center Footprint (SF) Current Raised Occupied SF Occupied SF % Power Adjusted SF % (Estimated) INAP Network POP

* CONSOLIDATED EARNINGS SUMMARY *Reconciliation to GAAP on pages 13-19 © 2018 Internap Corporation
(INAP) Revenue and Adjusted EBITDA Margin Increases QoQ and YoY
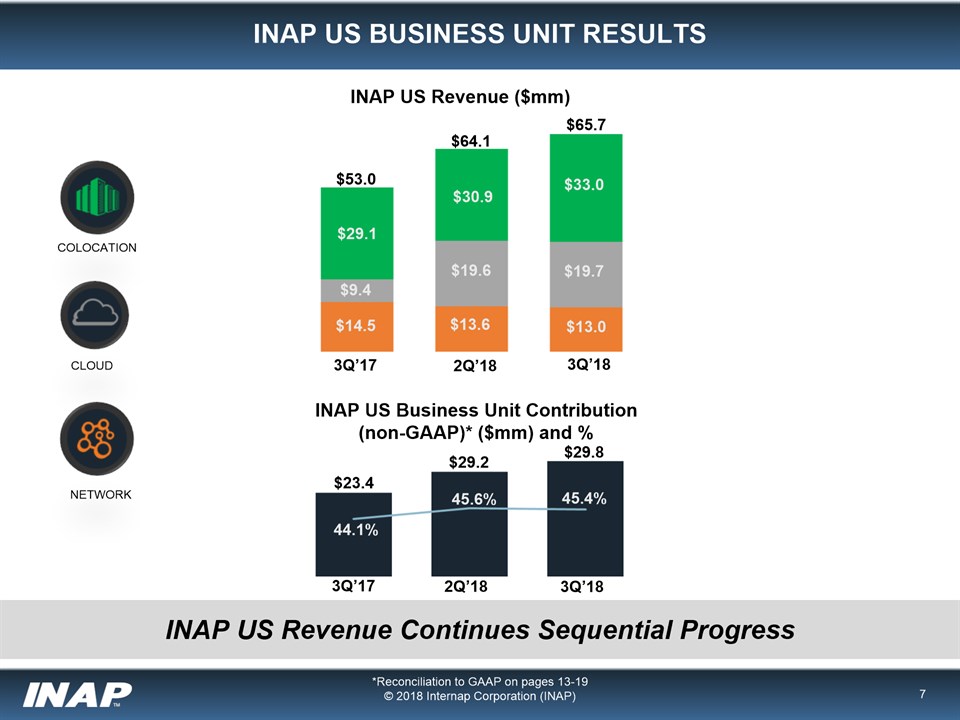
* INAP US BUSINESS UNIT RESULTS *Reconciliation to GAAP on pages 13-19 © 2018 Internap Corporation
(INAP) INAP US Revenue Continues Sequential Progress COLOCATION NETWORK INAP US Business Unit Contribution (non-GAAP)* ($mm) and % CLOUD INAP US Revenue
($mm) $53.0 $64.1 $65.7 $29.1 $30.9 $33.0 $19.7 $19.6 $9.4 $14.5 $13.6 $13.0 $23.4 $29.2 $29.8 44.1% 45.6% 45.4% 3Q’17 3Q’17 2Q’18 2Q’18 3Q’18 3Q’18

* INAP INTERNATIONAL BUSINESS UNIT RESULTS *Reconciliation to GAAP on pages 13-19 © 2018 Internap
Corporation (INAP) Planned Colocation and Cloud Expansions in the UK & Canada COLOCATION NETWORK INAP INTL Business Unit Contribution (non-GAAP)* ($mm) and % CLOUD $6.1 $6.0 $5.8 $1.3 $15 INAP INTL Revenue
($mm) $15.9 $17.9 $17.3 $1.1 $1.5 $1.4 $12.5 $13.6 $13.2 $2.3 $2.8 $2.7 38.0% 33.7% 33.6% 1 3Q’18 3Q’18 3Q’17 2Q’18 3Q’17 2Q’18
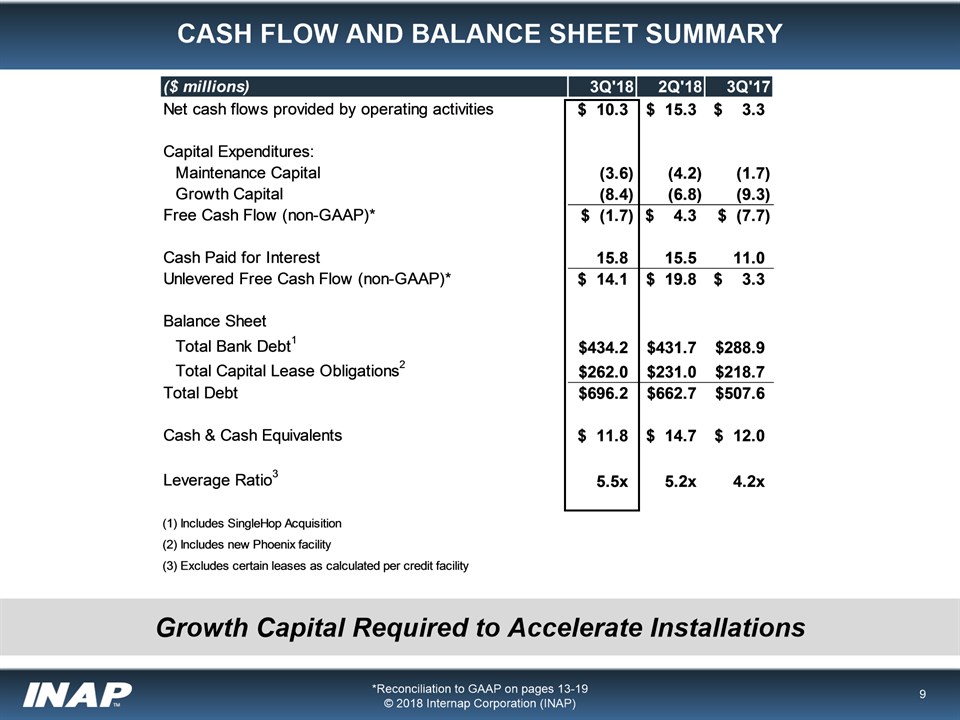
* CASH FLOW AND BALANCE SHEET SUMMARY *Reconciliation to GAAP on pages 13-19© 2018 Internap Corporation
(INAP) Growth Capital Required to Accelerate Installations
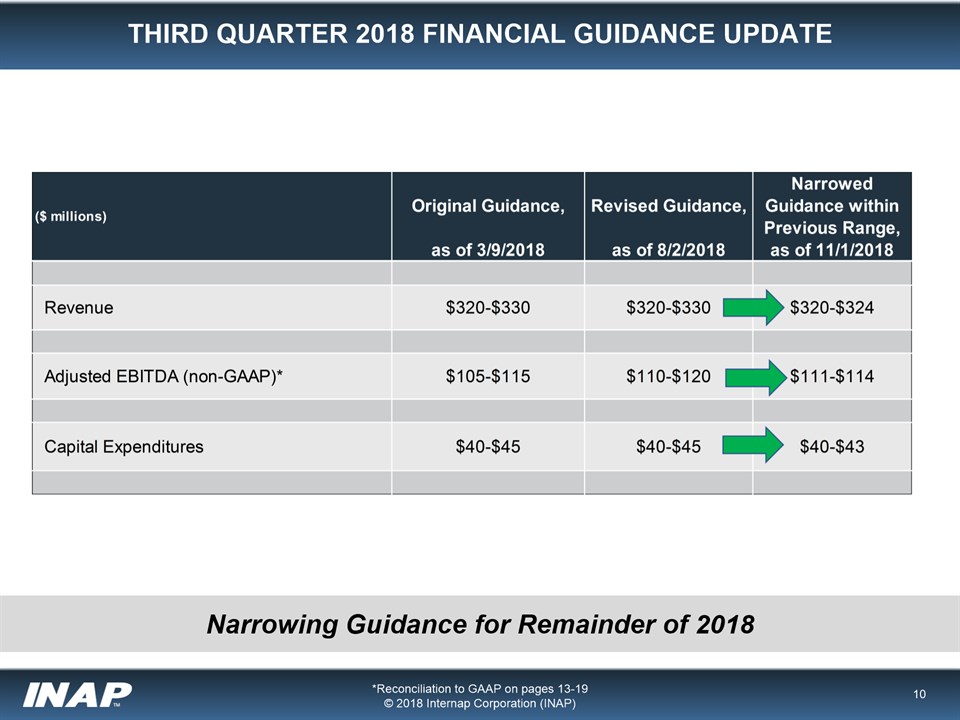
* THIRD QUARTER 2018 FINANCIAL GUIDANCE UPDATE *Reconciliation to GAAP on pages 13-19 © 2018 Internap
Corporation (INAP) Narrowing Guidance for Remainder of 2018

* INAP FINISHING THE YEAR WITH STRONG POSITIONING FOR 2019 © 2018 Internap Corporation (INAP) INAP
Transforming into Sustainable Long-Term Value & Growth Story The combination of major portfolio shifts, sales growth, and operations improvements are creating a more valuable “Sum of the Parts” portfolio Investments in high demand markets
are stimulating continued customer interest and joint planning for future expansions in internet infrastructureSuccess-based capital in all three products – Colocation, Cloud, and Network, allow customers to take advantage of bundle
solutionsBusiness development in both the U.S. and abroad will balance and diversify assets that continue to attract large multinational companies to INAPNext steps will include seeking additional balance sheet flexibility to meet INAP’s
continued organic growth objectives and potential M&A

* © 2018 Internap Corporation (INAP) APPENDIX Reconciliation of Non-GAAP Financial Measures
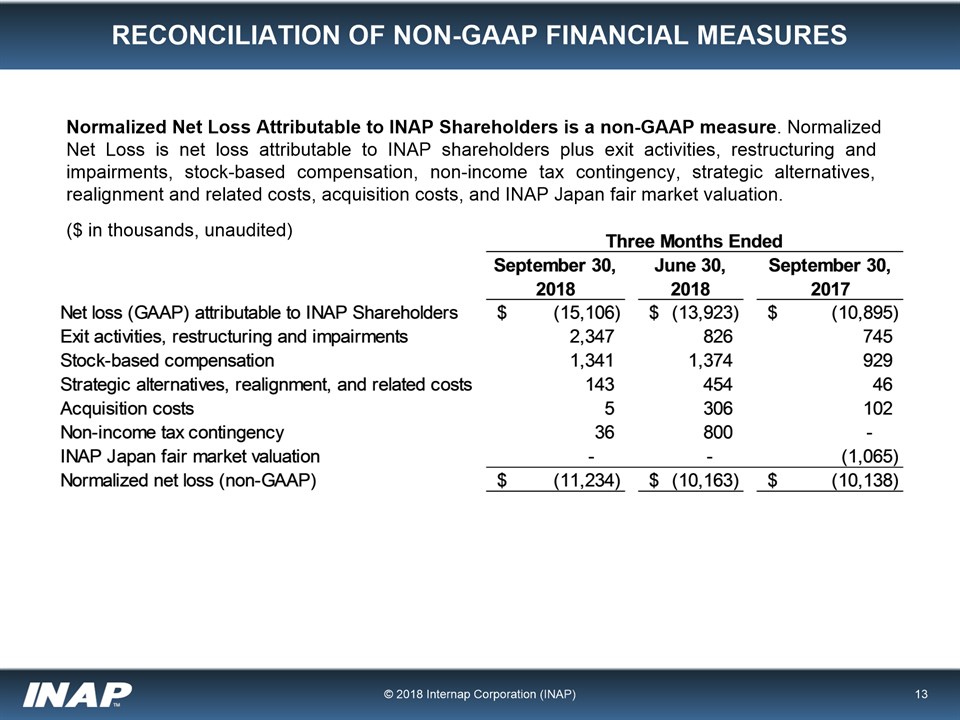
* RECONCILIATION OF NON-GAAP FINANCIAL MEASURES Normalized Net Loss Attributable to INAP Shareholders
is a non-GAAP measure. Normalized Net Loss is net loss attributable to INAP shareholders plus exit activities, restructuring and impairments, stock-based compensation, non-income tax contingency, strategic alternatives, realignment and related
costs, acquisition costs, and INAP Japan fair market valuation.($ in thousands, unaudited) © 2018 Internap Corporation (INAP)

* RECONCILIATION OF NON-GAAP FINANCIAL MEASURES Business Unit Contribution and Business Unit
Contribution Margin are non-GAAP measures. Business Unit Contribution is defined as business unit revenues less direct costs of sales and services, customer support, and sales and marketing, exclusive of depreciation and amortization. Business
Unit Contribution Margin is Business Unit Contribution as a percentage of business unit revenues.($ in thousands, unaudited) © 2018 Internap Corporation (INAP)
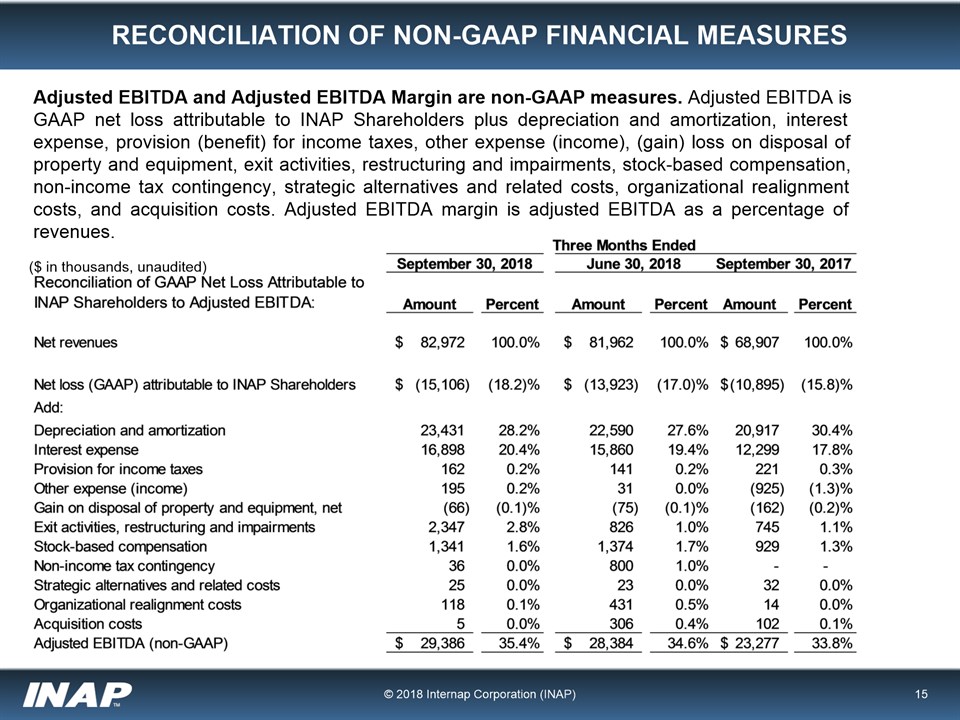
* RECONCILIATION OF NON-GAAP FINANCIAL MEASURES Adjusted EBITDA and Adjusted EBITDA Margin are non-GAAP
measures. Adjusted EBITDA is GAAP net loss attributable to INAP Shareholders plus depreciation and amortization, interest expense, provision (benefit) for income taxes, other expense (income), (gain) loss on disposal of property and equipment,
exit activities, restructuring and impairments, stock-based compensation, non-income tax contingency, strategic alternatives and related costs, organizational realignment costs, and acquisition costs. Adjusted EBITDA margin is adjusted EBITDA
as a percentage of revenues. © 2018 Internap Corporation (INAP) ($ in thousands, unaudited)

* RECONCILIATION OF NON-GAAP FINANCIAL MEASURES Adjusted EBITDA less CapEx is a non-GAAP measure.
Adjusted EBITDA less CapEx is Adjusted EBITDA less capital expenditures with Adjusted EBITDA for this non-GAAP measure defined as net cash flow provided by operating activities plus cash paid for interest, cash paid for taxes, cash paid for
exit activities and restructuring, cash paid for strategic alternatives and related costs, cash paid for organizational realignment costs, cash paid for acquisition costs, and other working capital changes less capital expenditures. © 2018
Internap Corporation (INAP) ($ in thousands, unaudited)
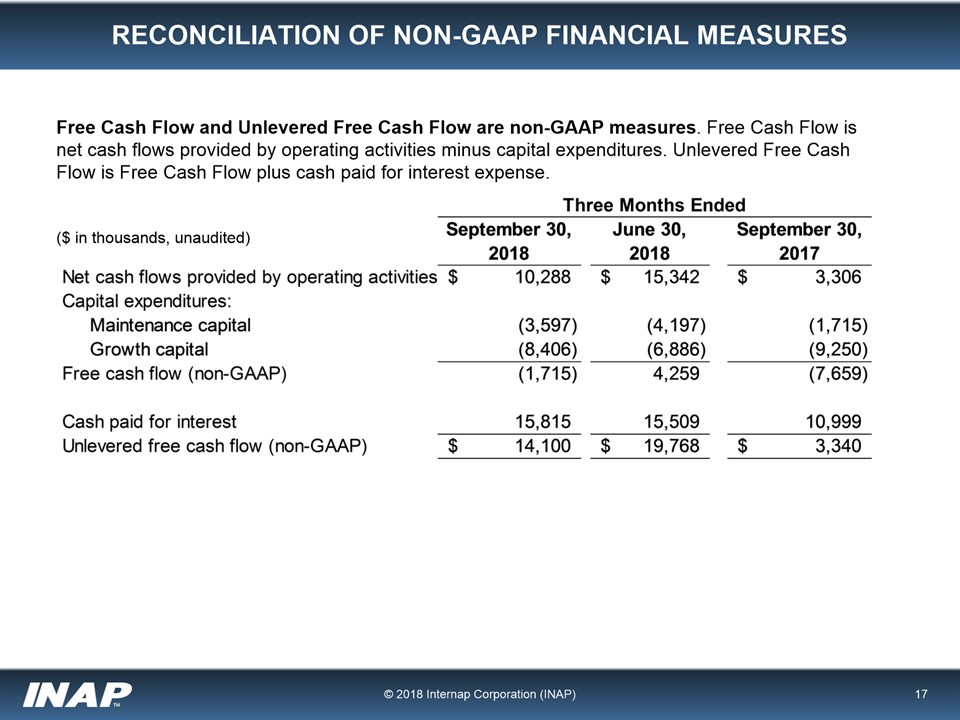
* RECONCILIATION OF NON-GAAP FINANCIAL MEASURES © 2018 Internap Corporation (INAP) Free Cash Flow and
Unlevered Free Cash Flow are non-GAAP measures. Free Cash Flow is net cash flows provided by operating activities minus capital expenditures. Unlevered Free Cash Flow is Free Cash Flow plus cash paid for interest expense. ($ in thousands,
unaudited)
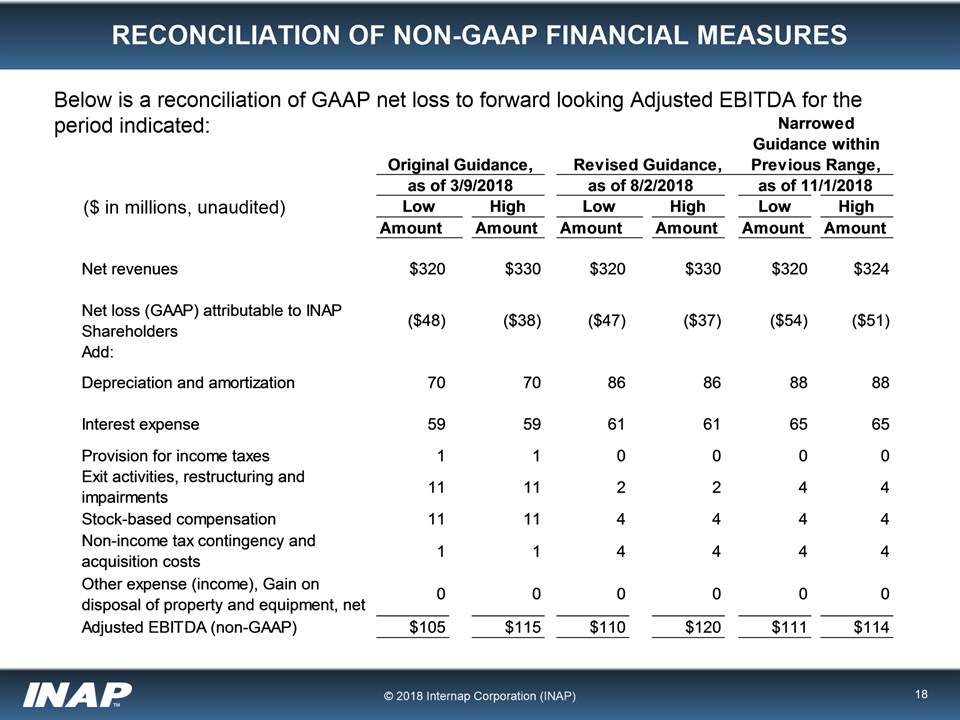
* RECONCILIATION OF NON-GAAP FINANCIAL MEASURES Below is a reconciliation of GAAP net loss to forward
looking Adjusted EBITDA for the period indicated: © 2018 Internap Corporation (INAP) ($ in millions, unaudited)
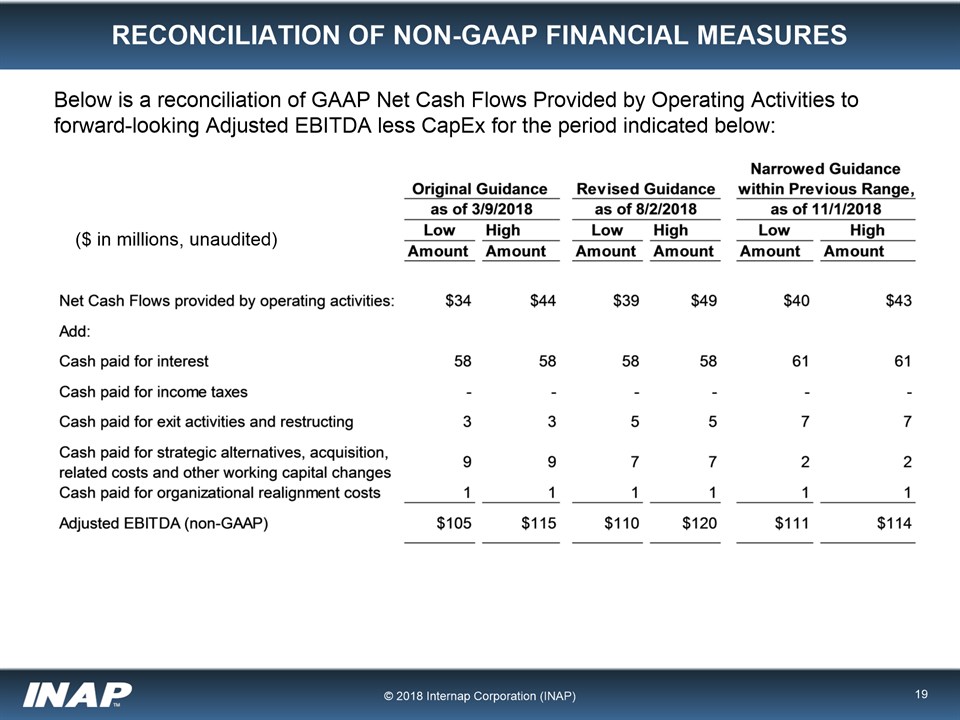
* RECONCILIATION OF NON-GAAP FINANCIAL MEASURES Below is a reconciliation of GAAP Net Cash Flows
Provided by Operating Activities to forward-looking Adjusted EBITDA less CapEx for the period indicated below: © 2018 Internap Corporation (INAP) ($ in millions, unaudited)