
Form 8-K Verso Corp For: Sep 24
UNITED STATES
SECURITIES AND EXCHANGE COMMISSION
Washington, D.C. 20549
FORM 8-K
CURRENT REPORT
Pursuant to Section 13 or 15(d)
of the Securities Exchange Act of 1934
Date of report (Date of earliest event reported): September 24, 2018
VERSO CORPORATION
(Exact name of registrant as specified in its charter)
| Delaware | 001-34056 | 75-3217389 | ||
| (State or other jurisdiction of incorporation) |
(Commission File Number) |
(IRS Employer Identification Number) |
8540 Gander Creek Drive
Miamisburg, Ohio 45342
(Address, including zip code, of principal executive offices)
(877) 855-7243
(Registrants’ telephone number, including area code)
Check the appropriate box below if the Form 8-K filing is intended to simultaneously satisfy the filing obligation of the registrant under any of the following provisions:
| ☐ | Written communications pursuant to Rule 425 under the Securities Act (17 CFR 230.425) |
| ☐ | Soliciting material pursuant to Rule 14a-12 under the Exchange Act (17 CFR 240.14a-12) |
| ☐ | Pre-commencement communications pursuant to Rule 14d-2(b) under the Exchange Act (17 CFR 240.14d-2(b)) |
| ☐ | Pre-commencement communications pursuant to Rule 13e-4(c) under the Exchange Act (17 CFR 240.13e-4(c)) |
Indicate by check mark whether the registrant is an emerging growth company as defined in Rule 405 of the Securities Act of 1933 (§230.405 of this chapter) or Rule 12b-2 of the Securities Exchange Act of 1934 (§240.12b-2 of this chapter).
Emerging growth company ☐
If an emerging growth company, indicate by check mark if the registrant has elected not to use the extended transition period for complying with any new or revised financial accounting standards provided pursuant to Section 13(a) of the Exchange Act. ☐
| Item 7.01 | Regulation FD Disclosure. |
At its 2018 annual meeting of stockholders to be held at 3:00 p.m. Eastern Time on September 24, 2018, Verso Corporation (“Verso”) will deliver an investor update presentation to its stockholders, a copy of which is included as Exhibit 99.1 to this Current Report on Form 8-K. Verso’s presentation contains updated guidance related to its fiscal third quarter.
The presentation is furnished pursuant to Item 7.01 and is not to be considered “filed” under the Securities Exchange Act of 1934, as amended, and shall not be incorporated by reference into any of Verso’s previous or future filings under the Securities Act of 1933, as amended.
| Item 9.01 | Financial Statements and Exhibits. |
| (d) | Exhibits |
| Exhibit |
Description of Exhibit | |
| 99.1 | Investor Update Presentation, dated September 24, 2018 | |
SIGNATURE
Pursuant to the requirements of the Securities Exchange Act of 1934, the registrant has duly caused this report to be signed on its behalf by the undersigned hereunto duly authorized.
Date: September 24, 2018
| VERSO CORPORATION | ||
| By: | /s/ Allen J. Campbell | |
| Allen J. Campbell | ||
| Senior Vice President and Chief Financial Officer | ||
Exhibit 99.1
INVESTOR UPDATE S E P T E M B E R 2 4 , 2 0 1 8
Forward Looking Statements & Non-GAAP Financial Information In this presentation, all statements that are not purely historical facts are forward-looking statements within the meaning of Section 27A of the Securities Act of 1933 and Section 21E of the Securities Exchange Act of 1934. Forward-looking statements in this presentation include, but are not limited to, our guidance for the third quarter of 2018 and trailing twelve months ending September 30, 2018 and our expectations for pricing and input costs. Forward-looking statements may be identified by the words “believe,” “expect,” “anticipate,” “project,” “plan,” “estimate,” “intend,” “potential” and other similar expressions. Forward-looking statements are based on currently available business, economic, financial, and other information and reflect management’s current beliefs, expectations, and views with respect to future developments and their potential effects on Verso. Actual results could vary materially depending on risks and uncertainties that may affect Verso and its business. Verso’s actual actions and results may differ materially from what is expressed or implied by these statements due to a variety of factors, including those risks and uncertainties listed under the caption “Risk Factors” in Verso’s Form 10-K for the fiscal year ended December 31, 2017 and from time to time in Verso’s other filings with the Securities and Exchange Commission. Verso assumes no obligation to update any forward-looking statement made in this presentation to reflect subsequent events or circumstances or actual outcomes. Non-GAAP Financial Information This presentation contains certain non-GAAP financial information relating to Verso, including EBITDA, Adjusted EBITDA, related margins and Excess Cash Flow. Definitions and reconciliations of these non-GAAP measures are included in this presentation. Because EBITDA, Adjusted EBITDA and Excess Cash Flow are not measurements determined in accordance with GAAP and are susceptible to varying calculations, EBITDA, Adjusted EBITDA and Excess Cash Flow, as presented, may not be comparable to similarly titled measures of other companies. You should consider our EBITDA, Adjusted EBITDA and Excess Cash Flow in addition to, and not as a substitute for, or superior to, our operating or net income or cash flows from operating activities, which are determined in accordance with GAAP. See the Appendix in this presentation for additional information on EBITDA and Adjusted EBITDA.
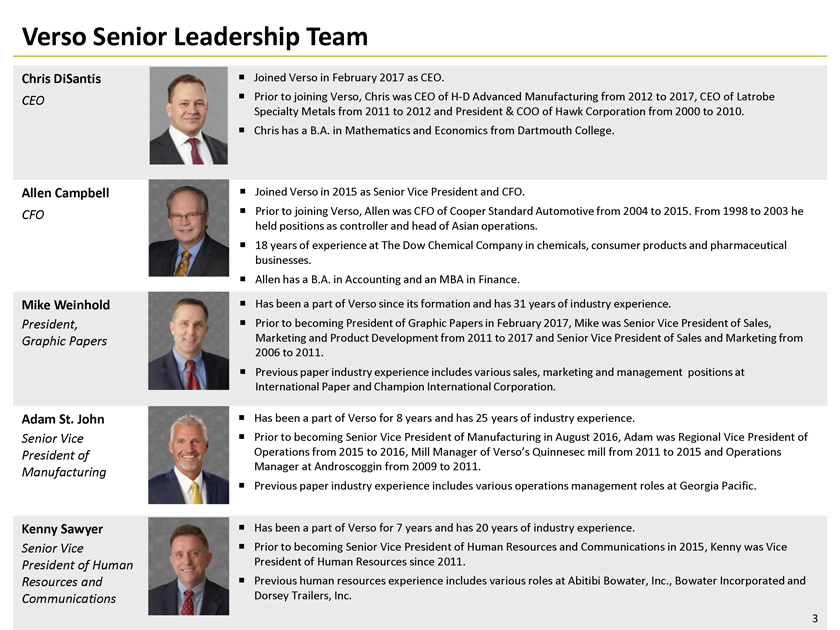
Verso Senior Leadership Team Chris DiSantis, ¡ Joined Verso in February 2017 as CEO. CEO, ¡ Prior to joining Verso, Chris was CEO of H-D Advanced Manufacturing from 2012 to 2017, CEO of Latrobe Specialty Metals from 2011 to 2012 and President & COO of Hawk Corporation from 2000 to 2010. ,¡ Chris has a B.A. in Mathematics and Economics from Dartmouth College. Allen Campbell, ¡ Joined Verso in 2015 as Senior Vice President and CFO. CFO, ¡ Prior to joining Verso, Allen was CFO of Cooper Standard Automotive from 2004 to 2015. From 1998 to 2003 he held positions as controller and head of Asian operations. , ¡ 18 years of experience at The Dow Chemical Company in chemicals, consumer products and pharmaceutical businesses. , ¡ Allen has a B.A. in Accounting and an MBA in Finance. Mike Weinhold , ¡ Has been a part of Verso since its formation and has 31 years of industry experience. President, ,¡ Prior to becoming President of Graphic Papers in February 2017, Mike was Senior Vice President of Sales, Graphic Papers Marketing and Product Development from 2011 to 2017 and Senior Vice President of Sales and Marketing from 2006 to 2011. ,¡ Previous paper industry experience includes various sales, marketing and management positions at International Paper and Champion International Corporation. Adam St. John , ¡ Has been a part of Verso for 8 years and has 25 years of industry experience. Senior Vice , ¡ Prior to becoming Senior Vice President of Manufacturing in August 2016, Adam was Regional Vice President of President of Operations from 2015 to 2016, Mill Manager of Verso’s Quinnesec mill from 2011 to 2015 and Operations Manager at Androscoggin from 2009 to 2011. Manufacturing , ¡ Previous paper industry experience includes various operations management roles at Georgia Pacific. Kenny Sawyer , ¡ Has been a part of Verso for 7 years and has 20 years of industry experience. Senior Vice , ¡ Prior to becoming Senior Vice President of Human Resources and Communications in 2015, Kenny was Vice President of Human President of Human Resources since 2011. Resources and ,¡ Previous human resources experience includes various roles at Abitibi Bowater, Inc., Bowater Incorporated and Communications Dorsey Trailers, Inc. 3
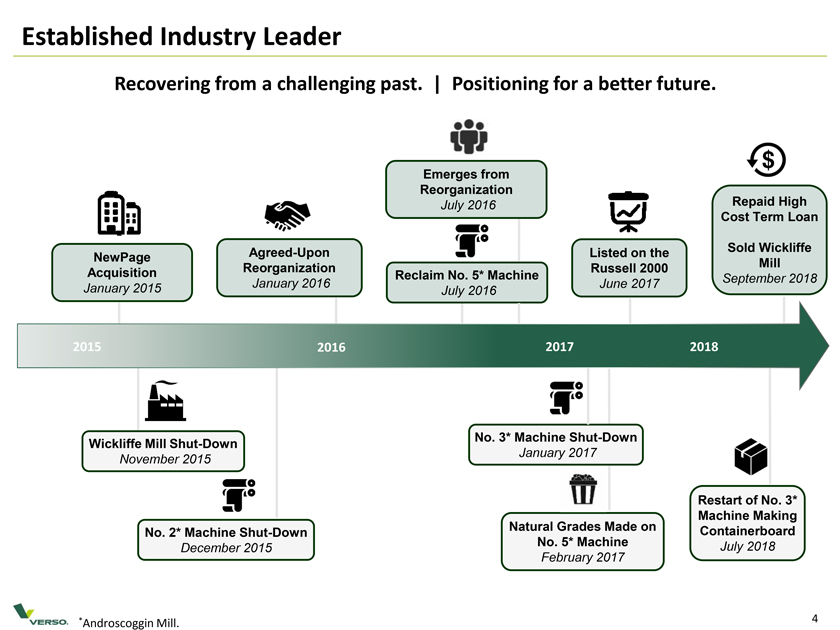
Established Industry Leader Recovering from a challenging past. | Positioning for a better future. Emerges from
Reorganization Repaid High July 2016 Cost Term Loan Agreed-Upon Listed on the Sold Wickliffe NewPage Reorganization Russell 2000 Mill Acquisition Reclaim No. 5*
Machine January 2016 June 2017 September 2018 January 2015 July 2016
2015 2016 2017 2018 No. 3* Machine Shut-Down Wickliffe Mill Shut-Down January 2017 November
2015 Restart of No. 3* Natural Grades Made on Machine Making No. 2* Machine Shut-Down No. 5* Machine Containerboard December 2015 February 2017 July 2018 *Androscoggin Mill. 4
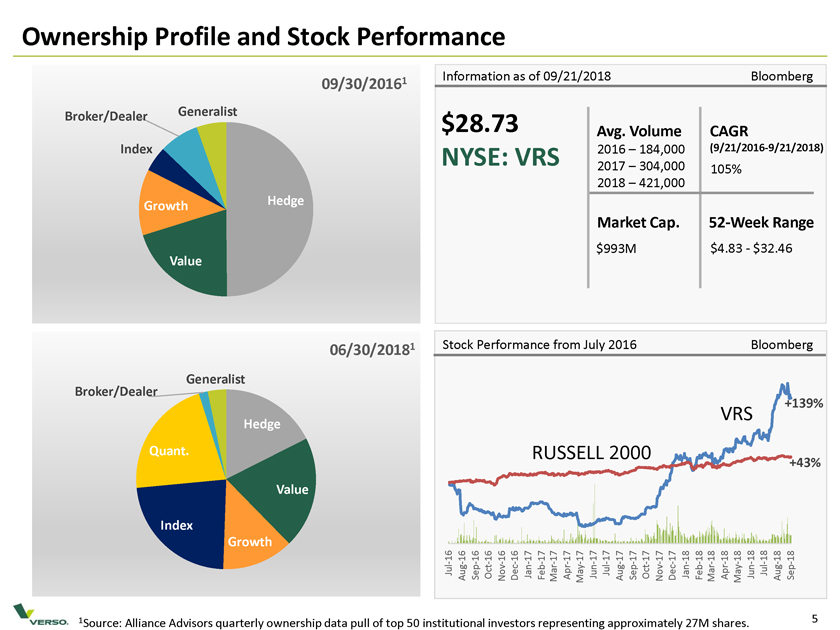
Ownership Profile and Stock Performance 1 Information as of 09/21/2018 Bloomberg 09/30/2016 Broker/Dealer Generalist $28.73 Avg. Volume CAGR Index NYSE: VRS 2016 – 184,000 (9/21/2016-9/21/2018) 2017 – 304,000 105% 2018 – 421,000 Growth Hedge Market Cap. 52-Week Range $993M $4.83—$32.46 Value 06/30/20181 Stock Performance from July 2016 Bloomberg Generalist Broker/Dealer +139% VRS Hedge Quant. RUSSELL 2000 +43% Value Index Growth 16 — 16 16—16—16 — 16—17 17—17 — 17—17—17 17 — 17—17—17 17 — 17—18 18 — 18—18 18—18 — 18 18—18 -Jul Aug Sep Oct Nov Dec Jan Feb Mar Apr May Jun Jul Aug Sep Oct Nov Dec Jan Feb Mar Apr May Jun Jul Aug Sep 1Source: Alliance Advisors quarterly ownership data pull of top 50 institutional investors representing approximately 27M shares. 5
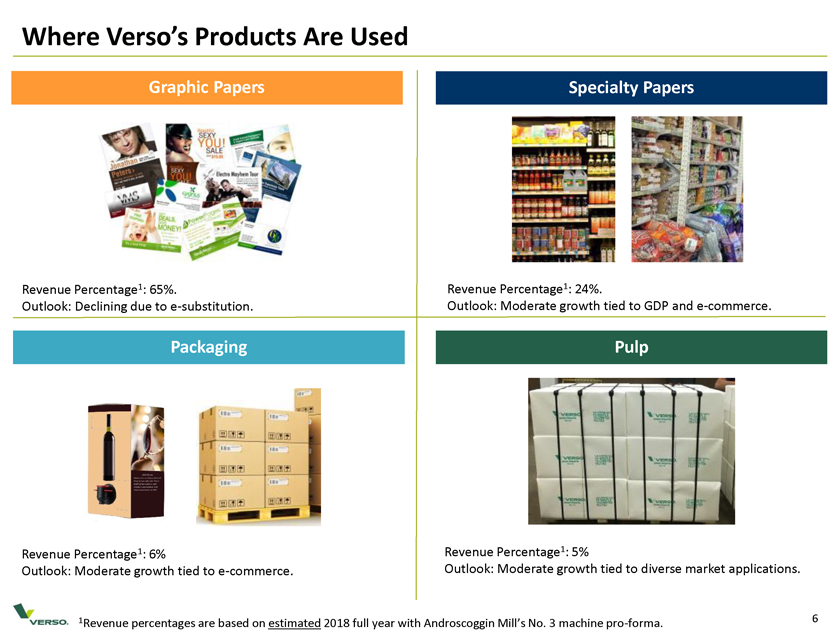
Where Verso’s Products Are Used Graphic Papers Specialty Papers Revenue Percentage 1: 65%. Revenue Percentage 1: 24%. Outlook: Declining due to e-substitution. Outlook: Moderate growth tied to GDP and e-commerce. Packaging Pulp Revenue Percentage 1: 6% Revenue Percentage 1: 5% Outlook: Moderate growth tied to e-commerce. Outlook: Moderate growth tied to diverse market applications. 1 Revenue percentages are based on estimated 2018 full year with Androscoggin Mill’s No. 3 machine pro-forma. 6
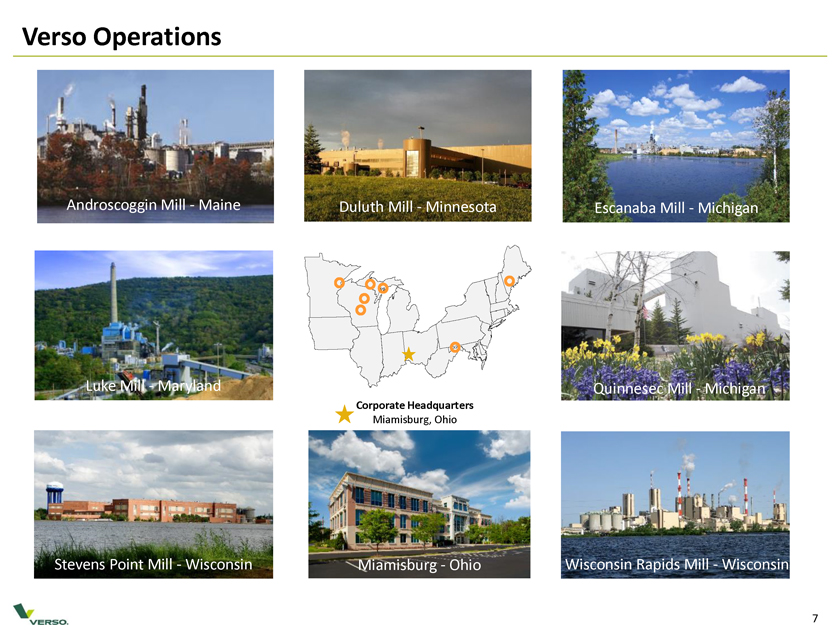
Verso Operations Androscoggin Mill—Maine Duluth Mill—Minnesota Escanaba Mill—Michigan Luke Mill—Maryland Quinnesec Mill—Michigan Corporate Headquarters Miamisburg, Ohio Stevens Point Mill—Wisconsin Miamisburg—Ohio Wisconsin Rapids Mill—Wisconsin 7
Executed Key Improvements • Increased organizational efficiency. Lowest SG&A amongst peer group. • Sustained effort on improving safety performance, 1.37 TIR 1. • Strengthened financial position via: – Higher pricing and volume – Reduced inventory levels – Leveraging supplier partnerships, alliances & multi-sourcing – Favorable outcome negotiated on SC CVD duties settlement – Monetization of inactive assets – Collateral / LC reductions • Investing to improve reliability, flexibility and optionality of assets. 1 TIR reflects Total Incident Rate and represents performance through August 2018 year to date.
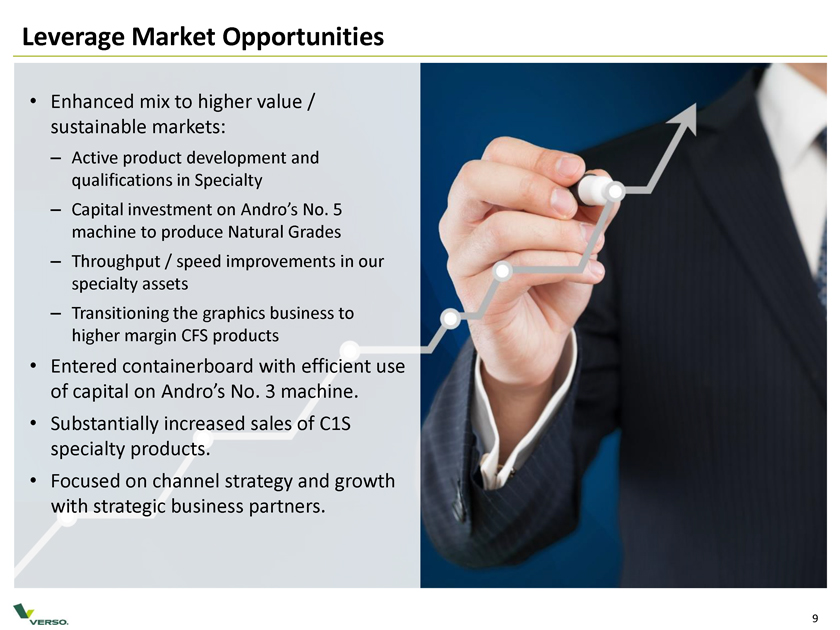
Leverage Market Opportunities • Enhanced mix to higher value / sustainable markets: – Active product development and qualifications in Specialty – Capital investment on Andro’s No. 5 machine to produce Natural Grades – Throughput / speed improvements in our specialty assets – Transitioning the graphics business to higher margin CFS products • Entered containerboard with efficient use of capital on Andro’s No. 3 machine. • Substantially increased sales of C1S specialty products. • Focused on channel strategy and growth with strategic business partners.
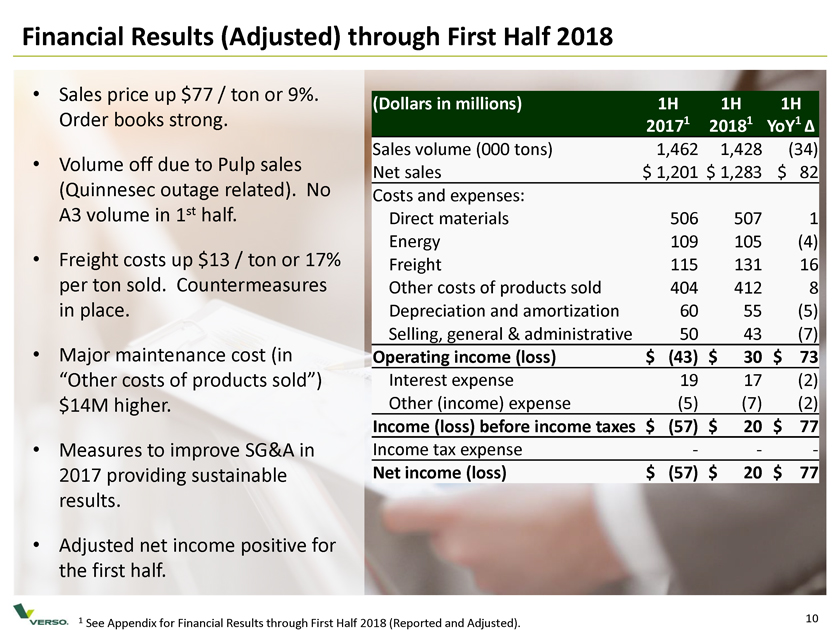
Financial Results (Adjusted) through First Half 2018 • Sales price up $77 / ton or 9%. (Dollars in millions) 1H 1H 1H Order books strong. 20171 20181 YoY1 â^† Volume off due to sales Sales volume (000 tons) 1,462 1,428 (34) • Pulp Net sales $ 1,201 $ 1,283 $ 82 (Quinnesec outage related). No Costs and expenses: A3 volume in 1st half. Direct materials 506 507 1 Energy 109 105 (4) • Freight costs up $13 / ton or 17% Freight 115 131 16 per ton sold. Countermeasures Other costs of products sold 404 412 8 in place. Depreciation and amortization 60 55 (5) Selling, general & administrative 50 43 (7) • Major maintenance cost (in Operating income (loss) $ (43) $ 30 $ 73 “Other costs of products sold”) Interest expense 19 17 (2) $14M higher. Other (income) expense (5) (7) (2) Income (loss) before income taxes $ (57) $ 20 $ 77 • Measures to improve SG&A in Income tax expense ——2017 providing sustainable Net income (loss) $ (57) $ 20 $ 77 results. • Adjusted net income positive for the first half. 1 See Appendix for Financial Results through First Half 2018 (Reported and Adjusted). 10
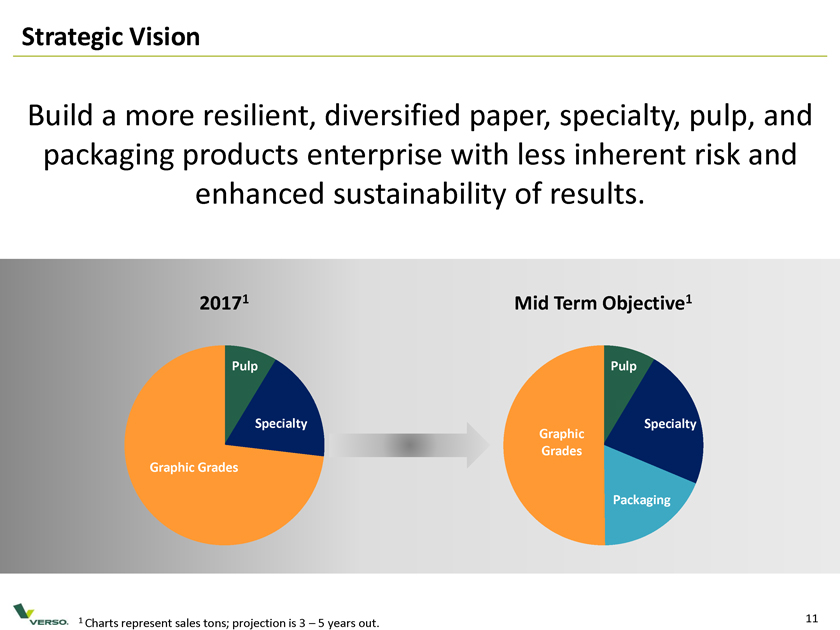
Strategic Vision Build a more resilient, diversified paper, specialty, pulp, and packaging products enterprise with less inherent risk and enhanced sustainability of results. 20171 Mid Term Objective1 Pulp Pulp Specialty Graphic Specialty Grades Graphic Grades Packaging 1 Charts represent sales tons; projection is 3 – 5 years out. 11
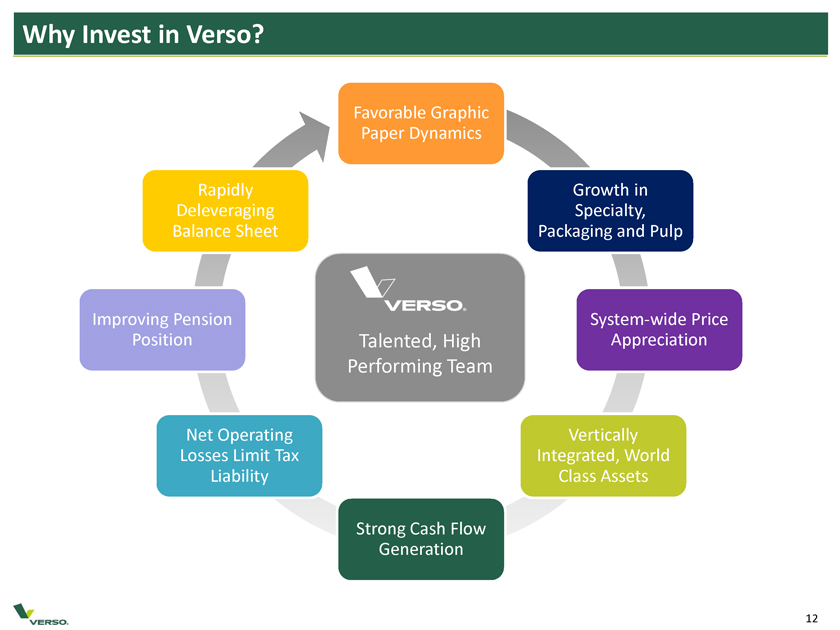
Why Invest in Verso? Favorable Graphic Paper Dynamics Rapidly Growth in Deleveraging Specialty, Balance Sheet Packaging and Pulp Improving Pension System-wide Price Position Talented, High Appreciation Performing Team Net Operating Vertically Losses Limit Tax Integrated, World Liability Class Assets Strong Cash Flow Generation 12
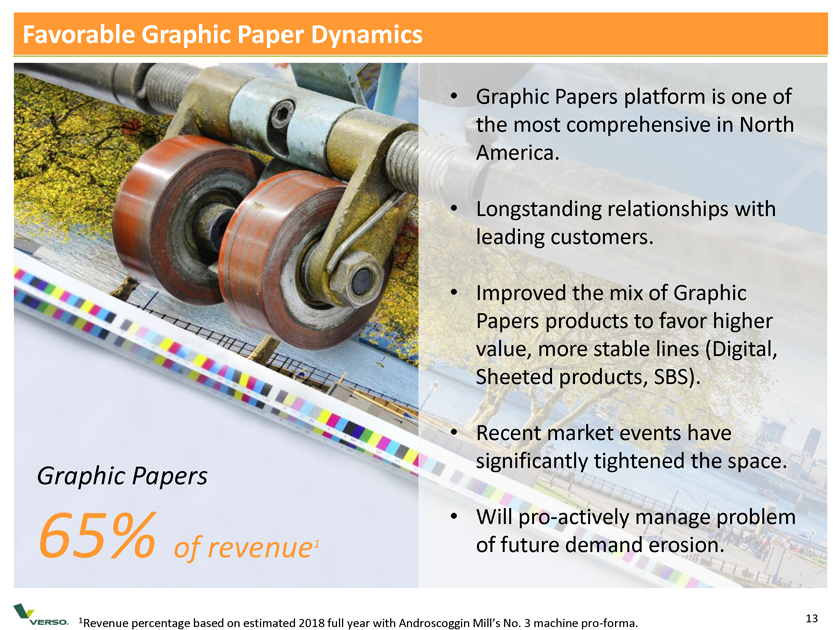
Favorable Graphic Paper Dynamics • Graphic Papers platform is one of the most comprehensive in North America. • Longstanding relationships with leading customers. • Improved the mix of Graphic Papers products to favor higher value, more stable lines (Digital, Sheeted products, SBS). • Recent market events have significantly tightened the space. Graphic Papers • Will pro-actively manage problem 65% of revenue 1 of future demand erosion. 1 Revenue percentage based on estimated 2018 full year with Androscoggin Mill’s No. 3 machine pro-forma. 13
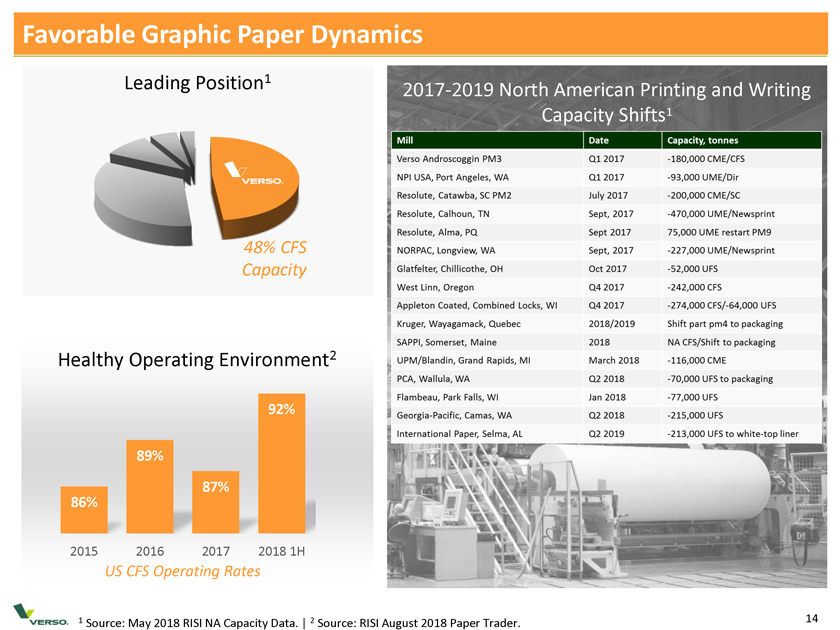
Favorable Graphic Paper Dynamics Leading Position 1 2017-2019 North American Printing and Writing Capacity Shifts 1 48% CFS Capacity Healthy Operating Environment 2 92% 89% 87% 86% 2015 2016 2017 2018 1H US CFS Operating Leading Position 1 2017-2019 North American Printing and Writing Capacity Shifts Q1 2017 Q12017 July 2017 Sept, 2017 Sept 2017 Sept, 2017 Oct 2017 Q4 2017 04 2017 2018/2019 2018 March 2018 02 2018 Jan 2018 02 2018 02 2019 48% CFS Capacity -213,000 UFS to white-top liner Verso Androscoggin PM3 NPI USA, Port Angeles, WA Resolute, Catawba, SC PM2 Resolute, Calhoun, TN Resolute, Alma, PQ NORPAC, Longview, WA Glatfelter, Chillicothe, OH West Linn, Oregon Appleton Coated, Combined Locks, Wl Kruger, , Quebec SAPPI, Somerset, Maine UPM/Blandin, Grand Rapids, Ml PCA, Wallula, WA Flambeau, Park Falls, Wl Georgia-Pacific, Camas, WA International -180,000 CME/CFS -93,000 UME/Dir -200,000 CM E/SC -470,000 UME/Newsprint 75,000 UME restart PM9 -227,000 UME/Newsprint -52,000 UFS -242,000 CFS -274,000 CFS/-64,000 UFS Shift part pm4 to packaging NA CFS/Shift to packaging -116,000 CME -70,000 UFS to packaging -77,000 UFS -215,000 UFS Rates 1 Source: May 2018 RISI NA Capacity Data. | 2 Source: RISI August 2018 Paper Trader. 14
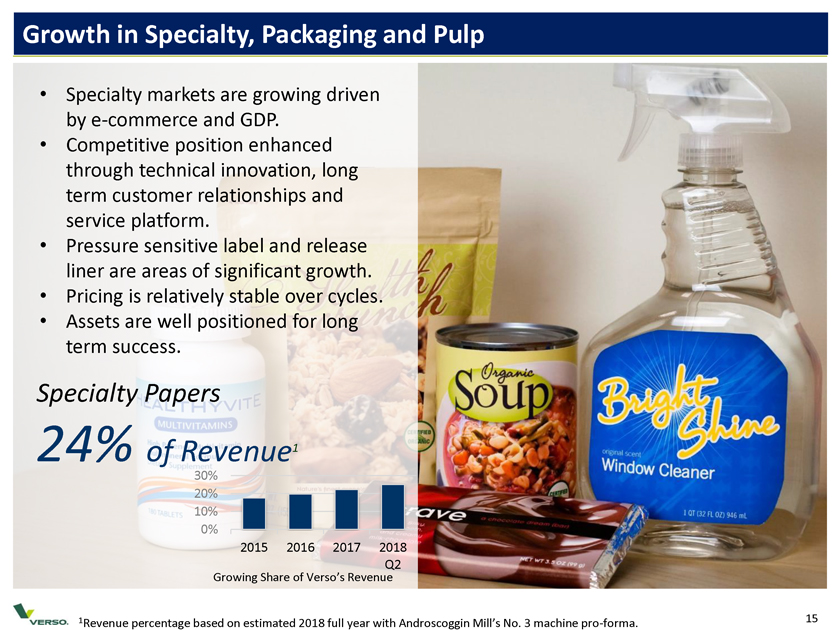
Growth in Specialty, Packaging and Pulp • Specialty markets are growing driven by e-commerce and GDP. • Competitive position enhanced through technical innovation, long term customer relationships and service platform. • Pressure sensitive label and release liner are areas of significant growth. • Pricing is relatively stable over cycles. • Assets are well positioned for long term success. Specialty Papers 24% of Revenue1 30% 20% 10% 0% 2015 2016 2017 2018 Q2 Growing Share of Verso’s Revenue 1 Revenue percentage based on estimated 2018 full year with Androscoggin Mill’s No. 3 machine pro-forma.
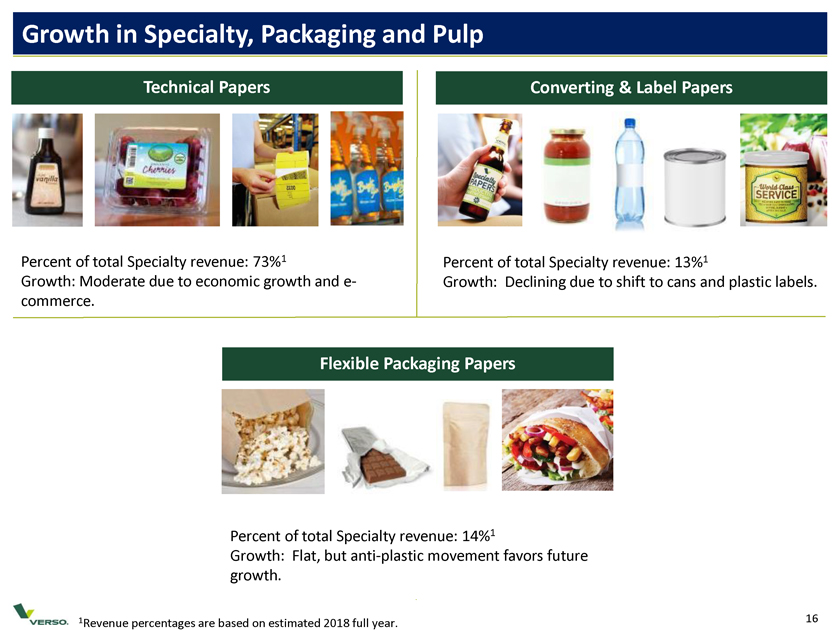
Growth in Specialty, Packaging and Pulp Technical Papers Converting & Label Papers Percent of total Specialty revenue: 73%1 Percent of total Specialty revenue: 13%1 Growth: Moderate due to economic growth and e- Growth: Declining due to shift to cans and plastic labels. commerce. Flexible Packaging Papers Percent of total Specialty revenue: 14%1 Growth: Flat, but anti-plastic movement favors future growth. 1 Revenue percentages are based on estimated 2018 full year. 16
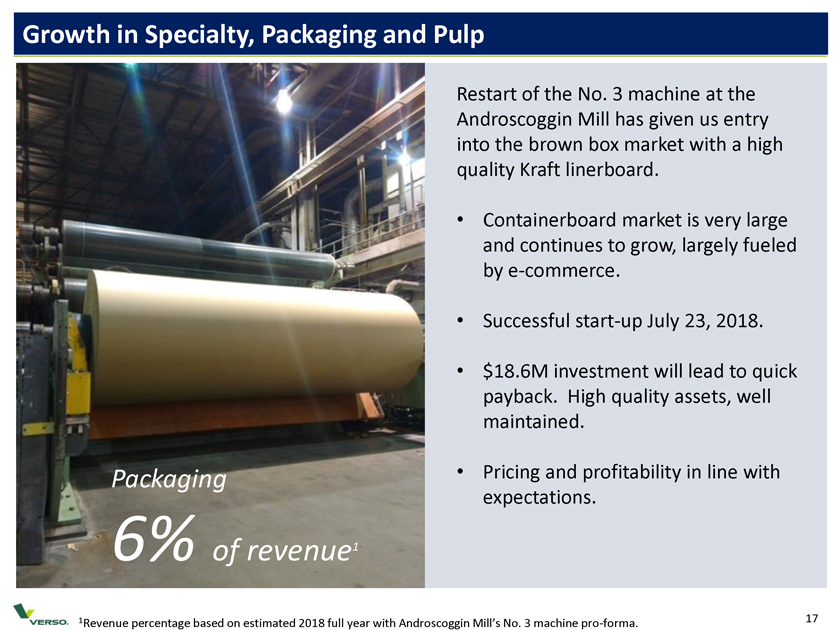
Growth in Specialty, Packaging and Pulp Restart of the No. 3 machine at the Androscoggin Mill has given us entry into the brown box market with a high quality Kraft linerboard. • Containerboard market is very large and continues to grow, largely fueled by e-commerce. • Successful start-up July 23, 2018. • $18.6M investment will lead to quick payback. High quality assets, well maintained. Packaging • Pricing and profitability in line with expectations. 6% of revenue 1 1 Revenue percentage based on estimated 2018 full year with Androscoggin Mill’s No. 3 machine pro-forma. 17
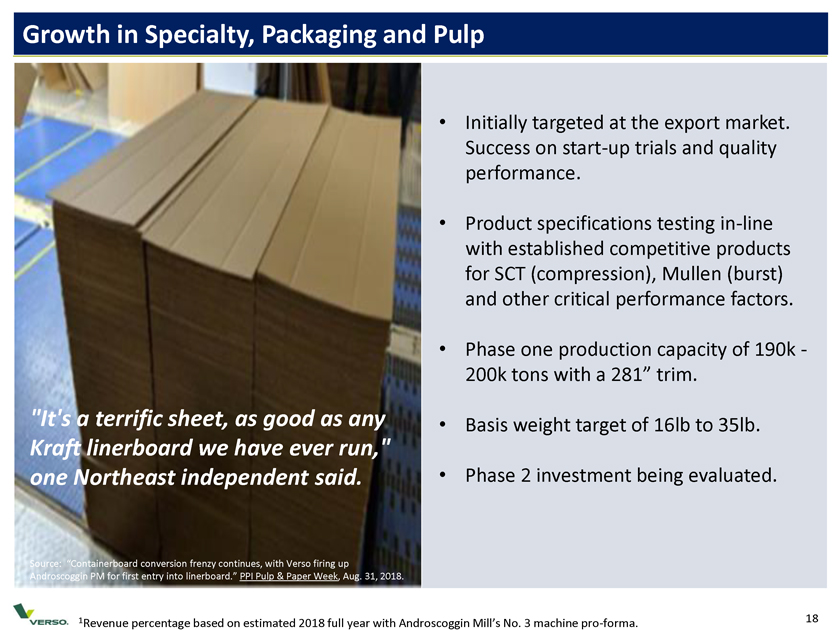
Growth in Specialty, Packaging and Pulp • Initially targeted at the export market. Success on start-up trials and quality performance. • Product specifications testing in-line with established competitive products for SCT (compression), Mullen (burst) and other critical performance factors. • Phase one production capacity of 190k—200k tons with a 281” trim. “It’s a terrific sheet, as good as any • Basis weight target of 16lb to 35lb. Kraft linerboard we have ever run,” one Northeast independent said. • Phase 2 investment being evaluated. Source: “Containerboard conversion frenzy continues, with Verso firing up Androscoggin PM for first entry into linerboard.” PPI Pulp & Paper Week, Aug. 31, 2018. 1 Revenue percentage based on estimated 2018 full year with Androscoggin Mill’s No. 3 machine pro-forma. 18
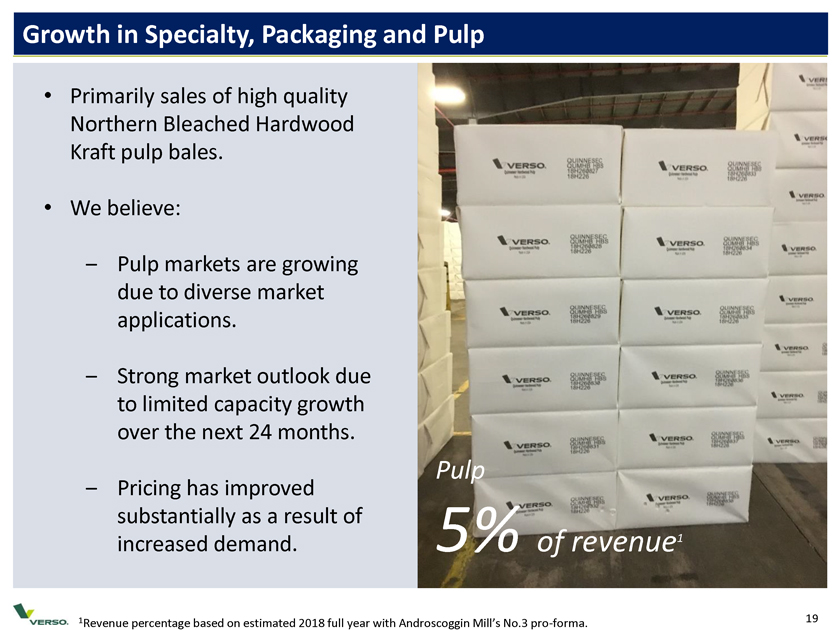
Growth in Specialty, Packaging and Pulp • Primarily sales of high quality Northern Bleached Hardwood Kraft pulp bales. • We believe: ’ Pulp markets are growing due to diverse market applications. ’ Strong market outlook due to limited capacity growth over the next 24 months. Pulp ’ Pricing has improved substantially as a result of increased demand. 5% of revenue1 1 Revenue percentage based on estimated 2018 full year with Androscoggin Mill’s No.3 pro-forma. 19
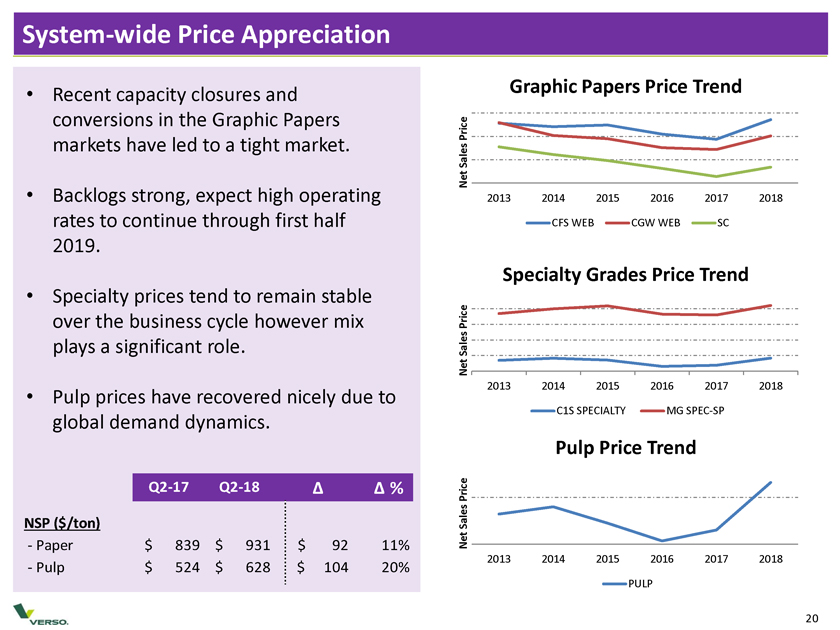
System-wide Price Appreciation Graphic Papers Price Trend • Recent capacity closures and conversions in the Graphic Papers Price markets have led to a tight market. Sales Net • Backlogs strong, expect high operating 2013 2014 2015 2016 2017 2018 rates to continue through first half CFS WEB CGW WEB SC 2019. Specialty Grades Price Trend • Specialty prices tend to remain stable over the business cycle however mix Price plays a significant role. Sales Net 2013 2014 2015 2016 2017 2018 • Pulp prices have recovered nicely due to C1S SPECIALTY MG SPEC-SP global demand dynamics. Pulp Price Trend Q2-17 Q2-18 Ä Ä % Price NSP ($/ton) Sales Net —Paper $ 839 $ 931 $ 92 11% 2013 2014 2015 2016 2017 2018 —Pulp $ 524 $ 628 $ 104 20% PULP 20
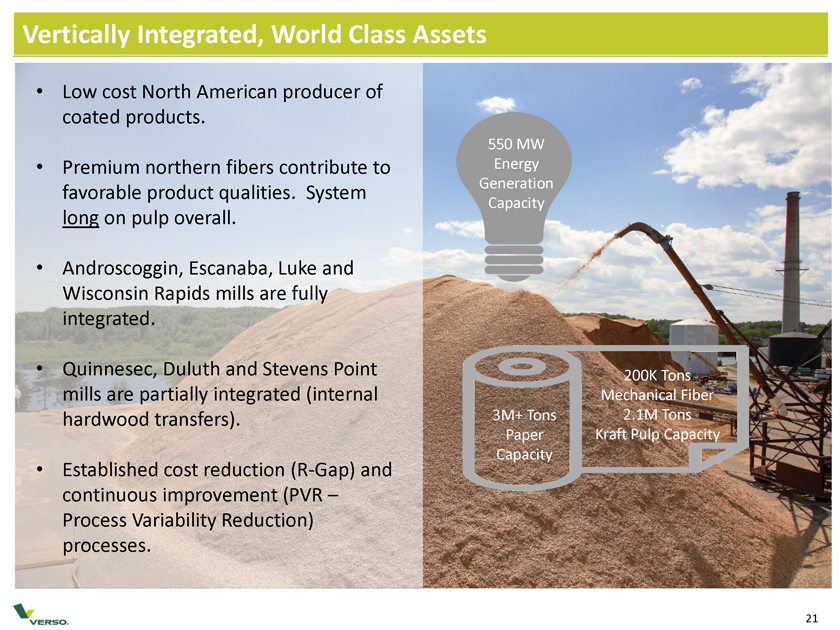
Vertically Integrated, World Class Assets • Low cost North American producer of coated products. 550 MW • Premium northern fibers contribute to Energy Generation favorable product qualities. System long on pulp overall. Capacity • Androscoggin, Escanaba, Luke and Wisconsin Rapids mills are fully integrated. • Quinnesec, Duluth and Stevens Point 200K Tons mills are partially integrated (internal Mechanical Fiber hardwood transfers). 3M+ Tons 2.1M Tons Paper Kraft Pulp Capacity Capacity • Established cost reduction (R-Gap) and continuous improvement (PVR – Process Variability Reduction) processes. 21
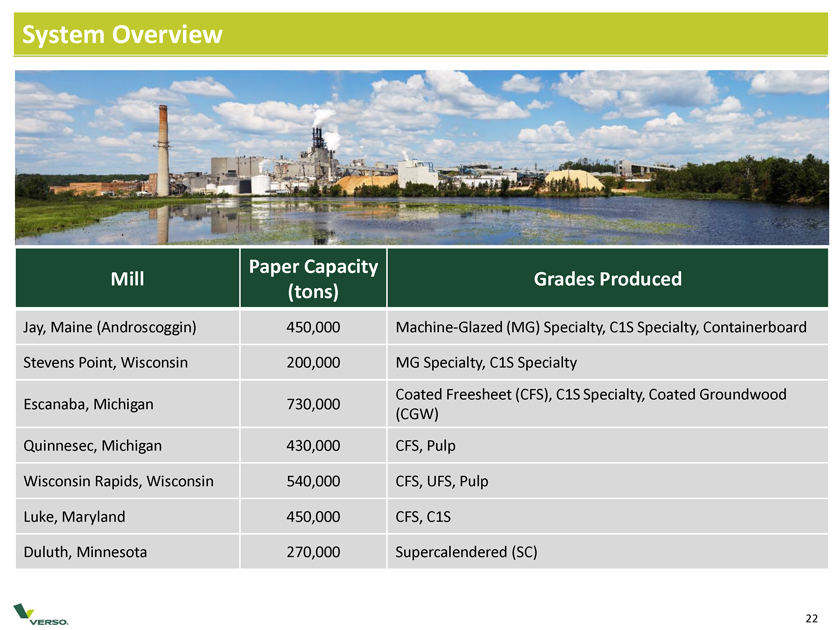
System Overview Paper Capacity Mill Grades Produced (tons) Jay, Maine (Androscoggin) 450,000 Machine-Glazed (MG) Specialty, C1S Specialty, Containerboard Stevens Point, Wisconsin 200,000 MG Specialty, C1S Specialty Coated Freesheet (CFS), C1S Specialty, Coated Groundwood Escanaba, Michigan 730,000 (CGW) Quinnesec, Michigan 430,000 CFS, Pulp Wisconsin Rapids, Wisconsin 540,000 CFS, UFS, Pulp Luke, Maryland 450,000 CFS, C1S Duluth, Minnesota 270,000 Supercalendered (SC) 22
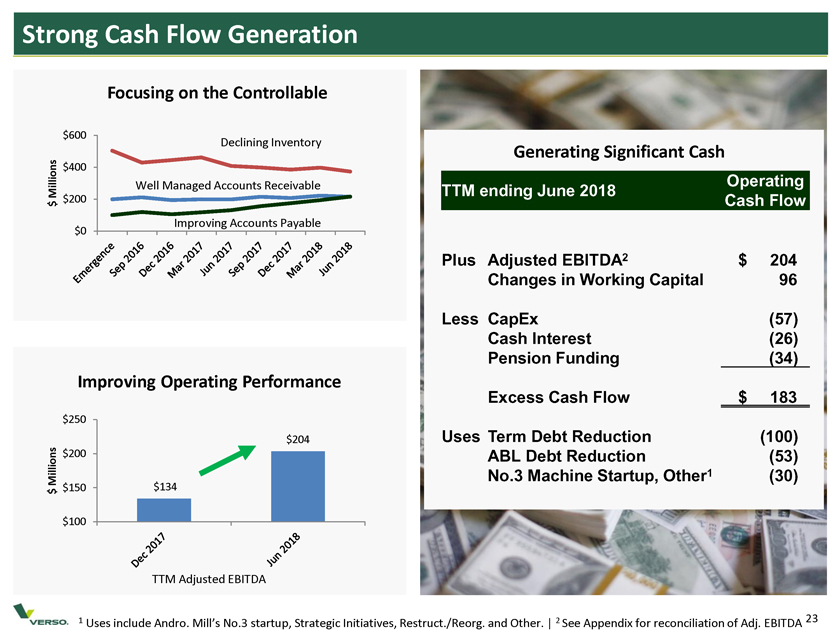
Strong Cash Flow Generation Focusing on the Controllable $600 Declining Inventory Generating Significant Cash $400 Well Managed Accounts Receivable Operating Millions TTM ending June 2018 $ $200 Cash Flow Improving Accounts Payable $0 Plus Adjusted EBITDA2 $ 204 Changes in Working Capital 96 Less CapEx (57) Cash Interest (26) Pension Funding (34) Improving Operating Performance Excess Cash Flow $ 183 $250 $204 Uses Term Debt Reduction (100) $200 ABL Debt Reduction (53) Millions No.3 Machine Startup, Other1 (30) $ $150 $134 $100 TTM Adjusted EBITDA 1 Uses include Andro. Mill’s No.3 startup, Strategic Initiatives, Restruct./Reorg. and Other. | 2 See Appendix for reconciliation of Adj. EBITDA 23
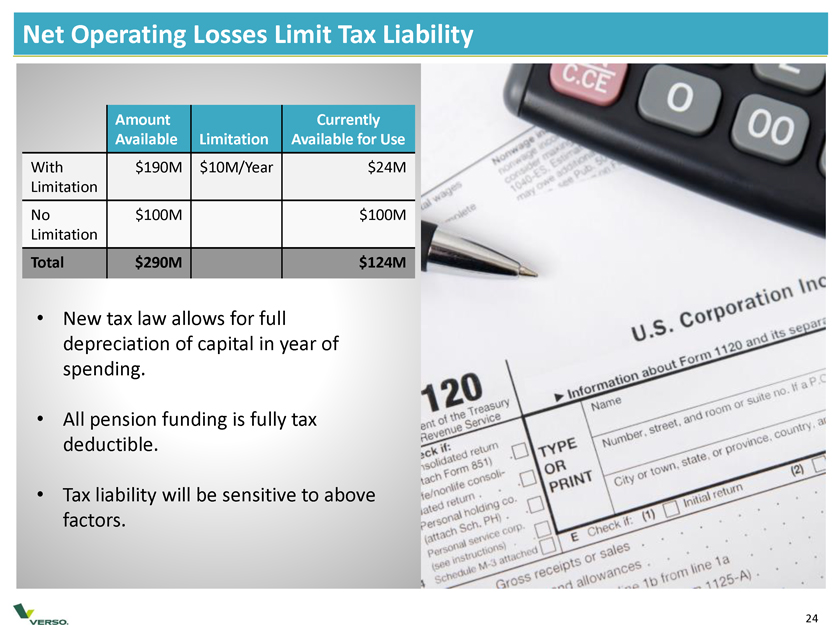
Net Operating Losses Limit Tax Liability Amount Currently Available Limitation Available for Use With $190M $10M/Year $24M Limitation No $100M $100M Limitation Total $290M $124M • New tax law allows for full depreciation of capital in year of spending. • All pension funding is fully tax deductible. • Tax liability will be sensitive to above factors. 24
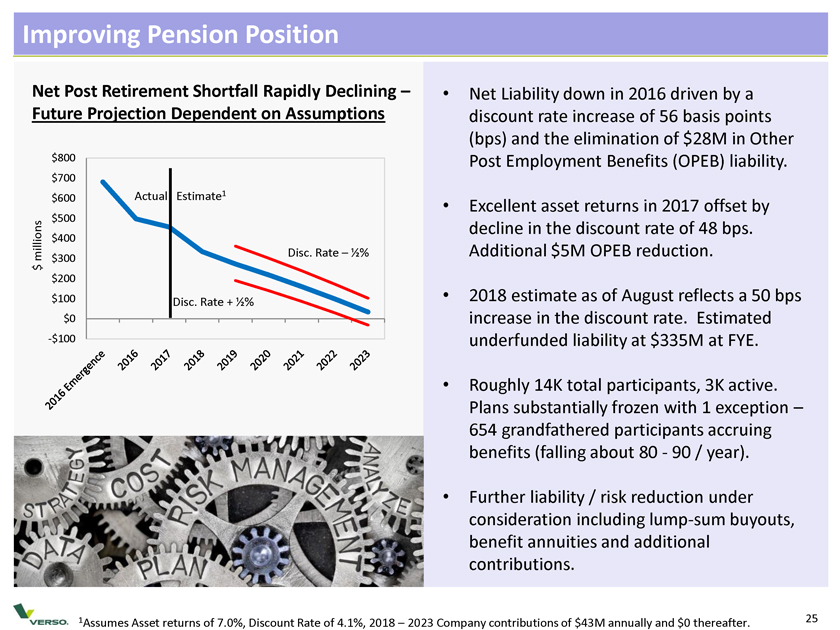
Improving Pension Position Net Post Retirement Shortfall Rapidly Declining – • Net Liability down in 2016 driven by a Future Projection Dependent on Assumptions discount rate increase of 56 basis points (bps) and the elimination of $28M in Other $800 Post Employment Benefits (OPEB) liability. $700 Actual Estimate1 $600 • Excellent asset returns in 2017 offset by $500 decline in the discount rate of 48 bps. $400 Additional $5M OPEB reduction. millions Disc. Rate – 1⁄2% $300 $ $200 $100 Disc. Rate + 1⁄2% • 2018 estimate as of August reflects a 50 bps $0 increase in the discount rate. Estimated -$100 underfunded liability at $335M at FYE. • Roughly 14K total participants, 3K active. Plans substantially frozen with 1 exception –654 grandfathered participants accruing benefits (falling about 80—90 / year). • Further liability / risk reduction under consideration including lump-sum buyouts, benefit annuities and additional contributions. 1 Assumes Asset returns of 7.0%, Discount Rate of 4.1%, 2018 – 2023 Company contributions of $43M annually and $0 thereafter. 25
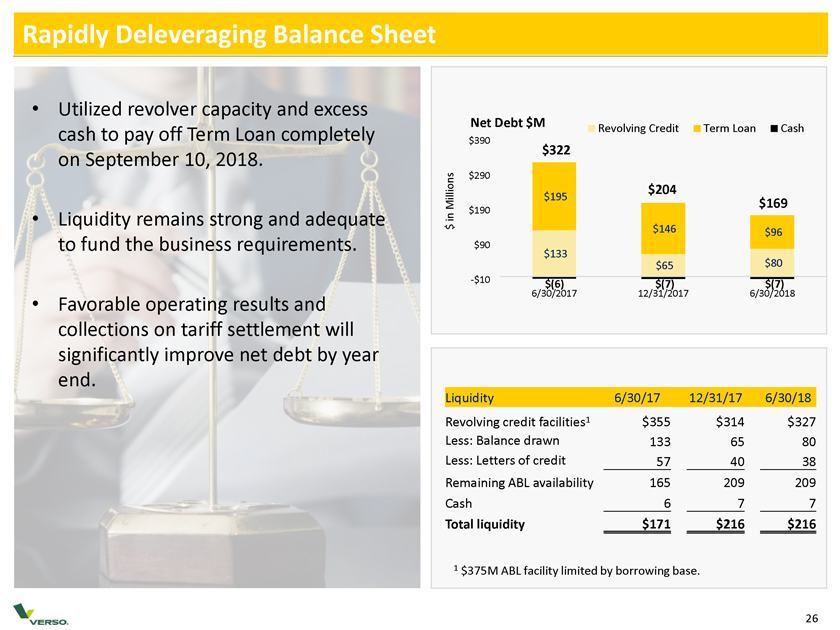
Rapidly Deleveraging Balance Sheet • Utilized revolver capacity and excess Net Debt $M cash to pay off Term Loan completely Revolving Credit Term Loan Cash $390 $322 on September 10, 2018. $290 millions $204 $195 M $169 in $190 • Liquidity remains strong and adequate $ $146 $96 to fund the business requirements. $90 $133 $65 $80 -$10 $(6) $(7) $(7) • 6/30/2017 12/31/2017 6/30/2018 Favorable operating results and collections on tariff settlement will significantly improve net debt by year end. Liquidity 6/30/17 12/31/17 6/30/18 Revolving credit facilities 1 $355 $314 $327 Less: Balance drawn 133 65 80 Less: Letters of credit 57 40 38 Remaining ABL availability 165 209 209 Cash 6 7 7 Total liquidity $171 $216 $216 1 $375M ABL facility limited by borrowing base. 26
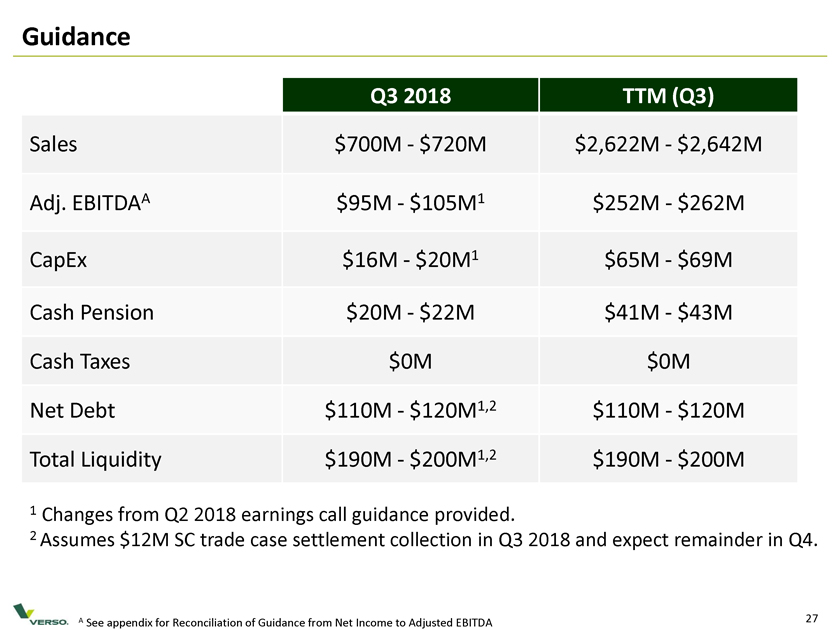
Guidance Q3 2018 TTM (Q3) Sales $700M—$720M $2,622M—$2,642M Adj. EBITDAA $95M—$105M1 $252M—$262M CapEx $16M—$20M1 $65M—$69M Cash Pension $20M—$22M $41M—$43M Cash Taxes $0M $0M Net Debt $110M—$120M1,2 $110M—$120M Total Liquidity $190M—$200M1,2 $190M—$200M 1 Changes from Q2 2018 earnings call guidance provided. 2 Assumes $12M SC trade case settlement collection in Q3 2018 and expect remainder in Q4. A See appendix for Reconciliation of Guidance from Net Income to Adjusted EBITDA 27
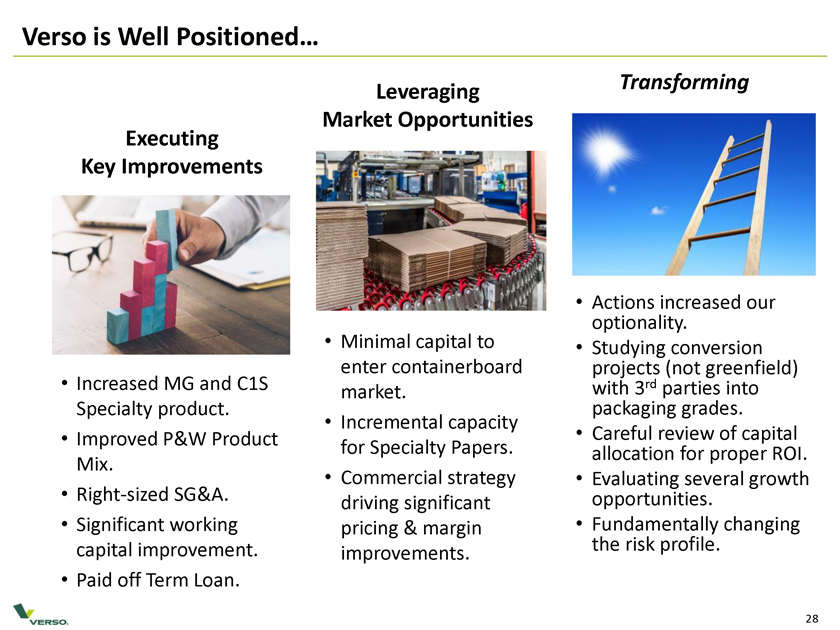
Verso is Well Positioned… Transforming Leveraging Market Opportunities Executing Key Improvements • Actions increased our optionality. • Minimal capital to • Studying conversion enter containerboard projects (not greenfield) • Increased MG and C1S market. with 3rd parties into Specialty product. packaging grades. • Incremental capacity • Improved P&W Product • Careful review of capital for Specialty Papers. allocation for proper ROI. Mix. • Commercial strategy • Evaluating several growth • Right-sized SG&A. opportunities. driving significant • Significant working pricing & margin • Fundamentally changing capital improvement. the risk profile. improvements. • Paid off Term Loan. 28
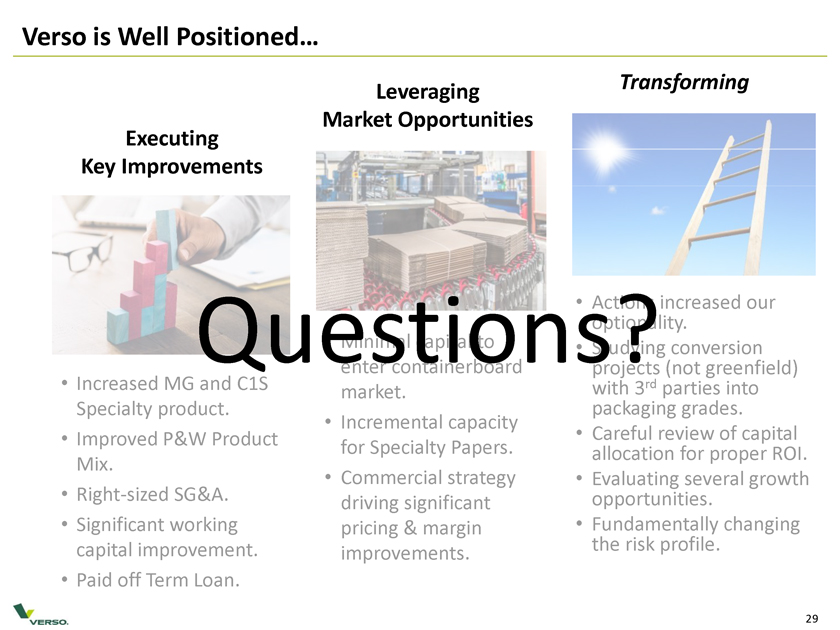
Verso is Well Positioned Executing Key Improvements Transforming Leveraging Market Opportunities • Action increased our conversion enter projects (not greenfield) Increased MG and C1S market. with 3rd parties into Specialty product. packaging grades. Incremental capacity Improved P&W Product Careful review of capital for Specialty Papers. allocation for proper ROI. Mix. Commercial strategy • Evaluating several growth Right-sized SG&A driving significant opportunities. Significant working pricing & margin • Fundamentally changing capital improvement. improvement the risk profile. Paid off Term Loan. 29

Appendix
EBITDA and Adjusted EBITDA Definitions EBITDA consists of earnings before interest, taxes, depreciation and amortization. Adjusted EBITDA reflects adjustments to EBITDA to eliminate the impact of certain items that we do not consider to be indicative of our ongoing performance. We use EBITDA and Adjusted EBITDA as a way of evaluating our performance relative to that of our peers and to assess compliance with our credit facilities. We believe that EBITDA and Adjusted EBITDA are non-GAAP operating performance measures commonly used in our industry that provide investors and analysts with measures of ongoing operating results unaffected by differences in capital structures, capital investment cycles, and ages of related assets among otherwise comparable companies. We believe that the supplemental adjustments applied in calculating Adjusted EBITDA are reasonable and appropriate to provide additional information to investors.
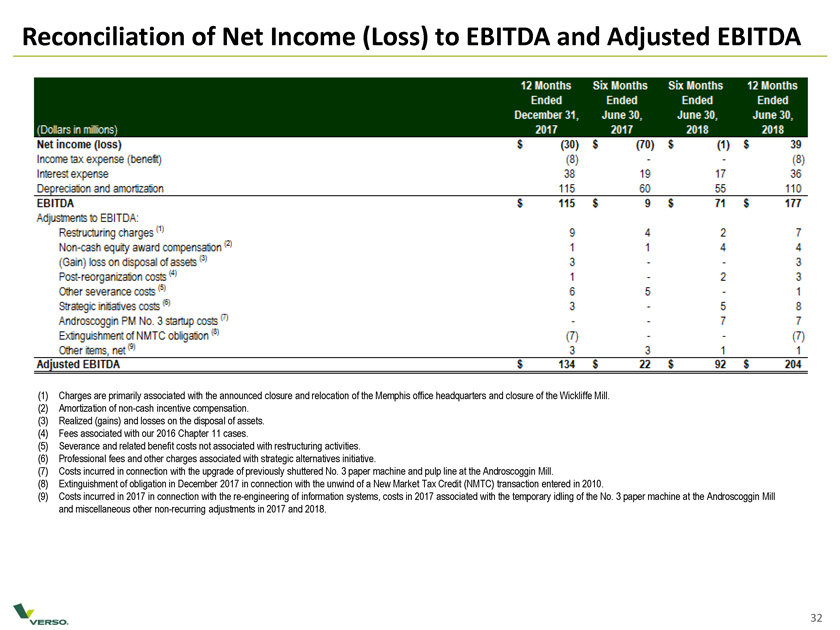
Reconciliation of Net Income (Loss) to EBITDA and Adjusted EBITDA Reconciliation of Net Income (Loss) to EBITDA and Adjusted EBITDA Net income (loss) $ (30} $ (70) $ (1) $ 39 Income tax expense {8} — [3] Interest expense 35 19 17 36 Depreciation and amortization 115 60 65 113 EBITDA $ 115 $ 9 $ 71 $ 177 Adjustments :o EBITDA: Restructuring charges ‘ 9 4 2 7 Non-cash equity award compensation H 114 4 [Gain] loss on disposal of assets® 3 — 3 Post-reorg an costs 1-23 severance costs H 5 5-1 Strategic initiatives costs 3—5 S Androscoggin PM No. 3 costs’ Exiting of NWTC (7) — (7) 19* 3 3 11 Adjusted EBITDA $ 134 $ 22 $ 92 $ 204(1) Charges are primarily associated with the announced closure and relocation of the Memphis office headquarters and closure of the Wickliffe Mill. (2) Amortization of non-cash incentive compensation. (3) Realized (gains) and losses on the disposal of assets. (4) Fees associated with our 2016 Chapter 11 cases. (5) Severance and related benefit costs not associated with restructuring activities. (6) Professional fees and other charges associated with strategic alternatives initiative. (7) Costs incurred in connection with the upgrade of previously shuttered No. 3 paper machine and pulp line at the Androscoggin Mill. (8) Extinguishment of obligation in December 2017 in connection with the unwind of a New Market Tax Credit (NMTC) transaction entered in 2010. (9) Costs incurred in 2017 in connection with the re-engineering of information systems, costs in 2017 associated with the temporary idling of the No. 3 paper machine at the Androscoggin Mill and miscellaneous other non-recurring adjustments in 2017 and 2018.
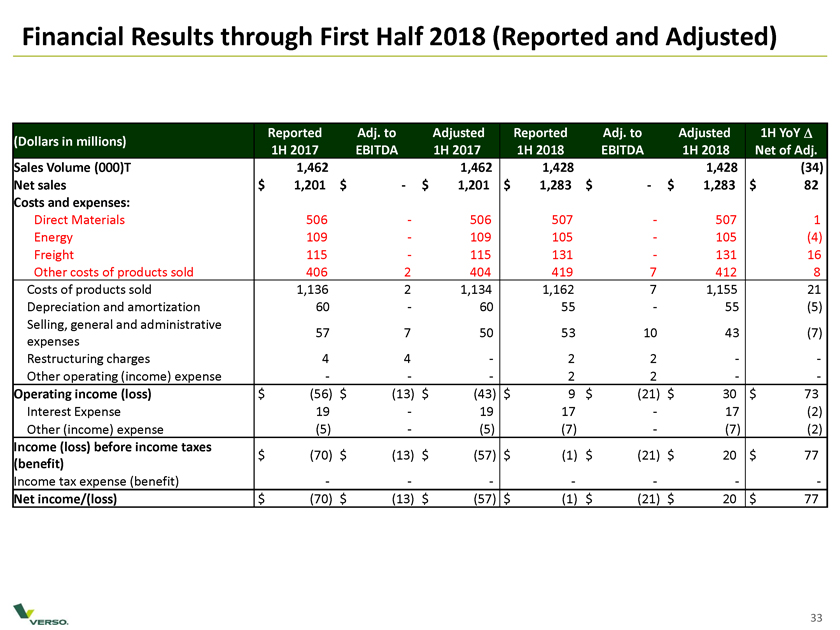
Financial Results through First Half 2018 (Reported and Adjusted) Reported Adj. to Adjusted Reported Adj. to Adjusted 1H YoY D (Dollars in millions) 1H 2017 EBITDA 1H 2017 1H 2018 EBITDA 1H 2018 Net of Adj. Sales Volume (000)T 1,462 1,462 1,428 1,428 (34) Net sales $ 1,201 $ —$ 1,201 $ 1,283 $ —$ 1,283 $ 82 Costs and expenses: Direct Materials 506—506 507—507 1 Energy 109—109 105—105 (4) Freight 115—115 131—131 16 Other costs of products sold 406 2 404 419 7 412 8 Costs of products sold 1,136 2 1,134 1,162 7 1,155 21 Depreciation and amortization 60—60 55—55 (5) Selling, general and administrative 57 7 50 53 10 43 (7) expenses Restructuring charges 4 4—2 2 —Other operating (income) expense ——2 2 — Operating income (loss) $ (56) $ (13) $ (43) $ 9 $ (21) $ 30 $ 73 Interest Expense 19—19 17—17 (2) Other (income) expense (5)—(5) (7)—(7) (2) Income (loss) before income taxes $ (70) $ (13) $ (57) $ (1) $ (21) $ 20 $ 77 (benefit) Income tax expense (benefit) — — ——Net income/(loss) $ (70) $ (13) $ (57) $ (1) $ (21) $ 20 $ 77
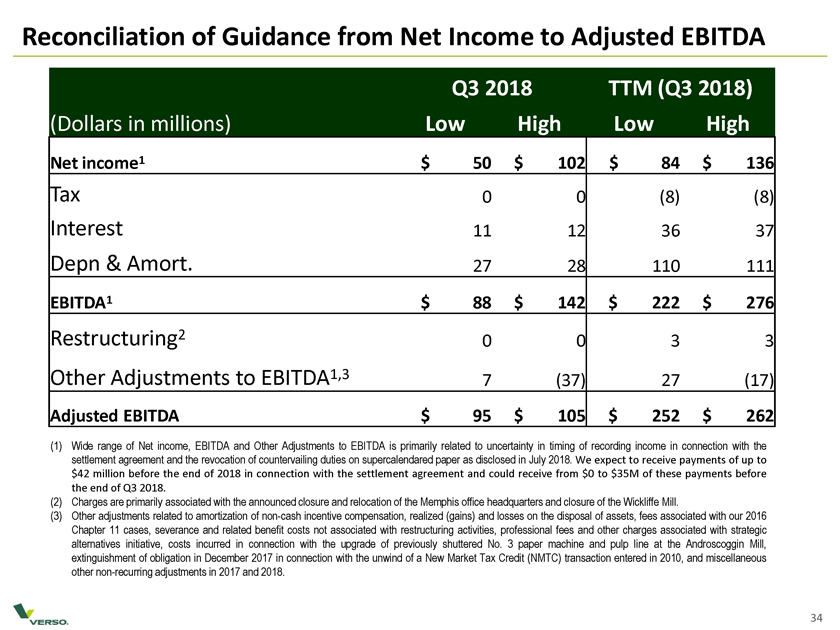
Reconciliation of Guidance from Net Income to Adjusted EBITDA Q3 2018 TTM (Q3 2018) (Dollars in millions) Low High Low High Net income1 $ 50 $ 102 $ 84 $ 136 Tax 0 0 (8) (8) Interest 11 12 36 37 Depn & Amort. 27 28 110 111 EBITDA 1 $ 88 $ 142 $ 222 $ 276 Restructuring2 0 0 3 3 Other Adjustments to EBITDA1,3 7 (37) 27 (17) Adjusted EBITDA $ 95 $ 105 $ 252 $ 262 (1) Wide range of Net income, EBITDA and Other Adjustments to EBITDA is primarily related to uncertainty in timing of recording income in connection with the settlement agreement and the revocation of countervailing duties on supercalendared paper as disclosed in July 2018. We expect to receive payments of up to $42 million before the end of 2018 in connection with the settlement agreement and could receive from $0 to $35M of these payments before the end of Q3 2018. (2) Charges are primarily associated with the announced closure and relocation of the Memphis office headquarters and closure of the Wickliffe Mill. (3) Other adjustments related to amortization of non-cash incentive compensation, realized (gains) and losses on the disposal of assets, fees associated with our 2016 Chapter 11 cases, severance and related benefit costs not associated with restructuring activities, professional fees and other charges associated with strategic alternatives initiative, costs incurred in connection with the upgrade of previously shuttered No. 3 paper machine and pulp line at the Androscoggin Mill, extinguishment of obligation in December 2017 in connection with the unwind of a New Market Tax Credit (NMTC) transaction entered in 2010, and miscellaneous other non-recurring adjustments in 2017 and 2018.